Article

Enzyme-Assisted Ultrasonic Extraction of Total Flavonoids from Acanthopanax senticosus and Their Enrichment and Antioxidant Properties

College of Agronomy, Liaocheng University, Liaocheng 252000, China
*
Authors to whom correspondence should be addressed.
Processes 2021, 9(10), 1708; https://doi.org/10.3390/pr9101708
Submission received: 11 August 2021 / Revised: 30 August 2021 / Accepted: 19 September 2021 / Published: 23 September 2021
(This article belongs to the Section Chemical Processes and Systems)

Abstract

:
Flavonoids are one of the important active ingredients from Acanthopanax senticosus, with a variety of biological functions, such as antioxidant and antibacterial properties. The aim of this work was to investigate enzyme-assisted ultrasonic extraction of A. senticosus flavonoids and their enrichment and antioxidant properties. We found that the optimal extraction process after Box–Behnken response surface optimization had the following parameters: a 3:2 ratio of cellulase to pectinase, enzyme mixture amount of 6960 U g−1, enzyme treatment time of 59.80 min; temperature of 53.70 °C, and pH value of 6.05. The yield of total flavonoids reached 36.95 ± 0.05 mg g−1. The results for different polar solvent enrichments showed that the highest flavonoid (61.0 ± 0.344 mg g−1), polyphenol (24.93 ± 0.234 mg g−1), and saponin (17.80 ± 0.586 mg g−1) contents were observed in the 1-butanol fraction, and the highest polysaccharide content (20.04 ± 0.783 mg g−1) was in the water fraction. Pearson correlation analysis revealed that the antioxidant potential of the extract was related to the higher amount of flavonoids and phenolics in the extract. We thus found an effective A. senticosus flavonoid extraction and enrichment procedure, which can serve as a reference method.

1. Introduction

Acanthopanax senticosus (Rupr. et Maxim.), previously classified as Eleutherococcus senticosus, which is commonly known as Ciwujia, is a perennial deciduous shrub of the genus Acanthopanax in the family Acanthopanax [1], and its dried root and rhizome or stem are used as medicines in Chinese traditional medicine [2]. In traditional Chinese medicine, A. senticosus has been used to nourish Qi to invigorate the spleen and can tonify the kidney to tranquilize the mind [3]. It is mainly distributed in northeast China, Hebei, and Shanxi [4]. The main active ingredients of A. senticosus include glycosides [5], flavonoids [6], polysaccharides [7], and organic acids [8], which have anti-fatigue [9], immunomodulatory [10], and antioxidant properties [11]. It has been shown that flavonoids are naturally synthesized polyphenols and play an important role in physiological functions, and they are often used as antioxidants and free radical scavengers to enhance immunity for better health and disease prevention [12]. Total flavonoids from A. senticosus have a variety of pharmacological activities and thus are important pharmacodynamic materials [13].
The collection of medicinal parts of A. senticosus has caused damage to the A. senticosus resources, which caused a reduction in the number of wild A. senticosus. The A. senticosus plant has been cultivated, but because its growth cycle is shorter than the wild plant, and fertilizers and pesticides are used, all of which have caused the decline of its quality. Due to large number of clinical uses and few wild sources of A. senticosus, one of the ways to solve the shortage of this herb is using modern extraction methods to improve its utilization efficiency [14]. Traditional hot water extraction or ethanol reflux cannot sufficiently release the active ingredients, and these methods also have low extraction yields, low efficiencies, and a poor extraction quality. Modern extraction methods include ultrasound-assisted, microwave-assisted, ultra-high-pressure-assisted, and complex enzyme-assisted extraction, and their advantages are rapidity, high extraction efficiency, low temperature (preventing destruction of active ingredients), and easy operation [15].
Enzyme-assisted extraction is an efficient and sustainable extraction technique, suitable for extracting bioactive substances from materials with a high cellulose content, such as plant roots. A. senticosus flavonoids are found mainly in the xylem, from which cellulases, hemi-cellulases, and pectinases can effectively promote the release of active ingredients [16]. After extraction, the manner in which A. senticosus flavonoids are purified and enriched is key for further use of the extract. Solvent extraction is a common choice for the purification and enrichment of bioactive ingredients. According to the principle of “like dissolves like”, each bioactive element is enriched in a solvent of corresponding polarity [17].
The aim of this study was to optimize the extraction process of total flavonoids from A. senticosus using the Box–Behnken response surface method with enzyme-assisted ultrasonic extraction, and to enrich and purify the flavonoids by extraction using solvents with different polarities. In addition, the contents and antioxidant properties of their active ingredients were analyzed. This study provides a reference for the extraction and separation of total flavonoids from A. senticosus.

2. Materials and Methods

2.1. Plant Materials, Chemicals, and Reagents

The decoction pieces of A. senticosus were purchased from the local pharmacy, then they were dried at 60 °C in an oven to constant weight. The dried herb was ground using a pulverizer and sieved with a 60-mesh sieve. The powder was stored in a refrigerator at 4 °C for a subsequent test.
The citric acid, ethanol, ascorbic acid (vitamin C), cellulase (100,000 U g−1), and pectinase (50,000 U g−1) were purchased from Sinopharm Chemical Reagent (Shanghai, China). Rutin, gallic acid, and ginsenoside standards were purchased from Aladdin Biological Reagent (Shanghai, China). Folin’s reagent was purchased from Solarbio Biological Reagent (Beijing, China). 1-Butanol, ethyl acetate, 2,2-diphenyl-1-picrylhydrazyl (DPPH), 2,2′-azino-bis(3-ethylbenzothiazoline-6-sulfonic acid (ABTS), petroleum ether, glucose, vanillin, and phenol were purchased from McLaren Reagent (Shanghai, China). Double distilled water was prepared in the laboratory. All reagents were analytically pure.

2.2. Methods

2.2.1. Extraction Process

Two grams of dry powder of A. senticosus were put into an Erlenmeyer flask with a stopper, and then an appropriate amount of citric acid–sodium citrate buffer (pH 5.0) and a specified amount of enzyme were added consecutively. After the enzymatic hydrolysis at an appropriate temperature, the enzymes were inactivated in a water bath at 95 °C for 5 min. After filtering with gauze, the filtrate was removed and the filter residue was collected for the next experiment. Ethanol (50%) was added to the residue as the extraction solvent, and flavonoids were extracted with the ultrasonic extraction method. The conditions of ultrasonic-assisted extraction consisted of the ratio of liquid to solid of 20 mL g−1, extraction time of 55 min, ultrasonic power of 300 W, extraction temperature of 55 °C, and ultrasonic frequency of 40 Hz. After the extraction, the extracts were cooled, filtered, and centrifuged at 10,000 r min−1 for 5 min, and the supernatant was harvested for determination of the total flavonoid content.

2.2.2. Determination of the total flavonoid yield

The flavonoid content was determined by spectrophotometry using the NaNO2–Al(NO3)3–NaOH system, as described by Chang [18]. A standard curve was plotted using rutin as a standard. The yield of total flavonoids (Y) was calculated according to the formula
Y = C × N × V M ,
where C is the concentration of total flavonoids, V is the volume of the extract determined, N is the dilution ratio of the extract, and M is the weight of the sample raw material.

2.2.3. Optimization of the Extraction Rate of A. senticosus Flavonoids by Single-Factor Experiments

(1)
Optimization of the Amount of Cellulase
In this study, 2.0 g powder of A. senticosus was mixed with citric acid amount of cellulase formulated. The yield temperature of 55 solid of 20 mL with the ultrasonic extraction method. The filtrate was removed and the filter residue was collected, and stored in the refrigerator at 4°C. Each bioactive element is filtered for 50 min, enzyme treatment temperature of 50 °C, and enzyme treatment pH value of 5.0. The amount of cellulase was investigated with 3000, 6000, 9000, 12,000, and 15,000 U g−w, respectively. After enzymolysis, the flavonoids of A. senticosus were extracted according to the procedure in Section 2.2.1.
(2)
Optimization of the Amount of Pectinase
The amount of pectinase was optimized according to the procedure in(1). The amount of pectinase was chosen as 100, 500, 1500, 3000, and 6000 U g−h, respectively.
(3)
Optimization of the Ratio of the Enzymes in Mixture
The total amount of the enzymes in mixture was fixed at 9000 U g−h according to the results of (1) and (2). The ratio of cellulase to pectinase (1:1, 2:1, 1:2, 2:3, and 3:2) was tested. The enzymatic hydrolysis conditions were carried out according to the procedure in (1).
(4)
Optimization of Amount of the Enzymes in Mixture
The ratio of cellulase to pectinase was 3:2. The amount of enzyme in the mixture was tested with 1000, 3000, 5000, 7000, and 9000 U g−0, respectively. The enzymatic hydrolysis conditions were carried out according to the procedure in (1).
(5)
Optimization of Other Factors
The amount and ratio of enzymes in mixture was fixed according to the results of (3) and (4). The enzyme treatment time (45, 50, 55, 60, and 65 min), the enzyme treatment temperature (40, 45, 50, 55, and 60 °C), and the enzyme treatment pH value (5, 5.8, 6, 6.2, and 6.6) were investigated. The enzyme treatment conditions were changed by only changing one of the three factors at a time and the other two factors remaining fixed. The enzymatic hydrolysis conditions were carried out according to the procedure in (1).

2.2.4. Optimization by the Response Surface Method

After determining the preliminary range of the independent variables through single-factor tests, response surface methodology (RSM) using the Box–Behnken design (BBD) with four factors at three levels was designed, following the method of Chen, and then carried out [19,20]. The amount of complex enzyme, the enzyme treatment time, the enzyme treatment temperature, and the enzyme treatment pH value were used as the independent variables, while the dependent variable was the extraction yield of flavonoids. These are shown in Table 1.

2.2.5. Enrichment of Flavonoids

(1)
Enrichment of Flavonoids by Solvents of Different Polarities
The total flavonoids of A. senticosus were extracted under the optimized conditions via enzyme-assisted ultrasonic extraction, and the extract was concentrated in a rotary evaporator (RE-5205A, Yarong, China) under reduced pressure and freeze-dried (LYO-2, Shanghai, China). The 6.3 g of dry extract was then suspended in 200 mL of double distilled water, followed by successive extraction with 200 mL of different kinds of solvent, including petroleum ether, chloroform, ethyl acetate, and 1-butanol, and then the remaining soluble fraction was used as the aqueous phase. It was extracted twice for each solvent of different polarity. Each fraction was concentrated, freeze-dried, and stored for further analyses.
(2)
Determination of the Active Ingredient Content
The fractions of different polarities were accurately weighed and dissolved in 70% ethanol. The content of polyphenol was determined by the Folin–Ciocalteu method described by Pham [21], with gallic acid as the standard. The content of flavonoids was determined by the NaNO2–Al(NO3)3–NaOH method, with rutin as the standard. The content of saponin was determined by the vanillin-sulfuric acid chromogenic method described by Hadidi [22], with ginsenosides as the standard. The content of polysaccharides was determined by the phenol-sulfuric acid chromogenic method described by Dubois [23], with glucose as the standard. The yield of active ingredients in the fractions of different polarities was calculated.
(3)
Radical Scavenging Activity Assays
Determination of the antioxidant properties of the extraction fractions of solvents with different polarities with already established protocols—including the abilities to scavenge the DPPH radical [24], ABTS radical [25], hydroxyl radical [26], and superoxide anion radical [27]—has been described in previous reports, with Vitamin C (Vc) as a standard control.
(4)
Pearson Correlation Studies
Pearson correlation analysis was usually used to analyze the relationship between different dates [28]. The total flavonoid, polyphenol, saponin, and polysaccharide contents and the in vitro antioxidant activities (against the DPPH free radical, ABTS free radical, hydroxyl radicals, and superoxide anion radicals) of petroleum-ether-, chloroform-, ethyl-acetate-, 1-butanol-, and water-soluble fractions from the crude extract of A. senticosus were evaluated and correlated with one another using the Pearson correlation method.

2.3. Statistical Analysis

Design-Expert 8.0.6 software was used for the Box–Behnken experimental design, and GraphPad 8.0 software was used for one-way analysis of variance (ANOVA) and graphing. Pearson correlation analysis was performed with SPSS 22 software(SPSS Inc., Chicago, IL, USA). Each experiment was performed in triplicate, and the experimental results are expressed as mean ± standard deviation.

3. Results

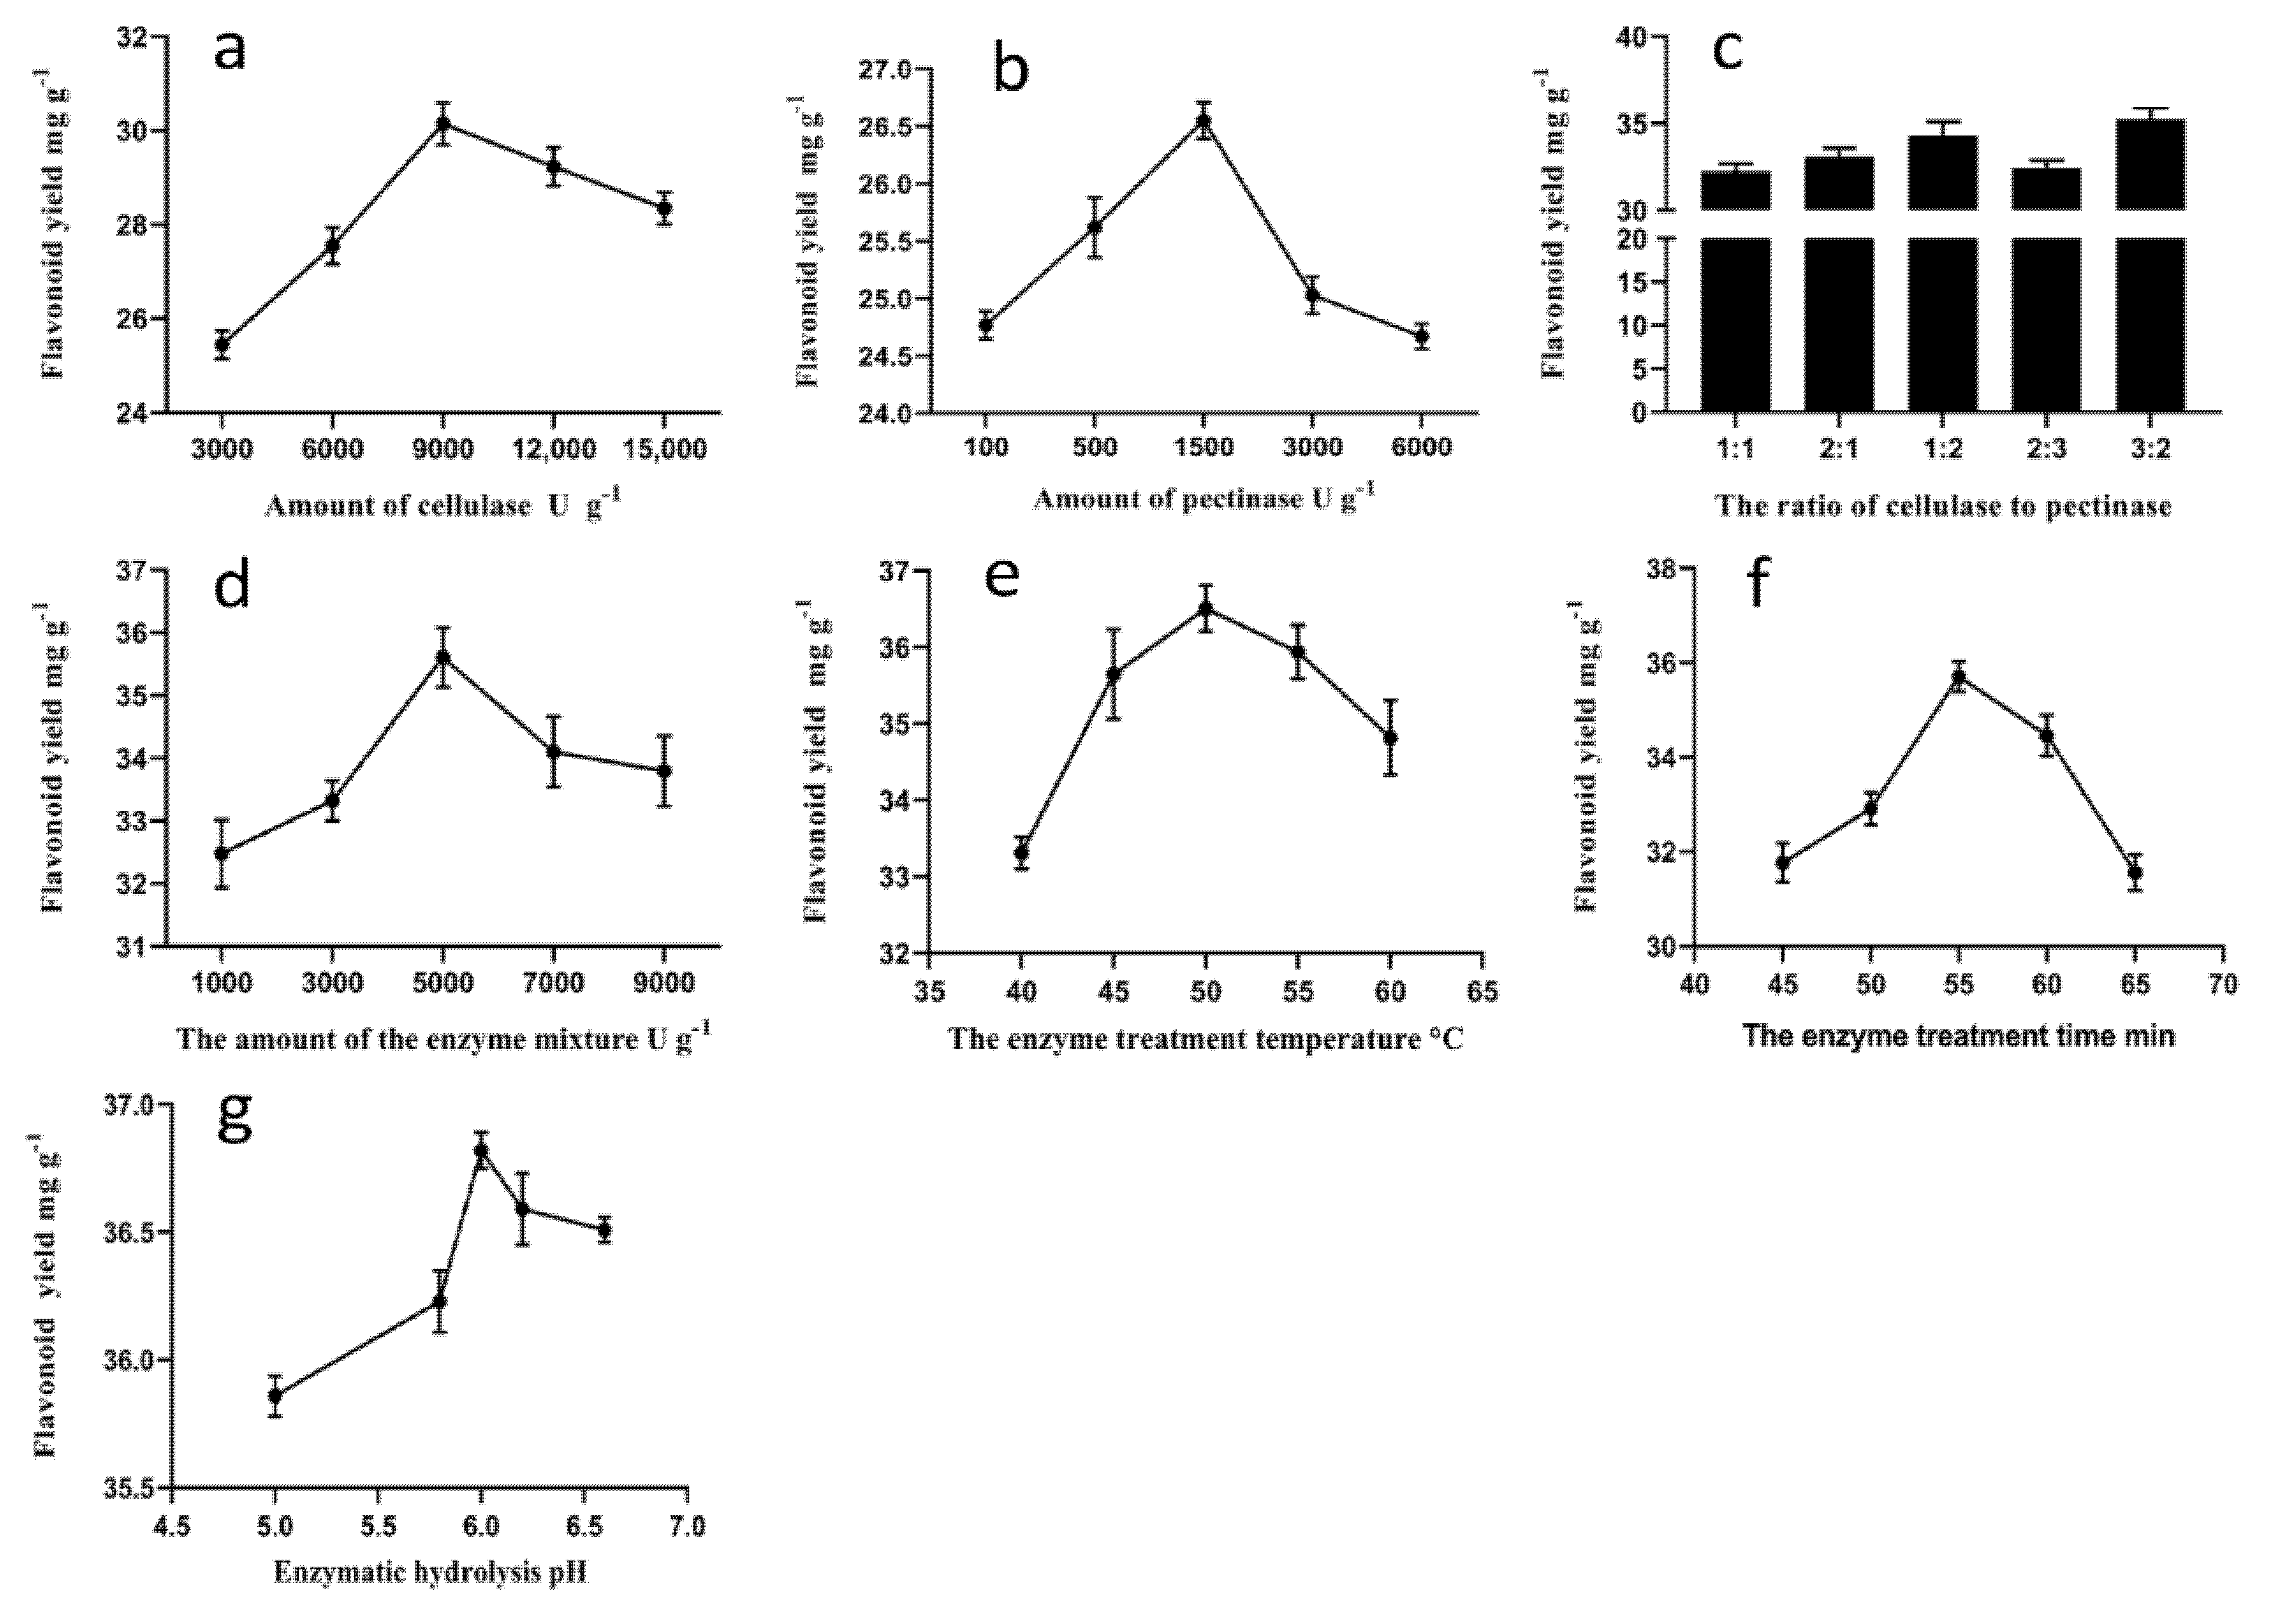
3.1. Single-Factor Experiments

3.1.1. Effect of the Amount of Cellulase on the Flavonoid Yield

When we increased the amount of cellulase from 3000 to 9000 U g−1, the total flavonoid content increased rapidly and reached a maximum of 30.15 mg g−1 (Figure 1a). However, when it exceeded 9000 U g−1, the total flavonoid content showed a decreasing trend. In the early stage, with the increase in the cellulase amount, the contact area between the enzyme and substrate increased, which accelerated the rate of enzymatic cell wall degradation and thus facilitated the release of flavonoids. We suppose that in the later stage, when the enzyme amount continued to increase, the dissolution of impurity components, such as polysaccharide, protein, and so on, also increased, which was not conducive to the dissolution of flavonoids and reduced the flavonoid content in the solution [29].

3.1.2. Effect of the Amount of Pectinase on the Flavonoid Yield

When the amount of pectinase increased from 100 to 1500 U g−1, the total flavonoid content increased rapidly and reached a maximum of 26.55 mg g−1, but it showed a decreasing trend when it exceeded 1500 U g−1 (Figure 1b). These changes were consistent with the effect of cellulase on the total flavonoid content.

3.1.3. Effect of the Ratio of the Enzymes in Mixture on the Flavonoid Yield

Enzyme mixtures play a considerable role in hydrolysis due to differences in the substrates and proportions of their components. Pectinases decompose pectin and disintegrate the intercellular layer of the plant cell walls, while cellulases act on the cellulose layer outside the plant cells. A mixture of enzymes can fully hydrolyze the cell wall. Therefore, an appropriate ratio of the two enzymes was necessary to completely disrupt the cell structure to improve the extraction efficiency. The effect of various cellulase to pectinase ratios (1:1, 2:1, 1:2, 2:3, and 3:2) were investigated (Figure 1c), and the total flavonoid yield reached a relatively high maximum of 35.25 mg g−1 at the ratio of 3:2, which we chose for all the following experiments.

3.1.4. Effect of the Amount of the Enzymes on Flavonoid Yield

When we increased the amount of the enzyme mixture from 1000 to 5000 U g−1, the total flavonoid yield increased rapidly and reached a maximum of 35.61 mg g−1 at 5000 U g−1 (Figure 1d). However, when the amount of the enzymes exceeded 5000 U g−1, the total flavonoid yield showed a decreasing trend. A possible reason is that in the early stage, with an increased amount of enzyme, the cell wall was degraded more efficiently, thereby promoting the release of flavonoids. However, when the amount of enzyme was too high, the enzyme reaction would reach equilibrium and not continue to increase enzymatic hydrolysis, the flavonoid yield would stop increasing and start to decline. Therefore, we chose 5000 U g−1 as the optimal amount of the enzyme mixture for this study.

3.1.5. Effect of the Enzyme Treatment Time on the Flavonoid Yield

When the enzyme treatment time increased from 45 to 55 min, the total flavonoid yield increased rapidly to the maximum of 35.71 mg g−1 (Figure 1e). However, when the enzyme treatment time exceeded 55 min, the total flavonoid yield showed a decreasing trend. In the early stage, the enzymatic hydrolysis reaction was active, and extraction of the total flavonoids was promoted. When the enzyme treatment time exceeded 55 min, the flavonoids were probably destroyed and the total flavonoid yield was reduced. Therefore, we chose 55 min as the optimal enzyme treatment time for all the following experiments.

3.1.6. Effect of the Enzyme Treatment Temperature on the Flavonoid Yield

When the enzyme treatment temperature increased from 40 to 50 °C, the total flavonoid yield increased rapidly and reached a maximum of 36.51 mg g−1 (Figure 1f). However, when the enzyme treatment temperature exceeded 50 °C, the total flavonoid yield showed a decreasing trend. Along with the increase in temperature, the enzyme activity also increased at the beginning. When the temperature exceeded 50 °C, the enzyme activity decreased or the enzyme even became inactivated, thus the total flavonoid extraction rate decreased [30]. Therefore, we chose 50 °C as the optimal enzyme treatment temperature for this study.

3.1.7. Effect of pH on the Flavonoid Yield

When the pH of the enzymatic hydrolysis reaction increased from 5 to 6, the total flavonoid yield increased rapidly and reached a maximum of 36.82 mg g−1 (Figure 1g). However, when the pH exceeded 6, the total flavonoid yield showed a decreasing trend. Each enzyme has its own optimal pH value, because changes in pH affect the spatial structure of the enzyme’s molecule and alter its conformation and activity [31,32]. The activity of our mixture of cellulase and pectinase was the highest at pH 6, which was thus chosen as the optimal pH.

3.2. Analysis of the Response Surfaces

Response surface assay is a method based on mathematics and statistics to obtain the best test procedure through the least number of tests. The response surface test was designed and the data were processed with Design-Expert 8.0.6 software(Trial version, Stat-Ease, Inc, Minneapolis, USA) to obtain the variance analysis of the regression model (Table 2). After quadratic polynomial fitting with nonlinear regression, the obtained prediction model was as follows:
Y = 36.69 + 0.41A + 0.37B + 0.072C + 0.066D + 0.095AB + 0.17AC − 0.12AD +
0.16BC + 0.045BD + 0.065CD − 0.51A2 − 0.50B2 − 0.32C2,
where Y is the flavonoid yield, A is the amount of enzyme mixture, B is the enzyme treatment time, C is the enzyme treatment temperature, D is the enzyme treatment pH; A2, B2, C2, and D2 are the quadratic factors of A, B, C, and D; and AB, AC, AD, BC, BD, and CD are interaction factors of between A, B, C, and D.
As shown in Table 3, a mathematical model was established for this experiment (p < 0.0001), and the lack of fit was not significant (p > 0.05). In addition, the corrected coefficient of determination (R2) was 0.9239, indicating that 92.39% of the total flavonoid content could be explained by this model. The determination coefficient (R2) of the equation was 0.9620, indicating that the equation based on changes in the total flavonoid yield fitted the experiment well. The effects of each variable on the total flavonoid yield were as follows: the independent variables A and B and the quadratic factors A2, B2, C2, and D2 had significant effects on the yield of total A. senticosus flavonoids (p < 0.01); the interaction factors AC and BC showed significant effects on the content of total flavonoids (p < 0.05); the independent variables C and D and the interaction factors AB, AD, BD, and CD showed no significant effect on the total flavonoid yield (p > 0.05). The F-value of the model was positively correlated with the response value. The larger the F-value, the greater the response value. The relative effects of each factor on the total flavonoid yield were as follows: A > B > C > D.
The influence of various factors could be assessed by the response surface, where the steeper the surface, the greater the influence [33]. The effect of the four factors on the total A. senticosus flavonoid yield is shown in Figure 2. Interaction of enzyme quantity and temperature were significant (p < 0.05) and interaction of enzyme treatment time and temperature were significant (p < 0.05). Interaction of enzyme quantity and treatment time were not significant (p > 0.05), Interaction of enzyme quantity and pH were not significant (p > 0.05), interaction of enzyme treatment time and pH were not significant (p > 0.05), Interaction of temperature and pH were not significant (p > 0.05). According to the quadratic multiple regression equation of the total flavonoids yield, the optimal extraction conditions were as follows: the amount of complex enzyme of 6960 U g−1, the enzyme treatment time of 59.80 min, the temperature of 53.70 °C, and the pH value of 6.05. Under the conditions above, the theoretical total flavonoid yield was 36.90 mg g−1.
After three replicate experiments under these conditions, we obtained the mean value of the total flavonoid yield of 36.95 ± 0.05 mg g−1. The relative error associated with the model prediction was small, indicating that the model fitted well, and the reliability of the model was validated.

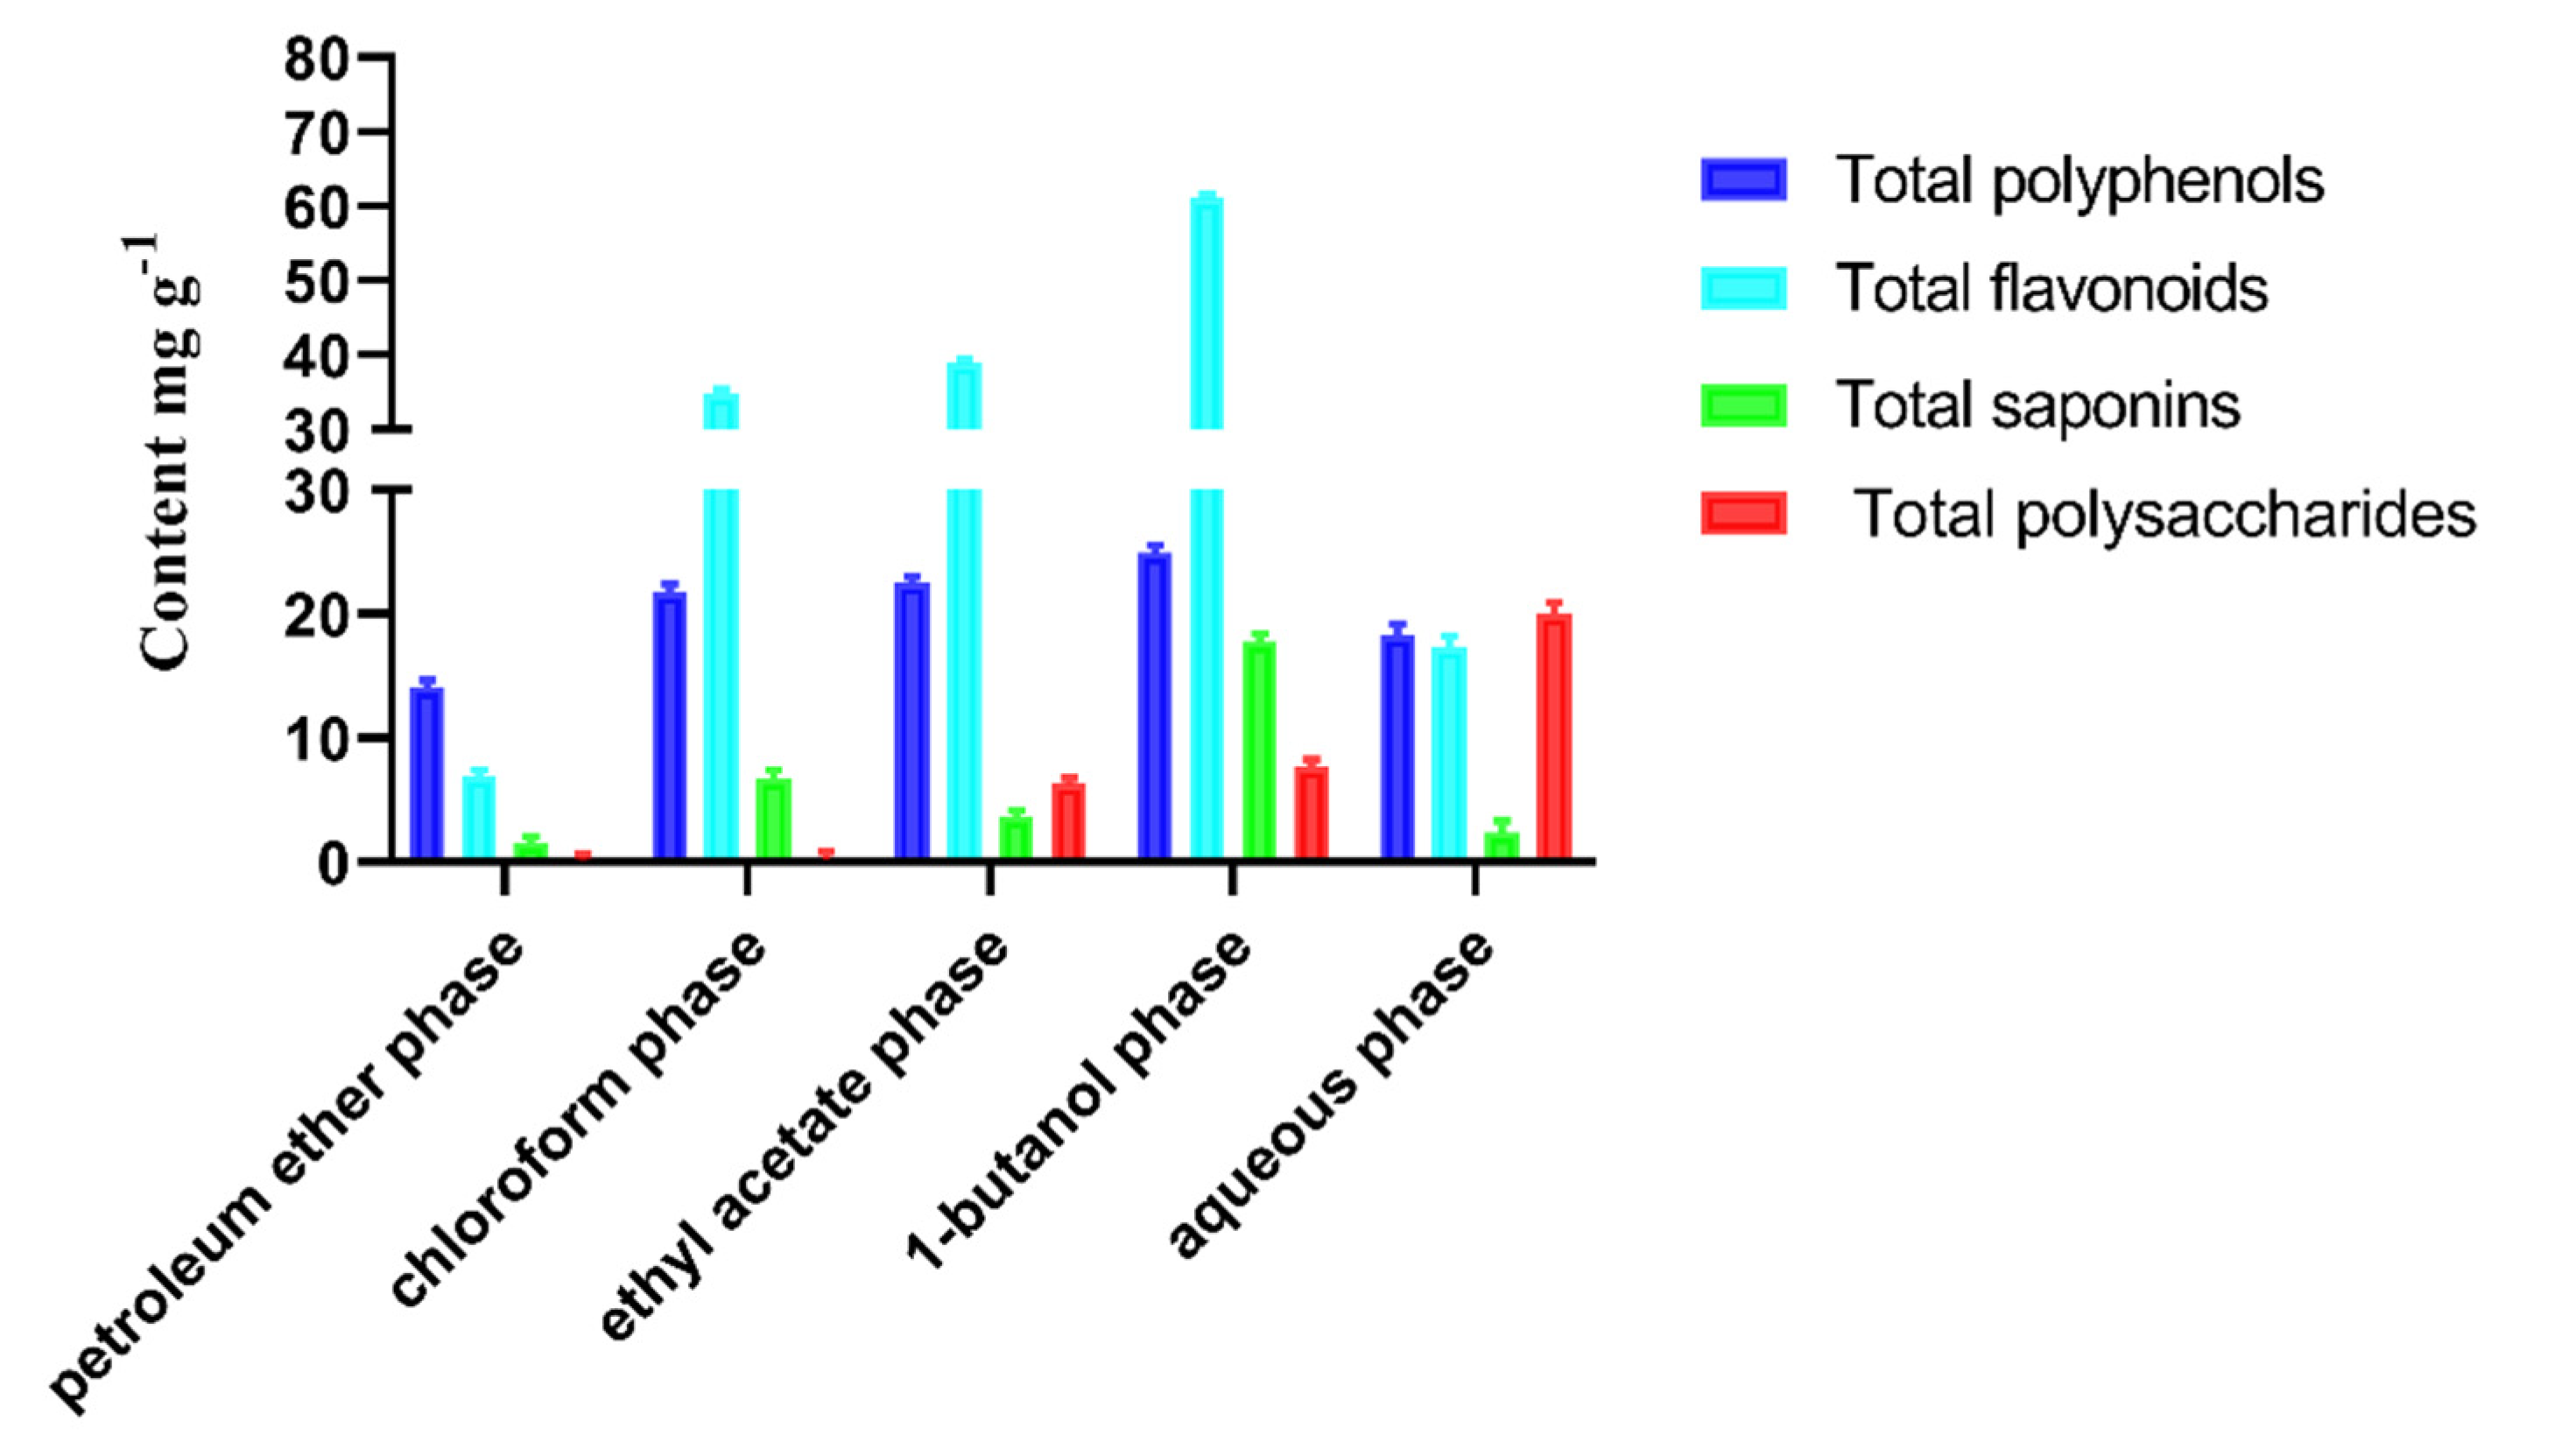
3.3. Enrichment and Antioxidant Properties Test of A. senticosus Flavonoids

3.3.1. Determination of the Active Ingredients in the Different Extraction Phases

Water was added to the A. senticosus extract for suspension, followed by extraction successively with petroleum ether, chloroform, ethyl acetate, and 1-butanol, and the A. senticosus extract was extracted twice for each solvent. After concentration and drying, we harvested 0.441 g of the extract from the petroleum ether phase, 0.61 g from the chloroform phase, 0.656 g from the ethyl acetate phase, 0.921 g from the 1-butanol phase, and 2.174 g from the aqueous phase. The highest extraction yield was thus obtained with water, followed by 1-butanol and then the ethyl acetate, while the petroleum ether was the solvent with the lowest yield. Due to the differences in solvent polarizability, active ingredients experience various numbers of specific interactions with polar solvents, resulting in polarity-dependent changes in the extraction yield.
In the present study, the total bioactive contents of the fractions of different polarities were investigated. The total flavonoid, polyphenol, saponin, and polysaccharide contents of these five extracts were determined. The 1-butanol fraction of the A. senticosus crude extract contained a significantly higher concentration of polyphenols, flavonoids, and saponins. The water fraction of the A. senticosus crude extract contained a significantly higher amount of polysaccharides, while it contained the lowest amount of polyphenols, saponins, and flavonoids. Furthermore, the ethyl acetate phase also showed the second highest flavonoid, polyphenol, and polysaccharide contents.
The highest yield of total flavonoids (in the 1-butanol phase) was 61.0 ± 0.344 mg g−1. The yields of total flavonoids in each polar extraction phase were in the following order: 1-butanol > ethyl acetate > chloroform > petroleum ether > water. The highest polyphenol content (in the 1-butanol phase) was 24.93 ± 0.234 mg g−1. The total polyphenol content in each polar extraction phase was in the following order: 1-butanol > ethyl acetate > chloroform > water > petroleum ether. The highest total saponin content (in the 1-butanol phase) was 17.80 ± 0.586 mg g−1. The total saponin content in each polar extraction phase was in the following order: 1-butanol > chloroform > ethyl acetate > water > petroleum ether. The highest total polysaccharide content (in the aqueous phase) was 20.04 ± 0.783 mg g−1. The total polysaccharide content in each polar extraction phase was in the following order: water > ethyl acetate > 1-butanol > chloroform > petroleum ether. The contents of the active ingredients in different extraction phases are shown in Figure 3.

3.3.2. Radical Scavenging Activity in the Various Extraction Fractions

We determined the antioxidant potential of the A. senticosus flavonoid crude extract fractions (differing by their polarities) in several antioxidant assays. There were significant differences in the scavenging rates of the free radicals used by the various solvent fractions (Figure 4). The free radical scavenging activity of the 1-butanol fraction was the highest in all of the assays, and the scavenging activity of the ethyl acetate fraction was the second highest in the DPPH and ABTS assays. Furthermore, the scavenging activity of the chloroform fraction was the second highest in the hydroxyl and superoxide anion radical assays. The scavenging activity of the petroleum ether fraction was the lowest in all of the assays except the superoxide anion radical assay. The solvent fractions of the same polarity had different scavenging rates of different kinds of free radicals. The 1-butanol fraction demonstrated the strongest scavenging ability of DPPH and superoxide anion radicals (having the smallest IC50 value, 0.001 mg mL−1), followed by the ABTS radicals, and then the hydroxyl radicals with the lowest scavenging activity. All polar fractions were lower than the standard Vc in terms of their ability to scavenge free radicals, especially the hydroxyl radicals. However, the 1-butanol fraction was the closest to the standard Vc in its scavenging activity of DPPH radicals and of the ABTS radicals, but those only when it was in higher concentrations.
The scavenging activities of the various extraction fractions for DPPH radicals are shown in Figure 4a. The fractions of different polarities exhibited antioxidant effects in a concentration-dependent manner—the higher the concentration of the extract, the more DPPH radicals scavenged. In addition, the scavenging activity of the 1-butanol fraction for DPPH radicals was greater compared with that of the other fractions, with an IC50 of 0.001 mg mL−1, followed by ethyl acetate, chloroform, aqueous, and petroleum ether fractions. The scavenging activity of various extraction fractions for ABTS radicals is shown in Figure 4b. The scavenging activity of the 1-butanol fraction for ABTS radicals was the highest compared with that of the other fractions, with an IC50 of 1.18 mg mL−1, and the antioxidant activities were in the following order: ethyl acetate, chloroform, aqueous, and petroleum ether fractions. The scavenging activity of the various extraction fractions for hydroxyl radicals is shown in Figure 4c. The scavenging activity of the 1-butanol fraction for hydroxyl radicals was greater compared with that of the other fractions, with an IC50 of 4.17 mg mL−1, followed by chloroform, ethyl acetate, aqueous, and petroleum ether fractions. The scavenging activity of the various extraction fractions for superoxide anion radicals is shown in Figure 4d. The scavenging activity of the 1-butanol fraction for superoxide anion radicals was greater compared with that of the other fractions, with an IC50 of 0.001 mg mL−1, and the antioxidant activities were in the following order: chloroform, petroleum ether, ethyl acetate, and aqueous fractions. According to these results, the 1-butanol fraction was the most promising radical scavenging agent.

3.3.3. Pearson Correlations between the Antioxidant Activity and the Active Compounds content

To identify the potential active compounds that contribute to the antioxidant capacity of the extracts of different polarities, Pearson’s correlation coefficients between the active compound contents (polyphenols, flavonoids, saponins, and polysaccharides) and their antioxidant capacity (radical scavenging activity of DPPH radicals, ABTS radicals, hydroxyl radicals, and superoxide anion radicals) were analyzed using SPSS 22.0 software (Table 4). The scavenging rate for DPPH free radicals was significantly positively correlated with the polyphenol content (p < 0.05), and the correlation coefficient (r) was 0.832. The scavenging rate for ABTS free radicals was significantly positively correlated with the flavonoid and polyphenol contents (p < 0.05), and the correlation coefficients (r) were 0.929 and 0.883, respectively. The scavenging rate of superoxide anion radicals was significantly positively correlated with the polyphenol content (p < 0.05, r = 0.884). The scavenging rate for hydroxyl radicals was not significantly positively correlated with any of the active compound contents (p > 0.05, r ranged from 0.314 to 0.745). The free radical scavenging ability was mainly correlated with the polyphenol content, followed by the flavonoid content, with the lowest being for the saponin and polysaccharide contents, which is also consistent with the results of our experiments: The 1-butanol fraction had the highest flavonoid and polyphenol contents; therefore, this fraction had the strongest scavenging ability of free radicals. DPPH free radicals were significantly positively correlated with ABTS free radicals (r = 0.988, p < 0.01), which is also consistent with the results of the antioxidant experiments. High contents of the active compounds, such as 1-butanol, have higher free radical scavenging rates for DPPH and ABTS than that for hydroxyl and superoxide anion radicals.

4. Discussion

Flavonoids, as secondary metabolites of A. senticosus, are mainly located in the cell wall. They are covalently linked through their sugar moieties by O-glycosyl or C-glycosyl bonds to a variety of polysaccharides, such as hemicellulose, starch, and pectin, which are abundant in the cell wall [34]. The efficiency of traditional extraction techniques is thereby reduced. The basic principle of enzyme-assisted extraction is to hydrolyze plant cell walls with enzymes as catalysts to release intracellular components under optimal conditions. A variety of enzymes, such as xylanase, amylase, papain, pectinase, and hemicellulose, have been used to maximize the extraction yield of active ingredients [35]. In addition, compared with traditional methods, enzyme-assisted extraction methods have the advantages of lower energy requirement, higher extraction rate, and simpler recycling [36]. The combination of enzyme-assisted and ultrasonic extraction may help to overcome the disadvantages of enzyme technology, such as higher solvent consumption and longer extraction time. Ultrasound treatment under optimized conditions (an appropriate frequency and intensity) may even increase enzyme activities [37]. In this study, the complex enzyme-assisted ultrasonic extraction method was used, and the optimal conditions for the extraction process were: 3:2 ratio of cellulase to pectinase, complex enzyme amount of 6960 U g−1, enzyme treatment time of 59.80 min, temperature of 53.70 °C, and pH value of 6.05. The average total flavonoid yield, 36.95 ± 0.05 mg g−1, was similar to the value we predicted using the response surface methodology, indicating that the proposed optimized extraction process of A. senticosus flavonoids is feasible, simple, and very efficient.
After extraction, separation and enrichment of active ingredients are key. Due to the different polarities of active ingredients, it is very important to select solvents of appropriate polarities for the enrichment of active ingredients [38]. In this extraction from A. senticosus, the flavonoid content was the highest in the 1-butanol phase, and it was positively correlated with antioxidant properties. The variation of flavonoids in the solvents of different polarities in this study was probably mainly related to the polarity and effectiveness of the extraction solvents. The polarities of A. senticosus flavonoids are related to their glycoxidation [39] and are considered to be moderate or weak, thus possibly more similar to the polarities of 1-butanol and ethyl acetate. We showed that 1-butanol and ethyl acetate are the most suitable for the enrichment of flavonoids, and the results of this experiment are consistent with Ajayi’s report [40].
Flavonoids are one of the most important phenolic compounds and show antioxidant potential as free radical scavengers. The molecular structure of A. senticosus flavonoids contains a variety of hydroxyl groups, which function as reducing agents, hydrogen donors, and singlet oxygen activators; therefore, the compounds have good antioxidant properties. The purified extract of A. senticosus showed antioxidant properties close to the control Vc and can be used as an antioxidant or dietary supplement in the prevention and treatment of human diseases. The composition of flavonoids in the 1-butanol fraction and the mechanism of their antioxidant effects remain to be further investigated to provide reference for the rational use of A. senticosus.

5. Conclusions

A. senticosus has been used for many years in disease prevention and treatment owing to being rich in a large number of biologically active ingredients, and flavonoids are an important part of its pharmacological activity compounds. The extraction of biologically active flavonoids is the first step of the efficient utilization of A. senticosus herbs. The enzyme-assisted ultrasonic extraction is an efficient method in the extraction of active ingredients for traditional Chinese medicine. In this study, the total flavonoids can be effectively extracted from the A. senticosus herb, and the yield of total flavonoids reached 36.95 ± 0.05 mg g−1.
There are many other components in the crude extract of A. senticosus flavonoids, which may have a certain influence on pharmacodynamic research and pharmacological mechanism study of A. senticosus flavonoids. Thus, it is necessary to further purify the flavonoids of A. senticosus from the crude ethanol extract. The liquid-liquid extraction is the most commonly used compound separation method, which can separate different compounds according to their polarities, and the operation is simple and convenient, and the price is cheap. In this research, we used different polar solvents to enrich flavonoids of A. senticosus. The result suggested that 1-butanol solvent is the most suitable solvent to enrich flavonoids from the ethanol extract of A. senticosus; the content of total flavonoids was 61.0 ± 0.344 mg g−1. The Pearson correlation test between active ingredient content and antioxidant activity further confirmed that the antioxidant activity of A. senticosus extract is positively correlated with the content of flavonoids. The next step is to study the pharmacology function of flavonoids of A. senticosus at cell level or animal level. The study provides good support for the further development and application of A. senticosus flavonoids.

Author Contributions

Conceptualization and methodology, R.L.; software, Q.K.; data curation, X.F.; writing—original draft preparation, X.Z.; writing—review and editing, X.W.; supervision and project administration, X.C.; funding acquisition, J.S. All authors have read and agreed to the published version of the manuscript.

Funding

This research was funded by the National Natural Science Foundation of China (grant no. 31872515).

Institutional Review Board Statement

Not applicable.

Informed Consent Statement

Not applicable.

Data Availability Statement

The study did not report any data.

Conflicts of Interest

The authors declare no conflict of interest.

References

  1. Li, T.; Ferns, K.; Yan, Z.Q.; Yin, S.Y.; Kou, J.J.; Li, D.S.; Zeng, Z.; Yin, L.; Wang, X.Y.; Bao, H.X.; et al. Acanthopanax senticosus: Photochemistry and Anticancer Potential. Am. J. Chin. Med. 2016, 44, 1543–1558. [Google Scholar] [CrossRef] [PubMed]
  2. Bleakney, T.L. Deconstructing an adaptogen: Eleutherococcus senticosus. Holist. Nurs. Pract. 2008, 22, 220–224. [Google Scholar] [CrossRef] [PubMed]
  3. Zhang, X.D.; Li, Z.; Liu, G.Z.; Wang, X.; Kwon, O.K.; Lee, H.K.; Whang, W.K.; Liu, X.Q. Quantitative determination of 15 bioactive triterpenoid saponins in different parts of Acanthopanax henryi by HPLC with charged aerosol detection and confirmation by LC-ESI-TOF-MS. J. Sep. Sci. 2016, 39, 2252–2262. [Google Scholar] [CrossRef] [PubMed]
  4. Jia, A.L.; Zhang, Y.H.; Gao, H.; Zhang, Z.; Zhang, Y.; Wang, Z.; Zhang, J.; Deng, B.; Qiu, Z.; Fu, C. A review of Acanthopanax senticosus (Rupr and Maxim.) harms: From ethnopharmacological use to modern application. J. Ethnopharmacol. 2021, 268, 113586. [Google Scholar] [CrossRef]
  5. Li, F.; Li, W.; Fu, H.W.; Koike, K. Pancreatic lipase-inhibiting triterpenoid saponins from fruits of Acanthopanax senticosus. Chem. Pharm. Bull. 2007, 55, 1087–1089. [Google Scholar] [CrossRef] [Green Version]
  6. Wang, Y.H.; Meng, Y.H.; Zhai, C.M.; Wang, M.; Avula, B.; Yuk, J.; Smith, K.M.; Isaac, G.; Khan, I.A. The Chemical Characterization of Eleutherococcus senticosus and Ci-wu-jia Tea Using UHPLC-UV-QTOF/MS. Int. J. Mol. Sci. 2019, 20, 475. [Google Scholar] [CrossRef] [PubMed] [Green Version]
  7. Han, Y.; Zhang, A.H.; Sun, H.; Zhang, Y.Z.; Meng, X.C.; Yan, G.L.; Liu, L.; Wang, X.J. High-throughput ultra high performance liquid chromatography combined with mass spectrometry approach for the rapid analysis and characterization of multiple constituents of the fruit of Acanthopanax senticosus (Rupr. et Maxim.) Harms. J. Sep. Sci. 2017, 40, 2178–2187. [Google Scholar] [CrossRef] [PubMed]
  8. Zhang, X.L.; Ren, F.; Huang, W.; Ding, R.T.; Zhou, Q.S.; Liu, X.W. Anti-Fatigue Activity of Extracts of Stem Bark from Acanthopanax senticosus. Molecules 2011, 16, 28–37. [Google Scholar] [CrossRef] [Green Version]
  9. Saito, T.; Nishida, M.; Saito, M.; Tanabe, A.; Eitsuka, T.; Yuan, S.H.; Ikekawa, N.; Nishida, H. The fruit of Acanthopanax senticosus (Rupr. et Maxim.) Harms improves insulin resistance and hepatic lipid accumulation by modulation of liver adenosine monophosphate-activated protein kinase activity and lipogenic gene expression in high-fat diet-fed obese mice. Nutr. Res. 2016, 36, 1090–1097. [Google Scholar] [CrossRef]
  10. Lau, K.M.; Yue, G.G.L.; Chan, Y.Y.; Kwok, H.F.; Gao, S.; Wong, C.W.; Lau, C.B.S. A review on the immunomodulatory activity of Acanthopanax senticosus and its active components. Chin. Med. 2019, 14. [Google Scholar] [CrossRef] [Green Version]
  11. Zaluski, D.; Olech, M.; Kuzniewski, R.; Verpoorte, R.; Nowak, R.; Smolarz, H.D. LC-ESI-MS/MS profiling of phenolics from Eleutherococcus spp. inflorescences, structure-activity relationship as antioxidants, inhibitors of hyaluronidase and acetylcholinesterase. Saudi Pharm. J. 2017, 25, 734–743. [Google Scholar] [CrossRef] [Green Version]
  12. Peluso, I.; Miglio, C.; Morabito, G.; Ioannone, F.; Serafini, M. Flavonoids and Immune Function in Human: A Systematic Review. Crit. Rev. Food Sci. Nutr. 2015, 55, 383–395. [Google Scholar] [CrossRef]
  13. Huang, L.Z.; Zhao, H.F.; Huang, B.K.; Zheng, C.J.; Peng, W.; Qin, L.P. Acanthopanax senticosus: Review of botany, chemistry and pharmacology. Pharmazie 2011, 66, 83–97. [Google Scholar] [CrossRef]
  14. Chaves, J.O.; de Souza, M.C.; da Silva, L.C.; Lachos-Perez, D.; Torres-Mayanga, P.C.; Machado, A.P.D.F.; Forster-Carneiro, T.; Vázquez-Espinosa, M.; González-de-Peredo, A.V.; Barbero, G.F.; et al. Extraction of flavonoids from natural sources using modern techniques. Front. Chem. 2020, 8, 507887. [Google Scholar] [CrossRef] [PubMed]
  15. Zhang, Q.W.; Lin, L.G.; Ye, W.C. Techniques for extraction and isolation of natural products: A comprehensive review. Chin. Med. 2018, 13. [Google Scholar] [CrossRef] [PubMed] [Green Version]
  16. Dominguez-Rodriguez, G.; Marina, M.L.; Plaza, M. Enzyme-assisted extraction of bioactive non-extractable polyphenols from sweet cherry (Prunus avium L.) pomace. Food Chem. 2021, 339. [Google Scholar] [CrossRef]
  17. Ahmad, I.; Sabah, A.; Anwar, Z.; Arif, A.; Arsalan, A.; Qadeer, K. Effect of solvent polarity on the extraction of components of pharmaceutical plastic containers. Pak. J. Pharm. Sci. 2017, 30, 247–252. [Google Scholar] [PubMed]
  18. Chang, C.; Yang, M.; Wen, H.-M.; Chern, J. Estimation of total flavonoid content in propolis by two complementary colorimetric methods. J. Food Drug Anal. 2020, 10, 178–182. [Google Scholar]
  19. Chen, H.G.; Zhou, X.; Zhang, J.Z. Optimization of enzyme assisted extraction of polysaccharides from Astragalus membranaceus. Carbohydr. Polym. 2014, 111, 567–575. [Google Scholar] [CrossRef]
  20. Bezerra, M.A.; Santelli, R.E.; Oliveira, E.P.; Villar, L.S.; Escaleira, L.A. Response surface methodology (RSM) as a tool for optimization in analytical chemistry. Talanta 2008, 76, 965–977. [Google Scholar] [CrossRef]
  21. Pham, H.N.T.; Nguyen, V.T.; Van Vuong, Q.; Bowyer, M.C.; Scarlett, C.J. Effect of Extraction Solvents and Drying Methods on the Physicochemical and Antioxidant Properties of Helicteres hirsuta Lour. Leaves. Technologies 2015, 3, 285–301. [Google Scholar] [CrossRef] [Green Version]
  22. Hadidi, M.; Ibarz, A.; Pagan, J. Optimisation and kinetic study of the ultrasonic-assisted extraction of total saponins from alfalfa (Medicago sativa) and its bioaccessibility using the response surface methodology. Food Chem. 2020, 309. [Google Scholar] [CrossRef]
  23. Dubois, M.; Gilles, K.A.; Hamilton, J.K.; Rebers, P.A.; Smith, F. Colorimetric method for determination of sugars and related substances. Anal. Chem. 1956, 28, 350–356. [Google Scholar] [CrossRef]
  24. Brand-Williams, W.; Cuvelier, M.E.; Berset, C. Use of a free radical method to evaluate antioxidant activity. LWT-Food Sci. Technol. 1995, 28, 25–30. [Google Scholar] [CrossRef]
  25. Thaipong, K.; Boonprakob, U.; Crosby, K.; Cisneros-Zevallos, L.; Byrne, D.H. Comparison of ABTS, DPPH, FRAP, and ORAC assays for estimating antioxidant activity from guava fruit extracts. Food Compos. 2006, 19, 669–675. [Google Scholar] [CrossRef]
  26. Purushothaman, A.; Sheeja, A.A.; Janardanan, D. Hydroxyl radical scavenging activity of melatonin and its related indolamines. Free Radic. Res. 2020, 54, 373–383. [Google Scholar] [CrossRef]
  27. Kladna, A.; Berczynski, P.; Kruk, I.; Michalska, T.; Aboul-Enein, H.Y. Superoxide anion radical scavenging property of catecholamines. Luminescence 2013, 28, 450–455. [Google Scholar] [CrossRef]
  28. Mukaka, M.M. Statistics corner: A guide to appropriate use of correlation coefficient in medical research. Malawi Med. J. 2012, 24, 69–71. [Google Scholar]
  29. Chen, S.; Xing, X.H.; Huang, J.J.; Xu, M.S. Enzyme-assisted extraction of flavonoids from Ginkgo biloba leaves: Improvement effect of flavonol transglycosylation catalyzed by Penicillium decumbens cellulase. Enzym. Microb. Technol. 2011, 48, 100–105. [Google Scholar] [CrossRef]
  30. Peterson, M.E.; Daniel, R.M.; Danson, M.J.; Eisenthal, R. The dependence of enzyme activity on temperature: Determination and validation of parameters. Biochem. J. 2007, 402, 331–337. [Google Scholar] [CrossRef]
  31. Li, F.J.; Ning, S.L.; Li, Y.; Yu, Y.J.; Duan, J.L. Enhanced extraction of osthole and imperatorin from Cnidium monnieri by infrared-accelerated enzyme pretreatmenta. Anal. Methods 2013, 5, 5669–5676. [Google Scholar] [CrossRef]
  32. Yin, X.L.; You, Q.H.; Jiang, Z.H. Optimization of enzyme assisted extraction of polysaccharides from Tricholoma matsutake by response surface methodology. Carbohydr. Polym. 2011, 86, 1358–1364. [Google Scholar] [CrossRef]
  33. Cai, C.Y.; Li, F.F.; Liu, L.L.; Tan, Z.J. Deep eutectic solvents used as the green media for the efficient extraction of caffeine from Chinese dark tea. Sep. Purif. Technol. 2019, 227. [Google Scholar] [CrossRef]
  34. Nadar, S.S.; Rao, P.; Rathod, V.K. Enzyme assisted extraction of biomolecules as an approach to novel extraction technology: A review. Food Res. Int. 2018, 108, 309–330. [Google Scholar] [CrossRef] [PubMed]
  35. Sowbhagya, H.B.; Chitra, V.N. Enzyme-Assisted Extraction of Flavorings and Colorants from Plant Materials. Crit. Rev. Food Sci. Nutr. 2010, 50, 146–161. [Google Scholar] [CrossRef] [PubMed]
  36. Puri, M.; Sharma, D.; Barrow, C.J. Enzyme-assisted extraction of bioactives from plants. Trends Biotechnol. 2012, 30, 37–44. [Google Scholar] [CrossRef] [PubMed]
  37. Nadar, S.S.; Rathod, V.K. Ultrasound assisted intensification of enzyme activity and its properties: A mini-review. World J. Microbiol. Biotechnol. 2017, 33. [Google Scholar] [CrossRef]
  38. Kļaviņa, L. Composition of Mosses, Their Metabolites and Environmental Stress Impacts. Ph.D. Thesis, University of Latvia, Riga, Latvia, 2018. Available online: https://dspace.lu.lv/dspace/handle/7/38353 (accessed on 27 April 2018).
  39. Jan, S.; Khan, M.R.; Rashid, U.; Bokhari, J. Assessment of antioxidant potential, total phenolics and flavonoids of different solvent fractions of Monotheca buxifolia fruit. Osong Publ. Health Res. Perspect. 2013, 4, 246–254. [Google Scholar] [CrossRef] [Green Version]
  40. Ajayi, A.M.; Martins, D.T.D.; Balogun, S.O.; de Oliveira, R.G.; Ascencio, S.D.; Soares, I.M.; Barbosa, R.D.; Ademowo, O.G. Ocimum gratissimum L. leaf flavonoid-rich fraction suppress LPS-induced inflammatory response in RAW 264.7 macrophages and peritonitis in mice. J. Ethnopharmacol. 2017, 204, 169–178. [Google Scholar] [CrossRef]
Figure 1. Effect of various independent variables on the yield of total flavonoids extracted from A. senticosus: (a) the amount of cellulase; (b) the amount of pectinase; (c) the ratio of cellulase to pectinase; (d) the amount of the enzyme mixture; (e) the enzyme treatment time; (f) the enzyme treatment temperature; (g) the pH at which the enzymatic hydrolysis proceeded.
Processes 09 01708 g001
Figure 2. 3D response surface plots of the optimization: (a) interaction between the enzyme amount and the enzyme treatment time; (b) interaction between the enzyme amount and temperature; (c) interaction between the enzyme amount and pH; (d) interaction between the enzyme treatment time and temperature; (e) interaction between the enzyme treatment time and pH; (f) interaction between the temperature and pH.
Processes 09 01708 g002
Figure 3. Contents of the active components in the different fractions.
Processes 09 01708 g003
Figure 4. Antioxidant test in various extraction phases: (a) scavenging activity for DPPH radicals; (b) scavenging activity for ABTS radicals; (c) scavenging activity for hydroxyl radicals; (d) scavenging activity for superoxide anion radicals.
Processes 09 01708 g004
Table 1. Box–Behnken experimental design.
Factors Level
−101
Enzyme amount (U g−1) (A)100050009000
Enzyme treatment time (min) (B)455565
Enzyme treatment temperature (°C) (C)405060
Solvent pH value (D)5.466.6
The letters A–D denote independent variables in our models.
Table 2. Design and results for the response surface experiment.
No.ABCDFlavonoid Yield (mg g−1)
10−1−1035.51
2−110035.61
31−10035.65
40−10−135.41
5−100135.67
6100−136.20
700−1−136.21
8001136.15
9010136.51
1010−1036.10
11110036.53
12000036.60
13101036.49
140−10135.55
15011036.43
16100136.31
17000036.65
180−11035.45
19−10−1035.61
20000036.73
21000036.78
22010−136.19
2301−1035.85
24000036.70
25−100−135.09
26001−136.20
2700−1135.90
28−101035.32
29−1−10035.11
Table 3. Analysis of variance of the quadratic model of the response surface.
SourceSum of SquaresDfMean SquareF-Valuep-ValueSignificant
Model7.1200140.508725.2900<0.0001**
A1.980011.980098.2500<0.0001**
B1.640011.640081.6600<0.0001**
C0.061610.06163.06000.1019
D0.052010.05202.59000.1302
AB0.036110.03611.79000.2017
AC0.115610.11565.75000.0310
AD0.055210.05522.75000.1198
BC0.102410.10245.09000.0406
BD0.008110.00810.40260.5360
CD0.016910.01690.84010.3749
1.70011.70084.4700<0.0001**
1.610011.610079.9900<0.0001**
0.666610.666633.1400<0.0001**
0.581210.581228.8900<0.0001**
Residual0.2816140.0201
Lack of fit0.2622100.02625.38000.0595
Pure error0.019540.0049
Cor total7.428
** Significant at p < 0.01.
Table 4. Correlation analysis of the antioxidant activity and active components.
Total FlavonoidsTotal PolyphenolsTotal SaponinsTotal PolysaccharidesDPPH RadicalsABTS RadicalsHydroxyl RadicalsSuperoxide Anion Radicals
Total
flavonoids
1
Total
polyphenols
0.964 **1
Total saponins0.888 *0.7631
Total polysaccharides0.0330.0590.0531
DPPH radicals0.7010.832 *0.4520.5561
ABTS radicals0.929*0.883 *0.7360.1090.988 **1
Hydroxyl
radicals
0.5890.7450.3140.630.6030.5091
Superoxide anion radicals0.7850.884 *0.6460.2420.8680.5630.8051
Note: * Significant at p < 0.05; ** significant at p < 0.01.
Publisher’s Note: MDPI stays neutral with regard to jurisdictional claims in published maps and institutional affiliations.

