Article

Biomethanation Potential (BMP) Study of Mesophilic Anaerobic Co-Digestion of Abundant Bio-Wastes in Southern Regions of Tunisia

1
Applied Thermodynamics Research Unit, National School of Engineers, Gabès University, Omar Ibn El Khattab Street, Gabès 6029, Tunisia
2
Materials, Environment and Energy, Research Unit (UR14ES26), Gafsa University, University Campus-Sidi Ahmed Zarroug, Gafsa 2112, Tunisia
3
Department of Industrial Engineering, University of Perugia, Via G. Duranti 67, 06125 Perugia, Italy
4
Mechanical Engineering Department, Al-Huson University College, Al-Balqa’ Applied University, P.O. Box 50, Al-Huson, Irbid 19117, Jordan
5
Biomass Research Centre, University of Perugia, Strada Santa Lucia Canetola, 06125 Perugia, Italy
*
Authors to whom correspondence should be addressed.
Processes 2021, 9(1), 48; https://doi.org/10.3390/pr9010048
Submission received: 9 December 2020 / Revised: 21 December 2020 / Accepted: 24 December 2020 / Published: 29 December 2020
(This article belongs to the Special Issue Current Trends in Anaerobic Digestion Processes)

Abstract

:
Tunisia is a country that suffers from energy demand problems and environmental matters. Thus, Tunisian authorities desire to encourage the development of renewable energy sources, especially from biological processes, like anaerobic digestion. Therefore, this study is focused on the evaluation of biogas and bio-methane yield from the co-digestion of three available and abundant bio-wastes in the southern regions of Tunisia. The three different raw materials are an organic fraction of municipal solid waste, chicken manure, and olive mill wastewater. In this context, experimental work to evaluate the potential of biogas and bio-methane production was carried out at mesophilic temperature 35 °C and batch mode. The present work highlights the possibility of generating biogas from these organic wastes and reducing the amounts of the wastes to dispose of in landfills. The experimental study of the co-digestion process under specific conditions of carbon to nitrogen ratio (C/N), T, pH, and inoculums to substrate ratio ISR provided a high yield of net methane and net biogas, in comparison with other research works. Results showed a higher specific net methane production per kg of volatile solids, which is equal to 0.338 Nm3 methane/kg VS and 0.430 Nm3 methane/kg VS for two studied cases. The obtained volatile solids reduction was found to be 91% of the initial content, for a hydraulic retention time (HRT) of 40 days.

1. Introduction

Fossil fuels still have an important role in energy production for the great part of human, agricultural, and industrial activities. Fossil fuels, besides being highly polluting, are not renewable and take thousands of years to be formed [1]. Thus, the amount of greenhouse gases (GHGs) emissions in the atmosphere are continuously rising and carbon dioxide (CO2) is the main contributor. In addition, World energy demands is increasing rapidly [2]. Consequently, many research works are focused on the development of new sustainable energy supply systems, that aim, on one hand, at covering the energy demand from renewable sources, and, on another hand, at reducing greenhouse gas emissions. Using alternative energy sources can be a promising solution to reduce the above-cited problems [3]. During the last decades of the 20th century, anaerobic digestion (AD) has become an important process to address environmental and energy concerns, and many recent studies reported that anaerobic digestion (AD) is an efficient alternative technology that combines bio-energy production with sustainable waste management. It is increasing successful, due to the low cost of available feedstock, to the wide range of the possible uses of biogas (i.e., for fuel [4], electricity [5], and heating [6]), and to the need to alleviate the problems of global warming, energy security, and waste management [7]. This technology is based on biochemical degradation processes, which are extensively employed for the treatment and energy recovery of different biomasses. Compared with other techniques such as incineration, gasification, or pyrolysis, anaerobic digestion has many advantages, which make it interesting for the industrial energy generation sector [8]. Anaerobic digestion is able to produce two added-value products: biogas and digestate (which is a fertilizer). Biogas can be converted in combined heat and power (CHP) plants into electricity and heat or upgraded to bio-methane, and then injected into the gas network and used as a fuel for road transportation. Biogas production is one of the most promising ways to produce renewable energy from energy crops and other organic materials. In addition, the digestate can be used as a perfect fertilizer in agricultural activities [9]. Given the international rising level of energy demand, many countries focused their efforts on research and development of new sustainable sources of energy. The Tunisian case is an interesting one, which represents a developing country characterized by an increasingly growing economy in the North African region [10]. Tunisia has been engaged in a renewable energy development program since the 2011 revolution, which brought an improvement in the power balance. The government proposes strategies with different technologies and scales of the energy systems. In 2011, renewable energies represented only about 3% of the total installed capacity, which is a very low percentage. Thus, implementation of biomass-based energy programs will be a great solution to the country’s energy problems and will bring new insight for efficient energy use in different sectors [11]. In 2009, Tunisian organic waste production was estimated at about 6 million tons per year, which was composed as follows: 2.2 million tons of household waste, 2.2 million tons of farms and agri-food businesses waste, 1 million tons of waste from processing olive oil, 400,000 tons of poultry droppings, and 200,000 tons of wastewaters [12]. In this country, biomass resources are essentially divided into four major sub-sectors which are: industrial organic waste, agricultural waste and byproducts, sludge from sewage treatment plants, and household waste [13]. The production of bio-energy in Tunisia, especially in southern regions, is possible by the valorization of the organic fraction of municipal wastes, especially household waste, poultry droppings, and olive mill wastewater.
In this context, this paper reports an experimental study, at a laboratory scale, of bio-methane generation from the three cited biomass sources, which has been identified as a potentially useful source of bio-methane [14,15,16]. The OMWW has a high concentration of polyphenols in olive mill wastewater (OMWW), a high organic matter percent, and an unbalanced carbon to nitrogen ratio, which hinders obtaining high methane yields from anaerobic digestion of this waste as mentioned in [17]. Thus, the high nitrogen content of chicken manure makes it a typical feedstock for anaerobic fermentation, especially in the co-digestion process [18]. However, anaerobic digestion efficiency rapidly degraded and inhibition of ammonia occurred. Further research found that the yield and amounts of microbial biomass declined significantly due to the accumulation of ammonia during fermentation of chicken manure. As a result, biogas and bio-methane production would only be limited in particular conditions [19]. In addition, the organic fraction of municipal solids waste (i.e., food and biomass residues, cardboard, and papers) varies between 30% and 65%. In this respect, different research showed that this bio-waste was a potential primary energy source, especially the biodegradable fraction of the municipal solid waste by the amount of biogas that can be produced through anaerobic fermentation [20]. Single substrate digestion was a traditional process. Currently, it is substituted by co-digestion for practical and technical reasons. It is a promising technique for overcoming the disadvantages of mono-digestion and improving the economic viability of anaerobic digestion plants with higher bio-methane generation. The main advantage of this process is the improvement of biogas and the bio-methane production yield [21]. The aim of the present study is to improve the biogas/bio-methane yield and the substrate removal efficiency, by using new mixtures of these wastes under well studied specific anaerobic conditions. In this work, we will investigate the feasibility of the co-digestion of these biomasses. This project can be considered as a necessary step for the evaluation of co-fermentation of available energetic substrates which have more complex and diverse compositions. In addition, this work was done to enrich the research in the context of the anaerobic digestion, especially for the lack of study according to this mixture of three substrates and mainly because of the limited bio-wastes available in the south region of Tunisia.

2. Materials and Methods

2.1. Substrates

The chicken manure was obtained from large chicken farms, the organic fraction of municipality wastes was collected from the landfills of the municipality, and the olive mill waste from a modern pressed mill factory. All the substrates mentioned above were collected from Médenine city (a southern region in Tunisia). The pretreatment phase as a sorting of recyclable materials (e.g., paper and cardboard), removal of substances such as metals, glasses, and finally grinding organic fractions of municipal waste to reduce the size is essential before the anaerobic digestion process. This step is essential because the undesirable materials often cause process failures (i.e., phase separation, sedimentation, flotation, etc.), and it affects the degradation as well as the biogas yield [22]. As mentioned in the work of Tyagi et al. [23], the grinding helps to enhance the anaerobic digestion by reducing the substrate particle size, which induces an increase in accessible surface area, leading to enhancing substrate degradation. Finally, the substrates were homogenized and stored at 4 °C for further use. In this work, the sorting was done manually and the grinding was done by crushing.

2.2. Experimental Conditions

2.2.1. Inoculums

The degradation of recalcitrant biomass needs appropriate inoculums to boost this operation. Perfect inoculums contain a high number of active microbe communities that convert organic materials to biogas. It affects the digestion performance, changes the degradation rate, and varies the biogas composition and fermentation time. The inoculums are not only employed to provide different microbial species but also serve as a source of nutrients that enhances the microbial activity, thus elevating the amount of the produced biogas [24]. The inoculums should be taken from a well-functioning anaerobic digester. The by-products from agricultural fermentation plants that treat manure as feedstock are usually used and can be recommended as sources of inoculums [25]. In the present study, the inoculums are the primary digestate from biogas station situated in the municipality region of Perugia (Italy) [26]. As information from this biogas station, the used inoculums are composed of 62.28% maize, sorghum, and triticale silage, 16.26% humid pitted pomace, and 21.55% pig wastewater.

2.2.2. Inoculums to Substrate Ratio (ISR)

The proper selection of inoculums source and the inoculums to substrate (I/S) ratio is the most important operational parameters for the assessment of anaerobic biodegradability, and the optimization of the anaerobic digestion process of the bio-wastes [27]. The I/S ratio is an interesting criterion since the methane production during the bio-methanisation potential test BMP depends on this parameter. In addition, the optimization of this ratio generally depends on the tested substrate. However, it is also reported that, in the case where the substrates have easy degradation, rapid accumulation of fermentation intermediates such as VFA can occur and lead to the inhibition of anaerobic digestion. In this case, a ratio greater than or equal to 4 is preferred. For less degradable substrates, such as lignocellulosic organic matter, a ratio less than or equal to 1 can be applied [28]. Nazaitulshila et al. [29] showed that it is necessary to carry out a BMP test before the designing of an anaerobic process in an actual reactor, due to the fact that each substrate and inoculums have been produced from different sources, and they differ in their characteristics.

2.2.3. Carbon to Nitrogen Ratio (C/N)

Co-fermentation of various bio-wastes is a process where the nutrients and bacterial diversity in those wastes are used to optimize the digestion process. The C/N ratio is an important parameter for improving the efficiency of bioconversion. The interesting advantage of this method is an efficient balance between carbon and nitrogen ratio to improve bio-methane production [30]. During anaerobic digestion, Tanimu et al. [31], showed that the microbial species use about 25 to 30 times more carbon faster than nitrogen. Consequently, waste feedstock, which has higher and easily biodegradable carbon, can be mixed with wastes that have low nitrogen percent or vice versa, to attain the desired carbon to nitrogen ratio C/N. As mentioned in [32], the optimal C/N ratio for the anaerobic digestion ranges between 20:1 and 30:1. In this work, this ratio has been studied.

2.3. BMP Test Materials

The bio-methanisation potential BMP process was carried out as follows: the tests were done using vessels with a total volume of 1 L fabricated from boro-silicate glass and equipped with a higher neck connected to a pressure sensor (pressure transducer) UNIK 5000 GE Measurement and Control. In BMP experiments, biogas was produced from substrates and inoculums in a batch system. Three bottles, playing the role of a bioreactor, should be continuously shaken and kept under anaerobic conditions during the process of transfer. The bottles were contained in a thermostatic bath and were heated to the desired optimal temperature for the specific anaerobic digestion process. The concept of the BMP test is to measure the volume and composition of biogas production from the anaerobic fermentation of organic waste with anaerobic inoculums at specific conditions. The anaerobic digestion conditions were mentioned in the experimental procedure section (Section 2.5).

2.4. Analytical Procedures

Each sample was subjected to proximate and ultimate analyses to determine the physicochemical characteristics. The analysis tests were carried out in the Analysis Laboratory of the Biomass Research Centre (University of Perugia, Umbria, Italy) as mentioned in [33,34,35]. The proximate analysis allowed the determination (in percentage) of moisture, volatile matter, ash, and other compounds according to CEN/TS 14774, CEN/TS 14775, and CEN/TS 15148 [36,37,38] using a thermogravimetric analyzer (TGA 701 LECO, St. Joseph, Michigan, MI, USA). The ultimate analysis was carried out for the determination of carbon (C), hydrogen (H), and nitrogen (N) content, using an elemental analyzer (Truspec CHN LECO, St. Joseph, Michigan, MI, USA) The samples were prepared in compliance with CEN/TS 14780 [39] while ultimate analysis was carried out in compliance with CEN/TS 15104 [40]. The pH measurements were carried out by a portable pH Meter HI9124 with a resolution of 0.01, which uses double junction pH electrodes. Biogas production was evaluated by measuring the pressure variations through UNIK 5000 Pressure Sensors (accuracy to ±0.04% Full Scale), connected to a NANODAC data acquisition system. Biogas samples were analyzed through an Agilent 490 Micro gas chromatograph (Agilent Technologies Inc. Santa Clara, California, CA, USA), which consists of a dual-channel cabinet, including a 10-m column using argon as a carrier gas and a 10-m column using helium as a carrier gas. Helium and argon were with a flow rate of 10 mL/min. Temperatures of injector, detector, and columns were 100 °C, 180 °C, and 80 °C, respectively. Biogas in excess was continuously vented to avoid pressurized conditions and explosion risks.

2.5. Experimental Procedure

Two bottles were filled up to 25% of their volume capacity by 250 g of the same mixture composed by the organic fraction of municipal solid waste, chicken manure, olive mill wastewater, and the inoculums, with the following mass percentages: 4.4%, 2.2%, 4.4%, and 89%. These mass percents were according to the optimal values of C/N and I/S ratios. The third bottle was only filled by the inoculums, with a mass of 222.5 g, which represents 89% of the mass of the global mixture. This bottle was used as a blank test. The startup of the anaerobic digestion needs a natural pH value due to the fact that methanogenic bacteria are very sensitive to the pH values of the medium, and they have an optimum value ranging between 6.8 and 7.2 [41]. In this study, the anaerobic digestion pH value is equal to 7. The vessels were then tightly closed, and pressure sensors were applied and the vessels were sealed and immersed in the thermostatic bath in mesophilic conditions at approximately 35 ± 0.5 °C, which is the most suitable temperature for mesophilic fermentation [42]. The two substrate–inoculum bottles were used to follow the pressure evolution of the anaerobic digestion. Mixing has an important influence on the distribution of microorganisms, substrate, nutrients, alkalinity, and the release of gas bubbles trapped in the contents of the digester. It avoids sedimentation and provides a homogeneous distribution of temperature in the digester. Thus, as a recommendation from the literature, shaking (with rotation) at least one time a day (for 1 min) during the test period is essential [43,44]. Figure 1 describes the experimental setup materials.

2.6. Mathematical Equations

In this study, different mathematical equations were used to get some data. The used formula for calculating C/N ratio is given by the equation used in reference [45] to calculate this ratio in the mixture:
( C N ) mix = [ i = 1 3 x i × ( C N ) i ]
The measured values of the pressure were converted into biogas volume as established in Equation (2) according to reference [46] and the bio-methane percentage was detected by the micro gas chromatograph:
V biogas = ( P mes × 0.986 × T 0 P 0 × T r ) × V r

3. Results and Discussion

3.1. Physicochemical Characterization

The mass of the three tested substrates was equal to 27.5 g that represents 11% of the total mass in the bioreactor (i.e., the digester). The mass percentages of the three used materials in the bio-waste are equal to 40%, 40%, and 20%, for the organic fraction of municipal solid waste, olive mill wastewater, and chicken manure, respectively. Table 1 presents the mass fractions, as well as the individual masses of the used wastes.
The substrates and inoculum characterizations are summarized in Table 2.
As shown in Table 2, the municipal waste presents the highest value of volatile matter (44.49%), whereas the inoculums have the lowest one (7.14%). This percent of volatile solids is low because the organic materials in the inoculums were digested in the anaerobic station, from where the inoculums were taken [26]. The VS inquires about the organic fraction will be degraded in anaerobic digestion [47]. Humidity, which allows the ease of the global mixture motion, is mainly provided by the inoculums (89.74%). It could be noticed that the humidity of all substrates exceeds 50%, which allows the easiness of the motion of the global mixture. More than 80% moisture of the digestion capacity can be considered as a wet process [48]. In this work, the global mixture humidity is equal to 86.06%, which is more than 80%, thus this fermentation test was wet. The increase of biogas production mainly depends on the analysis of the used bio-waste characteristics as mentioned by Wellinger et al. [47]. Table 3 illustrates the results of the ultimate analyses of the studied bio-wastes. In this case, the ultimate analysis of the used bio-wastes provides the mass percentages of the main elements in the substrate as illustrated in Table 3. As can be seen from Table 3, there are no significant differences between the obtained results and those of Ahn et al. [49], in terms of C/N chicken waste ratio. They have found that the C/N ratio of chicken waste has a value equal to 8.61. Furthermore, results found by Puyuelo et al. [50] were in good agreement with our C/N ratio value for the organic fraction of municipal solid waste which tends towards a value equal to 24.7. The OMWW C/N ratio has a value equal to 38.28, which is also in good agreement with those obtained by Garcia-Gomez [51] and Sevik et al. [52], which are equal to 36.5 and 42.49, respectively. The nitrogen serves to enhance microbial growth and carbon acts as an energy source. According to Mir et al. [53], C and N often act as a limiting factor, and the optimum C/N ratio value ranges between 20 and 30. However, in the study of Dioha et al. [54], a C/N ratio ranging between 25:1 and 30:1 is optimum for biogas production. Generally, low C/N ratio results in accumulation of ammonia and exceeding pH values that are toxic to methanogens. Low C/N ratios occur when too much nitrogen is present [55]. On the other hand, the greater the C/N ratio, the slower the rate of decomposition and nitrogen may also be immobilized during the composting process [56].
These percentages give a C/N ration equal to 26.78 using Equation (1). This value falls between the optimum ratio values (i.e., between 25:1 and 30:1) as described above. In their work, Wang et al. [57] have a ratio equal to 26.76.
From the physic-chemical characterizations of the bio-waste and the inoculums illustrated in Table 2, the mass percentage of VS provides the determination of the total VS in the treated substrate as well as in the inoculums. The quantity of VS is therefore given by the following equation:
{ ( VS ) substrate = i = 1 3 ( y i vs × m i ) ( VS ) inoculums = y inoculums vs × m inoculums
Equation (3) allows the determination the substrate to inoculum ratio S/I, given by Equation (4):
S I = ( VS ) substrate ( VS ) inoculums
It is also a significant parameter to be determined. S/I ratio is an indicator concerning the appropriate inoculum volume to provide for the required amount of microorganisms for the anaerobic reaction to startup. Thus, the used volume of inoculum influences the amount of produced methane [29]. In their study, Caillet et al. [58] showed that the methane yield reaches its maximum for values of S/I ratio ranging between 0.6 and 0.9, and inhibitions occur when the ratio exceeds 1, due to volatile fatty acids accumulations during the degradation. In the present case, and by applying Equation (3), we get (VS)substrate = 9.34 g, and (VS)inoculums = 15.89 g. Consequently, S/I = 0.588, which is near to 0.6.

3.2. Biogas and Bio-Methane Production

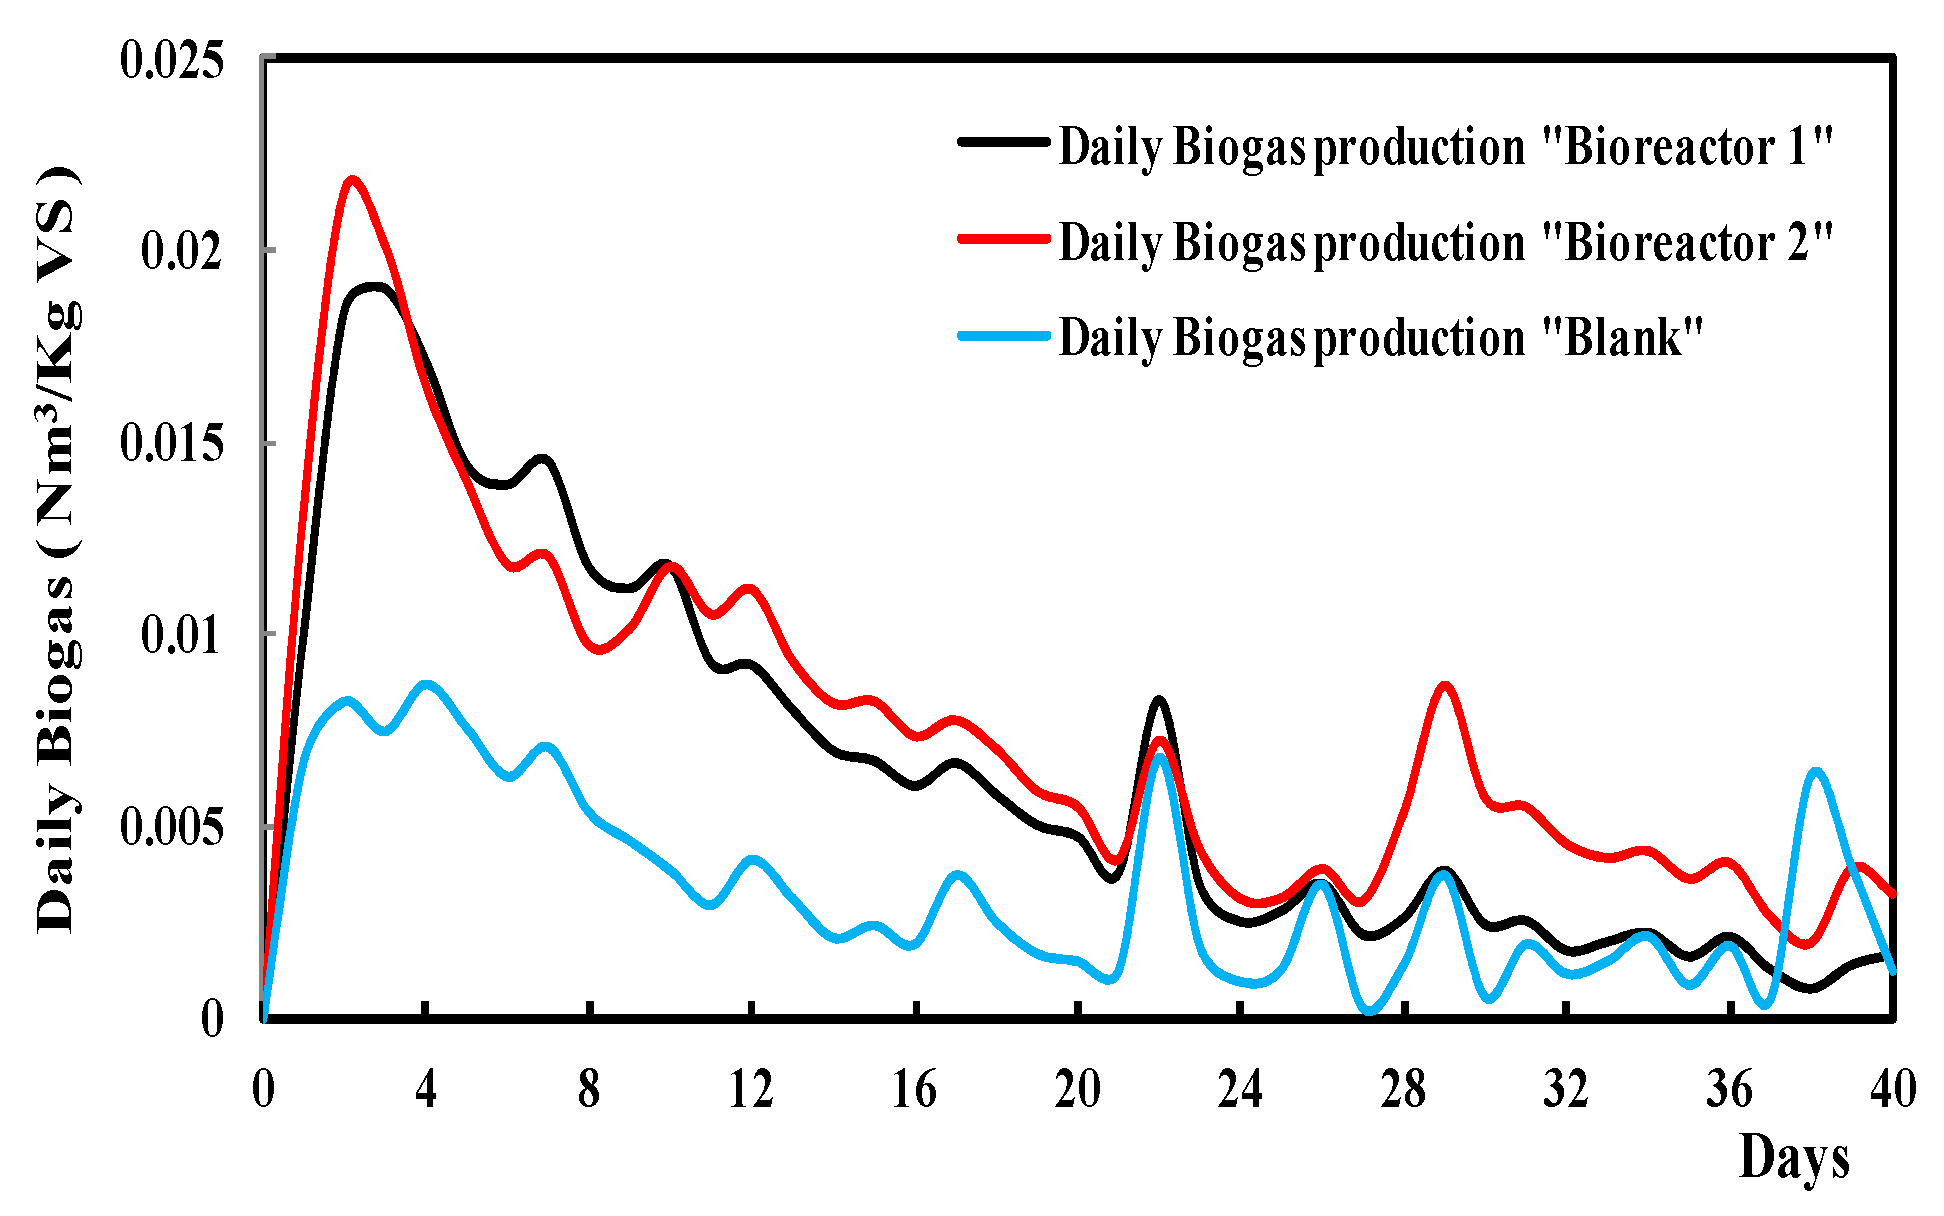
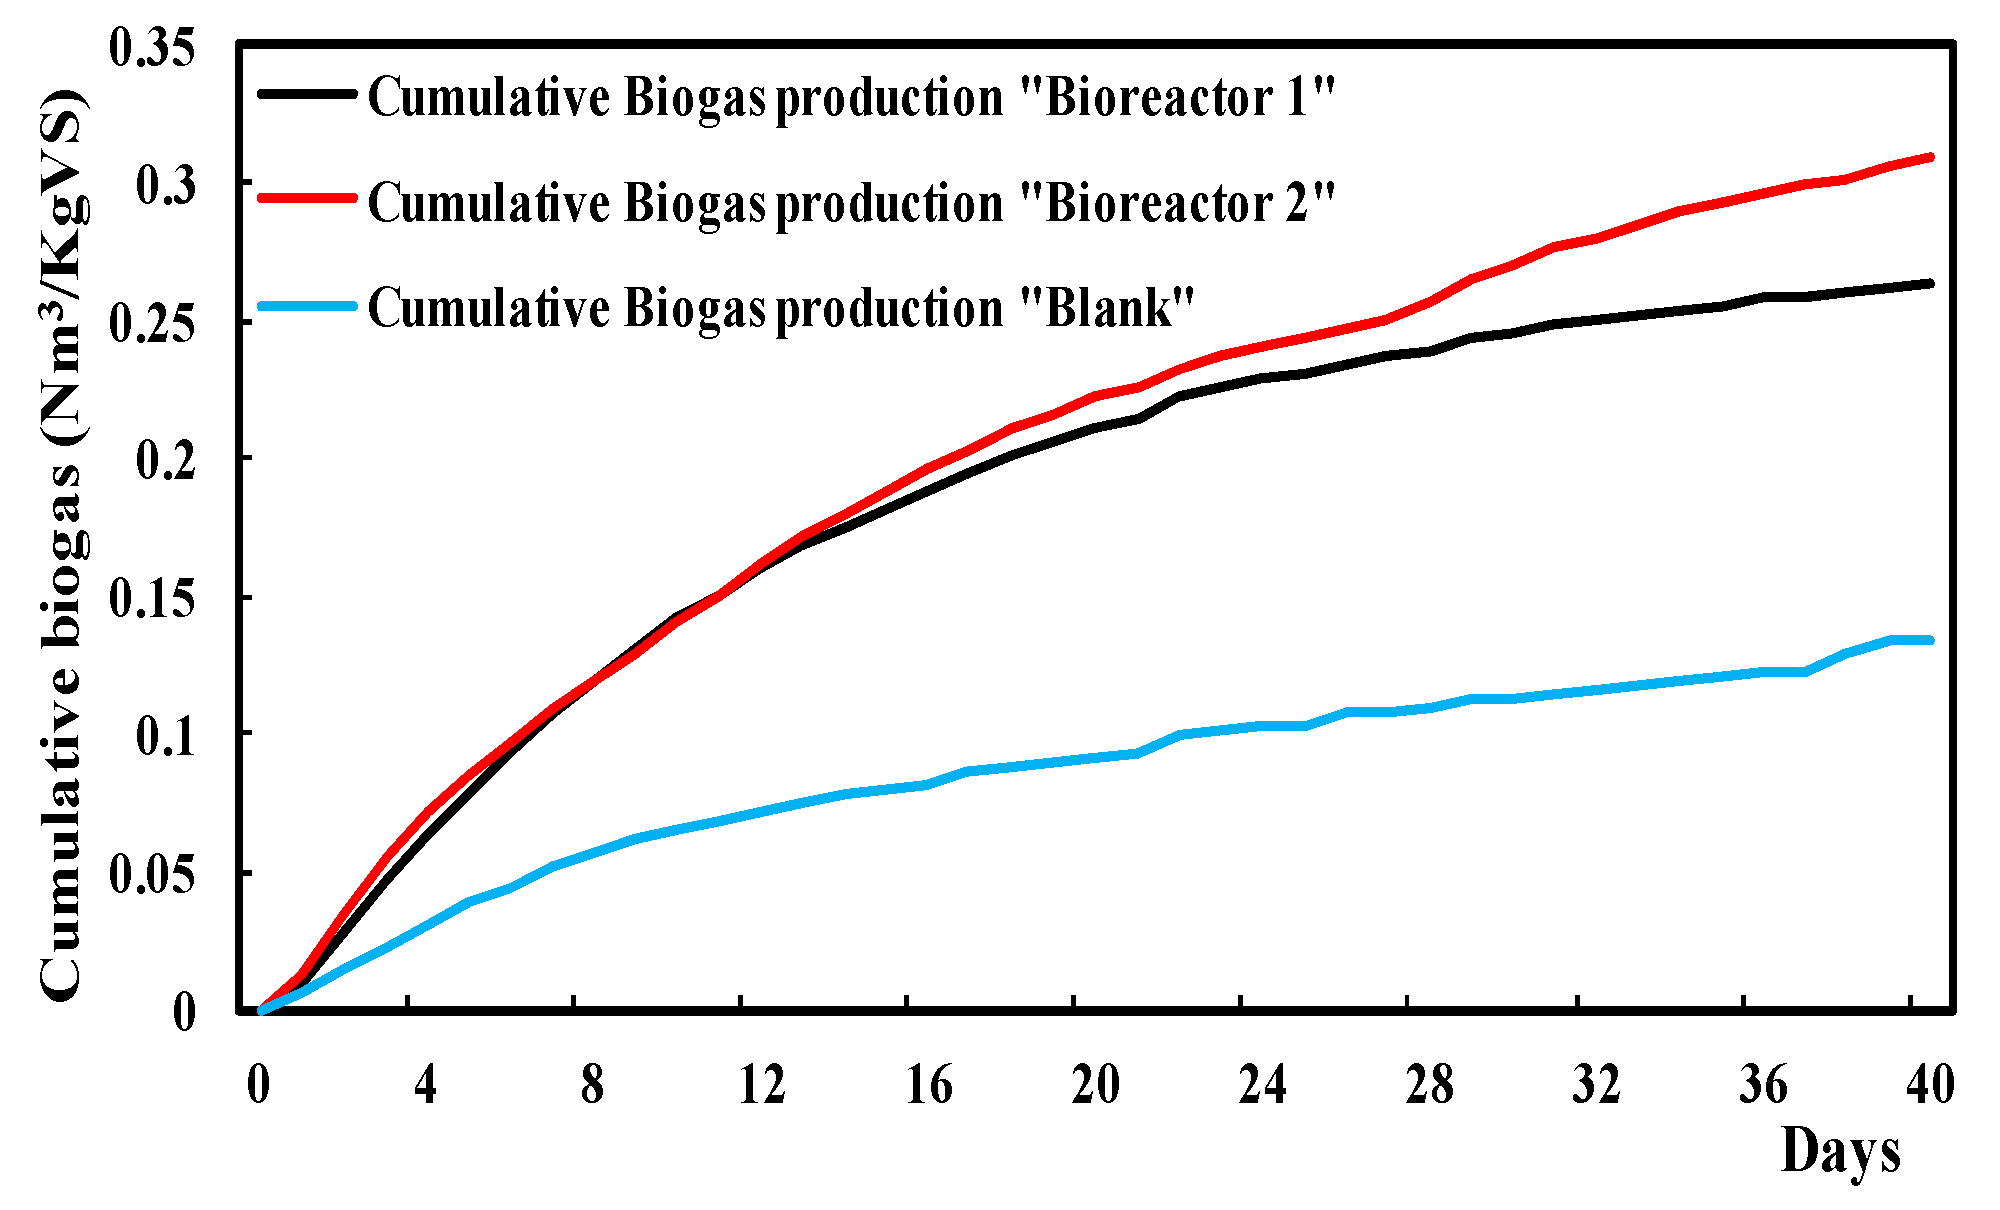
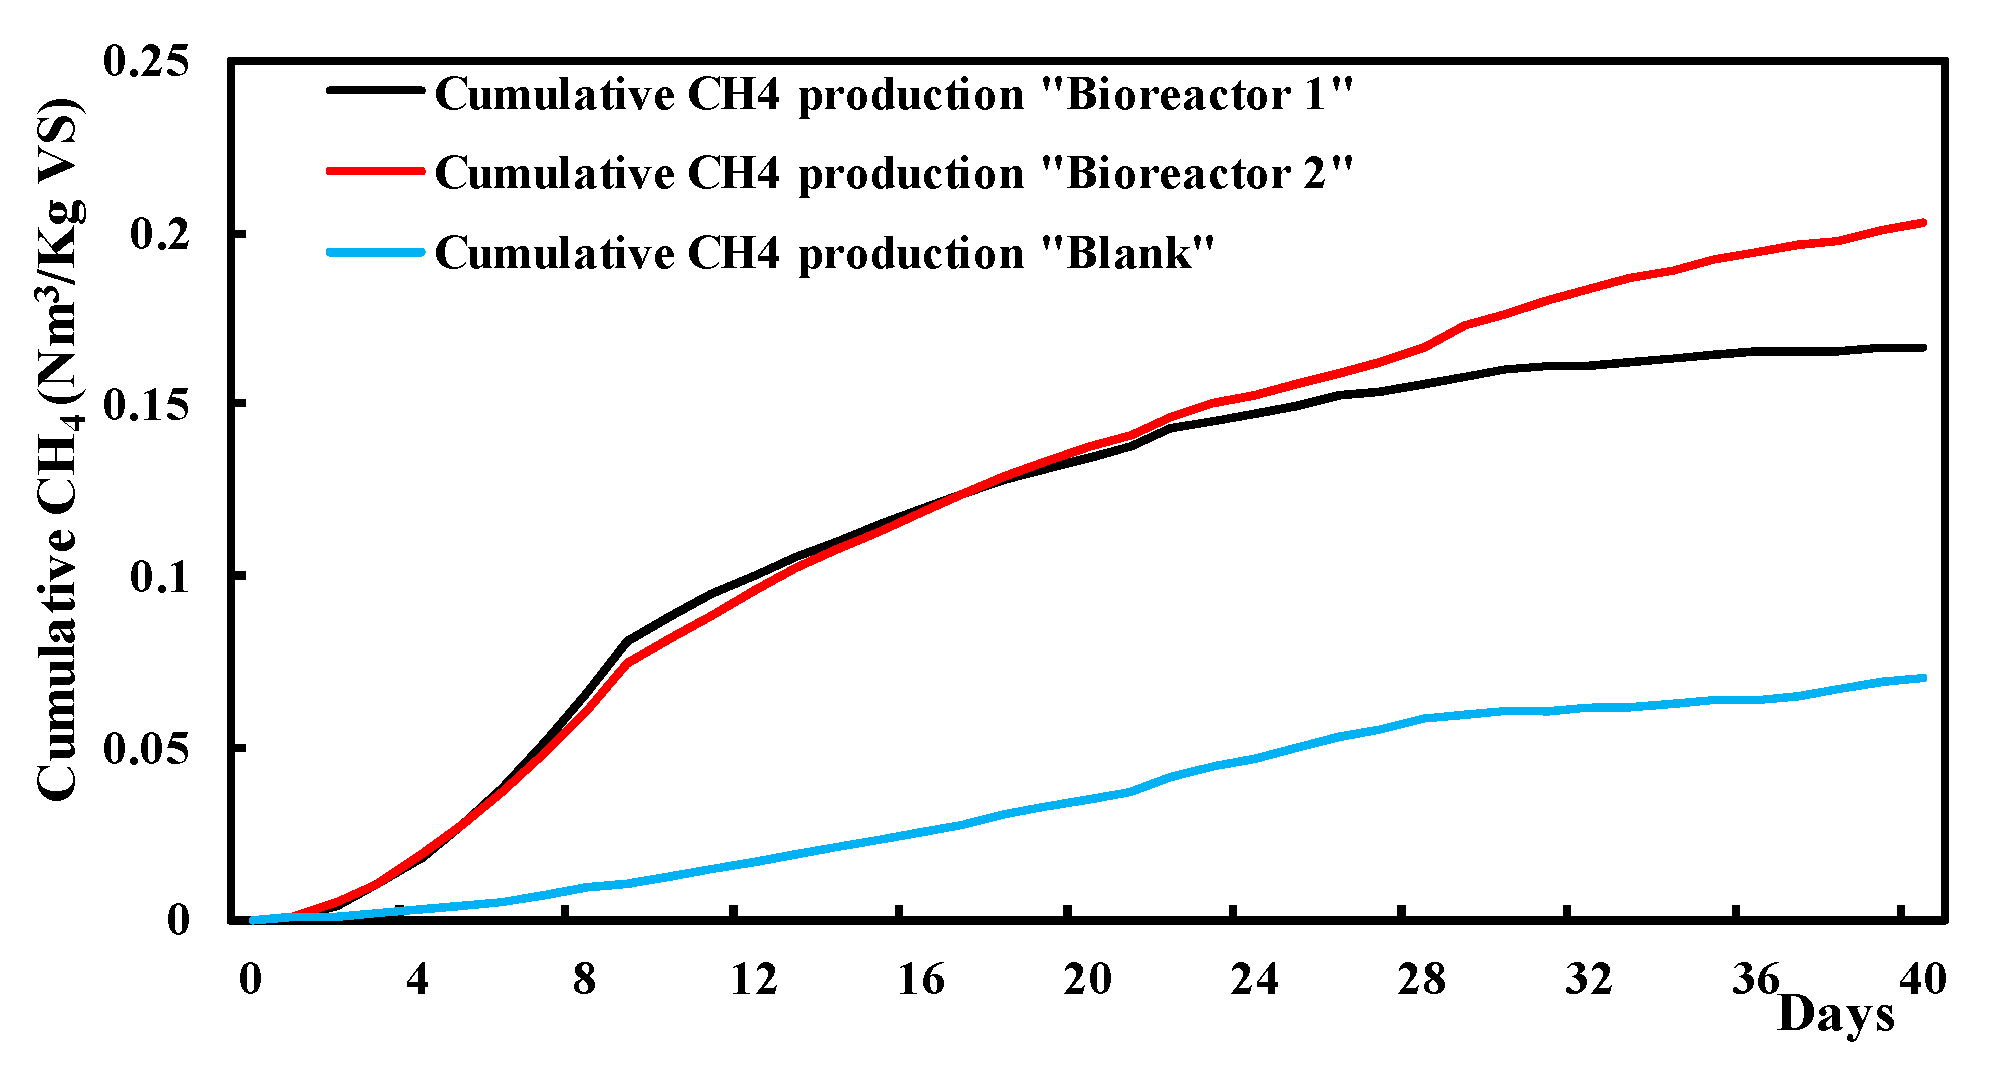
Daily and cumulative production profiles of biogas and bio-methane of the three bottles are respectively presented in Figure 2, Figure 3, Figure 4 and Figure 5. The measures were recorded under mesophilic temperature 35 °C, during the period of the BMP test using Equation (2).
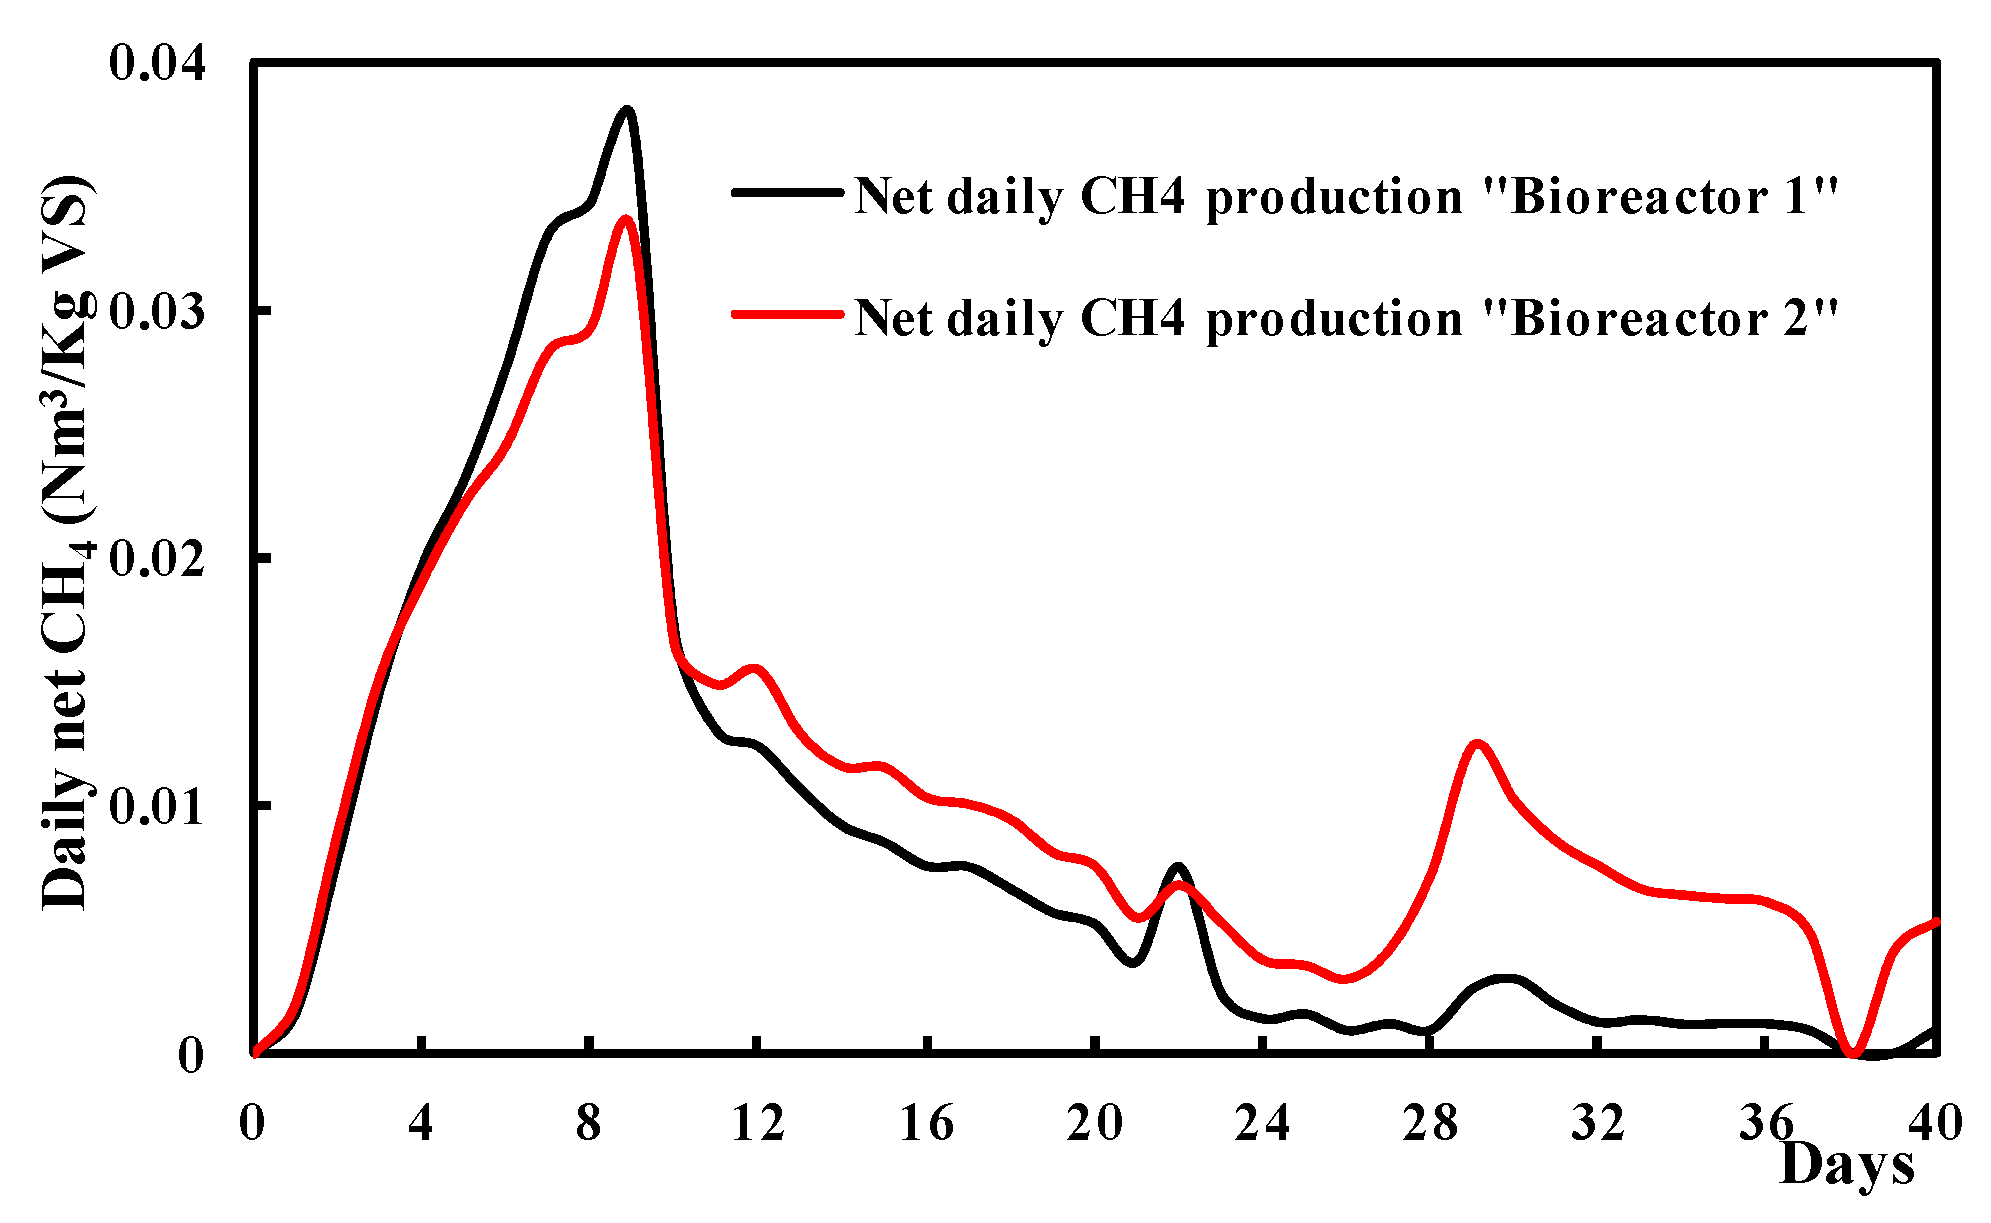
Figure 2 shows the startup of the anaerobic digestion process, which corresponds to the beginning of the organic matter degradation by microbial organisms in the bioreactor to form biogas. The degradation process takes 40 days under specific conditions. As can be seen from Figure 4, the degradation occurred without fluctuations in terms of the bio-methane production at the beginning, especially during the first nine days. The absence of fluctuations means that the degradation of the substrate started almost immediately, and proceeds without problems in all the digestion periods. Thus, bio-methane production is significantly increased. This result is in good agreement with that found by the work of Maamri and Amrani [59], in which they showed that, due to the exponential growth of microorganisms and to their higher adaptation in the anaerobic climate, they can produce the biogas/bio-methane immediately. Anaerobic fermentation of organic wastes is a process that involves various bacterial species, such as hydrolytic, acid-forming, acetogenic, and methanogenic bacteria which have respectively CO2, H2, CH3COOH, and CH4 as main products. During the degradation process, only 30% of the methane produced comes from CO2 reduction carried out by specific methane bacteria [60]. As a result, Figure 2 showed that the biogas started to drop after day 4 because of the decrease in CO2 production. However, bio-methane kept increasing until day 9 (Figure 4). The substrate of digestion is consumed continuously following anaerobic digestion, contributing to a decrease in the biogas/bio-methane production [61]. In this work, biogas/bio-methane production decreased after the production peak respectively in day 4, Figure 2, and day 9, Figure 4. The difference in the daily outputs among all the experimental groups decreased with time. The gas production was also decreased on completion of 40 days of digestion. In addition, it can be seen from graph 2 and graph 4 that the two bioreactors experienced unsteady growth between days 22 and 29. In this period, fluctuations become observable. This is due to a change in temperature and the level of water in the bath, which changed the digestive environment. As shown in [62], variation in temperature of ±2 °C may affect the digestive environment. The AD takes place only under specific conditions, and the efficiency of the anaerobic process, the growth, and activity depend on several factors. Therefore, it is very important to ensure optimal conditions for the development of anaerobic microorganisms as stated by Stuhli [63].
Shapes of the plotted curves in Figure 3 and Figure 5 have similar behaviors. Koch et al. have proposed a simple method for evaluating the quality of BMP measurements, but it is powerful, which is the bio-methane production curves from the BMP test should have similar shapes for most assays [64]. Furthermore, Figure 3 and Figure 5 show an initial phase characterized by a low production rate, followed by a high production rate phase until a steady state is reached and is maintained in the final decaying phase. This is especially clear in the results of the 1st bioreactor (i.e., bottle1). Understanding the meaning of the bio-methane/biogas yield curves could afford the operator insight into the rate-limiting step (low production) of the test material during anaerobic digestion as shown by Filer et al. [62]. Curves of Figure 3 and Figure 5 are characterized by an important lag phase. In this case, Singh et al. [65] showed that the lag duration is needed by the different microbials to respond to changing environmental conditions. According to Nazaitulshila et al. [29], this rate-limiting first phase is suggested to take place during mass transfer between organic materials and bacteria and finally into microbial cells. As a result, the transport and transform mechanisms from the liquid phase to solid and biological degradation are becoming complicated. Furthermore, Angelidaki and Batstone [66] showed that the hydrolysis proceeds at various speeds depending on the nature of the waste, and, in some cases, it can be a rate-limiting step for the entire degradation process.
The specific biogas and bio-methane production yield in this study (expressed in Nm3/kg VS) are given by:
Y = Q ( VS )
According to Table 2, the VS of the global mixture is: VS = (0.1006 × 250)/1000 = 0.025 kg, and that of the blank (i.e., only the inoculums) is VS = (0.0714 × 227 g)/1000 = 0.0162 kg.
Table 4 summarizes the biogas/bio-methane specific rate values:
From the previous results, the bio-methane percentage in terms of specific rate is equal to 63.31%, 65.58%, and 51.49% in the total biogas production from bioreactor 1, bioreactor 2, and inoculums, respectively. These findings are in good agreement with those given in the literature, where the bio-methane production should exceed 50% [67].

3.3. Net Production of Biogas and Bio-Methane

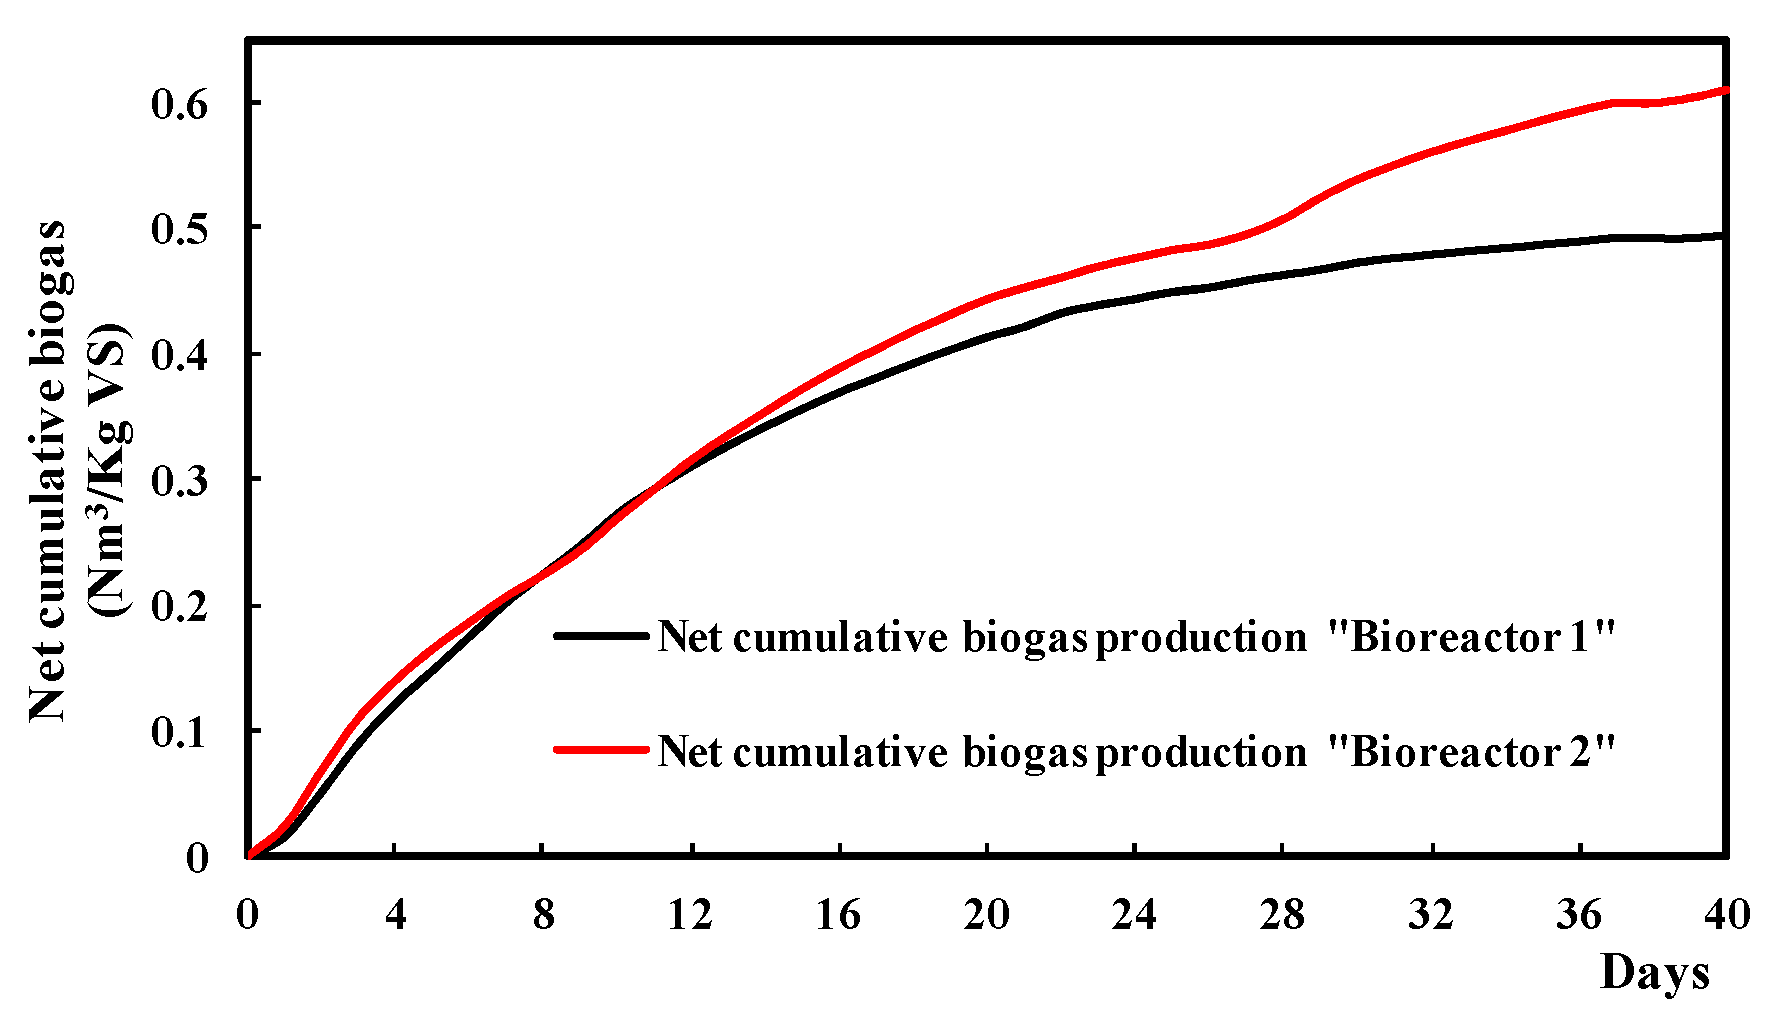
Graphical representation of net cumulative biogas/bio-methane production is shown in Figure 6 and Figure 7, respectively, for the two bioreactors (bottles) that contain both substrates and inoculums. The net biogas and bio-methane volume should be calculated to get the real yield of the substrate’s productions. Total biogas production should be corrected to get the net production. Equations (6) and (7) report material balances that give the net yields:
q net i = q bioreactor ( 1 or 2 ) j q inoculums j
Q net = j = 1 n q net j
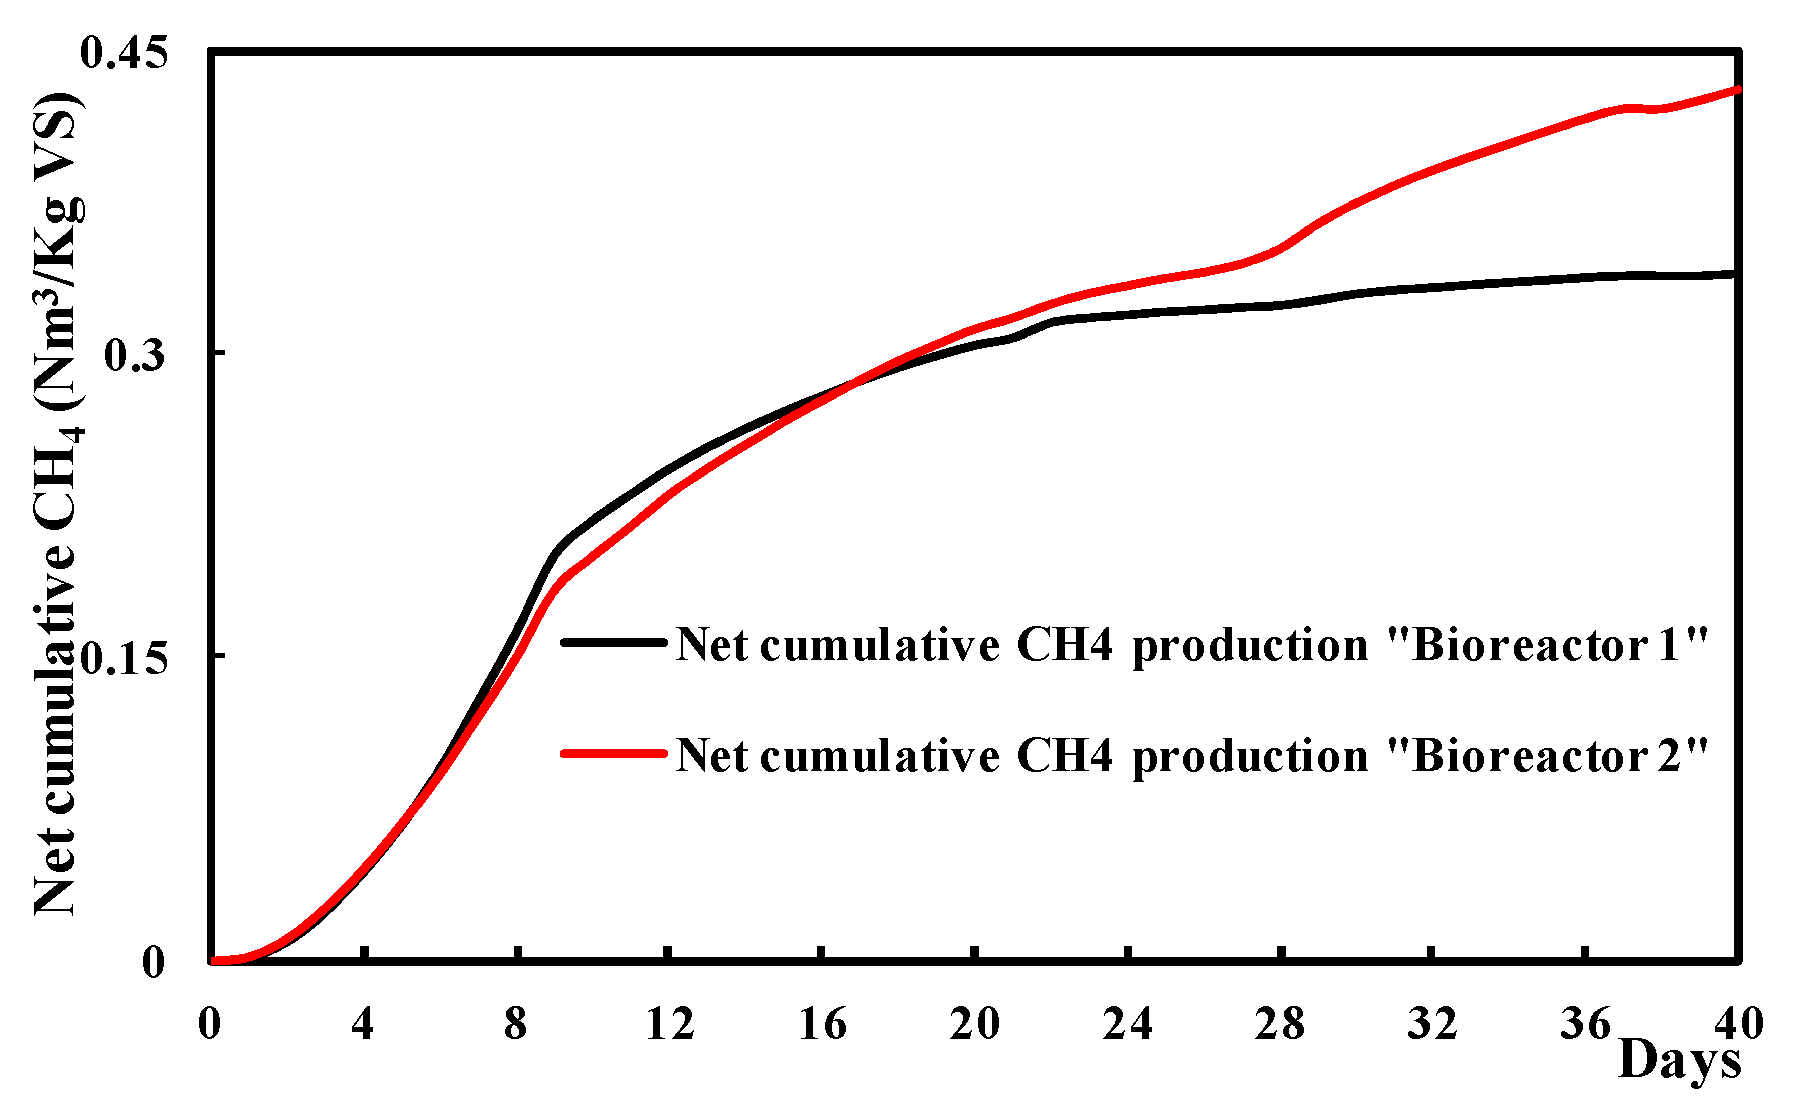
As it can be seen from Figure 6 and Figure 7, the biogas/bio-methane production of bioreactor 2 slightly becomes higher than bioreactor 1 from approximately the 24th day. This can be attributed to the experimental errors related to the sample preparation of substrates, the agitation manner, the microorganism’s decomposition in bioreactors, and the operator reading of the results. A quasi-asymptotic behavior of the cumulative productions is obtained from the day 28th until the end. Thereby, these results show the ability to determine the BMP using this method. For the final biogas/bio-methane production results, the obtained values on day 40 are used to give the specific yield.
The net yield of total bio-methane/biogas production is the ratio of the cumulative net production by the quantity of the tested VSsubstrates. That is:
Y net = Q net ( VS ) substrates
The specific net biogas potential values of the used substrates are equal to 0.493 and 0.610 Nm3/kg VS for bottles 1 and 2, respectively. As a result of this anaerobic digestion, the bio-methane net potential is equal to 0.338 and 0.430 Nm3/kg VS for bottle 1 and bottle 2, respectively. The two yields give respectively a rate equal to 68.60% and 70.52%, respectively. It should be noticed that the biogas composition mostly depends on the type of the organic matter and the anaerobic digestion conditions. Thus, various differences in chemical compositions could result from that. The chemical composition of biogas may be changed as follows: 40–60% CH4, 30–50% CO2, and small amounts of SO2 and NH3 [68]. Figure 8 shows the daily net bio-methane production for the two bottles, obtained from performing batch incubations over a period of 40 days. Bio-methane production rapidly occurred and achieves its maximum on the 9th day. Later, it decreases and practically stops around the 40th day.
The average value of net specific bio-methane potential, obtained from the two bioreactors of this study (which is equal to 0.384 Nm3/kg VS (i.e., 384 mL/g SV)), was close to the value found in the work of [69] for the anaerobic digestion of chicken manure, which was 382 (mL CH4/g SV). In addition, the net production, in this work, was higher than the studies of [70,71,72], which were respectively, 353 (mL CH4/g SV) for OFMSW and 300, 200(mL CH4/g SV) for CW. In this work, the used parameters for C/N ratio (26.78) and the S/I (0.588) under mesophilic conditions favored an optimal condition for the fermentation test. The work of [57] has demonstrated that an optimal anaerobic environment was obtained at a C/N ratio equal to 26.76 under mesophilic conditions, where there was a reduction in the inhibition level of ammonia accumulation. Thus, higher production of bio-methane was shown.

3.4. VS Reduction during the Anaerobic Digestion

The volatile solids represent the organic fraction (biodegradable and non-biodegradable), in both particulate and dissolved form, susceptible to be metabolized during the anaerobic digestion process [73]. Removal efficiency is considered a significant parameter in evaluating the performance of an AD process. In this case, Deepanraj et al. [74] showed that the degradation efficiency is a crucial factor when examining the anaerobic digestion performance. The organic substances of the bio-wastes are degraded and transformed into biogas during the AD process, and, consequently, a reduction of VS concentration will be obtained [75]. The percentage of reduction of the VS is therefore given by Equation (9) used in [76]:
( VS ) reduction ( % ) = ( 1 ( VS ) final ( VS ) global   mixture ) × 100
The obtained value of VS reduction was equal to 91%. This higher percentage is the result of the hydraulic retention time HRT, which seems to be sufficient to convert the almost VS. A similar result was obtained by Shi et al. [77]. Furthermore, they indicated that the HRT is an important operational parameter for the anaerobic reactors, which can affect the conversion of volatile solids VS into biogas. Bauer et al. [78] have shown that HRT affects the degree of substrate degradation (i.e., the percentage of organic matter that is converted to biogas). Appropriate HRT also contributes to more degradation of the organic matter in the reactor, resulting in less carbon in the digestive system.

4. Conclusions

In this study, three different substrates’ energies potentially available in the southern regions of Tunisia were tested to evaluate the biogas/bio-methane production using the BMP test. According to this work, all the inhibitors were kept in the optimal range respectively, 35 °C, 7, 26.78, and 0.588 for temperature T, pH, nutrients ratio C/N, and the abundance of the bacteria according to the ratio of the substrate S/I. The anaerobic digestion test lasted 40 days as the hydraulic retention time. As a result, the bio-methane production percentages were 63.31%, 65.58%, and 51.49% for the two bio-reactors (global mixture) and the blank (inoculums), respectively. The gas analysis showed other impurities’ gases which were N2, O2, H2, and finally CO2 as major gas after the CH4. The volatile solid reduction was 91% during the fermentation test.
The investigation of the net (real) bio-methane production per kg of volatile solids VS for the three substrates was as follows: 0.338 Nm3 bio-methane/kg VS and 0.430 Nm3 bio-methane/kg VS, respectively, for bio-reactors 1 and 2 which gave 68.60% and 70.52% of net bio-methane production from the total resulting in net biogas in the two bioreactors. The well-selected percent of the co-substrates and the optimal conditions gave an optimal anaerobic environment that reduced the negative effects of many inhibitors mainly the ammonia and volatile fatty acid accumulation. The net biogas/bio-methane production in comparison to the other works gave appreciate results.
The limitation of this work was the lack of statistical analysis and a recommendation; increasing the numbers of the replications/trials is very important to limit the gap between the different bottles. In reality, there is the issue of a lack of clear instructions for new operators to start BMP tests. Most BMP methodologies provide general guidelines to accommodate all substrates. As a result, it is difficult for a new operator to design a test with accuracy and confidence due to increased room for variation and misinterpretation. It might be useful to provide methodologies specific to certain groups of substrates.

Author Contributions

Conceptualization, M.M. and F.F. and N.T. and N.H.; methodology, F.L.; software, P.B.; validation, M.M., N.T. and N.H.; formal analysis, M.M.; investigation, M.M.; resources, F.F.; data curation, N.T. and N.H. and E.G.; writing—original draft preparation, M.M. and K.A.b.A.; writing—review and editing, M.M. and K.A.b.A.; visualization, M.M.; supervision, N.T. and N.H.; project administration, F.F.; funding acquisition, F.F. All authors have read and agreed to the published version of the manuscript.

Funding

This research was partially funded by EU, grant number LIFE 16 ENV/IT/000547. I-REXFO LIFE. i-REXFO LIFE (LIFE16ENV/IT/000547) is a project funded by the EU under the LIFE 2016 program.

Institutional Review Board Statement

Not applicable.

Informed Consent Statement

Not applicable.

Data Availability Statement

The data presented in this study are available on request from the corresponding author.

Acknowledgments

All of the authors would like to express their very great appreciation to the biogas station citied in the Umbria region (Italy) for their help providing us with the inoculums.

Conflicts of Interest

The authors declare no conflict of interest.

Nomenclature

ADAnaerobic digestion
ANGeDNational waste management agency
BMPBio-methanation potential test
CWChicken wastes or chicken dropping
(C/N)mixCarbon to nitrogen ratio of the mixture of the used bio-wastes
HRTHydraulic retention times
iBio-waste type
miMass of the substrate i (in g)
minoculumsMass of the inoculums (in g)
OFMSWOrganic fraction of municipal solid wastes
OMWWOlive mill wastewater
OLRsOrganic loading rates
P0Normal pressure (1 atm)
PmesMeasured gas pressure before the gas sampling (in bar),
QCumulative production of biogas/biomethane (in Nm3)
qjnetNet produced quantity of biogas/biomethane during day j (in Nm3)
qjbioreactor (1 or 2)Produced quantity of biogas/biomethane in bioreactor 1 or 2 during day (j)
qjinoculumsProduced quantity of biogas/biomethane in the blank during day (j)
QnetNet cumulative production of biogas/biomethane (in Nm3)
(S/I)Ratio between the (VS) of the substrate and the (VS) of the inoculums
TrBioreactor temperature (in K)
T0Normal temperature (273.15 K)
VFAVolatile fatty acids
(VS)Volatile solids
VSUsed mass in the bottles and/or in the inoculums
(VS)substrate Volatile solid of the substrates
(VS)inoculumsVolatile solid of the inoculums
(VS)global mixtureVolatile solid of the global mixture
(VS)iUsed mass of the VS for the substrate i
VnetjDaily biogas production (in(Nm3)
(VS)0Used initial mass of (VS) of the used substrates.
VbiogasDaily biogas production volume (in NL)
VrHeadspace volume of the bioreactor
xi = ((Mi/mmix) × 100)Mass percentage of the substrate i in the mass of the mixture
y i v s Percent of (VS) in the substrate i
y i n o c u l u m s v s Percentage of the (VS) in the inoculums
YSpecific yield of biogas/biomethane (in Nm3/Kg VS)
YnetSpecific net potential value of biogas/biomethane (in Nm3/kg VS)

References

  1. Araujo, V.K.A.; de Almeida, S.; de Oliveira, S.B.; Calixto, W.P.; Furriel, G.P.; Barbosa, D.P. Anaerobic Digestion Using Residue of Soybean Processing: Biogas Production and It Is Potential to Generate Energy. In Proceedings of the 2017 18th International Scientific Conference on Electric Power Engineering (EPE), Kouty nad Desnou, Czech Republic, 17–19 May 2017; IEEE: Kouty nad Desnou, Czech Republic, 2017; pp. 1–4. [Google Scholar] [CrossRef]
  2. Achinas, S.; Achinas, V.; Euverink, G.J.W. A Technological Overview of Biogas Production from Biowaste. Engineering 2017, 3, 299–307. [Google Scholar] [CrossRef]
  3. Amon, T.; Amon, B.; Kryvoruchko, V.; Machmüller, A.; Hopfner-Sixt, K.; Bodiroza, V.; Hrbek, R.; Friedel, J.; Pötsch, E.; Wagentristl, H.; et al. Methane Production through Anaerobic Digestion of Various Energy Crops Grown in Sustainable Crop Rotations. Bioresour. Technol. 2007, 98, 3204–3212. [Google Scholar] [CrossRef] [PubMed]
  4. Khan, I.U. Biogas as a Renewable Energy Fuel—A Review of Biogas Upgrading, Utilisation and Storage. Energy Convers. Manag. 2017, 150, 277–294. [Google Scholar] [CrossRef]
  5. Barragán-Escandón, A.; Ruiz, J.M.O.; Tigre, J.D.C.; Zalamea-León, E.F. Assessment of Power Generation Using Biogas from Landfills in an Equatorial Tropical Context. Sustainability 2020, 12, 2669. [Google Scholar] [CrossRef] [Green Version]
  6. Kaparaju, P.; Rintala, J. Generation of Heat and Power from Biogas for Stationary Applications: Boilers, Gas Engines and Turbines, Combined Heat and Power (CHP) Plants and Fuel Cells. In The Biogas Handbook; Elsevier: Amsterdam, The Netherlands, 2013; pp. 404–427. [Google Scholar] [CrossRef]
  7. Asam, Z.-Z.; Poulsen, T.G.; Nizami, A.-S.; Rafique, R.; Kiely, G.; Murphy, J.D. How Can We Improve Biomethane Production per Unit of Feedstock in Biogas Plants? Appl. Energy 2011, 88, 2013–2018. [Google Scholar] [CrossRef]
  8. Yan, H.; Zhao, C.; Zhang, J.; Zhang, R.; Xue, C.; Liu, G.; Chen, C. Study on Biomethane Production and Biodegradability of Different Leafy Vegetables in Anaerobic Digestion. AMB Express 2017, 7, 27. [Google Scholar] [CrossRef] [Green Version]
  9. Seppälä, M.; Pyykkönen, V.; Väisänen, A.; Rintala, J. Biomethane Production from Maize and Liquid Cow Manure—Effect of Share of Maize, Post-Methanation Potential and Digestate Characteristics. Fuel 2013, 107, 209–216. [Google Scholar] [CrossRef]
  10. Sghari, M.B.A.; Hammami, S. Energy, Pollution, and Economic Development in Tunisia. Energy Rep. 2016, 2, 35–39. [Google Scholar] [CrossRef] [Green Version]
  11. Rocher, L.; Verdeil, É. Energy Transition and Revolution in Tunisia: Politics and Spatiality. Arab World Geogr. 2013, 16, 26. [Google Scholar]
  12. Available online: https://www.reeep.org/tunisia-2012 (accessed on 20 November 2019).
  13. ANME; GTZ. Etude Sur Le Développement de La Méthanisation Industrielle: Etat Des Lieux de La Méthanisation Industrielle En Tunisie; Alcor, Tunisia, 2010. Available online: https://energypedia.info/images/7/77/FR_M%C3%A9thanisation_industrielle_Alcor_2010_GIZ_-_ANME.pdf (accessed on 9 October 2020).
  14. Getahun, T.; Gebrehiwot, M.; Ambelu, A.; Van Gerven, T.; Van der Bruggen, B. The Potential of Biogas Production from Municipal Solid Waste in a Tropical Climate. Environ. Monit. Assess. 2014. [Google Scholar] [CrossRef]
  15. Jurgutis, L.; Slepetiene, A.; Volungevicius, J.; Amaleviciute-Volunge, K. Biogas Production from Chicken Manure at Different Organic Loading Rates in a Mesophilic Full Scale Anaerobic Digestion Plant. Biomass Bioenergy 2020, 141, 105693. [Google Scholar] [CrossRef]
  16. Alrawashdeh, K.A.b.; Gul, E.; Yang, Q.; Yang, H.; Bartocci, P.; Fantozzi, F. Effect of Heavy Metals in the Performance of Anaerobic Digestion of Olive Mill Waste. Processes 2020, 8, 1146. [Google Scholar] [CrossRef]
  17. Ulusoy, Y.; Ulukardesler, A.H. Biogas Production Potential of Olive-Mill Wastes in Turkey. In Proceedings of the 2017 IEEE 6th International Conference on Renewable Energy Research and Applications (ICRERA), San Diego, CA, USA, 5–8 November 2017; IEEE: San Diego, CA, USA, 2017; pp. 664–668. [Google Scholar] [CrossRef]
  18. Cheong, D.-Y.; Harvey, J.T.; Kim, J.; Lee, C. Improving Biomethanation of Chicken Manure by Co-Digestion with Ethanol Plant Effluent. Int. J. Environ. Res. Public Health 2019, 16, 5023. [Google Scholar] [CrossRef] [Green Version]
  19. Wang, F.; Pei, M.; Qiu, L.; Yao, Y.; Zhang, C.; Qiang, H. Performance of Anaerobic Digestion of Chicken Manure Under Gradually Elevated Organic Loading Rates. Int. J. Environ. Res. Public Health 2019, 16, 2239. [Google Scholar] [CrossRef] [Green Version]
  20. Stan, C.; Collaguazo, G.; Streche, C.; Apostol, T.; Cocarta, D. Pilot-Scale Anaerobic Co-Digestion of the OFMSW: Improving Biogas Production and Startup. Sustainability 2018, 10, 1939. [Google Scholar] [CrossRef] [Green Version]
  21. Al bkoor Alrawashdeh, K. Improving Anaerobic Co-Digestion of Sewage Sludge with Thermal Dried Olive Mill Wastewater. Waste Biomass Valor. 2019, 10, 2213–2219. [Google Scholar] [CrossRef]
  22. Kulkarni, M.B. Pretreatment Methods in Anaerobic Digestion for Biogas Generation: A Review. Int. J. New Innov. Eng. Technol. 2015, 4, 5. [Google Scholar]
  23. Tyagi, V.K.; Fdez-Güelfo, L.A.; Zhou, Y.; Álvarez-Gallego, C.J.; Garcia, L.I.R.; Ng, W.J. Anaerobic Co-Digestion of Organic Fraction of Municipal Solid Waste (OFMSW): Progress and Challenges. Renew. Sustain. Energy Rev. 2018, 93, 380–399. [Google Scholar] [CrossRef]
  24. Achinas, S.; Euverink, G. Effect of Combined Inoculation on Biogas Production from Hardly Degradable Material. Energies 2019, 12, 217. [Google Scholar] [CrossRef] [Green Version]
  25. Holliger, C.; Alves, M.; Andrade, D.; Angelidaki, I.; Astals, S.; Baier, U.; Bougrier, C.; Buffière, P.; Carballa, M.; de Wilde, V.; et al. Towards a Standardization of Biomethane Potential Tests. Water Sci. Technol. 2016, 74, 2515–2522. [Google Scholar] [CrossRef]
  26. Liberti, F.; Pistolesi, V.; Mouftahi, M.; Hidouri, N.; Bartocci, P.; Massoli, S.; Zampilli, M.; Fantozzi, F. An Incubation System to Enhance Biogas and Methane Production: A Case Study of an Existing Biogas Plant in Umbria, Italy. Processes 2019, 7, 925. [Google Scholar] [CrossRef] [Green Version]
  27. Sri Bala Kameswari, K.; Kalyanaraman, C.; Porselvam, S.; Thanasekaran, K. Optimization of Inoculum to Substrate Ratio for Bio-Energy Generation in Co-Digestion of Tannery Solid Wastes. Clean Technol. Environ. Policy 2012, 14, 241–250. [Google Scholar] [CrossRef]
  28. Zhou, Y.; Zhang, Z.; Nakamoto, T.; Li, Y.; Yang, Y.; Utsumi, M.; Sugiura, N. Influence of Substrate-to-Inoculum Ratio on the Batch Anaerobic Digestion of Bean Curd Refuse-Okara under Mesophilic Conditions. Biomass Bioenergy 2011, 35, 3251–3256. [Google Scholar] [CrossRef]
  29. Nazaitulshila, R.; Idris, A.; Harun, R.; Wan Azlina, W.A.K.G. The Influence of Inoculum to Substrate Ratio on the Biochemical Methane Potential of Fat, Oil, and Grease in Batch Anaerobic Assays. Energy Sources Part A Recovery Util. Environ. Eff. 2015, 37, 590–597. [Google Scholar] [CrossRef]
  30. Giovanna, G.; Claudia, C.; Filomena, D.C.; Stefania, P.; Biagio, M.; Mario, M. Does the c/n Ration Really Affect the Biomethane Yield? A Three Years Investigation of Buffalo Manure Digestion. Chem. Eng. Trans. 2016, 49, 463–468. [Google Scholar] [CrossRef]
  31. Tanimu, M.I.; Ghazi, T.I.M.; Harun, R.M.; Idris, A. Effect of Carbon to Nitrogen Ratio of Food Waste on Biogas Methane Production in a Batch Mesophilic Anaerobic Digester. Int. J. Innov. 2014, 5, 4. [Google Scholar]
  32. Teklehaimanot, T.G. Biogas Generation and Main Factors Affecting in the Production of Biogas: Review. Int. J. Adv. Technol. Innov. Res. 2018, 10, 4. [Google Scholar]
  33. Fantozzi, F.; Buratti, C. Anaerobic Digestion of Mechanically Treated OFMSW: Experimental Data on Biogas/Methane Production and Residues Characterization. Bioresour. Technol. 2011, 102, 8885–8892. [Google Scholar] [CrossRef]
  34. Fantozzi, F.; Pistolesi, V.; Massoli, S.; Pugliese, A.; Bidini, G. Anaerobic Digestion of Spoiled Milk in Batch Reactors: Technical and Economic Feasibility. Energy Procedia 2015, 81, 309–318. [Google Scholar] [CrossRef] [Green Version]
  35. Buratti, C.; Barbanera, M.; Bartocci, P.; Fantozzi, F. Thermogravimetric Analysis of the Behavior of Sub-Bituminous Coal and Cellulosic Ethanol Residue during Co-Combustion. Bioresour. Technol. 2015, 186, 154–162. [Google Scholar] [CrossRef]
  36. European Committee for Standardization. CEN/TS 14774. Methods for Determination of Moisture Content—Oven Dry Method—Part 3: Moisture in the Analysis Sample; European Committee for Standardization: Brussels, Belgium, 2015. [Google Scholar]
  37. European Committee for Standardization. CEN/TS 14775. Method for the Determination of Ash Content; European Committee for Standardization: Brussels, Belgium, 2004. [Google Scholar]
  38. European Committee for Standardization. CEN/TS 15148. Solid Biofuels—Method for the Determination of the Content of Volatile Matter; European Committee for Standardization: Brussels, Belgium, 2015. [Google Scholar]
  39. European Committee for Standardization. CEN/TS 14780. Solid Biofuels—Methods for Sample Preparation; European Committee for Standardization: Brussels, Belgium, 2017. [Google Scholar]
  40. European Committee for Standardization. CEN/TS 15104. Solid biofuels. Determination of Total Content of Carbon, Hydrogen and Nitrogen—Instrumental Methods; European Committee for Standardization: Brussels, Belgium, 2001. [Google Scholar]
  41. Hajji, A.; Rhachi, M.; Garoum, M.; Laaroussi, N. The Effects of PH, Temperature and Agitation on Biogas Production under Mesophilic Regime. In Proceedings of the 2016 3rd International Conference on Renewable Energies for Developing Countries (REDEC), Zouk Mosbeh, Lebanon, 13–15 July 2016; IEEE: Zouk Mosbeh, Lebanon, 2016; pp. 1–4. [Google Scholar] [CrossRef]
  42. Mawaheb, M.; Nejib, H.; Nawel, T.; Ammar, B.B. Experimental Study of Biomethane Production from Organic Discharges. In Proceedings of the 2019 10th International Renewable Energy Congress (IREC), Sousse, Tunisia, 26–28 March 2019; IEEE: Sousse, Tunisia, 2019; pp. 1–4. [Google Scholar] [CrossRef]
  43. Angelidaki, I.; Alves, M.; Bolzonella, D.; Borzacconi, L.; Campos, J.L.; Guwy, A.J.; Kalyuzhnyi, S.; Jenicek, P.; van Lier, J.B. Defining the Biomethane Potential (BMP) of Solid Organic Wastes and Energy Crops: A Proposed Protocol for Batch Assays. Water Sci. Technol. 2009, 59, 927–934. [Google Scholar] [CrossRef] [Green Version]
  44. Wang, B.; Björn, A.; Strömberg, S.; Nges, I.A.; Nistor, M.; Liu, J. Evaluating the Influences of Mixing Strategies on the Biochemical Methane Potential Test. J. Environ. Manag. 2017, 185, 54–59. [Google Scholar] [CrossRef]
  45. Rahman, M.A.; Møller, H.B.; Saha, C.K.; Alam, M.M.; Wahid, R.; Feng, L. Optimal Ratio for Anaerobic Co-Digestion of Poultry Droppings and Lignocellulosic-Rich Substrates for Enhanced Biogas Production. Energy Sustain. Dev. 2017, 39, 59–66. [Google Scholar] [CrossRef]
  46. Pecorini, I.; Olivieri, T.; Bacchi, D.; Paradisi, A.; Corti, A.; Carnevale, E. Evaluation of Gas Production in a Industrial Anaerobic Digester by Means of Biochemical Methane Potential of Organic Municipal Solid Waste Components. Proteins 2012, 33, 24. [Google Scholar]
  47. Wellinger, A.; Murphy, J.; Baxter, D. The Biogas Handbook; Woodhead Publishing Limited: Sawston, UK; Cambridge, UK, 2013. [Google Scholar] [CrossRef]
  48. Voicea, I.; Gageanu, I.; Matache, M.; Vladut, V. Innovative technology for obtaining bioenergy through the process of advanced anaerobic digestion. Eng. Rural Dev. 2017, 6, 24–26. [Google Scholar]
  49. Ahn, H.K.; Smith, M.C.; Kondrad, S.L.; White, J.W. Evaluation of Biogas Production Potential by Dry Anaerobic Digestion of Switchgrass–Animal Manure Mixtures. Appl. Biochem. Biotechnol. 2010, 160, 965–975. [Google Scholar] [CrossRef]
  50. Puyuelo, B.; Ponsá, S.; Gea, T.; Sánchez, A. Determining C/N Ratios for Typical Organic Wastes Using Biodegradable Fractions. Chemosphere 2011, 85, 653–659. [Google Scholar] [CrossRef] [Green Version]
  51. García-Gómez, A. Composting of the Solid Fraction of Olive Mill Wastewater with Olive Leaves: Organic Matter Degradation and Biological Activity. Bioresour. Technol. 2003, 86, 59–64. [Google Scholar] [CrossRef]
  52. Şevik, F.; Tosun, İ.; Ekinci, K. Composting of Olive Processing Wastes and Tomato Stalks Together with Sewage Sludge or Dairy Manure. Int. J. Environ. Sci. Technol. 2016, 13, 1207–1218. [Google Scholar] [CrossRef] [Green Version]
  53. Mir, M.A.; Hussain, A.; Verma, C. Design Considerations and Operational Performance of Anaerobic Digester: A Review. Cogent Eng. 2016, 3. [Google Scholar] [CrossRef]
  54. Dioha, I.J.; Ikeme, C.H.; Nafi’u, T.; Soba, N.I. Effect of carbon to nitrogen ratio on biogas production. Int. Res. J. Nat. Sci. 2013, 1, 10. [Google Scholar]
  55. Rabii, A.; Aldin, S.; Dahman, Y.; Elbeshbishy, E. A Review on Anaerobic Co-Digestion with a Focus on the Microbial Populations and the Effect of Multi-Stage Digester Configuration. Energies 2019, 12, 1106. [Google Scholar] [CrossRef] [Green Version]
  56. Palaniveloo, K.; Amran, M.A.; Norhashim, N.A.; Mohamad-Fauzi, N.; Peng-Hui, F.; Hui-Wen, L.; Kai-Lin, Y.; Jiale, L.; Chian-Yee, M.G.; Jing-Yi, L.; et al. Food Waste Composting and Microbial Community Structure Profiling. Processes 2020, 8, 723. [Google Scholar] [CrossRef]
  57. Wang, X.; Lu, X.; Li, F.; Yang, G. Effects of Temperature and Carbon-Nitrogen (C/N) Ratio on the Performance of Anaerobic Co-Digestion of Dairy Manure, Chicken Manure and Rice Straw: Focusing on Ammonia Inhibition. PLoS ONE 2014, 9, e97265. [Google Scholar] [CrossRef] [Green Version]
  58. Caillet, H.; Lebon, E.; Akinlabi, E.; Madyira, D.; Adelard, L. Influence of Inoculum to Substrate Ratio on Methane Production in Biochemical Methane Potential (BMP) Tests of Sugarcane Distillery Waste Water. Procedia Manuf. 2019, 35, 259–264. [Google Scholar] [CrossRef]
  59. Maamri, S.; Amrani, M. Biogas Production from Waste Activated Sludge Using Cattle Dung Inoculums: Effect of Total Solid Contents and Kinetics Study. Energy Procedia 2014, 50, 352–359. [Google Scholar] [CrossRef] [Green Version]
  60. Ali Shah, F.; Mahmood, Q.; Maroof Shah, M.; Pervez, A.; Ahmad Asad, S. Microbial Ecology of Anaerobic Digesters: The Key Players of Anaerobiosis. Sci. World J. 2014, 2014, 1–21. [Google Scholar] [CrossRef]
  61. Liu, C.; Tong, Q.; Li, Y.; Wang, N.; Liu, B.; Zhang, X. Biogas Production and Metal Passivation Analysis during Anaerobic Digestion of Pig Manure: Effects of a Magnetic Fe3O4 /FA Composite Supplement. RSC Adv. 2019, 9, 4488–4498. [Google Scholar] [CrossRef] [Green Version]
  62. Filer, J.; Ding, H.H.; Chang, S. Biochemical Methane Potential (BMP) Assay Method for Anaerobic Digestion Research. Water 2019, 11, 921. [Google Scholar] [CrossRef] [Green Version]
  63. Stuhli, V. Defining key parameters to control the anaerobic digestion of organic matter. In Proceedings of the 4th International Symposium on Environmental Management—Towards Circular Economy, Zagreb, Croatia, 7–9 December 2016. [Google Scholar]
  64. Koch, K.; Hafner, S.D.; Weinrich, S.; Astals, S. Identification of Critical Problems in Biochemical Methane Potential (BMP) Tests From Methane Production Curves. Front. Environ. Sci. 2019, 7, 178. [Google Scholar] [CrossRef]
  65. Singh, B.; Szamosi, Z.; Siménfalvi, Z. Impact of Mixing Intensity and Duration on Biogas Production in an Anaerobic Digester: A Review. Crit. Rev. Biotechnol. 2020, 40, 508–521. [Google Scholar] [CrossRef] [PubMed] [Green Version]
  66. Angelidaki, I.; Batstone, D.J. Anaerobic Digestion: Process. In Solid Waste Technology & Management; Christensen, T.H., Ed.; John Wiley & Sons, Ltd.: Chichester, UK, 2010; pp. 583–600. [Google Scholar] [CrossRef]
  67. Dimitrov, R.; Ivanov, Z.; Zlateva, P.; Mihaylov, V. Optimization of Biogas Composition in Experimental Studies. E3S Web Conf. 2019, 112, 02007. [Google Scholar] [CrossRef]
  68. Teng, Z.; Hua, J.; Wang, C.; Lu, X. Design and Optimization Principles of Biogas Reactors in Large Scale Applications. In Reactor and Process Design in Sustainable Energy Technology; Elsevier: Amsterdam, The Netherlands, 2014; pp. 99–134. [Google Scholar] [CrossRef]
  69. Ponsá, S.; Gea, T.; Sánchez, A. Anaerobic Co-Digestion of the Organic Fraction of Municipal Solid Waste with Several Pure Organic Co-Substrates. Biosyst. Eng. 2011, 108, 352–360. [Google Scholar] [CrossRef] [Green Version]
  70. El-Mashad, H.M.; Zhang, R. Biogas Production from Co-Digestion of Dairy Manure and Food Waste. Bioresour. Technol. 2010, 101, 4021–4028. [Google Scholar] [CrossRef]
  71. Meena, K.; Kumar, V.; Vijay, V.K. Anaerobic Technology Harnessed Fully by Using Different Techniques: Review. In Proceedings of the 2011 IEEE Conference on Clean Energy and Technology (CET), Kuala Lumpur, Malaysia, 27–29 June 2011; IEEE: Kuala Lumpur, Malaysia, 2011; pp. 78–82. [Google Scholar] [CrossRef]
  72. Toklu, E. Biomass Energy Potential and Utilization in Turkey. Renew. Energy 2017, 107, 235–244. [Google Scholar] [CrossRef]
  73. Rubio, J.A.; Romero, L.I.; Wilkie, A.C.; García-Morales, J.L. Mesophilic Anaerobic Co-Digestion of Olive-Mill Waste With Cattle Manure: Effects of Mixture Ratio. Front. Sustain. Food Syst. 2019, 3, 9. [Google Scholar] [CrossRef]
  74. Deepanraj, B.; Senthilkumar, N.; Ranjitha, J. Effect of Solid Concentration on Biogas Production through Anaerobic Digestion of Rapeseed Oil Cake. Energy Sources Part A Recovery Util. Environ. Eff. 2019, 1–8. [Google Scholar] [CrossRef]
  75. Pramanik, S.K.; Suja, F.B.; Porhemmat, M.; Pramanik, B.K. Performance and Kinetic Model of a Single-Stage Anaerobic Digestion System Operated at Different Successive Operating Stages for the Treatment of Food Waste. Processes 2019, 7, 600. [Google Scholar] [CrossRef] [Green Version]
  76. Bhattacharya, S.K.; Madura, R.L.; Walling, D.A.; Farrell, J.B. Volatile Solids Reduction in Two-Phase and Conventional Anaerobic Sludge Digestion. Water Res. 1996, 30, 1041–1048. [Google Scholar] [CrossRef]
  77. Shi, X.-S.; Dong, J.-J.; Yu, J.-H.; Yin, H.; Hu, S.-M.; Huang, S.-X.; Yuan, X.-Z. Effect of Hydraulic Retention Time on Anaerobic Digestion of Wheat Straw in the Semicontinuous Continuous Stirred-Tank Reactors. BioMed Res. Int. 2017, 2017, 1–6. [Google Scholar] [CrossRef]
  78. Bauer, A.; Mayr, H.; Hopfner-Sixt, K.; Amon, T. Detailed Monitoring of Two Biogas Plants and Mechanical Solid–Liquid Separation of Fermentation Residues. J. Biotechnol. 2009, 142, 56–63. [Google Scholar] [CrossRef] [PubMed]
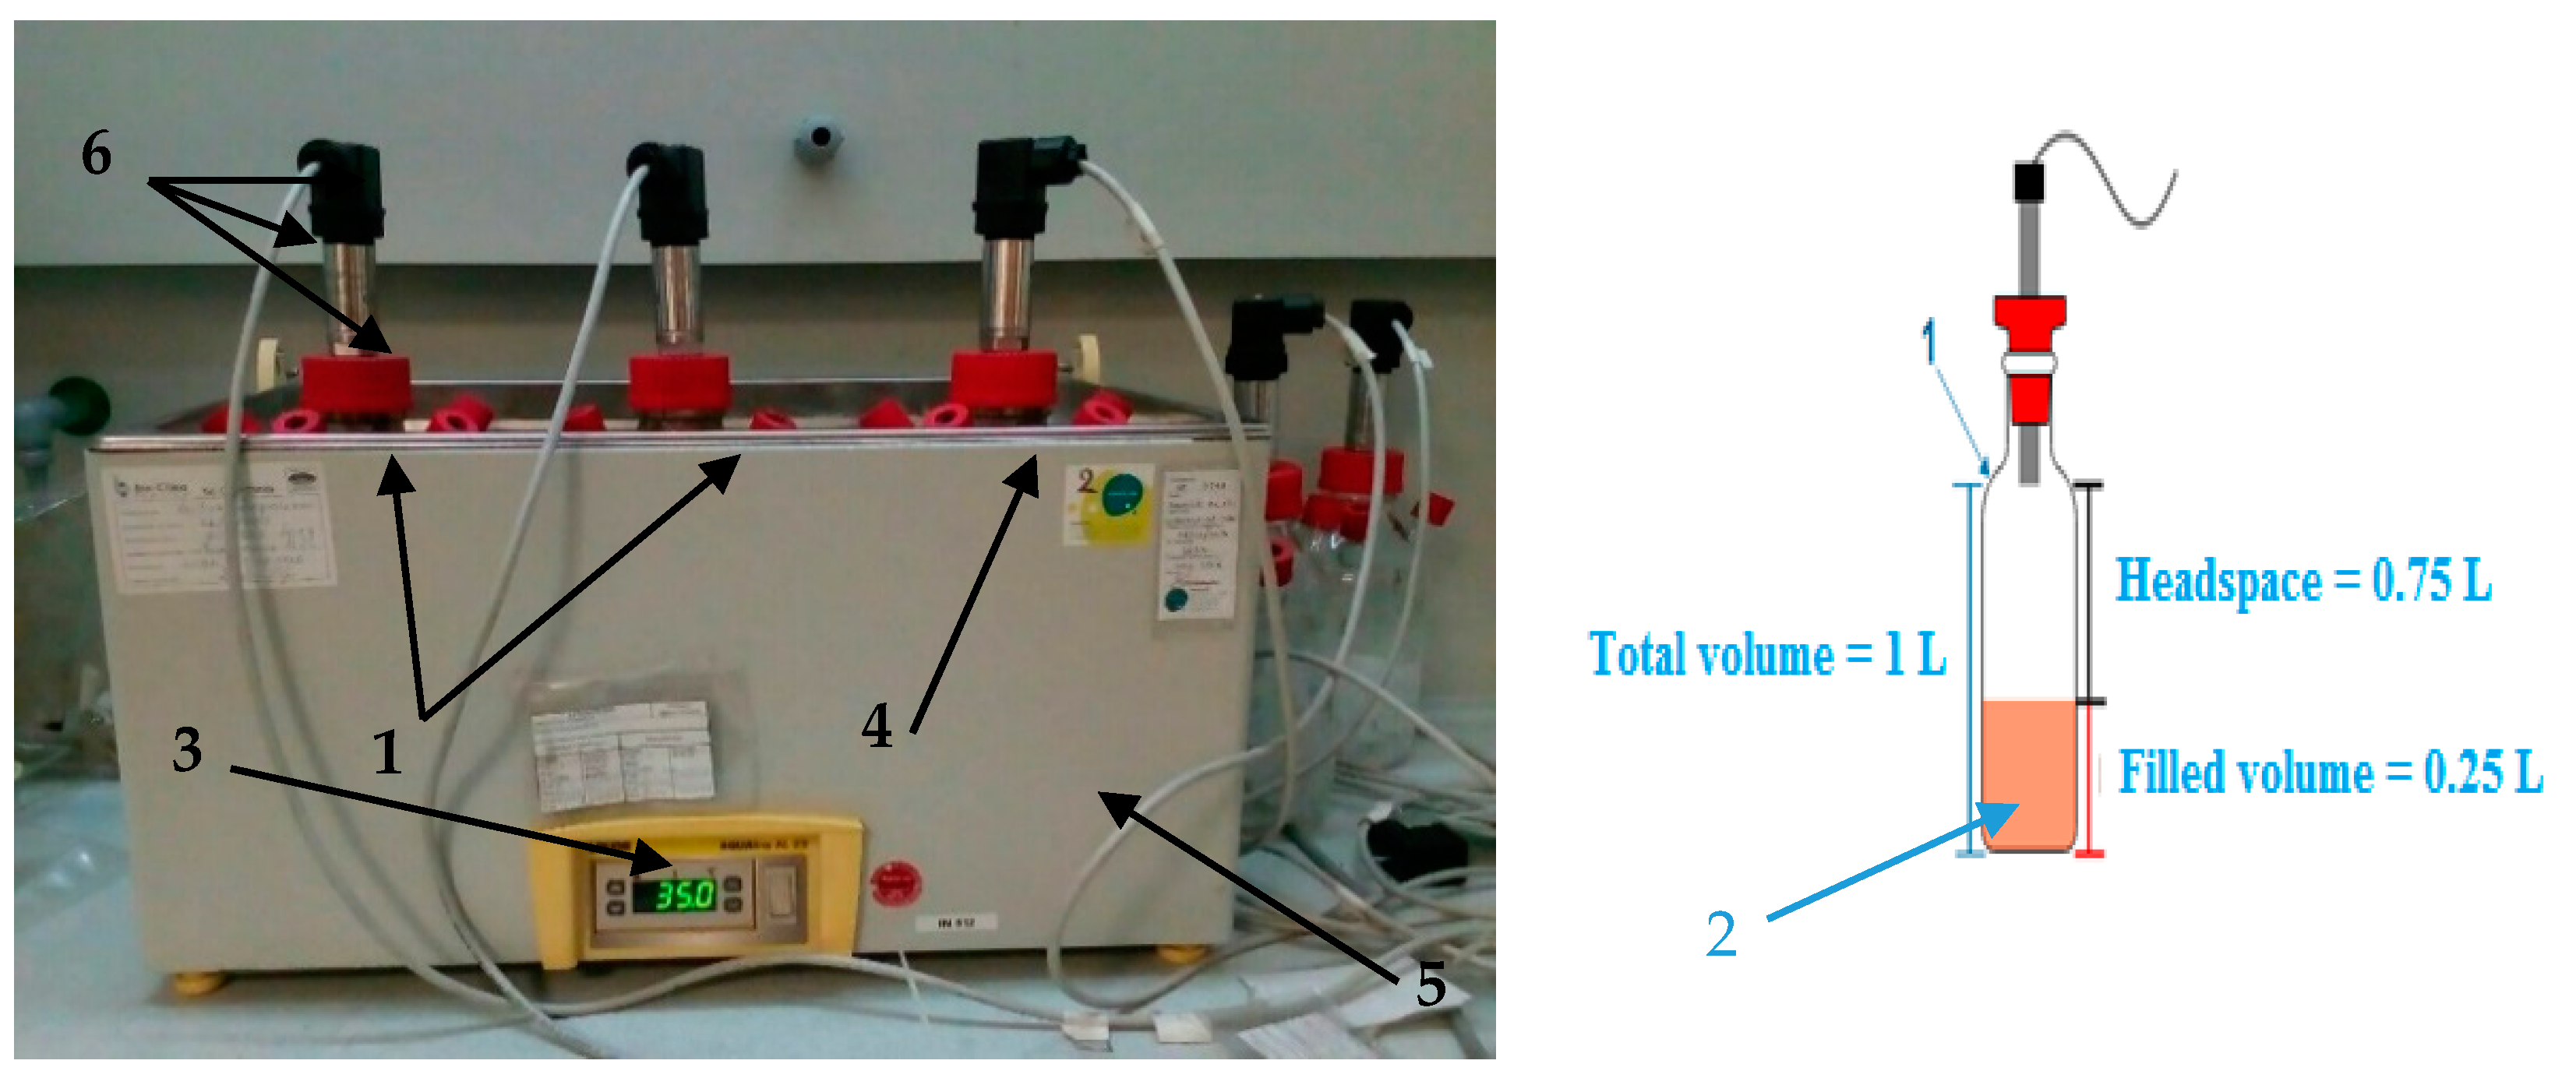
Figure 1. Schematic diagram of the present experiment study; 1—bioreactors, 2—mixture of wastes, 3—temperature display, 4—blank bioreactor, 5—thermostatic bath, 6—pressure sensor compositions.
Processes 09 00048 g001
Figure 2. Daily biogas production of the three bioreactors.
Processes 09 00048 g002
Figure 3. Cumulative biogas production of the bioreactors.
Processes 09 00048 g003
Figure 4. Daily bio-methane production of the bioreactors.
Processes 09 00048 g004
Figure 5. Cumulative bio-methane production of the bioreactors.
Processes 09 00048 g005
Figure 6. Net cumulative biogas production of the two bottles.
Processes 09 00048 g006
Figure 7. Net cumulative bio-methane production of the two bottles.
Processes 09 00048 g007
Figure 8. Daily net bio-methane production of the two bottles.
Processes 09 00048 g008
Table 1. Bio-wastes composition in the bioreactor and in the substrate.
Bio-Waste% in the BioreactorWeight: mi (g)% in the Substrate: xi (Bio-Waste)
OFMSW4.41140
CW2.25.520
OMWW4.41140
Inoculums89222.5-
Total100250100
Table 2. Physic-chemical characterization of the substrates and the inoculums (wet basis).
SamplesHumidity (%)Volatile (%)Ash (%)Fixed Carbon (%)Volatile Dry (%)Ash Dry (%)
CW502914758.4528.26
OFMSW50.3044.491.813.4089.513.64
OMWW65.3325.927.211.5474.7720.80
Inoculum89.747.141.671.4469.6216.33
Global mixture *86.0610.062.191.6564.6416.22
* Global mixture: the mixture is composed of 4.4% OFMSW, 2.2% CW, 4.4% OMWW, and 89% of inoculums.
Table 3. Ultimate analyses of the substrate (wet basis).
SamplesMass (g)N (%)C (%)H (%)C/N Ratio
CW0.10853.6022295.438.051
OFMSW0.17612.6665.68.9124.662
OMWW0.09770.5407520.710.838.280
Table 4. Specific rate values of the biogas/bio-methane in the bioreactors and in the inoculums.
DigesterY (Nm3/kg VS)
BiogasBio-Methane
Bioreactor 10.2630.166
Bioreactor 20.3080.202
Inoculums0.1340.069
Publisher’s Note: MDPI stays neutral with regard to jurisdictional claims in published maps and institutional affiliations.