Article

Task Scheduling Problem of Double-Deep Multi-Tier Shuttle Warehousing Systems

1
Institute of Advanced Manufacturing Technology, Tongji University, Shanghai 201804, China
2
Engineering Department, Shanghai Normal University Tianhua College, Shanghai 201815, China
*
Authors to whom correspondence should be addressed.
Processes 2021, 9(1), 41; https://doi.org/10.3390/pr9010041
Submission received: 17 November 2020 / Revised: 20 December 2020 / Accepted: 24 December 2020 / Published: 26 December 2020

Abstract

:
Double-deep multi-tier shuttle warehousing systems (DMSWS) have been increasingly applied for store-and-retrieval stock-keeping unit tasks, with the advantage of a reduced number of aisles and improved space utilization. Scheduling different devices for retrieval tasks to increase system efficiency is an important concern. In this paper, a Pareto optimization model of task operations based on the cycle time and carbon emissions is presented. The impact of the rearrangement operation is considered in this model. The cycle time model is converted into a flow-shop scheduling model with parallel machines by analyzing the retrieval operation process. Moreover, the carbon emissions of the shuttle in the waiting process, the carbon emissions of the lift during the free process, and the carbon emissions of the retrieval operation are considered in the carbon emissions model, which can help us to evaluate the carbon emissions of the equipment more comprehensively during the entire retrieval task process. The elitist non-dominated sorting genetic algorithm II (NSGA-II) is adopted to solve the non-linear multi-objective optimization function. Finally, a real case is adopted to illustrate the findings of this study. The results show that this method can reduce carbon emissions and improve system efficiency. In addition, it also help managers to reduce operational costs and improve the utilization of shuttles.

Graphical Abstract

1. Introduction

With the rapid development of automation technology and the related economy, the warehousing industry has gradually become a key link in economic activities [1]. Warehousing systems are mainly used to store and retrieve materials and commodities. The double-deep multi-tier shuttle warehousing system (DMSWS) is a new type of intelligent warehousing system, introduced in recent years for store-and-retrieve stock keeping units (SKUs). The basic components of a DMSWS are the double-deep storage rack (SR), buffer position, shuttles, lifts and the I/O point. In a traditional automated storage and retrieval system (AS/RS), each task is executed by an aisle-captive stacker crane capable of horizontal and vertical movement [2,3]. In contrast, the aisle-captive stacker crane is superseded by the cooperation of shuttles and lifts in the DMSWS. The shuttle can move horizontally on each tier for transportation of the required SKU. The vertical movement of the required SKU is controlled by the lift, which is located outside the buffer position of the double-deep SR. The horizontal movement of the shuttle and the vertical movement of lift are independent of each other. The DMSWS not only has the advantages of high operation efficiency and high space utilization, but also has a high degree of flexibility, making it capable of meeting the fluctuation of orders. Moreover, in terms of economic adaptability and warehousing volume, the DMSWS is one of the main development trends in automated warehousing systems.
In a DMSWS, the double-deep SR has two storage position depths for storing SKUs. In most studies, the double-deep SR increases storage positions by 40–50%, compared with a single-deep SR [4,5]. The double-deep SR requires fewer aisles, resulting in higher space utilization. Many producers of warehousing equipment and logistics companies have begun to apply the DMSWS in practice, such as Knapp, Dematic, Alibaba, and JD. Although these DMSWSs are present in logistics companies for order distribution, to the best of our knowledge, extensive research has not been conducted on the DMSWS according to our investigation. There is a clear necessity to study DMSWS, especially in terms of task scheduling, which significantly affects the system efficiency. This observation motivated us to examine the task scheduling problem of double-deep multi-tier shuttle warehousing systems.
In the AS/RS, when the crane receives some tasks (inbound and outbound), the stacker crane in the aisle reciprocates between the starting position and destination point. The task scheduling problem involves how to complete all warehousing operations in the shortest time; this is highly similar to the travelling salesman problem (TSP). According to our review of the relevant literature, many studies on the task scheduling problem have focused on the TSP and its improved algorithms [6,7]. However, the task scheduling problem of DMSWS is different from TSP, as storage and retrieval tasks can be executed in parallel by multi-shuttles. Thus, new methods need to be discovered to solve task scheduling problem in the DMSWS.
Research on the carbon emissions of warehousing systems has gradually attracted more and more academic and industrial attention. In the literature reviews, most researchers have focused on carbon emissions in warehousing design and path optimization and storage policies [8,9,10,11]. Some scholars have established novel models to study the sustainability of warehousing systems [12,13]. In terms of task scheduling, there have been few studies on carbon emissions. These studies have only considered the carbon emissions of the equipment during operations. To fill this research gap, it is not only required to calculate the carbon emissions of equipment during operations, but also the carbon emissions of the equipment during waiting processes or free time, such that carbon emissions can be investigated more comprehensively. In addition, in this study, an optimization model is established to study the relationship between carbon emissions and total working time. It cannot be simply considered (as in previous studies) that the longer the total working time, the higher the carbon emissions.
The operation of AS/RS and its variant is similar to that of the DMSWS and some of its methods can be applied, but the theoretical study on DMSWS is very scarce. In addition, most previous studies on task scheduling in AS/RS and its variant have focused on TSP and its solution algorithms. However, this case differs from DMSWS because multiple shuttles perform storage and retrieval tasks in parallel. To improve the system efficiency, how the different equipment can be scheduled and made to work together efficiently are essential.
In this paper, a time sequence mathematical model based on rearrangement operation for DMSWS is established, which helps us get accurate total time for retrieval operations. To evaluate carbon emissions more comprehensively, a carbon emissions model that includes working and waiting or idle process of equipment is proposed. Moreover, we provide a multi-objective optimization model for task scheduling by optimizing the total working time, waiting time and carbon emissions. In other words, the purpose of this paper is to find out a better operation execution solution for minimizing the total working time and carbon emissions.
The remainder of this paper is organized as follows. In Section 2, the literature review is presented. The structure of DMSWS and some assumptions are introduced in Section 3. The cycle time model and carbon emissions model are proposed in Section 4, while Section 5 presents the NSGA-II to solve the task scheduling problem. In Section 6, an actual engineering project is adopted to validate the model and its algorithm. Finally, the conclusions of this research and future research topics are given in Section 6.

2. Literature Review

In this section, studies on AS/RS and its variants (SBS/RS and AVS/RS) are introduced in the first part. Then, the studies relating to the carbon emissions of warehousing systems are presented. Finally, the studies of warehousing systems we review herein are summarized, as shown in Table 1.
To date, scholars have carried out a series of studies on the task scheduling problem of AS/RS; however, the research object in most studies is the single-deep SR. Based on the assumption that the single-deep SR is “square-in-time” (SIT), Hausman et al. [2] first formulated the travel-time models for AS/RS with single-deep SR. In addition, the system efficiency and throughput of the three storage policies (full turnover policy, random policy, and class-based policy) have been compared, and the optimization results showed that the class-based storage policy is the most effective. Bozer et al. [3] built a classical analytical model to compare single- and dual-command strategies for AS/RS under the random storage policy. Additionally, various I/O point strategies and alternative dwell-point strategies were examined through actual cases for AS/RS. This research method is still being used in travel-time research. According to the actual movement characteristics of the automation equipment, Hwang et al. [6] formulated continuous analytical models of the travel-time. Kouvelis et al. [7] and Bortolini et al. [14] established analytical models to evaluate the expected time for both single- and dual-command cycles. Furthermore, Regattieri et al. [15] adopted a simulation model to find the best dwell-point policy under different driving rules.
Multi-deep AS/RS is another research direction of AS/RS, and some scholars have conducted research in this direction. Hu et al. [16] presented a travel-time model of split-platform SR based on the dwell-point policy and gave the optimal design guidelines of the split-platform SR. Sari et al. [17] studied a multi-deep AS/RS with special structure and proposed closed-form travel-time expressions. To the best of our knowledge, the 3-dimensional (3D) compact AS/RS was first studied by De Koster et al. [18], where a closed-form expression was given to evaluate the expected retrieval travel-time for a single-command cycle. As an extension of previous research, Yu et al. [19] obtained the expected single-command cycle time based on the full turnover policy. Double-deep AS/RS is another research highlight. Lerher et al. [20] presented a new analytical travel-time model for double-deep AS/RS, which can calculate the cycle time more accurately. Moreover, the actual movement characteristics of the automation equipment and the rearrangement operations during the retrieval process were considered. Xu et al. [4] used the single-shuttle as the benchmark model to analyze the improvement of the dual-shuttle and developed a “quadruple command” analytical model to evaluate the system efficiency. According to three different rearrangement rules, Xu et al. [21] proposed cycle time models under single- and dual-command. Their study also illustrated the relationship between the fill-grade factor and the total cost. Wang et al. [5] and Lerher [22] studied task scheduling models for double-deep SR. Moreover, research on AS/RS has been widely conducted; Roodbergen et al. [23] and Gu et al. [24] have presented literature reviews in this area.
Apart from AS/RS, some scholars have been conducted research on its variants, including the shuttle-based storage and retrieval system (SBS/RS) and the autonomous vehicle storage and retrieval system (AVS/RS). To the best of our knowledge, Malmborg [25] first proposed the concept of AVS/RS, formulating a system efficiency analysis model based on the features of autonomous vehicles. Fukunari et al. [26] presented a new travel-time model for AVS/RS, comparing the system efficiency with that of the traditional AS/RS. Heragu et al. [27] proposed analytical models based on an open queuing network (OQN) and analyzed the system throughput of the AVS/RS. Marchet et al. [28] presented an analytical model to evaluate the system efficiency of AVS/RS. Ekren and Cai et al. and Zou et al. [29,30,31] studied the system efficiency and throughput, according to different queuing network models. In addition, Wang et al. [32] investigated the task sequencing problem in SBS and proposed a sequence time model of task operation based on the actual movement characteristics of automation equipment. Lerher et al. [33] conducted research on SBS/RS and presented the cycle time model to evaluate the travel-time. Tappia et al. [34] developed novel queuing networking models to calculate the system efficiency of both single- and multi-tier SBS/RS.
According to the global development trend of supply chain and warehousing systems, the operations of systems not only consider the travel-time and total cost but have also come to consider the carbon emissions and environmental aspects of the automation equipment. As the existing AS/RS analysis models are suitable for the already well-known objectives (minimum total cost, minimum expected time, and maximum efficiency), Lerher et al. [1] proposed a new energy efficiency model based on the analysis of the mini-load AS/RS. Their research results showed that this model can effectively reduce the energy consumption, thereby reducing carbon emissions. On the basis of new policies for storage assignment, Bortolini et al. [35] presented a travel-time and energy consumption bi-objective model for aisle-captive AS/RS with single-deep SR. This model was based on the joint minimization of the cycle time and the energy consumption for cranes to store and retrieve the SKU. Ene et al. [11] adopted a genetic algorithm to minimize the energy consumption with a proper storage policy other than service time. For the unit-load multiple rack AS/RS, Nia et al. [8] proposed a dual-command “dynamic sequencing” method. In order to estimate greenhouse gas (GHG) emissions more comprehensively, limitations on the available time of all automation equipment and the total allowable GHG emissions generated by all facilities are calculated in this model. In addition, the penalty cost, tax cost, and discount of the produced GHG emissions are considered. Borovinsek et al. [9] proposed a multi-objective optimization model from the perspective of an environmentally efficient SBS/RS design, in which the total cost, average throughput time, and energy consumption were considered. Torabizadeh et al. [12] described a method to identify and weigh indicators that assess sustainability in a sustainable warehouse management system using structural equation modeling. Hao et al. [13] developed a conceptual model using a technology–organization–environment framework to investigate the factors which influence logistics firms to adopt green technology. To conduct energy evaluation, Emanuele et al. [10] analyzed the energy recovery system of a deep-lane AVS/RS. The results showed that the energy recovery system significantly saved energy in the deep-lane AVS/RS.
The previous studies focusing on single-deep AS/RS, multi-deep AS/RS, and single-deep AVS/RS and SBS/RS are shown in Table 1. However, no study has investigated double-deep multi-tier shuttle storage warehousing systems, even though they have high floor utilization and high equipment utilization. To fill this gap, we study the task sequencing problem in DMSWS and consider the carbon emissions of equipment, including the waiting and idle processes.

3. System Description and Modelling Preparation

As a new type of automated warehousing system, a double-deep multi-tier shuttle warehousing system has unique structure. The component units of a double-deep multi-tier shuttle warehousing system are the double-deep SR, shuttles, lifts, and control system. A schematic diagram of a DMSWS is shown in Figure 1, where the lift moves back and forth between the I/O point and tier for vertical movement of the required SKU. The shuttle is used for horizontal movement for the storage and retrieval tasks in each storage tier. All storage and retrieval tasks in this warehousing system are performed by vertical movement of the lift and horizontal movement of the shuttle. The shuttle and lift are parked at the buffer position and I/O point, respectively, when they are idle; these processes also generate carbon emissions. Compared with the traditional AS/RS, this combination of shuttle and lift consume more time and generate more carbon emissions for a single task. However, the parallel movement of multi-tier shuttles can improve the operating efficiency and reduce system carbon emissions, to a certain extent.
According to the structure of a double-deep SR, it has a higher space utilization than a single-deep SR. However, rearrangement operations will increase the retrieval task time, thereby reducing the system efficiency. According to the introduction of the FEM 9.851 guideline, the rearrangement of the blocking SKU will appear during retrieval tasks in DMSWS. The procedure of the rearrangement of the blocking SKU is shown in Figure 2. The SKU (labelled by ‘b’) in the first lane blocks the SKU to be retrieved in the second lane (labelled by ‘a’). Thereby, the shuttle needs to transport the blocking SKU to the nearest empty storage location and send the required SKU to the buffer position. Lastly, the blocking SKU is transported back to the original location. This operation is called rearrangement of the blocking SKU.
The fundamental assumptions of a DMSWS are presented, in order to analyze task scheduling and system efficiency in subsequent sections, as follows:
  • The random storage strategy is used. Under this strategy, a SKU will be placed in each empty storage location with the same probability.
  • The automation equipment follow the first-come-first-served (FCFS) rule. There are no emergency orders and every retrieval task shares the same priority level.
  • Shuttles and lifts abide by the dwell-point strategy of point-of-service-completion (POSC). The shuttle remain at the buffer position in each storage tier and the lift dwells at the I/O point.
  • A single-command cycle is considered. The DMSWS will not accept the storage task when the system is performing a retrieval task.
According to the system description and assumptions, retrieval tasks are considered in this study. These tasks represent the most critical operations of a DMSWS, as they directly influence the service level of the system. The operation of multi-tasking in the DMSWS, as shown in Figure 3, relies on collaboration between the horizontal movement of shuttles and the vertical movement of lifts. The operation of retrieval tasks is carried out as follows:
Step 1: When the control system releases the retrieval task, the shuttle responds to the control system if it is free at that time.
Step 2: If there is no rearrangement operation, the shuttle moves directly to the retrieval position, otherwise, the shuttle needs to complete the rearrangement operation first.
Step 3: The shuttle picks up the SKU and transports it to the buffer position, where the shuttle and the lift complete the handover of the SKU. Meanwhile, the shuttle sends a retrieval request to the lift through the control system.
Step 4: Based on the FCFS rule, the lift moves from the I/O point to the designated tier when it becomes free.
Step 5: The lift picks up the SKU and it returns to the I/O point to unload the SKU. Meanwhile, the shuttle is released by the control system for the next retrieval task.
In a DMSWS, the control system receives a series of retrieval tasks in a certain time window, some of which are performed simultaneously by the multi-tier shuttle, then all retrieval tasks are completed by the lift in turn. Although the shuttle and the lift abide by the FCFS rule, the performance of a DMSWS can be summarized as the sequential transfer of lifts and parallel retrieval of shuttles. Therefore, the task scheduling problem model of a DMSWS differs significantly from the TSP model, based on the above analysis.

4. Models of Double-Deep Multi-Tier Warehousing Systems

In this section, according to the analysis of the retrieval task process, the cycle time model and carbon emissions model are established. Then, a Pareto optimization strategy is designed, based on the three optimization goals.

4.1. Cycle Time Model of the DMSWS

The operation of a single retrieval task was analyzed, as shown in Figure 4. The consecutive superscript Q is adopted to depict several critical times in the entire period. Particularly, Q k is defined as the finishing time for the retrieval task k; Q k 0 indicates the time when the control system releases the retrieval task k; Q k 1 presents the time when the shuttle has loaded the SKU and moves to the buffer position; Q k 2 shows the time when the lift responds to the retrieval request; Q k 3 is the moment when the shuttle and the lift complete the delivery of SKU and release the shuttle; and Q k 4 signifies the time when the lift moves to the I/O point.
Based on the FCFS rule, there may be two periods of stagnation during the execution of retrieval tasks, which may be affect the operation time and the system efficiency. Shuttle idling (waiting) is the first kind of stagnation period, which is indicated by w k . This happens when the shuttle has moved to the buffer position and sends a retrieval request to the lift while it is serving the previous task. On the other hand, the lift idle (free) time is induced when lift finishes the previous task and there is no retrieval request from the control system; this is denoted by f k . According to our analysis, the following two situations will occur during each retrieval task period.
  • If the lift has free time in retrieval task k, then f k = Q k 1 Q k 1 .
  • If the has shuttle waiting time in retrieval task k, then w k = Q k 1 Q k 1 .
p k and q k are assumed to be the probabilities of the shuttle and the lift idling, respectively:
p k = { 1 , Q k 1 > Q k 1 0 , Q k 1 Q k 1
q k = { 1 , Q k 1 < Q k 1 0 , Q k 1 Q k 1
Thus, the total shuttle waiting time w and the total lift free time f can be calculated as follows:
w = k = 1 M p k · w k = k = 1 M p k · ( Q k 1 Q k 1 )
f = k = 1 M q k · f k = k = 1 M q k · ( Q k 1 Q k 1 )
Based on the flow chart for multi-tasking, the shuttle waiting time and lift free time will occur in a single retrieval task, but all retrieval tasks will be completed by the lift in the end. Therefore, according to the vertical movement of the lift, the operation of all retrieval tasks can be divided into three stages, as illustrated in Figure 5:
  • Stage one. The shuttle moves to the target location to load the SKU, then returns to the buffer position and transmits a retrieval request to the lift. A rearrangement operation may be executed.
  • Stage two. The lift responds to the retrieval request, moves from the I/O point to the designated tier, and completes the handover of the SKU. The shuttle is released by the control system for the next task. The lift free time is calculated in this stage.
  • Stage three. The lift moves to the I/O point and unloads the SKU.
According to the aforementioned analysis and Figure 5, the entire operation process of retrieval tasks is regarded as a flow-shop scheduling problem in parallel machines mode. Therefore, the total retrieval operation time, T t o t a l is equal to the sum of the time taken for stage one of the retrieval task 1 ( s 1 1 ) and the total lift working time ( s t o t a l ).
The consumed time for retrieval k in stage one, which is denoted by s k 1 , can be calculated as follows:
s k 1 = e k 1 + e 1 + e k 1 + F k i · e d
where e k 1 is the time for horizontal movement of the shuttle; e 1 represents the time for loading the required SKU; e d indicates the time for a rearrangement operation; and F k i is a decision variable: If F k i = 1 , the shuttle must carry out a rearrangement operation.
In stage two, the operation time for retrieval task k can be obtained by the following formula.
s k 2 = f k + e k 2 + e 2
where e k 2 presents the time for the lift to move from the I/O point to the designated tier; and e 2 indicates the time for the SKU handover between the shuttle and the lift.
The operation time for retrieval task k in stage three can be obtained as follows:
s k 3 = e k 2 + e 3
where e 3 represents the time to unload the required SKU.
For all retrieval tasks, the total lift working time can be calculated as follows:
s t o t a l = k = 1 M ( s k 2 + s k 3 ) = f + k = 1 M ( e k 2 + e 2 + e k 2 + e 3 )
According to the analysis, s f i x = k = 1 M ( e k 2 + e 2 + e k 2 + e 3 ) is a constant variable for M retrieval tasks.
According to the flow-shop scheduling problem with parallel machines mode, the total retrieval operation time T t o t a l can be derived as:
T t o t a l = s 1 1 + s t o t a l = 2 e 1 1 + e 1 + F k i · e d + f + s f i x
In the DMSWS, e 1 , e 2 and e 3 are all constant variables, and the motion variables do not consider the effects of acceleration and deceleration on the movement of the shuttle and the lift. v s and v l are the average velocity of the shuttle and the lift. ( x , y , z ) indicates the original storage position for retrieval task k. The time taken for horizontal movement of the shuttle and for vertical movement of the lift can be derived as follows:
e k 1 = ( x · L + y · W ) / v s
e k 2 = z · H / v l
Based on [21,22], the expected value of the rearrangement operation distances of the DMSWS can be calculated by Equation (12):
E k = 1 3 · L · 1 1 α
where L represents the length of a single storage position and α is the fill-grade factor of the DMSWS.
The time of a rearrangement operation can be calculated by Equation (13):
e d = E k / v s

4.2. Carbon Emissions Model

The amount of carbon emissions, T E , can be calculated based on the energy consumption of the warehousing system. In this section, the carbon emissions during the retrieval operation are considered, as well as those during the waiting and free processes of the equipment. According to descriptions of practitioners in the field and our investigations, this consideration is very appropriate.
When the operation of the retrieval task k is completed, the total carbon emissions of all outbound equipment in the DMSWS can be calculated by:
T E k = P T k · f e = ( P W k + P F k + P C k ) · f e
P W k = w k · P s w
P F k = f k · P l w
P C k = P C s k + P C l k
where T E k indicates the total carbon emissions generated by retrieval task k; P T k represents the total energy consumption for the retrieval task k; f e is the conversion factor of greenhouse gas (GHG); P W k indicates the energy consumption of the shuttle in the waiting process; P s w is the power of the shuttle in the waiting process; P F k represents the energy consumption of the lift during the free process; P l w indicates the power of the lift during the free process; P C k is the energy consumption of retrieval operation for retrieval task k; P C s k indicates the energy consumption of the shuttle for the retrieval operation; and P C l k indicates the energy consumption of the lift for the retrieval operation.
In stage one, the energy consumption of the shuttle and the lift for retrieval task k are described by P C s k 1 and P C l k 1 , which can be calculated as follows:
P C s k 1 = e k 1 · ( P s f + P s m ) + 1 2 · F k i · e d · ( P s f + P s m )
P C l k 1 = 0
where P s f represents the no-load power of the shuttle and P s m indicates the load power of the shuttle.
In stage two, the energy consumption of the shuttle and the lift are denoted by P C s k 2 and P C l k 2 , expressed as follows:
P C s k 2 = 0
P C l k 2 = e k 2 · P l f
where P l f indicates the no-load power of the lift.
In stage three, the energy consumption of the shuttle and the lift are calculated by:
P C s k 3 = 0
P C l k 3 = e k 2 · P l m
where P C s k 3 represents the energy consumption of the shuttle, P C l k 3 represents the energy consumption of the lift, and P l m indicates the load power of the lift.
Thus, the energy consumption of the retrieval operation for retrieval task k can be obtained according to the following formula:
P C k = e k 1 · ( P s f + P s m ) + e k 2 · ( P l f + P l m ) + 1 2 · F k i · e d ( P s f + P s m )
Based on the analysis above, the total carbon emissions TE can be obtained as follows:
T E = k = 1 M T E k = f e · ( w · P s w + f · P l w + k = 1 M ( e k 1 · ( P s f + P s m ) + e k 2 · ( P l f + P l m ) + 1 2 · F k i · e d · ( P s f + P s m ) ) )

4.3. Pareto Optimization

When multi-objective functions have an inverse relationship, the multi-objective optimization problem has countless solutions (non-dominated solutions), instead of a unique optimal solution. After obtaining the optimized results, the researcher then selects one or more acceptable solutions among all non-dominated solutions.
The aforementioned analysis of DMSWS indicates that the total retrieval operation time, the total carbon emissions and the total waiting time of shuttles reflect the efficiency of the DMSWS from different perspectives. During the operation of retrieval tasks, the influences of mutual promotion and contradiction are presented. The purpose of this study is to optimize three objective functions—the total retrieval operation time, the total waiting time of the shuttles, and the total carbon emissions—of the DMSWS. Thus, the research objective is to minimize three objective functions through the re-scheduling execution sequence in a certain time window. The modelling objectives are described as follows:
f 1 ( x ) = w , f 2 ( x ) = T t o t a l , f 3 ( x ) = T E
min { f 1 ( x ) , f 2 ( x ) , f 3 ( x ) }
x i = { 1 , , k , M }
where w , T t o t a l , and T E can be derived from Equations (3), (9) and (25), respectively, and x i represents the scheduling execution sequence.

5. Solution Algorithm

The essence of the task scheduling problem is to find the best solution among all permutations and combinations of the operation execution sequence. The elitist non-dominated sorting genetic algorithm (NSGA-II) was adopted to solve the task scheduling problem of DMSWS. Since the NSGA-II was first proposed by Deb (2002), it has been widely used for solving multi-objective optimization problems (MOOPs). The key steps of NSGA-II are shown in Figure 6, which presents the detailed program flow.
(1)
Encoding and decoding
First, the encoding and decoding process are introduced, which are very important. As just one problem is involved, the chromosome contains only one important vector (i.e., the task sequence vector). Thus, natural number coding is used for this problem. The task sequence vector has M gene elements, in which each element indicates a retrieval task. The position of each element in the task sequence vector represents the order of execution of the retrieval task. Thus, each chromosome represents an operation execution solution. An example with 14 tasks is depicted in Figure 7.
(2)
Fitness function
To estimate the optimization solution, the objectives to be minimized are transformed to form a maximum optimization problem:
f 1 T ( x ) = 1 / f 1 ( x ) f 2 T ( x ) = 1 / f 2 ( x ) f 3 T ( x ) = 1 / f 3 ( x )
where f 1 T ( x ) , f 2 T ( x ) , and f 3 T ( x ) are the transformed fitness values.
(3)
Non-dominated sort
In each generation, the population is sorted on the basis of the non-dominated Pareto optimality. The initial Pareto front set is not dominated and all chromosomes are transferred from the population. We continue to confirm the next Pareto front set in the remaining population until all chromosomes are classified.
(4)
Crowding distance
The crowding distance between adjacent individuals in each Pareto front set is calculated, after the non-dominated sort is completed. The crowding distance is equal to the cumulative sum of the fitness values of the chromosomes I − 1 and i + 1:
D i = 1 M m = 1 M f m i + 1 f m i 1 f m max f m min
where M presents the number of optimization goals; the fitness values of the optimization goal m for chromosomes I − 1 and i + 1 are indicated by f m i 1 and f m i + 1 ; and f m min and f m max show the minimum and maximum values.
(5)
Elitism, selection, genetic operators and termination condition
In a population P, the elitist parent set is obtained on the basis of the non-dominated sort crowding distance and the Pareto front rank. Hp indicates the elitist set, which has the largest crowding distance and the smallest front rank. The remaining individuals, set by R P , produce the next generation’s individuals according to tournament selection. Finally, the genetic operators are the same as in GA, as shown in Figure 8, and the termination condition is usually represented by a fixed number of generations reached.

6. Case study

In this section, the logistics distribution center of a food company is chosen as an experimental case, in order to validate the proposed optimization model. This distribution center uses a conveyor system and DMSWS. All required SKUs are gathered by the warehouse management system (WMS) within a certain time window, where the WMS obtains the storage positions of all retrieval tasks according to the design of the DMSWS. Then, according to the optimization results, the retrieval tasks are re-scheduled by the warehouse control system (WCS). Meanwhile, the WCS assigns each task to relevant shuttles and the lift, based on the optimized execution sequence. Each required SKU is transferred to the I/O point by the co-operation of shuttles and lift.
As shown in Figure 9, the DMSWS of the logistics distribution center is composed of four parts: each part includes 12 aisle, 8 tiers, and 20 storage columns, and there are 16,640 total storage positions. The width of each aisle is W a = 1.5 m, and the length and the width of a single storage position are L = 1.2 m and W = 1.0 m, respectively. The average velocity of a shuttle is v s = 1.5 m/s and the average velocity of a lift is v l = 2.0 m/s. According to the research of [36], the conversion factor for GHG is f e = 974 gCO2/kwh. The remaining parameter values are given in Table 2.
The WCS gathered 60 retrieval tasks in a certain time window. The original storage positions of all retrieval tasks are listed in Table 3. The operation of retrieval tasks was based on unit load. Thus, the stock was not opened during the stage of retrieval operations.
According to the task scheduling optimization model and NSGA-II, the WCS determined the best execution sequence. The NSGA-II was run using the MATLAB 2016b software, which operated on a control computer with an Intel(R) Core(TM) i7-7700HQ CPU @ 2.80 GHz and 8.00 GB RAM. The parameter values for NSGA-II were selected based on previous analysis and the experience of researchers engaged in the application and development of intelligent algorithms. The parameters directly impact the efficiency of the NSGA-II algorithm. This indicates that the parameters should be careful determined to ensure unprejudiced comparisons are conducted. The factor levels, which are determined by a large number of tests, are shown in Table 4.
Because there are two parameters and three factor levels for each parameter, an orthogonal array L1 (32) is adopted. The ratio of non-dominated solutions in the final solution set is considered as the response variable. Each case is tested 10 times and the average value is shown in Figure 10. Therefore, the best parameter settings are: crossover probability is 0.90 and mutation probability is 0.1. This parameter setting is used in the next experiments. The size of the initial population was set to 200, and the maximum generation was set to 300.
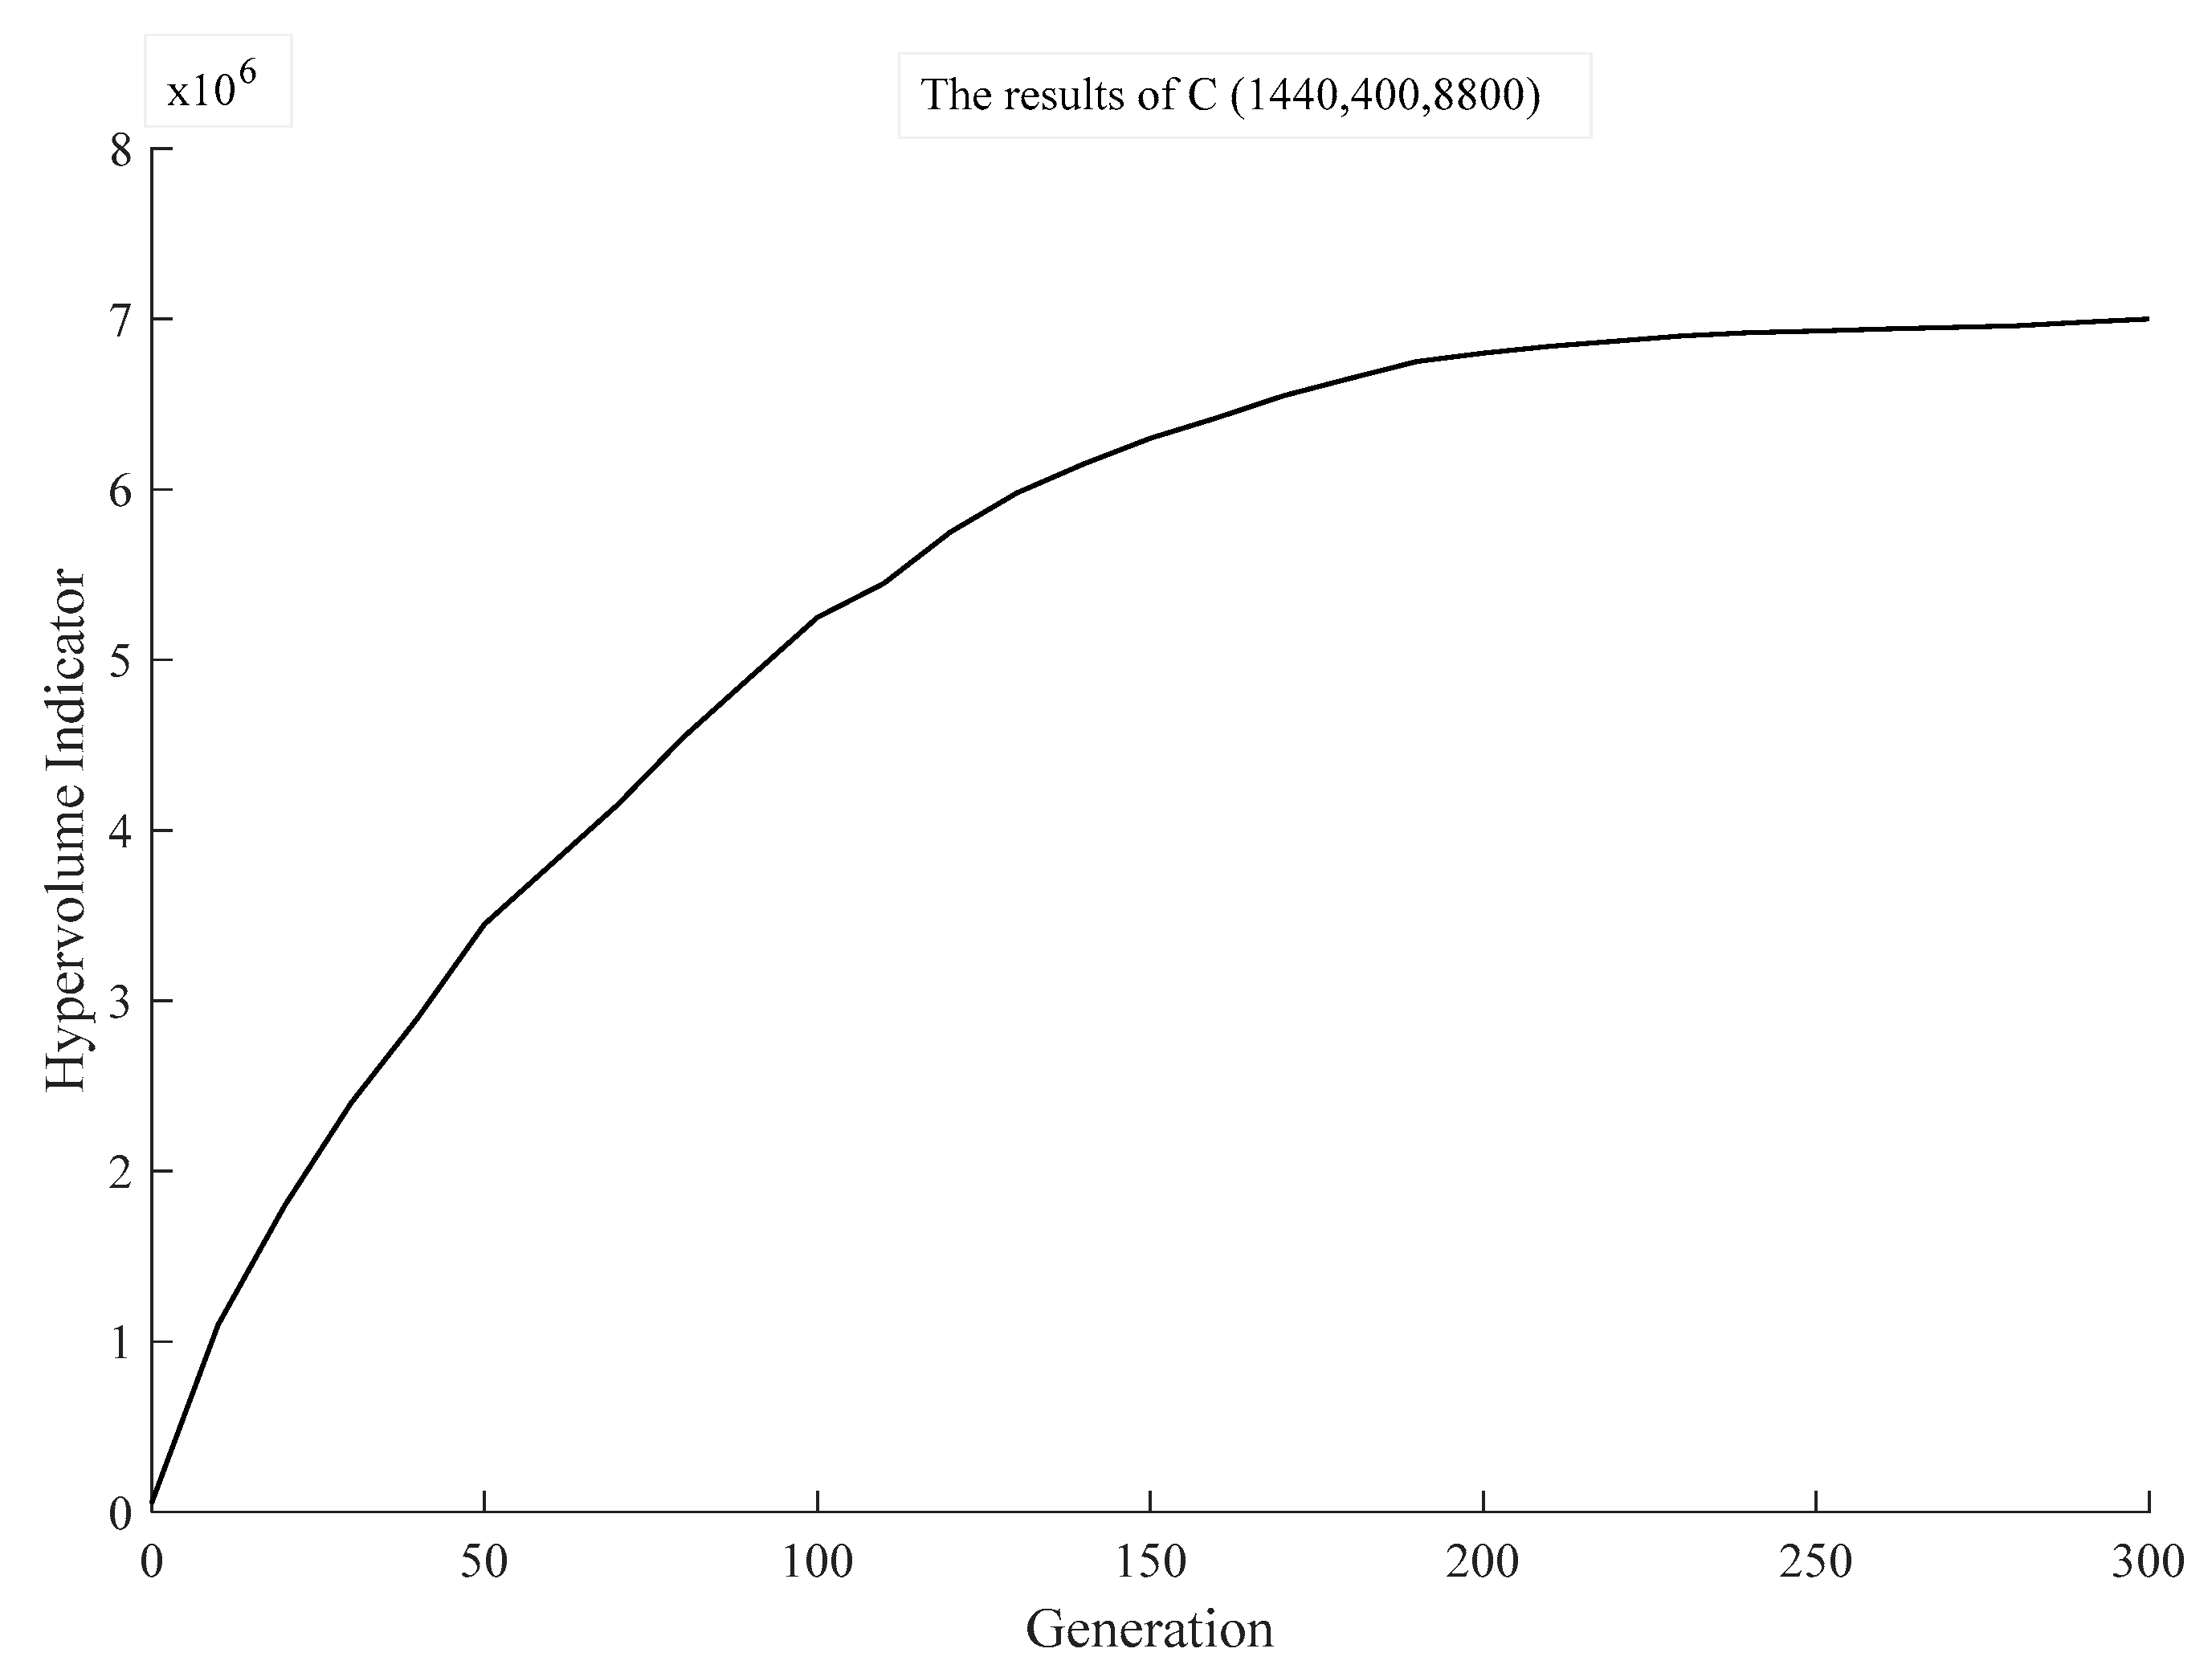
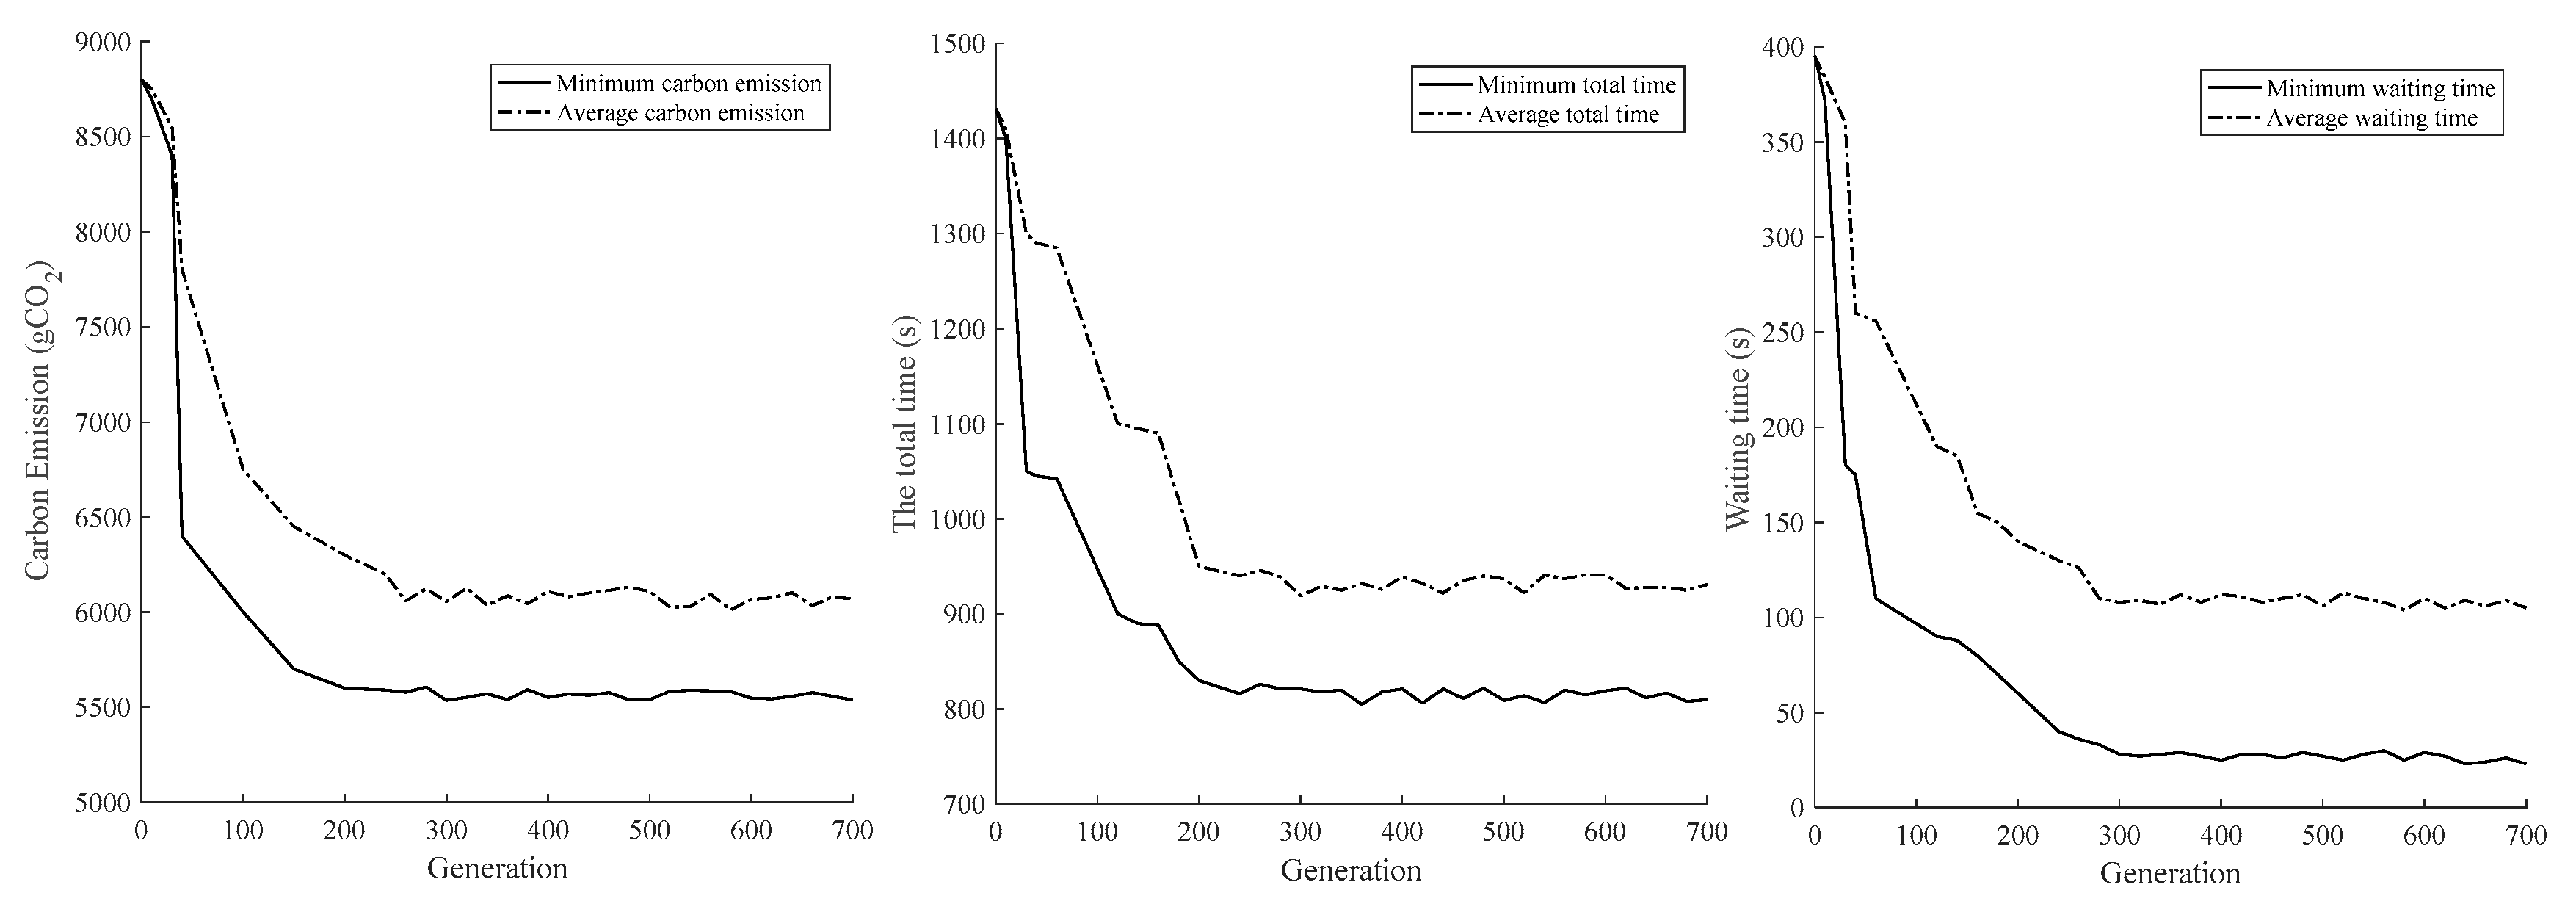
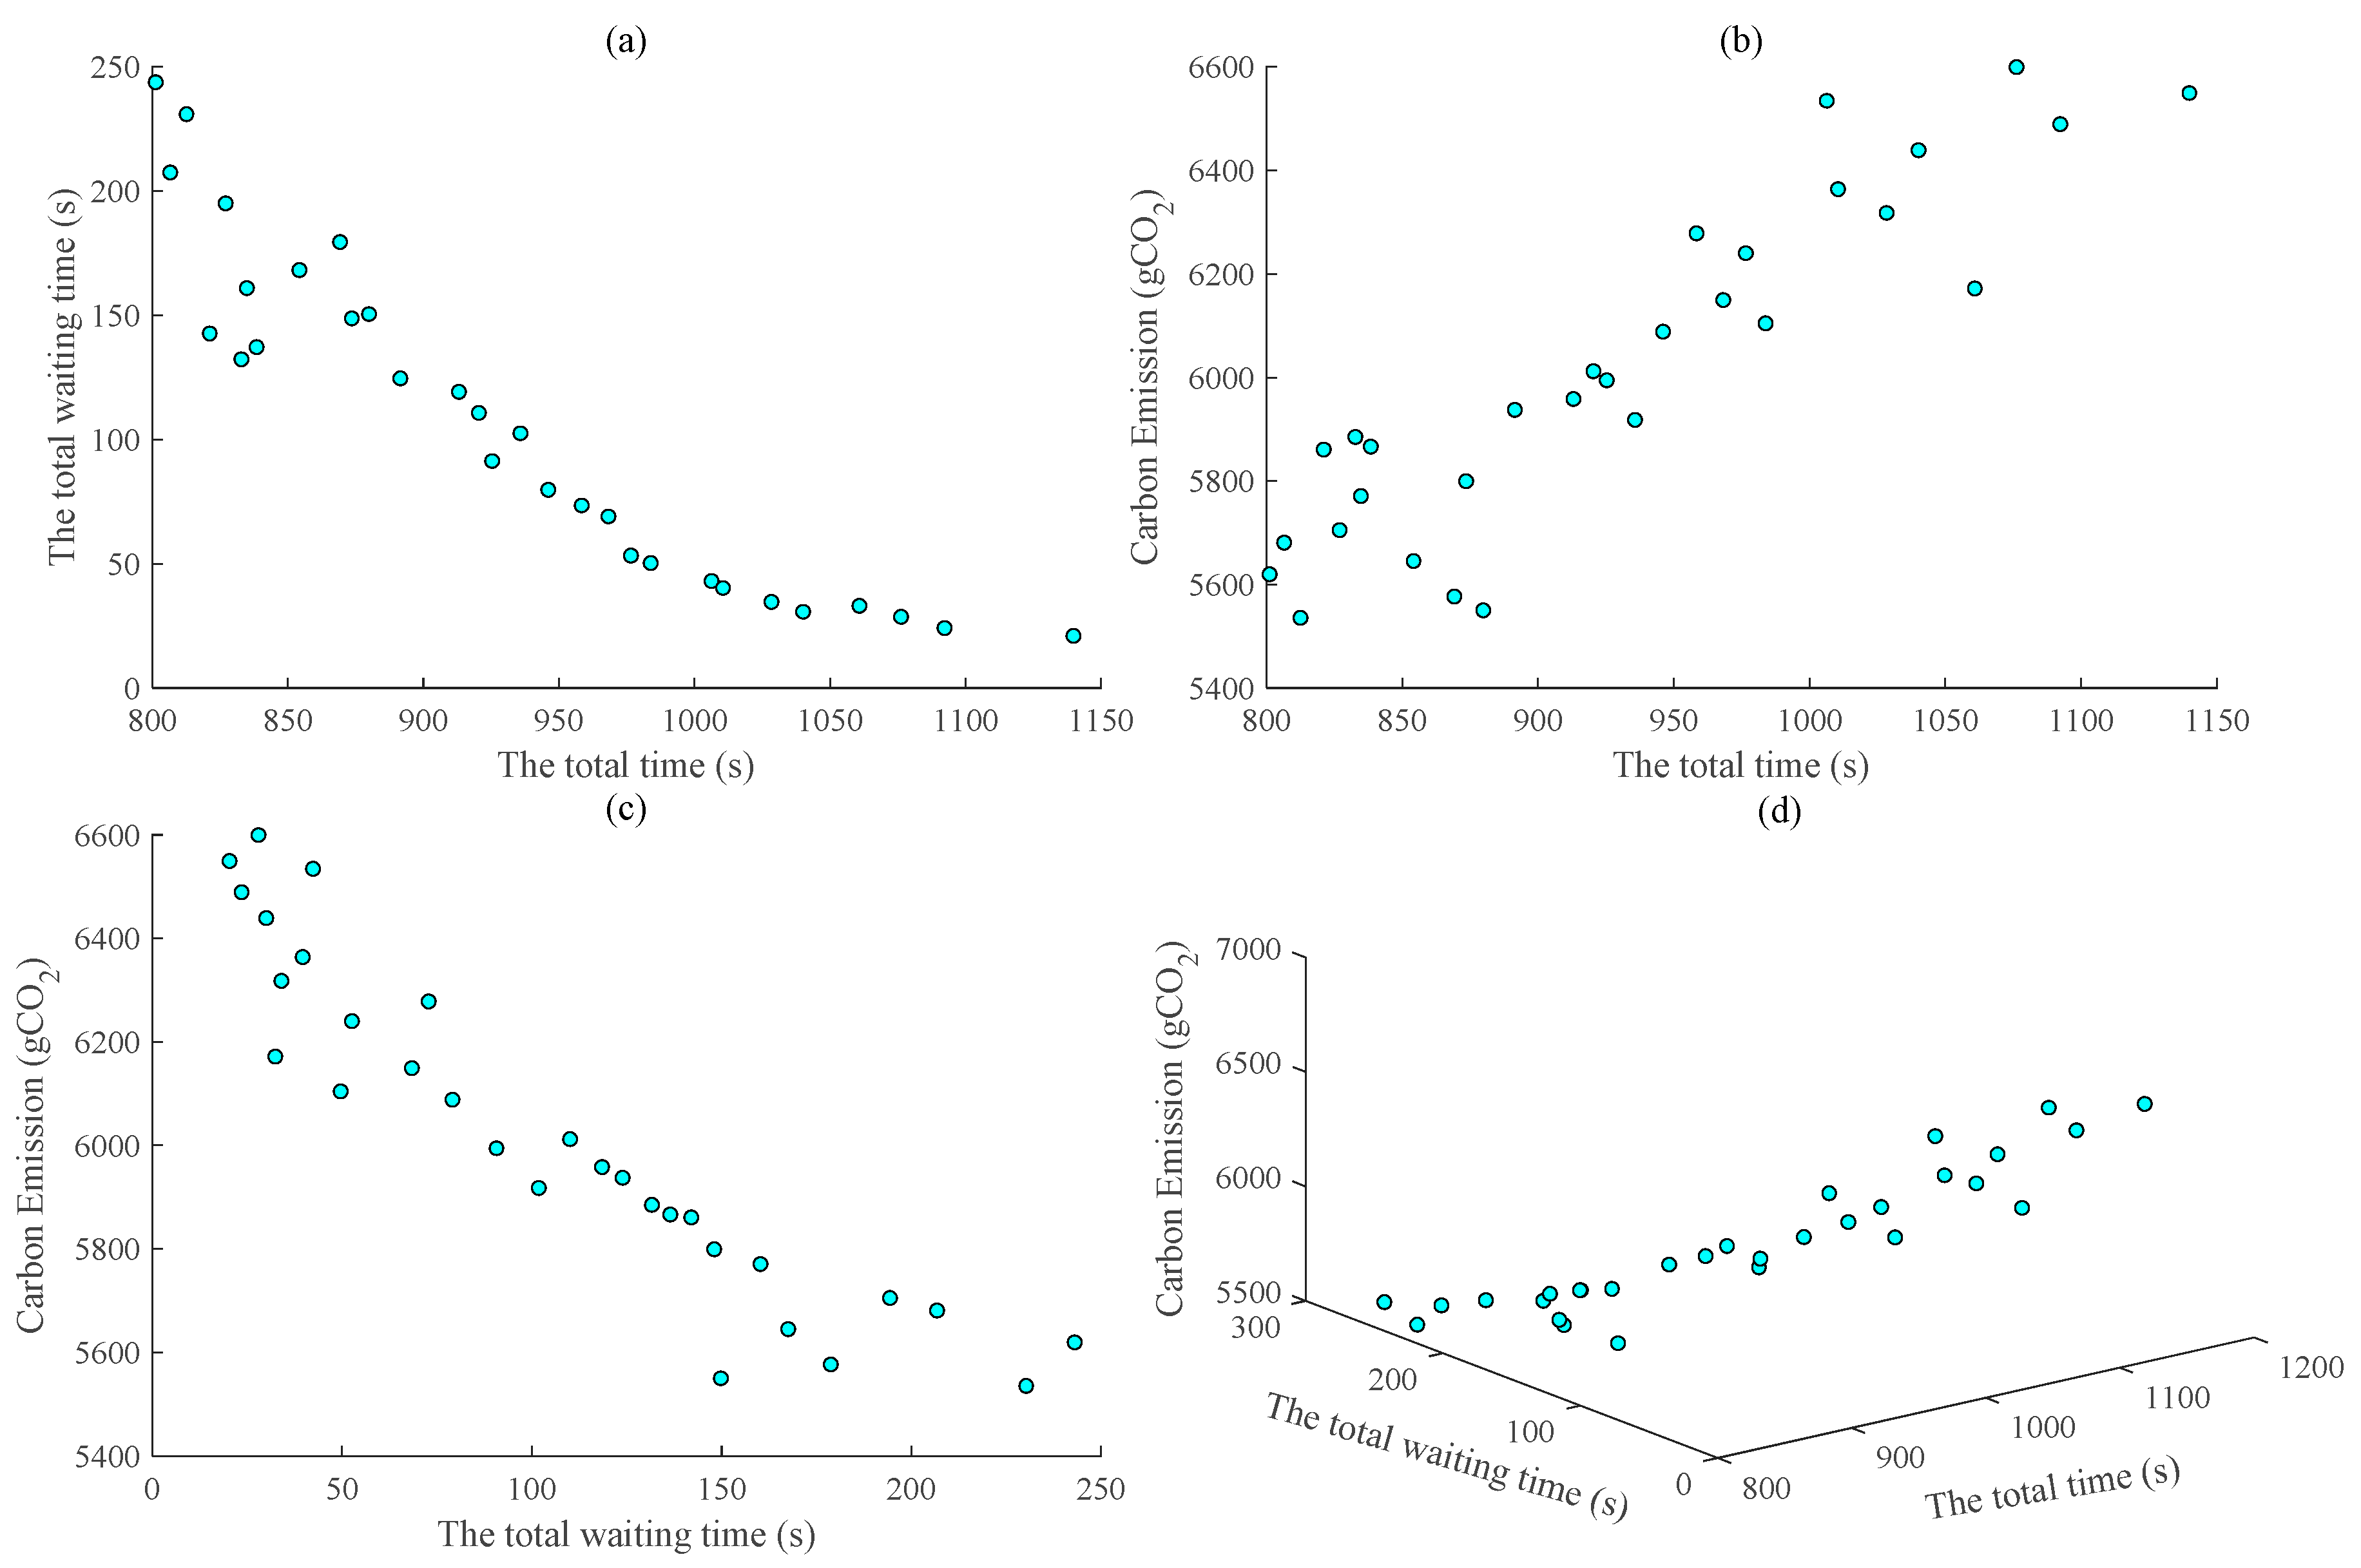
The hypervolume convergence curve is shown in Figure 11, and the slope tends to stabilize when the number of generation reaches 200. The convergence curve of optimization objectives is shown in Figure 12. According to the comparison of the minimum and average of optimization objective, the convergence of solution space is achieved. The results of the Pareto optimization are indicated in Figure 13 and Table 5. Figure 13a–c show the dependencies between pairs of objective functions, while Figure 13d shows the final Pareto optimal frontier. According to Figure 13a–c, the total time and the total waiting time were negatively correlated, while the carbon emissions and total time were positively correlated. The diagram in Figure 13d indicates the dependencies between three objective functions (the total time, carbon emissions, and the total waiting time). As the total time continues to increase, carbon emissions gradually increase and waiting time gradually decreases.
According to the analysis, the longer the total waiting time of shuttles, the shorter the free time of the lift. This means that the lift is in working condition for a long time, such that the total time of retrieval requests is shorter. On the contrary, the shorter the total waiting time of shuttles, the longer the free time of the lift, which increases the total time of retrieval requests and reduces the utilization of the lift. The carbon emissions are composed of three parts: the carbon emissions of the shuttle in the waiting process, the carbon emissions of the lift during the free process, and the carbon emissions of retrieval operation. The carbon emissions of the retrieval operation is the main component and, so, as the retrieval operation time increases, the total carbon emissions also increase.
The optimization results provided a unique ID to indicate the differences between the non-dominated solutions. Table 4 shows the optimal solutions, sorted by the total time in the increasing direction. The best solution had a total time of 801.53 s, which also had the maximum value of the waiting time. The worst solution was that with the lowest value of the waiting time and total time of 1140.32 s; 338.79 s longer than the best solution. In terms of carbon emissions, the best solution had carbon emissions of 5533.43 gCO2 and total time of 812.91 s, only 11.38 s longer than the minimum total time. There was a positive correlation between carbon emissions and the total time, but the correlation was not strong. The total time is composed of the working time and the free time of the lift. When an increase in the free time of the lift causes the total time to increase, the carbon emissions may not necessarily increase or even decrease. This is a vital finding of this paper.
We choose 3 chromosomes out of Pareto optimal solutions for detailed analysis, namely the chromosome of ID 1, the chromosome of ID 3 and the chromosome of ID 30. The values of ID 1 chromosome are 801.53 s, 243.40 s, and 5617.71 gCO2, respectively. It shows that the total time of chromosome 1 is the shortest and the system efficiency is the highest. The chromosome 3 has the smallest carbon emissions that is 5533.45 gCO2, which can help the warehousing system achieve sustainable development. The values of ID 30 chromosome are 1140.32 s, 20.55 s, and 6547.53 gCO2, respectively, which indicates that waiting time for shuttles is the shortest. It can help warehousing managers improve the utilization of shuttles.
The values of chromosome variables for each non-dominated solution have been enumerated in Table 6. According to the optimization results, a non-dominated solution was selected as an execution without priority. In fact, the operation of retrieval tasks considering the best solution as that with minimal total time for the final operation execution sequence. The solution of ID 1 was chosen as the final operation execution sequence in this real case; that is, the total time, the waiting time, and carbon emissions were 801.53 s, 243.40 s, and 5617.71 gCO2, respectively. Additionally, the solution ID 3 was selected as the final operation execution sequence, based on the minimal carbon emissions. Compared to ID 1, the total time was increased by 11.38 s but the carbon emissions were reduced by 84.26 gCO2, which is equivalent to the CO2 absorbed by a broad-leaved forest of about 110 m2 in one day.
The research results show that the Pareto optimization model can reduce carbon emissions and total working time, thereby reducing the operation cost and improving system efficiency. And this method has helped the logistics distribution center of the food company to improve the system efficiency. According to the sustainable development trend of warehousing system, the operation of systems not only considers the travel time but considers the carbon emissions and environment aspect on equipment. It also can help warehouse managers save a lot of operation costs. Meanwhile, for some equipment rental-type warehousing system, managers choose operation execution solution with a high utilization of shuttles, which can save some rental costs. Moreover, the method proposed in this paper can improve system efficiency and reduce carbon emissions without adding additional costs. This study provides a useful and a flexible method for task scheduling problem and this method has also been used in some practical implications. We believe this method will be more widely used in the future.

7. Conclusions

In this paper, the task scheduling problem was studied for DMSWS, which have high space utilization. A cycle time model based on the rearrangement operation and parallel retrieval of a multi-tier shuttle with sequence transfer to a lift was developed. According to the cycle time composition of a single retrieval task, the task scheduling problem was regarded as flow-shop scheduling model with parallel machines. In addition, a carbon emissions model was proposed, which considers both the storage/retrieval task operations and the idle processes of the equipment; this can help us to evaluate carbon emissions more comprehensively. An optimization model was derived, according to three correlated optimization objectives: the minimum total time, minimum carbon emissions, and minimum waiting time of shuttle. The NSGA-II algorithm was applied to solve the multi-objective optimization model. Finally, a real case was used to validate the effectiveness of the proposed optimization model. The results show that non-dominated solutions can be found effectively by proposed algorithm. Furthermore, ID 1 was selected as the execution sequence for the practical project, improving system efficiency while reducing carbon emissions.
In the future work, the impact of different storage policies (dedicated storage policy or class-based policy) can be considered. The devices acceleration and the procedure of the rearrangement operation are interesting direction for future research. Additionally, the influence of the solution algorithm should be considered. The results of multiple multi-objective optimization algorithms (SMS-EMOA or MOEA/D etc.) will be compared to find an algorithm that is more suitable for this problem.

Author Contributions

Conceptualization, X.Z. and L.X.; methodology, X.L.; software and validation, X.Z., X.L., and L.X.; formal analysis, X.Z.; investigation, X.L. and L.X.; resources, L.X.; data curation, X.Z.; writing—original draft preparation, X.Z.; writing—review and editing, X.Z. and L.X.; project administration and funding acquisition, X.L. and L.X. All authors have read and agree to the published version of the manuscript.

Funding

This research was funded by National Natural Science Foundation of China, grant number 51975417 and National Major Science and Technology Project, grant number 2018ZX09201010-005.

Institutional Review Board Statement

Ethical review and approval were waived for this study, due to this study not involving humans or animals.

Informed Consent Statement

This study does not involve humans.

Data Availability Statement

Data is contained within this article.

Conflicts of Interest

The authors declare that they have no potential conflict of interests or personal relationships that could have appeared to influence the work reported in this paper.

References

  1. Tone, L.; Milan, E.; Bojan, R. Energy efficiency model for the mini-load automated storage and retrieval systems. Int. J. Adv. Manuf. Tech. 2014, 70, 97–115. [Google Scholar] [CrossRef]
  2. Hausman, W.H.; Schwarz, L.B.; Graves, S.C. Optimal Storage Assignment in Automatic Warehousing Systems. Manage. Sci. 1976, 22, 629–638. [Google Scholar] [CrossRef]
  3. Bozer, Y.A.; John, A.W. Travel-time Models for Automated Storage/Retrieval Systems. IIE Trans. 1984, 16, 329–338. [Google Scholar] [CrossRef]
  4. Xu, X.; Shen, G.; Yu, Y.; Huang, W. Travel Time Analysis for the Double-deep Dual-shuttle AS/RS. Int. J. Prod. Res. 2015, 53, 757–773. [Google Scholar] [CrossRef]
  5. Wang, Y.; Zhang, R.; Lu, H.; Zhang, X.; Liu, Z. Task scheduling model of double-deep multi-tier shuttle system. Processes 2019, 7, 604. [Google Scholar] [CrossRef] [Green Version]
  6. Hwang, H.; Seong, B.L. Travel-time Models Considering the Operating Characteristics of the Storage and Retrieval Machine. Int. J. Prod. Res. 1990, 28, 1779–1789. [Google Scholar] [CrossRef]
  7. Kouvelis, P.; Papanicolaou, V. Expected Travel Time and Optimal Boundary Formulas for a Two-class-based Automated Storage/Retrieval System. Int. J. Prod. Res. 1995, 33, 2889–2905. [Google Scholar] [CrossRef]
  8. Nia, A.; Haleh, H.; Saghaei, A. Dual command cycle dynamic sequencing method to consider GHG efficiency in unit-load multiple-rack automated storage and retrieval systems. Comput. Ind. Eng. 2017, 111, 89–108. [Google Scholar] [CrossRef] [Green Version]
  9. Borovinsek, M.; Ekren, B.Y.; Burinskiene, A.; Lerher, T. Multi-objective optimisation model of shuttle-based storage and retrieval system. Transport 2017, 32, 120–137. [Google Scholar] [CrossRef] [Green Version]
  10. Emanuele, G.; Valeria, M.; Davide, A.; Riccardo, D.; Claudio, S.; Marco, S. Energy evalution of deep-lane autonomous vehicle storage and retrieval system. Sustainability 2019, 11, 3817. [Google Scholar] [CrossRef] [Green Version]
  11. Ene, S.; İlker, K.; Aksoy, A.; Öztürk, N. A genetic algorithm for minimizing energy consumption in warehouses. Energy 2016, 114, 973–980. [Google Scholar] [CrossRef]
  12. Torabizadeh, M.; Yusof, N.M.; Ma’Aram, A.; Shaharoun, A.M. Identifying sustainable warehouse management system indicators and proposing new weighting method. J. Clean. Prod. 2020, 248, 1–11. [Google Scholar] [CrossRef]
  13. Hao, J.; Shi, H.; Shi, V.; Yang, C. Adoption of Automatic Warehousing Systems in Logistics Firms: A Technology–Organization–Environment Framework. Sustainability 2020, 12, 5185. [Google Scholar] [CrossRef]
  14. Bortolini, M.; Accorsi, R.; Gamberi, M.; Manzini, R.; Regattieri, A. Optimal design of AS/RS storage systems with three-class-based assignment strategy under single and dual command operations. Int. J. Adv. Manuf. Tech. 2015, 79, 1747–1759. [Google Scholar] [CrossRef]
  15. Regattieri, A.; Santarelli, G.; Manzini, R.; Pareschi, A. The Impact of Dwell Point Policy in an Automated Storage/Retrieval System. Int. J. Prod. Res. 2013, 51, 4336–4348. [Google Scholar] [CrossRef]
  16. Hu, Y.H.; Huang, S.Y.; Chen, C.; Hsu, W.J.; Toh, A.C.; Loh, C.K.; Song, T. Travel time analysis of a new automated storage and retrieval system. Comput. Oper. Res. 2005, 32, 1515–1544. [Google Scholar] [CrossRef]
  17. Sari, Z.; Saygin, C.; Ghouali, N. Travel-time Models for Flow-rack Automated Storage and Retrieval Systems. Int. J. Adv. Manuf. Tech. 2005, 25, 979–987. [Google Scholar] [CrossRef]
  18. De Koster, M.B.M.; Le-Duc, T.; Yu, Y. Optimal Storage Rack Design for a 3-dimensional Compact AS/RS. Int. J. Prod. Res. 2008, 46, 1495–1514. [Google Scholar] [CrossRef] [Green Version]
  19. Yu, Y.; De Koster, M.B.M. Designing an Optimal Turnover-based Storage Rack for a 3D Compact Automated Storage and Retrieval System. Int. J. Prod. Res. 2009, 47, 1551–1571. [Google Scholar] [CrossRef]
  20. Lerher, T.; Sraml, M.; Potrc, I.; Tollazzi, T. Travel Time Models for Double-deep Automated Storage and Retrieval Systems. Int. J. Prod. Res. 2010, 48, 3151–3172. [Google Scholar] [CrossRef] [Green Version]
  21. Xu, X.; Zou, B.; Shen, G.; Yeming, G. Travel-time models and fill-grade factor analysis for double-deep multi-aisle AS/RSs. Int. J. Prod. Res. 2016, 54, 4126–4144. [Google Scholar] [CrossRef]
  22. Tone, L. Travel time model for double-deep shuttle-based storage and retrieval systems. Int. J. Prod. Res. 2016, 54, 2519–2540. [Google Scholar] [CrossRef]
  23. Roodbergen Kees, J.; Iris, F.; Vis, A. A Survey of Literature on Automated Storage and Retrieval Systems. Eur. J. Oper. Res. 2009, 194, 343–362. [Google Scholar] [CrossRef] [Green Version]
  24. Gu, J.; Marc, G.; Leon, F.M. Research on Warehouse Design and Efficiency Evaluation: A Comprehensive Review. Eur. J. Oper. Res. 2010, 203, 539–549. [Google Scholar] [CrossRef]
  25. Malmborg, C.J. Conceptualizing Tools for Autonomous Vehicle Storage and Retrieval Systems. Int. J. Prod. Res. 2002, 40, 1807–1822. [Google Scholar] [CrossRef]
  26. Fukunari, M.; Malmborg, C.J. An efficient cycle time model for autonomous vehicle storage and retrieval systems. Int. J. Prod. Res. 2008, 46, 3167–3184. [Google Scholar] [CrossRef]
  27. Sunderesh, S.H.; Xiao, C.; Ananth, K.; Malaborg, C.J. Analytical models for analysis of automated warehouse material handling systems. Int. J. Prod. Res. 2011, 49, 6833–6861. [Google Scholar] [CrossRef]
  28. Gino, M.; Marco, M.; Sara, P.; Elena, T. Analytical model to estimate efficiency of autonomous vehicle storage and retrieval systems for product totes. Int. J. Prod. Res. 2012, 50, 7134–7148. [Google Scholar] [CrossRef]
  29. Ekren, B.Y. Design and Analysis of Autonomous Vehicle Storage and Retrieval Systems via Queuing Network and Simulation Models. Ph.D. Thesis, University of Louisville, Louisville, KY, USA, 29 October 2009. [Google Scholar]
  30. Cai, X.; Heragu, S.S.; Liu, Y. Modeling and evaluating the AVS/RS with tier-to-tier vehicles using a semi-open queueing network. IIE Trans. 2014, 46, 905–927. [Google Scholar] [CrossRef]
  31. Zou, B.; Xu, X.; Gong, Y.; De, K.R. Modeling parallel movement of lifts and vehicles in tier-captive vehicle-based warehousing systems. Eur. J. Oper. Res. 2016, 254, 51–67. [Google Scholar] [CrossRef] [Green Version]
  32. Wang, Y.; Mou, S.; Wu, Y. Task scheduling for multi-tier shuttle warehousing systems. Int. J. Prod. Res. 2015, 53, 1–12. [Google Scholar] [CrossRef]
  33. Lerher, T.; Ekren, B.; Rosi, B. Travel time model for shuttle-based storage and retrieval systems. Int. J. Adv. Manuf. Techn. 2015, 78, 1705–1725. [Google Scholar] [CrossRef]
  34. Tappia, E.; Roy, D.; René, D.K.; Melacini, M. Modeling, analysis, and design insights for shuttle-based compact storage systems. Soc. Sci. Electron. Publ. 2017, 51, 269–295. [Google Scholar] [CrossRef] [Green Version]
  35. Marco, B.; Maurizio, F.; Emilio, F.; Mauro, G.; Francesco, P. Time and energy optimal unit-load assignment for automatic S/R warehouses. Int. J. Prod. Econ. 2017, 190, 133–145. [Google Scholar] [CrossRef]
  36. Bin, Y. Research on carbon emissions reduction cost of the power industry in China based on resource allocation optimization. Ph.D. Thesis, Harbin Institute of Technology, Heilongjiang, China, 13 May 2013. [Google Scholar]
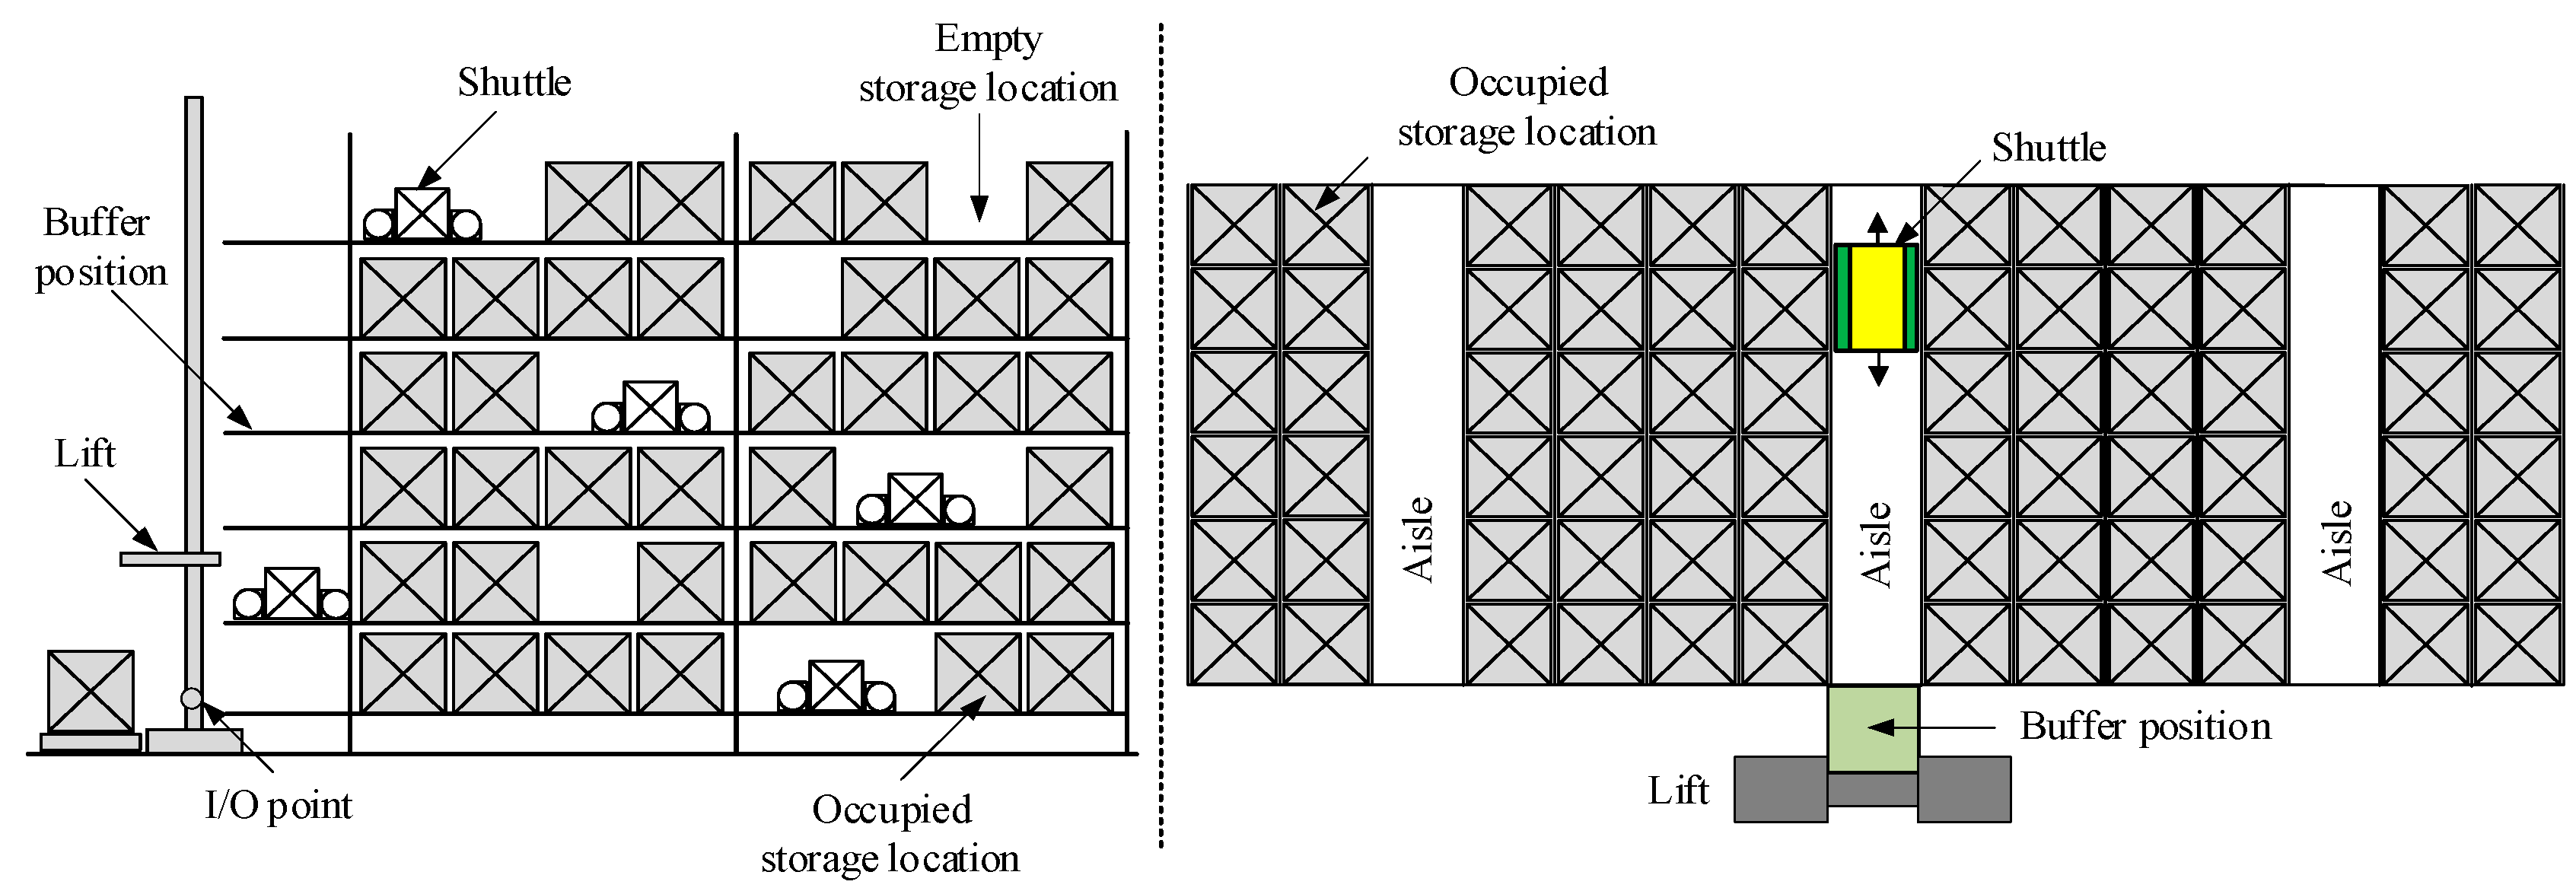
Figure 1. Schematic diagram of the double-deep multi-tier shuttle warehousing system.
Processes 09 00041 g001
Figure 2. The procedure of the rearrangement of the blocking stock keeping units (SKU).
Processes 09 00041 g002
Figure 3. Flow chart for multi-tasking.
Processes 09 00041 g003
Figure 4. Cycle time analysis for the retrieval task k.
Processes 09 00041 g004
Figure 5. Analysis of working time of the retrieval tasks as a whole.
Processes 09 00041 g005
Figure 6. The detailed program flow of NSGA-II.
Processes 09 00041 g006
Figure 7. Example of encoding and decoding.
Processes 09 00041 g007
Figure 8. The genetic operators of chromosome.
Processes 09 00041 g008
Figure 9. The layout for the double-deep multi-tier shuttle warehousing systems (DMSWS) of the logistics distribution center.
Processes 09 00041 g009
Figure 10. Response of Pareto ratio.
Processes 09 00041 g010
Figure 11. The hypervolume convergence curve.
Processes 09 00041 g011
Figure 12. The convergence curve of optimization objectives.
Processes 09 00041 g012
Figure 13. Non-dominated solution results.((a) the dependency between the total waiting time and the total time; (b) the dependency between the carbon emission and the total time; (c) the dependency between the total waiting time and the total waiting time; (d) the final Pareto optimal frontier.)
Processes 09 00041 g013
Table 1. A summary of researches.
CitationYearType of CycleMethodSRObjective
Hausman, Schwarz, and Graves1976SCAnalytical formulaeSDExpected travel-time
Bozer and White1984SC/DCAnalytical formulaeSDExpected travel-time
Hwang and Lee1990SC/DCAnalytical formulaeSDExpected travel-time
Kouvelis and Papanicolaou1995SC/DCAnalytical formulaeSDExpected travel-time
Bortolini et al.2015SC/DCAnalytical formulaeSDMean travel-time
Regattieri et al.2013SC/DCSimulation modelsSDTravel-time
Travel distance
Hu et al.2005SCAnalytical formulae
Simulation models
SPTravel-time
Sari, Saygin, and Ghouali2005SC/DCAnalytical formulae
Simulation models
3DTravel-time
De Koster, Le-Duc, and Yu2008SC/DCAnalytical formulae3DTravel-time
Yu and De Koster2009SCAnalytical formulae3DTravel-time
Lerher et al.2010SC/DCAnalytical formulae
Simulation models
DDTravel-time
Xu et al.2015SD/DC/QCAnalytical formulaeDDTravel-time
Xu et al.2016SD/DCAnalytical formulae
Simulation models
DDTravel-time; Cost
Malmborg2002SC/DCProbability analyticalSDCycle time;
Capacity utilization
Fukunari and Malmborg2007SC/DCProbability analytical
Simulation models
SDCycle time;
Lift utilization;
Vehicle utilization
Heragu et al.2011SC/DCQueuing networkSDSystem throughput
Marchet et al.2012SC/DCQueuing networkSDCycle time; Waiting time
Wang Y, Mou S, and Wu Y2015SCAnalytical formulaeSDTravel-time; Waiting time
Idle time
Lerher et al.2015SC/DCAnalytical formulae
Simulation models
SDTravel-time
Tappia et al.2017DCQueuing networkSDTravel-time
Lerher, Edl M, and Bojan Rosi2014DC/QCQueuing networkSDThroughput capacity;
Energy consumption;
Carbon emissions;
Bortolini M et al.2017SCAnalytical formulaeSDTravel-time; Energy
NIA A, Haleh H, Saghaei A2017DCAnalytical formulaeSDCost; Carbon emissions
Borovinsek2017SC/DCAnalytical formulaeSDEnergy consumption; Cost
Wang Y et al.2019DCAnalytical formulaeDDTravel-time
Note: SC: single-command cycle, DC: dual-command cycle, QC: quadruple-command cycle; SD: single-deep SR, DD: double-deep SR, SP: split-platform SR.
Table 2. Parameters value used in the optimization.
ParameterUnit of MeasureValueParameterUnit of MeasureValue
H m1.5 A -4
W a m1.5 T -8
W m1.0 C -20
L m1.2 f e gCO 2 / kwh 974
v s m/s1.5 e 1 s3
v l m/s2.0 e 2 s2
P s f kw0.5 e 3 s5
P s m kw1.0 α -0.8
P l f kw0.8 P s w kw0.1
P l m kw1.5 P l w kw0.2
Table 3. All retrieval tasks and their original retrieval positions.
SequenceAisleColumnTierDepthSequenceAisleColumnTierDepth
1314213111952
221922321852
34922334151
423213431451
52322353252
6314223621151
71832373262
815323831462
941831394761
1031732401962
11212324121561
12418324231461
1318314311172
1433414442071
1522042451371
1641341462872
1747424731771
182941483671
1924424931772
2031142501372
2118415142072
2211642522871
233342532982
2441342543481
25311415511281
2629425641881
271842572981
284152581382
29314525911282
3021152603482
Table 4. Factor level of parameters.
Factor LevelParameters
NcNm
10.800.10
20.850.15
30.900.20
Table 5. Non-dominated solutions.
ID T t o t a l ( s ) w k ( s ) T E ( gCO 2 ) ID T t o t a l ( s ) w k ( s ) T E ( gCO 2 )
1801.53 *243.405617.7116925.7390.955992.56
2806.92207.105678.9817936.15102.105915.88
3812.91230.605533.45 *18946.4679.356086.46
4821.47142.305858.9119958.7873.056276.44
5827.35194.705703.2420968.6568.656147.46
6833.18131.905883.1821976.9452.856238.18
7835.16160.555768.8622984.2549.856102.57
8838.81136.755864.48231006.7642.606532.57
9854.55167.855643.19241010.9339.856361.85
10869.59179.105574.86251028.8234.256315.93
11873.92148.355797.45261040.5330.256437.27
12880.25150.105548.05271061.2932.656169.82
13891.87124.205935.48281076.6728.206597.71
14913.47118.805956.40291092.7423.756487.41
15920.81110.356010.21301140.3220.55*6547.53
Note: * The optimal value among 30 non-dominated solutions.
Table 6. Detailed execution solutions for non-dominated solution.
IDChromosome Variable Value (Operation Execution Solution)
1[54,38,53,3,42,17,35,47,26,1,32,20,10,6,29,58,15,44,8,19,2,55,11,49,22,13,48,59,21,41,23,7,51,27,5,31,43,9,33,57,4,16,28,52,56,36,40,46,37,25,30,45,18,60,50,24,12,14,34,39]
2[54,32,24,8,41,51,15,36,4,59,50,30,1,21,42,49,20,34,18,60,45,57,23,31,19,43,12,40,35,7,4,28,17,10,52,26,38,53,3,22,29,13,55,27,6,58,33,5,16,47,9,48,25,39,14,46,11,37,56,2]
3[54,4,32,24,1,41,51,8,15,36,59,50,30,21,42,49,20,34,18,60,45,57,23,31,19,43,12,40,35,7,44,28,17,10,52,26,38,53,3,22,29,13,55,27,6,58,33,5,16,47,9,48,25,39,14,46,11,37,56,29]
4[54,4,32,24,1,41,51,15,36,59,50,30,8,20,34,18,60,45,21,42,49,31,19,57,23,43,12,40,35,7,44,28,17,10,52,26,38,48,3,29,39,14,9,33,56,22,13,55,27,6,58,5,16,47,53,25,46,2,37,11]
5[54,38,35,3,42,17,53,26,1,32,20,10,6,29,58,15,44,8,19,2,55,11,49,22,13,48,59,21,41,7,51,27,5,31,43,9,33,57,4,16,47,28,52,56,50,23,40,46,37,25,30,45,18,60,36,24,34,14,39,12]
6[5,19,53,44,38,31,20,1,30,26,7,39,45,6,13,25,14,32,2,35,46,24,36,47,41,3,50,37,29,27,40,48,34,16,49,33,18,57,42,15,10,59,28,21,11,58,17,51,8,56,52,22,23,9,55,4,54,12,43,60]
7[19,53,5,44,38,31,20,1,30,26,7,39,45,6,13,25,14,32,2,35,46,24,36,47,41,3,50,37,29,27,40,48,34,16,49,33,18,57,42,15,10,59,28,21,11,58,17,51,8,56,52,22,23,9,55,4,54,12,43,60]
8[54,4,32,24,1,41,8,51,15,36,59,50,30,21,42,49,20,34,18,60,45,57,23,31,19,43,12,40,35,7,44,28,17,10,52,26,38,53,3,29,39,14,9,33,56,22,13,55,27,6,58,5,16,47,48,25,46,2,37,11]
9[54,4,21,42,49,32,24,8,41,51,15,36,59,50,30,1,20,34,18,60,45,31,43,12,40,35,7,44,28,17,10,57,23,52,26,38,53,3,22,29,13,55,27,6,58,33,5,16,47,9,19,48,25,14,39,2,56,11,37,46]
10[19,32,50,57,24,23,8,41,51,15,36,59,30,1,20,34,18,60,45,21,42,49,31,43,12,40,35,7,44,28,17,10,52,26,38,53,3,22,29,13,55,27,6,58,33,5,16,47,54,9,48,25,39,14,2,56,4,37,11,46]
11[57,24,23,32,8,41,51,15,36,59,50,30,1,20,34,18,60,45,21,42,49,31,43,12,40,35,7,44,28,17,10,52,26,38,53,3,22,29,13,55,27,6,58,33,5,16,47,54,39,14,9,19,2,56,46,4,25,37,48,11]
12[32,24,8,41,51,15,36,59,50,30,1,20,34,18,60,45,21,42,49,31,43,12,40,35,7,44,28,17,10,52,26,38,53,3,22,29,13,55,27,6,58,33,5,57,16,47,54,39,14,9,19,2,46,4,37,48,23,56,25,11]
13[48,11,15,31,26,13,39,59,2,22,35,6,28,7,23,36,38,33,21,45,56,5,17,8,55,53,46,40,32,52,34,24,47,41,50,16,12,30,37,10,1,60,27,14,43,3,25,29,42,44,4,19,54,9,20,58,51,18,57,49]
14[32,24,8,41,51,15,36,59,50,30,1,20,34,18,60,45,21,42,49,31,43,12,40,35,7,44,28,17,10,52,26,38,53,3,22,29,13,55,27,6,58,33,5,57,16,47,54,9,23,39,14,19,2,46,4,37,56,25,48,11]
15[48,11,15,31,26,13,39,59,2,22,35,6,28,7,50,25,12,56,5,17,8,55,23,3,10,49,54,36,40,21,1,38,4,47,16,58,43,24,30,60,14,33,45,53,46,32,52,37,27,34,41,29,42,44,19,9,20,51,57,18]
16[5,19,53,44,38,31,20,1,30,26,7,39,45,6,13,25,14,32,2,35,46,24,36,47,41,3,50,37,29,27,40,48,34,16,49,33,18,57,42,15,10,59,28,21,11,58,17,51,8,56,52,22,23,55,60,9,54,12,43,4]
17[11,36,38,33,21,45,56,22,5,39,28,17,6,8,55,31,53,46,15,40,32,52,2,34,24,48,26,13,59,35,7,23,3,10,49,54,25,1,12,4,47,16,58,43,30,60,14,42,51,27,41,19,44,37,57,9,29,18,20,50]
18[32,24,8,41,51,15,36,59,50,30,1,20,34,18,60,45,21,42,49,31,43,12,40,35,7,44,28,17,10,52,26,38,53,3,22,29,13,55,27,6,58,33,5,57,16,47,54,9,23,19,48,25,56,46,39,4,14,11,2,37]
19[19,20,56,36,27,58,17,49,30,38,16,46,34,8,33,53,24,32,41,51,15,10,50,21,42,31,43,12,40,35,7,44,28,29,39,14,59,1,18,60,45,9,55,22,4,26,13,5,52,25,23,37,54,2,48,6,47,3,57,11]
20[48,11,15,31,26,13,39,59,2,22,35,6,28,7,23,3,10,49,54,5,25,36,40,21,1,12,38,4,47,55,17,8,53,46,32,52,34,24,41,43,45,33,56,50,16,30,37,60,27,14,57,58,29,51,18,20,19,44,42,9]
21[54,4,21,42,49,31,43,12,40,35,7,44,28,15,29,39,14,10,32,24,8,41,51,36,59,50,30,1,20,34,18,60,45,9,33,55,22,19,3,13,2,17,56,27,58,38,16,46,53,26,5,52,25,23,37,48,6,47,11,57]
22[15,41,25,38,3,51,50,12,37,6,60,7,53,32,27,1,29,43,59,21,33,48,9,4,35,17,36,20,26,44,10,19,16,39,54,18,28,52,13,58,14,40,57,49,2,42,34,24,5,56,30,22,11,45,23,31,8,55,47,46]
23[10,39,31,60,1,11,29,52,3,56,20,35,49,48,18,45,38,43,25,8,21,17,55,15,26,7,27,28,40,9,24,37,23,57,30,19,6,59,44,58,5,54,12,14,51,2,34,16,33,41,36,50,42,22,47,13,53,32,4,46]
24[35,46,50,30,24,52,42,33,22,59,15,34,43,12,25,39,5,17,8,1,7,6,54,4,27,53,19,21,44,47,18,28,9,20,41,26,57,36,29,56,11,48,23,37,58,38,51,13,32,3,45,40,49,55,2,16,10,31,0,14]
25[22,5,49,59,3,7,48,52,6,58,19,36,20,1,18,33,46,2,57,9,4,27,44,29,11,17,34,26,45,39,47,24,54,30,40,10,15,53,51,60,50,56,16,13,28,37,43,25,35,32,41,55,38,23,14,31,8,21,12,42]
26[35,7,50,17,11,42,36,13,28,33,58,44,24,23,40,20,59,48,10,4,54,2,18,30,49,22,60,57,16,51,38,14,56,55,34,45,41,39,43,31,27,47,19,53,3,26,6,8,1,29,25,12,21,32,37,46,15,9,52,5]
27[21,8,51,7,43,54,11,15,6,41,23,33,3,5,27,47,14,39,44,45,29,28,16,36,37,49,56,19,48,57,24,59,22,42,55,1,53,25,31,18,30,26,34,58,12,32,38,17,60,35,52,4,50,10,2,20,46,40,9,13]
28[35,7,50,17,11,42,36,13,28,33,58,44,24,23,40,20,59,48,10,4,54,2,18,30,49,22,60,57,16,51,38,14,56,55,34,45,41,39,43,31,27,47,19,53,3,26,6,8,1,29,25,12,21,32,37,9,15,5,46,52]
29[28,40,44,57,37,36,38,12,39,21,45,1,30,14,32,52,55,16,46,13,51,9,6,31,4,26,50,35,3,56,8,29,17,15,11,33,24,7,2,58,34,54,18,42,53,43,20,59,5,10,60,47,27,22,19,25,48,41,23,49]
30[35,46,50,30,24,52,42,33,22,59,15,34,43,12,25,39,5,17,8,1,7,6,54,4,27,53,19,21,44,47,18,28,9,20,41,26,57,36,29,56,11,48,23,37,58,38,51,13,10,49,16,32,45,60,31,55,3,2,40,14]
Publisher’s Note: MDPI stays neutral with regard to jurisdictional claims in published maps and institutional affiliations.