1. Introduction
Innovation in biologics manufacturing urges toward continuous operations to cope with new entities in smaller volumes, such as antibody fragments, virus-like particles (VLPs), exosomes, and mRNA (messenger ribonucleic acid) [
1,
2]. However, to demonstrate innovation, at first, monoclonal antibody manufacturing in Chinese Hamster Ovary (CHO) cells is the standard platform process [
3]. Nonetheless, monoclonal antibody manufacturing in Chinese Hamster Ovary (CHO) cells is still the most widely used process for demonstrating new innovations, as it is well established in industry and academia. In early process development, several important decisions have to be made, e.g., use of disposable or stainless-steel equipment, and any decision has to be filed upon the processing operation, which includes the control strategy within the regulatory demanded quality by-design (QbD) concept. In contrast to documented lot deviations in batch or fed-batch operation, continuous manufacturing opens up new operation windows with improved constant product quality in combination with advanced process control (APC) [
4]. However, to achieve APC, more sophisticated sensors are key technologies in a robust control strategy, since they can provide additional information on the process state. Moreover, night and weekend shift operation teams have to be supported by reliable process controls. Fully autonomous processing is in high demand.
The unit operations for a fully continuous process have been proposed and their feasibility is well documented [
5,
6]. Recent improvements focus on digital twins [
3] and process control [
7,
8]. Implementation of an advanced control strategy requires sensors, in-line or at-line analytics, which have to be chosen in early process development, e.g., for the chromatography units, which are the key-technology for product purity [
7,
8,
9].
First, in-line studies started naturally with the first unit operation, cultivation, either operated as a fed-batch or perfusion, with a broad application portfolio [
1,
10,
11,
12,
13]. Nevertheless, the whole downstream has to follow.
Due to its equipment complexity, continuous chromatography has a long tradition in advanced process control concepts [
14,
15,
16] for autonomous operation. Break-through operations in capturing like periodic counter-current chromatography (PCC) and multi-column solvent gradient purification (MSCGP) processing [
17,
18] could easily be controlled by inline UV detection [
19,
20], since the switch criteria are defined by target component breakthrough. More complex offline analytics and model-based calculations are therefore not necessary, but possible, of course [
6]. In addition to UV sum signal detection, diode-array detector (DAD) concepts of peak deconvolution have successfully been applied to the separation of monoclonal antibodies (mAbs) [
8,
21]. This approach could specify side components at least in main groups to fine-tune the switch criteria if intended.
In general, PAT is not limited to in-line analytics, but is a consistent technology approach that is integrated into the QbD philosophy demanded by regulatory authorities. It includes process control in order to gain real time release testing (RTRT) as a benefit in quality assurance (QA) efforts reduction as improved product quality. RTRT has to correlate to critical product quality attributes, such as bio-efficacy by titer, purity, and bioactivity. State of the art QA are offline analytical methods, such as Protein A and size exclusion chromatography (SEC), enzyme-linked immunosorbent assay (ELISA), infrared spectroscopy, as well as glycosylation analytics via HPLC or HPLC-mass spectrometry [
22,
23,
24]. The feasibility of RTRT by online PAT tools needs to be proven.
For process development, a sophisticated PAT concept has to be developed parallel to upstream processing (USP) and downstream processing (DSP) modeling, later on supporting model validation [
3,
25,
26,
27,
28,
29], piloting, and production, as shown in
Figure 1. Parallel to model validation, piloting, and production the developed PAT method and the partial least squares regression (PLSR) system have to be further refined. In addition to appropriate PAT, digital twins for the whole process are a central key-technology for achieving RTRT. It has been proven that, for all unit operations, such distinct validated process models are available as digital twins [
1,
5,
8,
26,
27,
29,
30,
31,
32].
1.1. State of the Art in Spectroscopic PAT
In
Table 1 an overview of different spectroscopic methods is given. Raman spectroscopy is a promising candidate to enable measurements in impure samples, e.g., by using an in-situ probe in upstream processing [
12,
33,
34]. In Raman spectroscopy, due to inelastic impacts of photons with the analytes, the photons are scattered [
34]. The scattering pattern is molecule-specific and, therefore, the identification and quantification of different components is possible. Raman spectroscopy was successfully employed in USP for the quantification of substrates (e.g., glucose), metabolites (e.g., lactate), and mAb [
12,
35]. In contrast to alternative processes, such as aqueous two-phase extraction (ATPE) and precipitation, in which barely any spectroscopic methods have been published for explicit use as PAT, various concepts have already been demonstrated for established processes such as chromatography, ultrafiltration/diafiltration (UF/DF) and lyophilization [
36,
37].
Fourier-transformed-infrared-spectroscopy (FTIR) measures the absorption of photons, typically between 4000–400 cm
−1. Biomolecules contain many amine, carbonyl or hydroxy groups, which absorb photons in this low-energy range by inducing stretching, scissoring and bending of molecule bonds [
38]. In contrast to Raman spectroscopy, in IR spectroscopy the absorption from water is considerably strong and may interfere with concentration measurement of biomolecules in aqueous solution [
39]. Nonetheless, IR measurement was successfully applied in USP for the prediction of mAb concentration [
40]. While applicable in early process stages, FTIR is also a viable technique for quality evaluation [
22,
41]. FTIR was successfully applied in protein detection in ATPE [
42], monitoring of mAb purification in chromatography [
43] and inline concentration measurement in ultrafiltration [
37]. Raman and NIR can be used as PAT technology in lyophilization processes [
44,
45,
46,
47,
48,
49,
50]. Raman spectra can indicate different critical product and process characteristics, e.g., water to ice conversion, product crystallization, annealing steps, solid-state characteristics of intermediate and end products and kinetics of polymorphic transitions [
49,
50]. NIR can also indicate critical product and process characteristics [
50] such as the secondary structure of lyophilized proteins and the residual moisture [
49]. NIR and Raman provide the ability to determine the endpoint of primary drying. Water and ice produce weak Raman signals but have high absorption in NIR spectra. Both measurements determine the endpoint by detecting a loss of water signal, but NIR is the more sensitive technique and is additionally capable of detecting the endpoint of secondary drying [
44,
50]. DAD measures the absorption of photons in UV/VIS, typically in the range between 190–520 nm. In contrast to FTIR, in this high-energy range, delocalized π-electron systems are the main absorbers [
51]. DAD is widely used in chromatography but potential applications in earlier process stages exist [
7]. Fluorescence measures the time-delayed emission of photons after excitation by a specific wavelength. The emission range is lower than the excitation wavelength, since the photons lose energy after absorption due to non-radiative transitions [
52]. Fluorescence was previously employed in monitoring upstream processes [
10]. Integrity of IgG can also be monitored by fluorescence, e.g., in combination with circular dichroism measurement [
53]. The limits of detection values given in
Table 1 are for orientation purposes only, since they vary with different measurement/integration times and product. However, the presence of too many side components can reduce the detection accuracy [
54]. Detection accuracy enhancements through combination of multiple spectroscopic techniques have been proposed [
55].
The above presented PAT approaches in combination with a digital twin can be used to achieve advanced process control and in-line process optimization [
30,
56,
57,
58,
59,
60]. PAT can compensate model inaccuracies by providing additional measurement data and the digital twin is used for inline process optimization and online process monitoring.
1.2. QbD-Based PAT Control Strategy
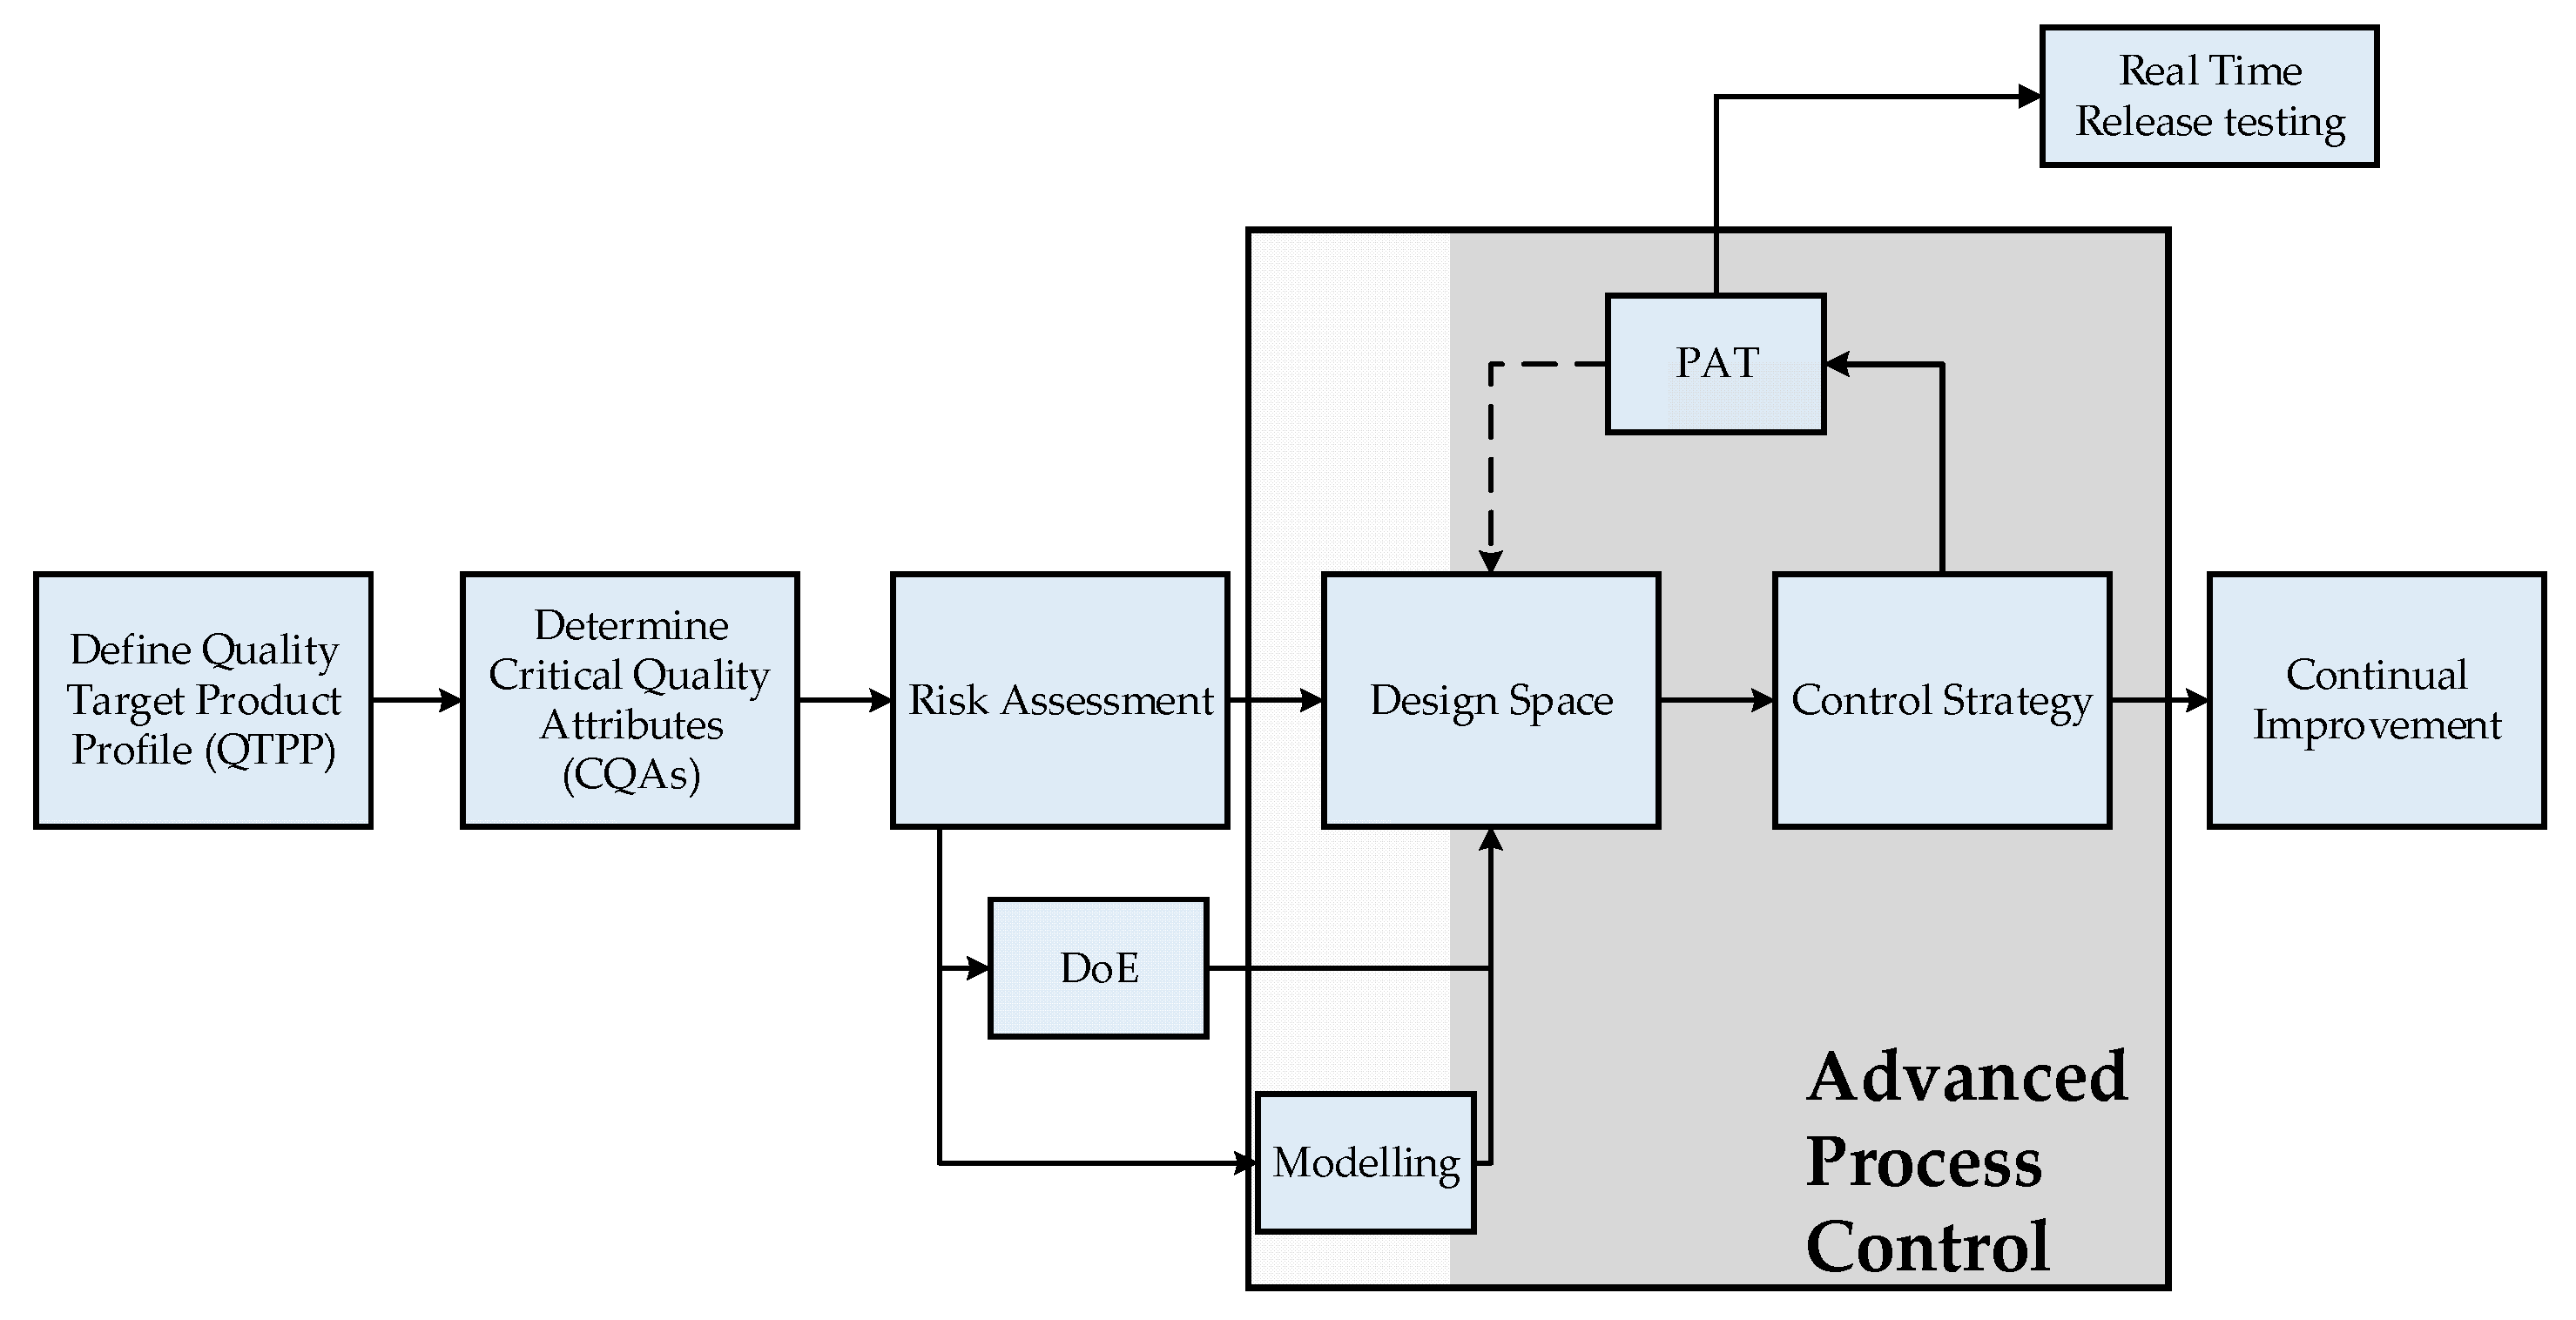
In general, PAT is not limited to in-line analytics, but is a consistent technology approach, which is integrated into the QbD philosophy, demanded by regulatory authorities and is becoming the standard in biopharmaceutical process development. In the QbD approach, a design space of operating parameters is defined, to ensure specified quality attributes (QAs). This leads to multi-parameter optimizations and a significant experimental effort. The modern approach for process development and quality assessment is shown in
Figure 2.
One of the most utilized APC concepts are model predictive controllers (MPC) [
66]. These MPCs manipulate input variables to match the desired set points, while maintaining process critical constraints. This is performed by utilizing optimization routines on process models, which predict the future process behavior for the next time frame [
67,
68]. Common drawbacks of these models are that the model results tend to drift away from the real plant data over time, because of aging, fouling, or blocking phenomena, or summation of prediction errors in cyclic processes [
69]. This is usually fixed by updating the internal model states, e.g., concentrations, with real plant data [
70]. This real time plant data have to be determined via potentially time intensive and invasive offline analytics, if no PAT tools are implemented, resulting in a gap between current process data and analytics [
71,
72]. This gap not only risks a mismatch between current process state and model, but also a general mismatch between current process and process analytics that prevents data-driven process decisions, especially in continuous processes.
Starting with this overview, we will demonstrate that PAT is capable of filling the gap. The proposed control strategy is demonstrated exemplarily in simulation studies. Previous studies have focused on the implementation and distinct and quantitative validation of physico-chemical process models to describe the unit operations shown in
Figure 3, and enable advanced process control. The successful operation of the proposed continuous process has been previously shown [
1]. The missing link to achieve APC is a holistic PAT strategy [
5]. The proposed control strategy is demonstrated exemplarily in simulation studies.
The presented study is an introducing overview to a series of publications showing the holistic methodology for the development of a spectroscopy-based PAT for APC. The focus here is therefore on the overall development with the important steps of spectra acquisition, spectra processing, and evaluation of the achievable prediction accuracy, especially in comparison to established offline analytics, and finally the conceptualization as well as the proof-of-concept of a PAT-based APC through simulation studies.
The aim is therefore not to present only the APC as a final result, but to present the necessary steps and decision criteria.
This demonstration of feasibility, which is necessary as a missing link, has been provided for the first time in the completeness of the development, the unit operations, and the possible spectroscopy technology presented here.
2. Materials and Methods
Chinese hamster ovary cells (CHO DG44) producing an industrially relevant monoclonal antibody (mAb) from the IgG1 subclass were cultivated as described elsewhere [
5].
Phase forming components used are harvested cell culture fluid (HCCF), polyethylene glycol with an average molecular weight of 400 Da (Merck KGaA, Darmstadt, Germany) and phosphate. The salt buffer solution consists of 262.09 g disodium phosphate dihydrate (Merck, Darmstadt, Germany), 198.39 g potassium dihydrogen phosphate (Merck, Darmstadt, Germany) and 539.52 g deionized water.
Precipitation procedure was conducted similar to batch operation described by Lohmann et al. [
29]. After dissolution, the pH was adjusted to 3.7 and held for 60 min for virus inactivation [
73]. Precipitation and dissolution were investigated separately with respect to the different spectroscopic analysis methods (Raman, FTIR, DAD, fluorescence) and PAT sensors (pH, turbidity, conductivity). In precipitation and dissolution, the same online detection train is used as described in ATPE with the exception of the fluorescence detector, which is not used in precipitation due to precipitates, which are harming for the flow cells of the fluorescence detector.
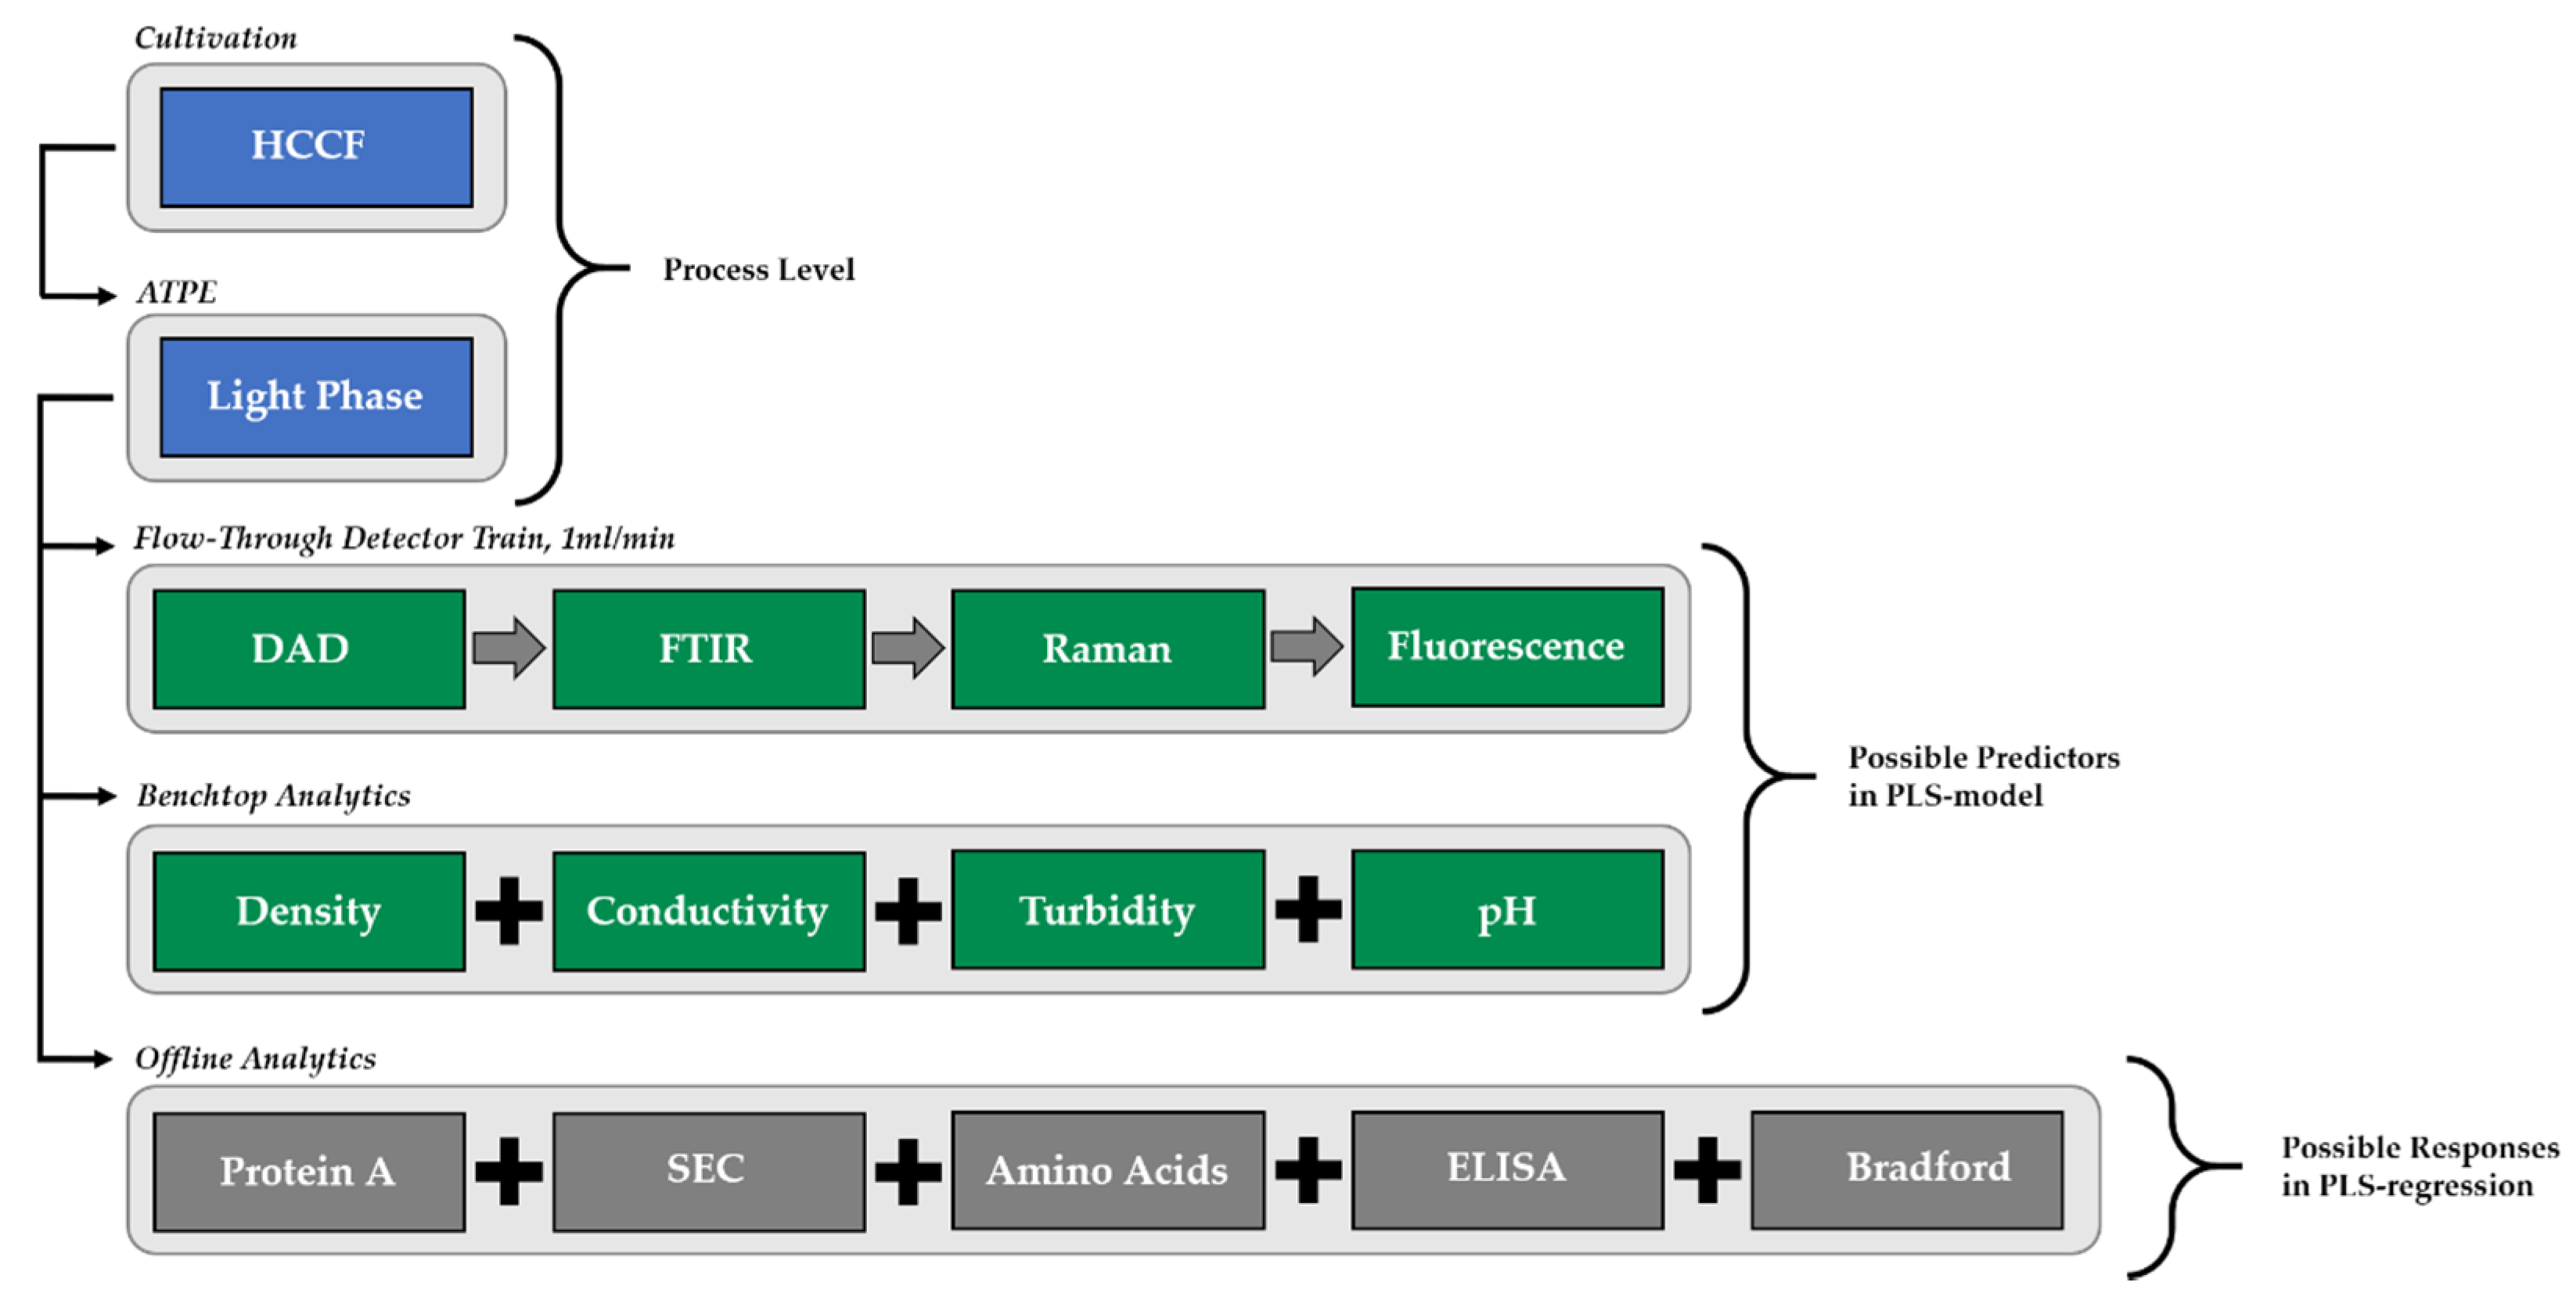
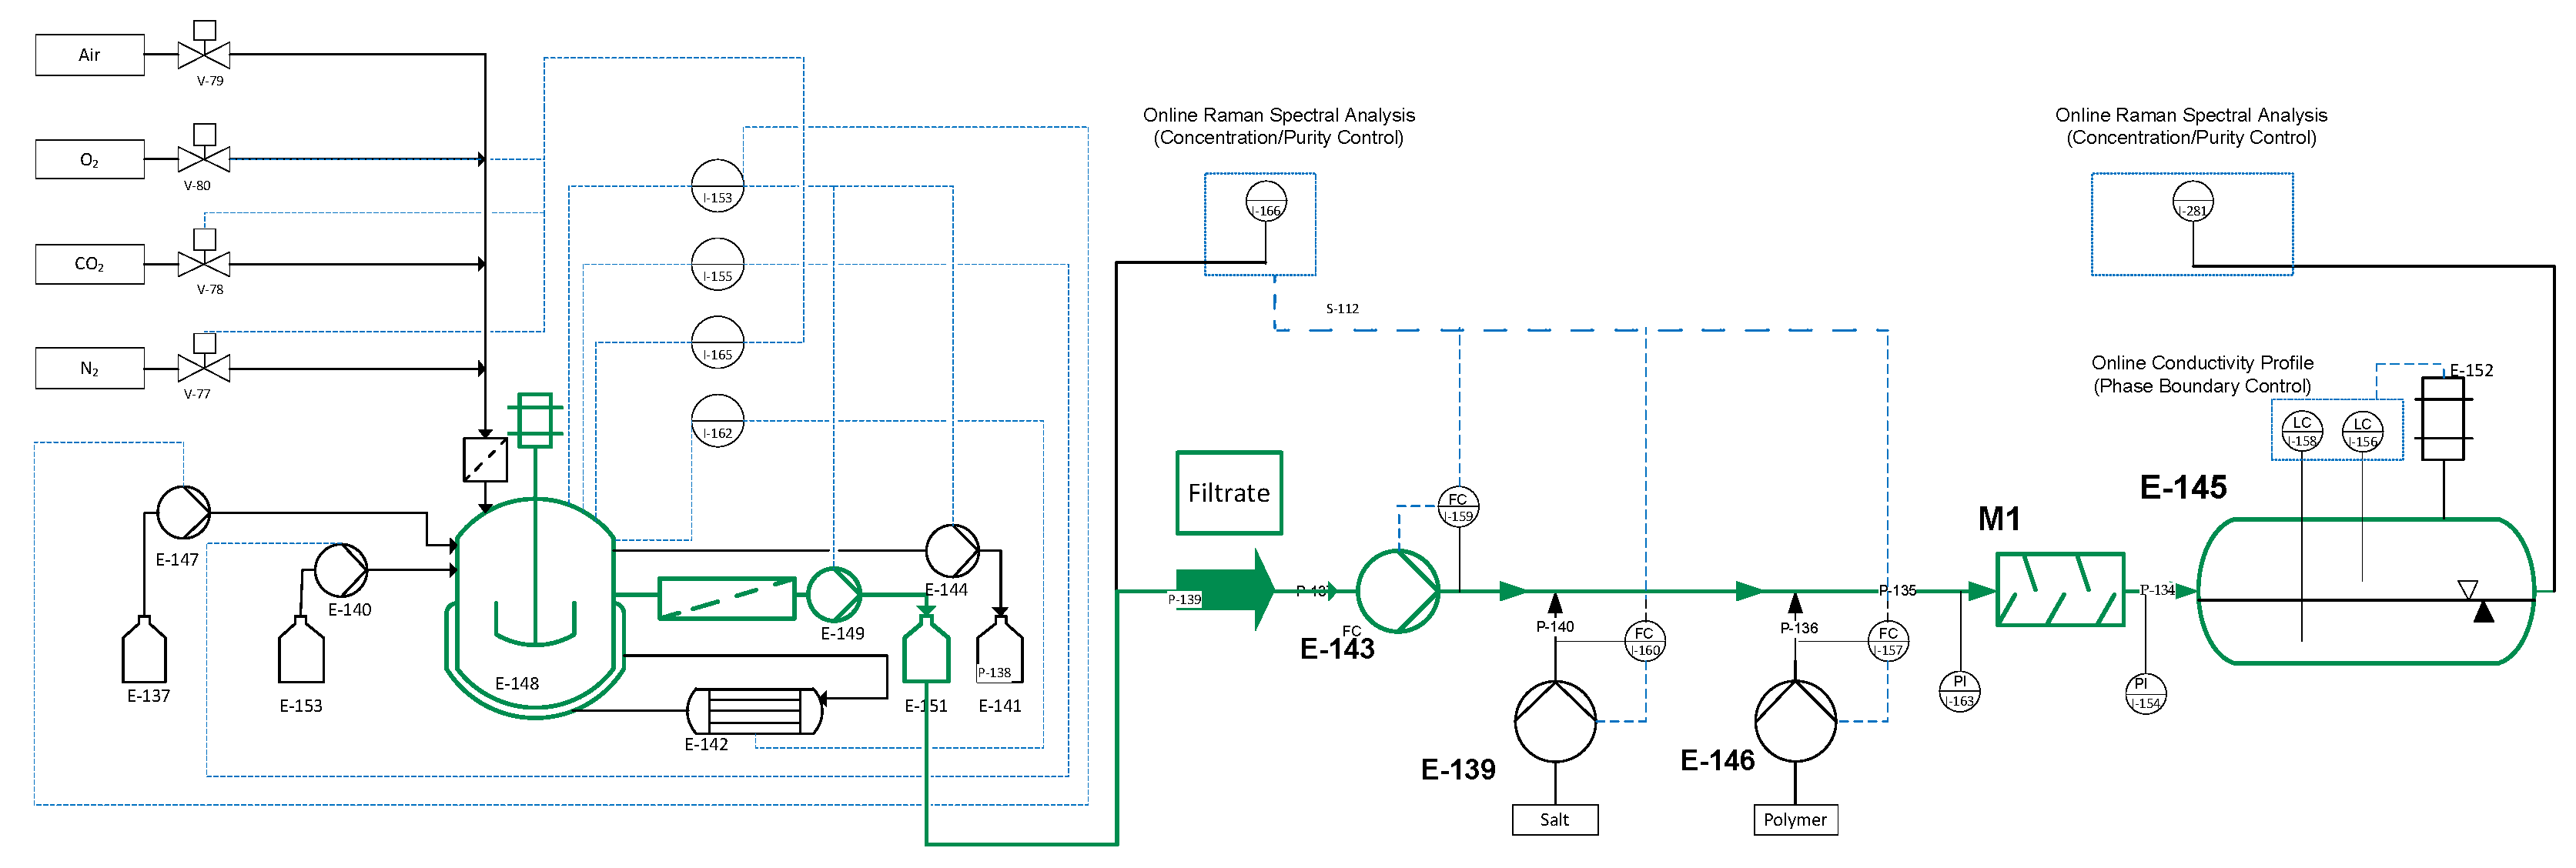
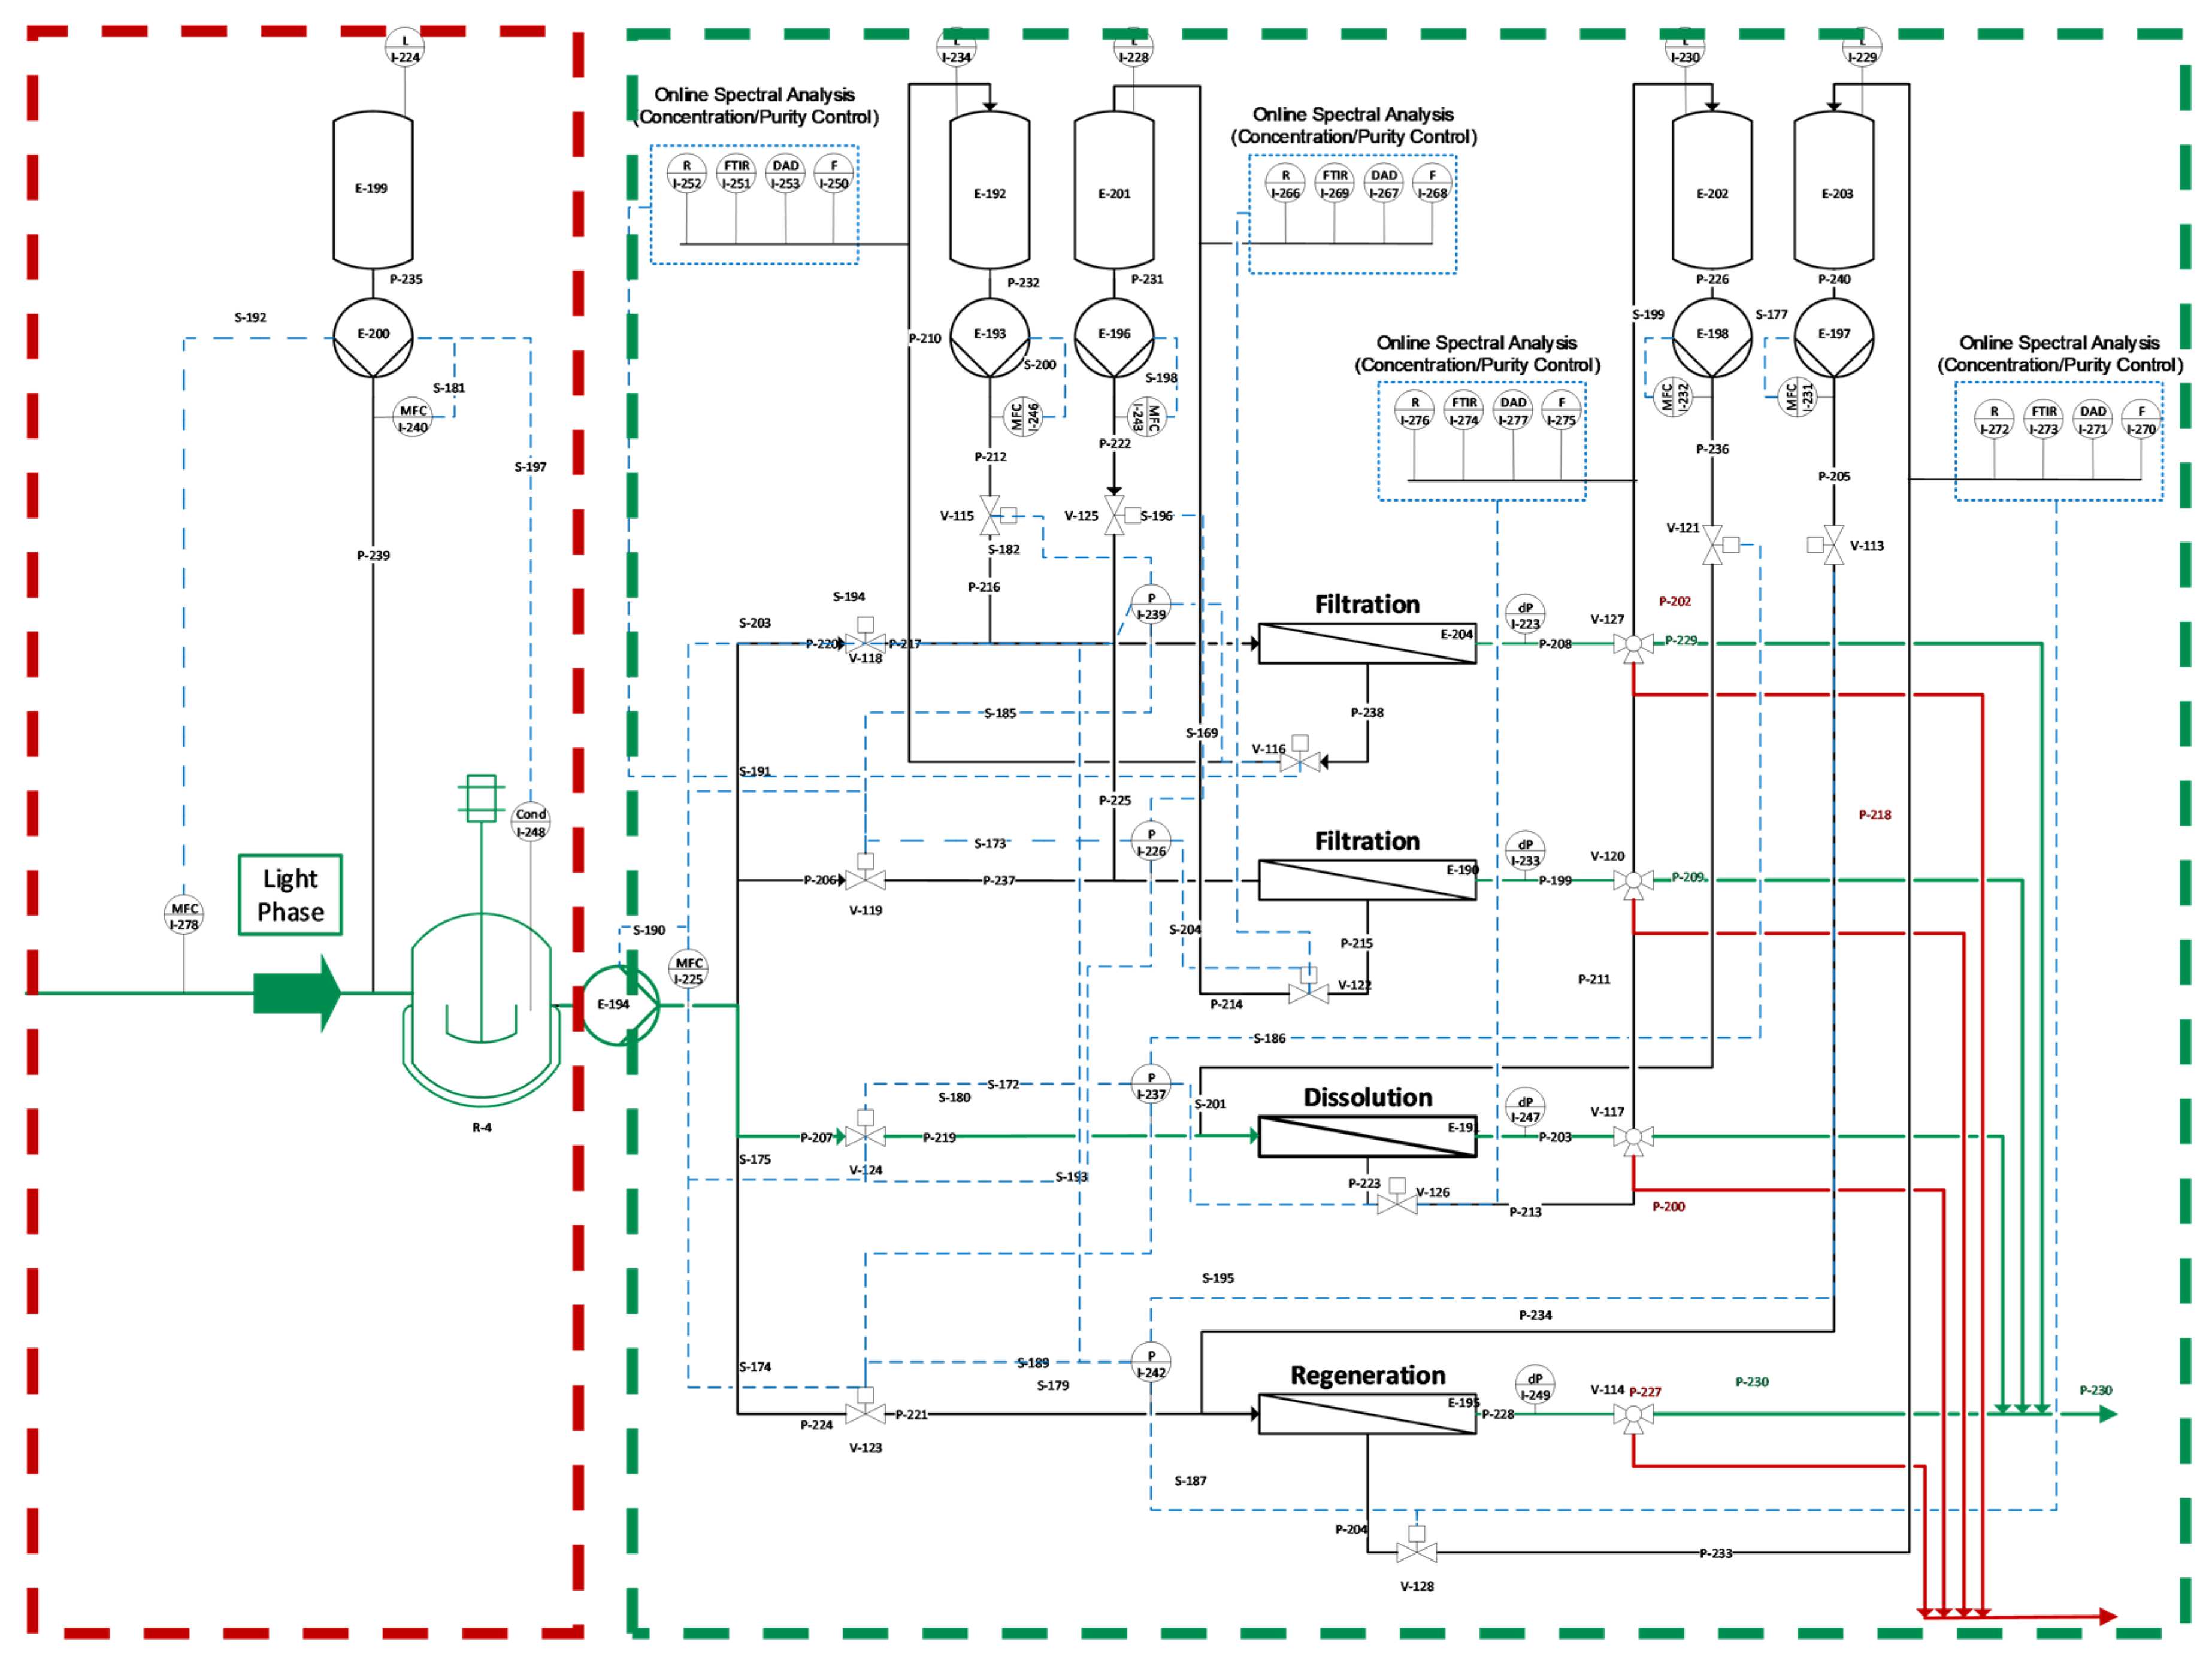
Figure 4 shows the experimental set-up, on the example of ATPE. The analytical procedure (green) and the offline analytics (grey) were the same for all unit operations.
The dissolved antibody obtained after precipitation was used in the chromatography studies. Purification was accomplished using a YMC S75 strong cation-exchange column (YMC-BioPro S75, 26 × 7.0 mm ID, YMC Co., Ltd., Kyoto, Japan). The starting solution was loaded on the column for 5 column volumes (CV). For flow-through-FTIR and Raman, 30 CV were loaded on the column.
Samples for spectral analysis of UF/DF were prepared by mixing appropriate amounts of a 165 g/L polyclonal antibody solution (Gammanorm, Octapharma AG, Lachen, Switzerland) with the expected buffer composition of the respective filtration stage.
Table 2 shows the prepared solutions with the respective mAb, NaH
2PO
4, and NaCl concentrations.
PLSR models were built for three different analytes: target component (TC), concentration of high molecular weight (HMW) impurities, and light weight molecular weight (LMW) impurities.
2.1. Analytics
2.1.1. Online
Data acquisition in Raman spectroscopy (785 nm laser, 1.5 mW, Ocean Insight, Ostfildern, Germany, with an InPhotonics Raman probe) was set to automatically average a total of three spectra, each of which had 1 s of integration time. For each sample, at least three spectra were measured and averaged prior to PLSR. Data acquisition in FTIR spectroscopy (Alpha II, Bruker, Billerica, MA, USA) was set to automatically average a total of 24 spectra, each of which had 1 s of integration time. Data acquisition in UV-Vis spectroscopy, using a DAD (Smartline DAD 2600, Knauer Wissenschaftliche Geräte GmbH, Berlin, Germany), was set to continuously record at a sampling rate of 0.2 s−1, each of which had 32 ms of integration time. Data acquisition in fluorescence spectroscopy (Jasco FP-2020 Fluorescence detector) was set with a gain factor of 1. For each sample, at least three spectra were measured and averaged prior to PLSR. Data acquisition in fluorescence spectroscopy was measured using a gain of 10.
2.1.2. Offline
Samples for off-and at-line analyses were drawn at least once per day. The viable cell concentration was determined using a Cedex XS (Roche Innovatis AG, Bielefeld, Germany), with the trypan blue exclusion method using a diluted trypan blue stock solution (0.4%, Sigma-Aldrich, St. Louis, MO, USA). Cells were separated by centrifugation at 4000 rcf and the cell free supernatant was either used directly for analysis or stored at −20 °C before it was analyzed. Glucose and lactate concentrations were determined by enzymatic-amperometric measurement using a LaboTRACE compact (TRACE Analytics GmbH, Braunschweig, Germany). The monoclonal antibody concentration was quantified by Protein A chromatography (PA ID Sensor Cartridge, Applied Biosystems, Bedford, MA, USA). Dulbecco’s PBS buffer (Sigma-Aldrich, St. Louis, MO, USA) was used as loading buffer at pH 7.4 and as elution buffer at pH 2.6. Size exclusion chromatography (SEC) was done with a YarraTM 3 µm SEC 3000 column (Phenomenex Ltd., Aschaffenburg, Germany) utilizing 0.1 M Na2SO4, 0.1 M Na2HPO4, and 0.1 M NaH2PO4 (Merck KGaA, Darmstadt, Germany) as a buffer system. The absorbance for both methods was monitored at 280 nm. Retention of biological activity is shown via a target specific ELISA (ELISA Assay, Eagle Bioscience, NH, USA). Two-dimensional (2D)-SDS PAGE was conducted for visualization of side components and their elimination progress during downstream processing. For isoelectric focusing, IPG strips (ReadyStripTM IPG Strips, linear, pH 3–10, BIO-RAD, Hercules, CA, USA) was well as a power supply from Hoefer (Hoefer Inc., Holliston, MA, USA) were used. Subsequent, SDS-Page was carried out utilizing gels (Criterion TGX Precast Gel, 4–15% Bis-Tris, Bio-Rad), buffers, and electrophoresis chamber from Bio-Rad. Coomassie Brilliant Blue G-250 (VWR International, Radnor, PA, USA) was used as dye. Fluorescence spectra were measured at-line using a Jasco FP-2020 fluorescence detector. Inline measurement using this detector was not possible, since a spectra measurement takes about 30 s. Gain was set to 1 or 10, depending on the concentration. Using a gain of 10, a concentration of up to 0.3 g/L was practically measurable. Attenuation was set to 256. Fluorescence measurements were done using the 16 µL flow-cell provided with the detector. For each unit operation, emission spectra were measured using an excitation wavelength of 280 nm. Spectra were obtained from 280 to 900 nm. Bradford assays were performed using a Bradford assay kit (Thermo Fisher Scientific, Dreieich, Germany), according to the manufacturer’s instructions. Tests were performed in UV-transparent cuvettes and the absorbance at 280 nm was measured using a UV/Vis SmartSpec Plus Spectrophotometer (Bio-Rad Laboratories GmbH, Feldkirchen, Germany). DNA concentration determination was performed using the Quant-iT™ PicoGreen™ dsDNA Assay Kit according to the manufacturer’s instructions (Thermo Fisher Scientific GmbH). Samples were measured in flow-through using the Jasco FP-2020 Fluorescence detector with a gain factor of 10.
2.2. Analysis of Spectral Data
Spectra were processed and analyzed using Unscrambler
® X (Camo Analytics AS, Oslo, Norway). The raw spectra were analyzed by means of descriptive statistics in order to decide on a suited preprocessing strategy. A main tool was the plot of the spectra against the mean spectrum, also known as scatter effects plot, which shows the nature of distorting effects present in the spectra. Depending on the kind of effect, the preprocessing was causally adapted to extract a maximal information content.
Figure 5 shows exemplary scatter effects plots of (a) additive effects, (b) scatter effects, (c) additive and scatter effects, and (d) complex effects. Additive effects were eliminated by applying a baseline correction and/or a derivation. If not stated otherwise, first derivatives were taken. Multiplicative scatter effects were removed by applying the method of standard normal variate or multiplicative scatter correction (MSC). Combinations of additive and multiplicative effects were removed by a combination of baseline correction and scatter correction. Effects of the complex type were not observed, though they could be removed by using extended multiplicative scatter correction (EMSC). Preprocessed spectra were then used to correlate the changes in component concentration to the changes in spectral intensity at specific spectral regions by PLSR. A detailed description of the fundamentals of PLSR been published by Esbensen et al. [
74]. A maximum of four principal components was allowed in the regression in order to not overfit the data. The quality of the model was evaluated by means of spectral line loadings plot, score plot, and the plot of explained variance against number of principal components.
2.3. Process Simulation Studies to Propse an Advanced Process Control Strategy
Since undesired changes of flow rates, titer or deviations of critical quality attribute occur during downstream processing and since the PAT initiative has created a possible tool to detect these changes in real time, the main question is how any unit operation within the whole process can react to these deviations—and how to control them best. Based on the available digital twins for the whole process, this study deals with finding out which fluctuations can be compensated best at which point in the process. Further, it is discussed whether units are able to provide constant output parameters in mAb concentration (target component, TC), purity and flow rate for the following unit. Therefore, three theoretical scenarios with varying input variables were examined: concentration deviations, volume flow fluctuations and purity changes. Mean parameters are mAb titer at 2 g/L and a perfusion flow rate of 1 mL/min. Purity differs in each unit operation and is adjusted separately. The simulation was conducted with process models for each unit (USP, ATPE, Precipitation, Chromatography) [
1,
3,
25,
26,
27,
28,
29] executed in Aspen Custom Modeler™ (ACM).
3. Results
3.1. Raman Spectroscopy
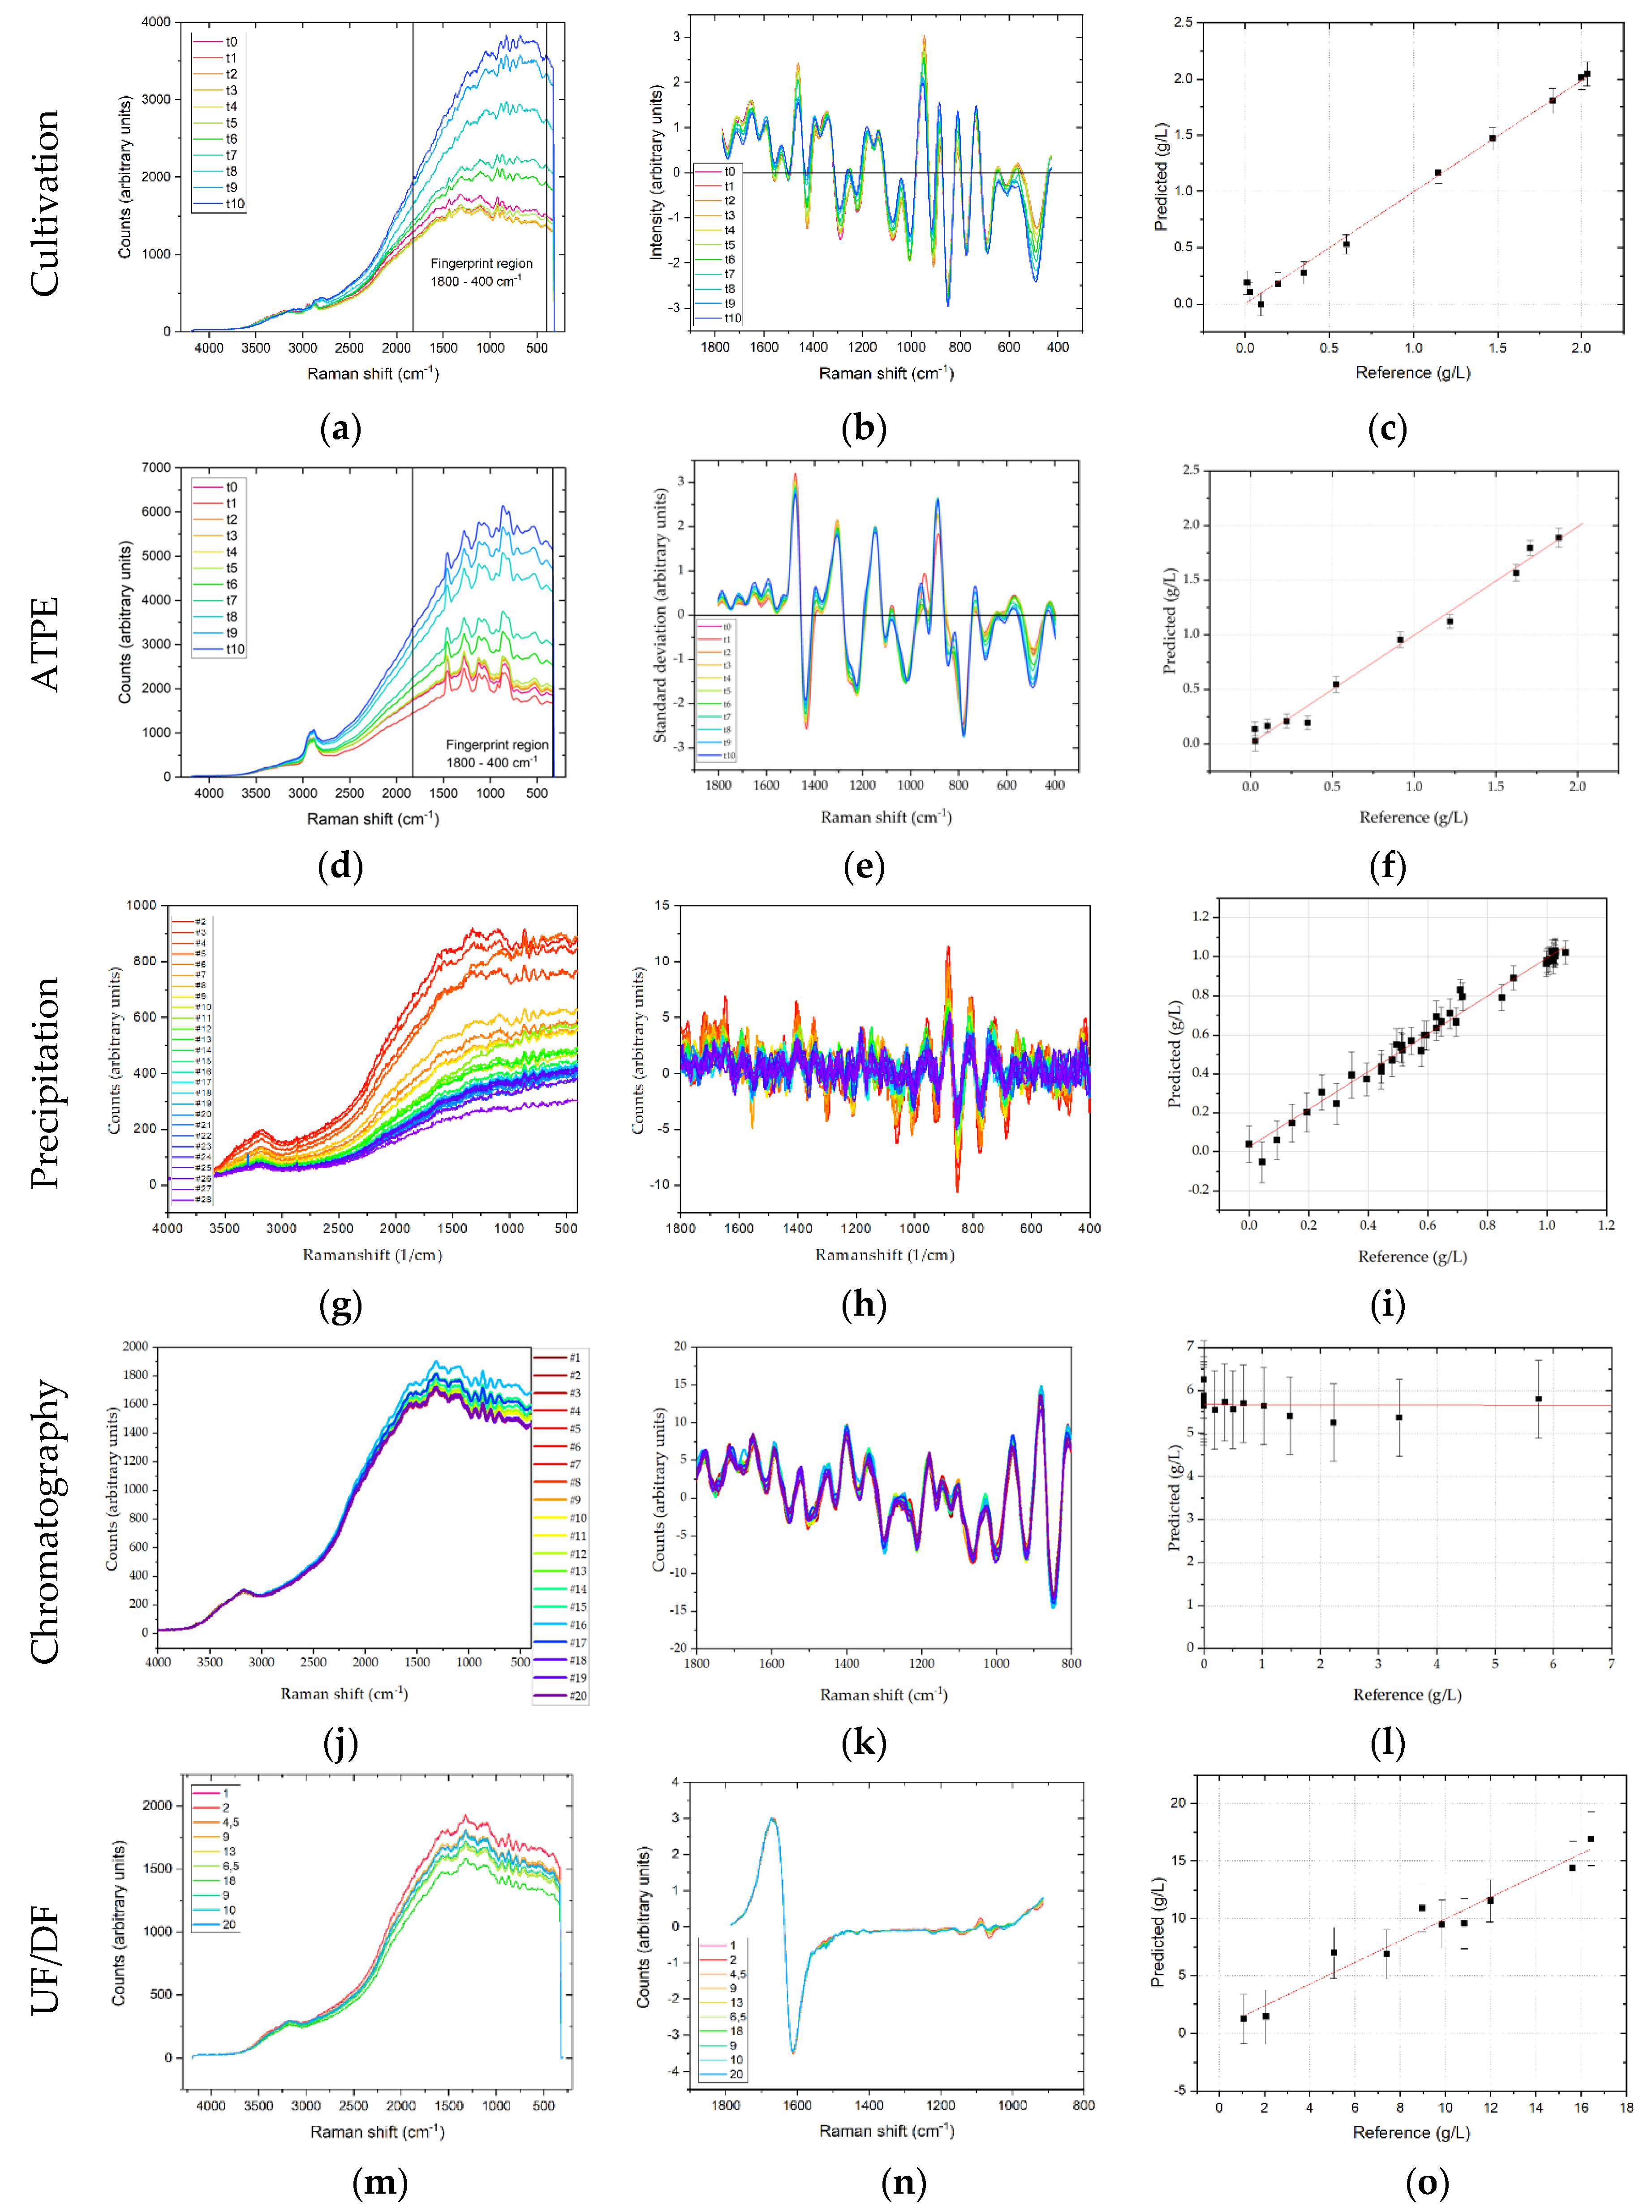
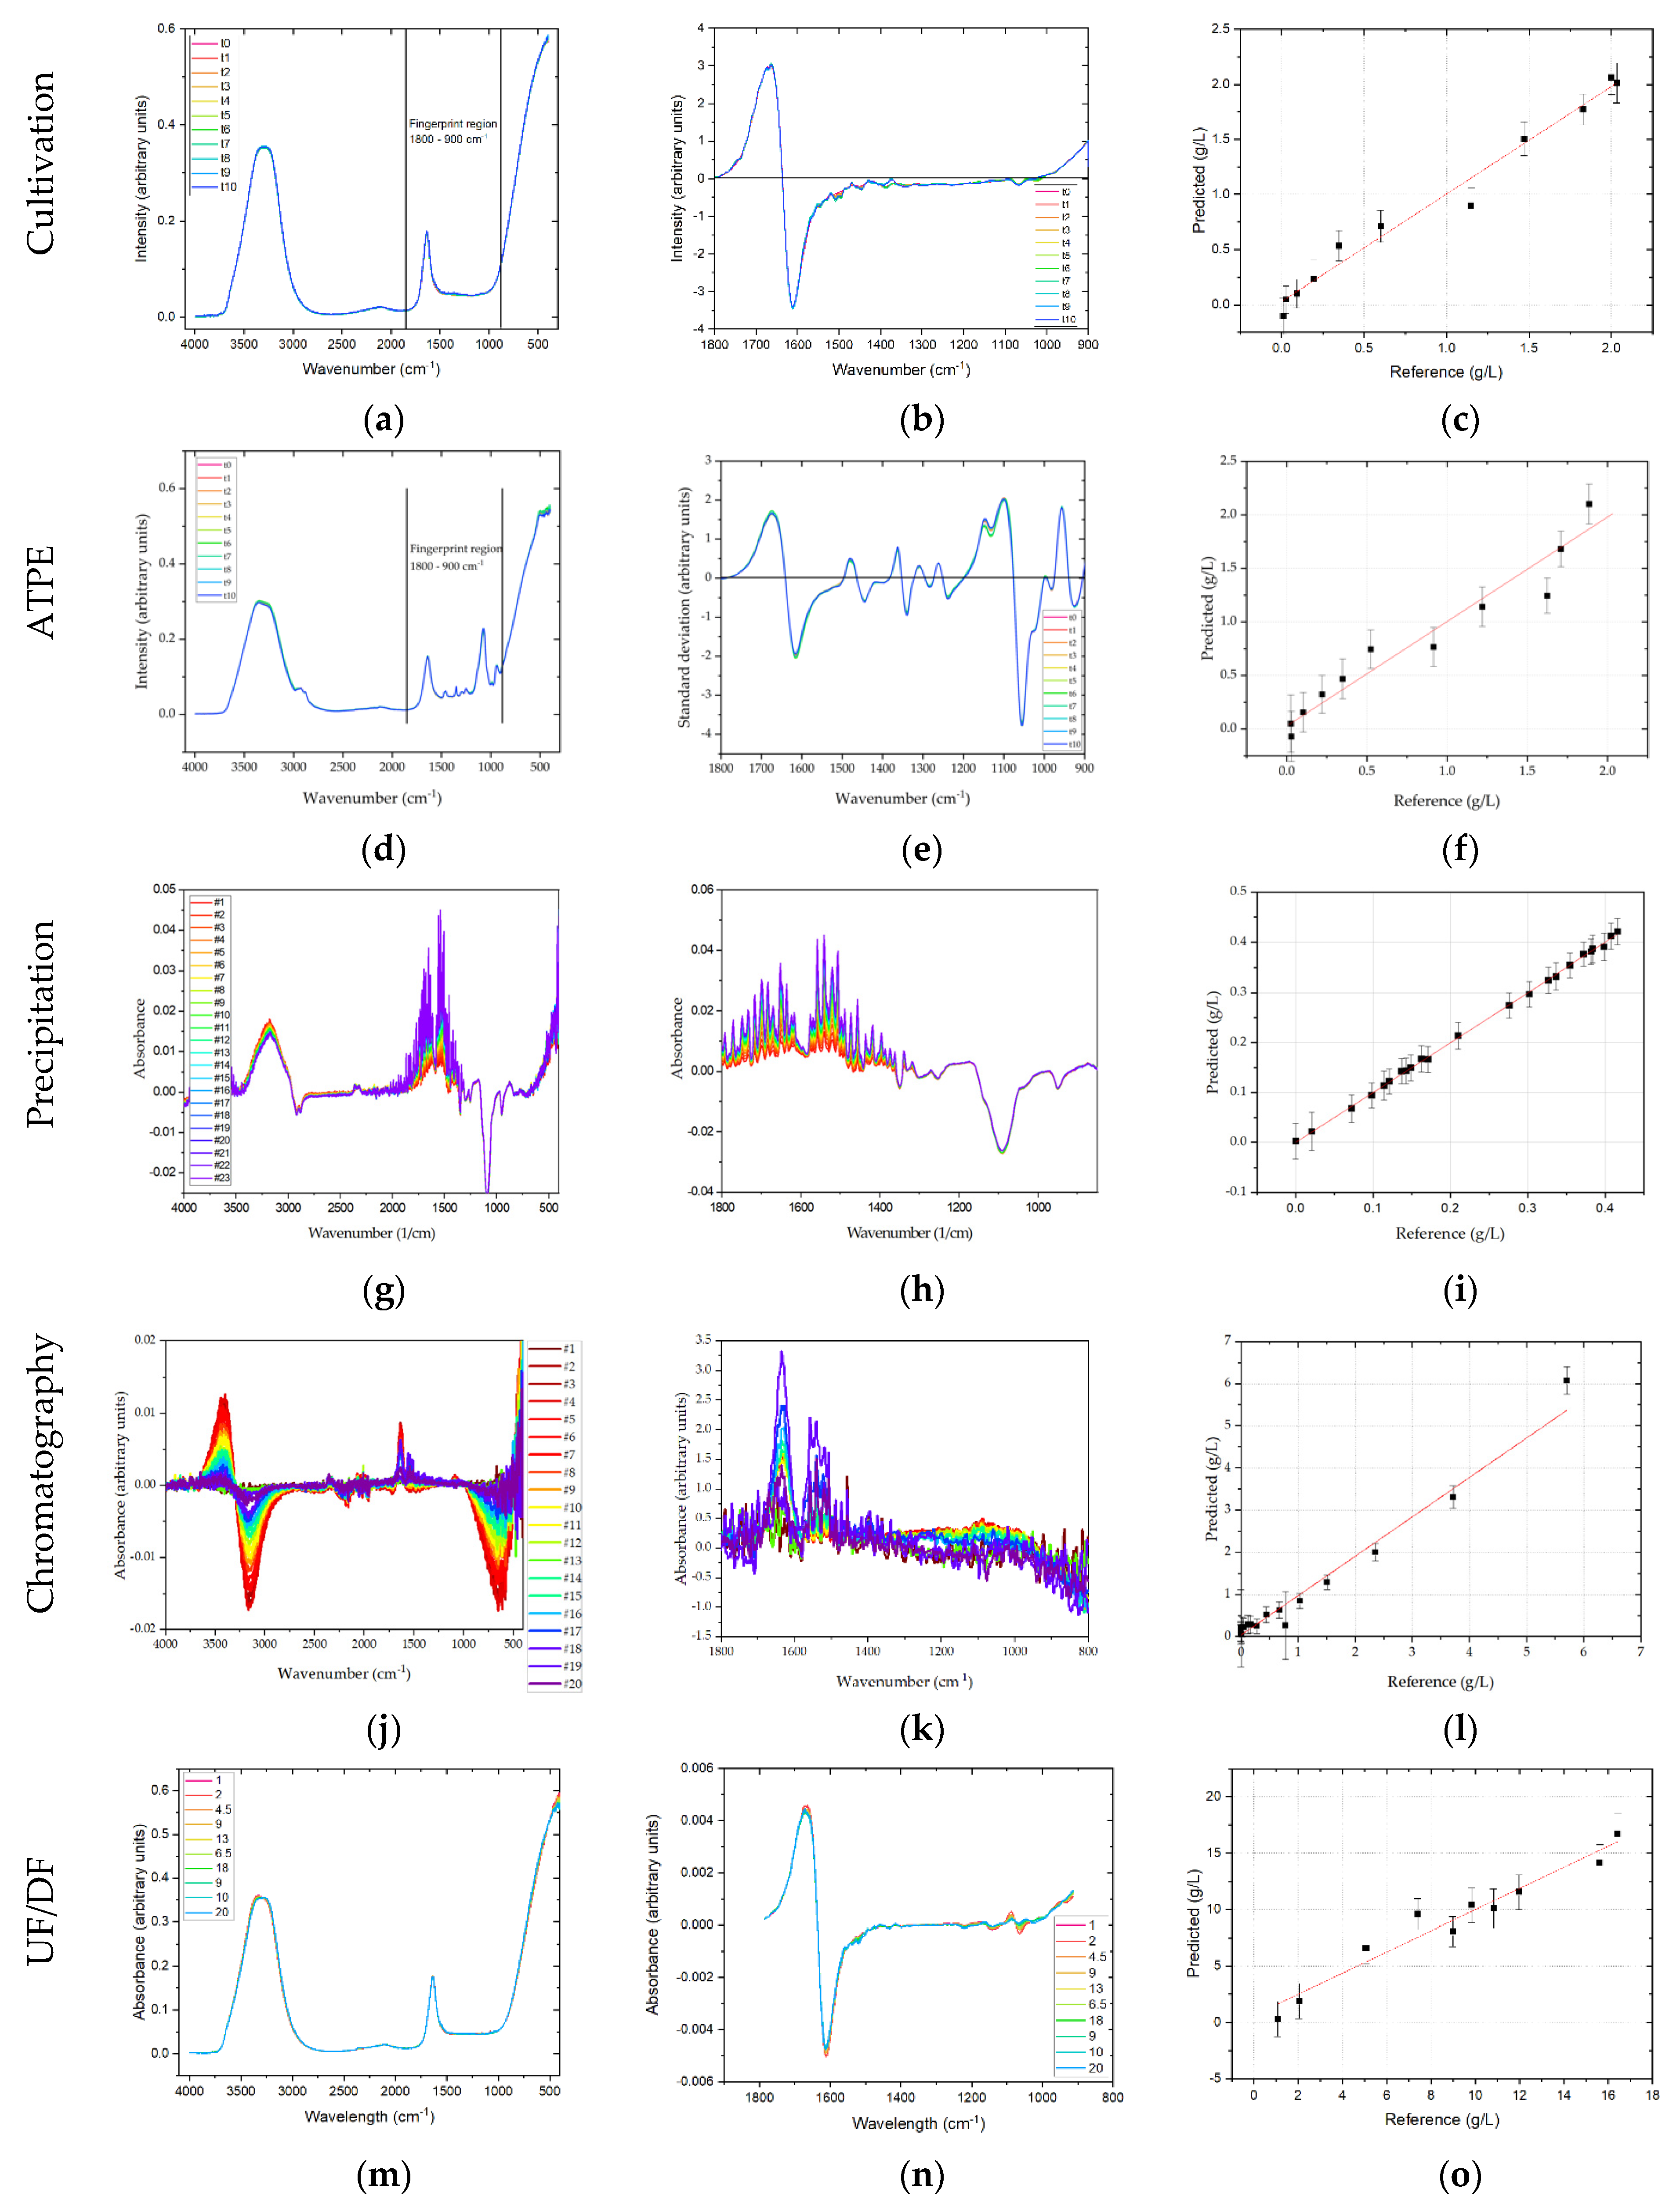
All spectra were preprocessed before a PLSR was performed. Raman- and FTIR spectra were trimmed to the relevant (fingerprint) region for mAbs and relevant side components, which was 1800–400 cm
−1, and 1800–900 cm
−1, respectively. DAD and fluorescence spectra were used in their full width, i.e., from 190–520 and 280–900 nm, respectively. Spectra were analyzed by means of descriptive statistics as described above. In USP, the scatter effects plots revealed primarily additive effects, independent of the detector. According to the proposed workflow, additive effects were removed by calculating first order derivatives using the Savitzky-Golay derivative method with a polynomial order of two and seven smoothing points per side (i.e., 15 points total). Total Raman-spectral intensity, which is primarily caused by fluorescence, decreases during the first three days, after which it constantly increases. This can be attributed to a decreasing concentration of substrates during the batch phase, while the overall protein concentration only slowly starts to increase. After 72 h the daily feed is started, and the protein concentration starts to rise proportionally (i.e., exponentially) to the total cell concentration, thereby increasing the overall fluorescence (cf.
Figure 6). Preprocessed spectra show increases in the amide I, II and III band intensities that are in line with the protein concentration increase. Moreover, pronounced intensities at ~500, 850 and 950 cm
−1 were observed, which correspond to C-C-O bending (540 cm
−1), C-COO stretching (855 cm
−1) and CH
3 rocking (930 cm
−1), respectively [
12].
PLSR was used to correlate changes in Raman spectral intensity with regards to the target component mAb concentration and typically defined HMW (high molecular weight host cell protein fraction) and LMW ((low molecular weight host cell protein fraction) pseudo-concentrations as these are the relevant quantities in the following DSP. Hence, these concentrations should be constantly measured and forwarded to the following unit operation in a continuous process that is controlled by APC. The regression of the predicted vs. the actual concentration yields a good correlation of R2 = 0.999, 0.994, and 0.998 for mAb, HMW and LMW concentrations, respectively, using one principal component. The highest deviations occur at low concentrations, e.g., for mAb at concentrations smaller than 0.3 g/L, while higher concentrations can be predicted more accurately. RMSE values were 0.028, 0.029 and 0.139 g/L, for mAb, HMW and LMW concentrations, respectively. This corresponds to a deviation of 1.4%, 2.7%, and 0.6% in regard to the final for mAb, HMW and LMW concentrations, respectively.
Raw Raman spectra in ATPE show strong additive effects, which increase with cultivation time. Especially in the fingerprint region between 1800–400 cm−1, there is a strong baseline increase. This can be mainly attributed to the concentration increase of proteins. As can be seen after transformation by deviation and normalization, larger differences in the spectra can be identified at amide I (1650 cm−1), amide II (1550 cm−1) and amide III (1300 cm−1) bands. Overall, PLSR shows that in a range of 0–2 g/L mAb a titer prediction accuracy of R2 = 0.97 is achieved, when compared to offline protein A determination. The RMSE of prediction was 0.075 g/L, which is 4% of the final mAb concentration. The error is similar to offline Protein A chromatography. HMW prediction results in a smaller regression coefficient of R2 = 0.87, when compared to SEC based offline determination, with a RMSE of 0.013 g/L, or 8% of the final HMW pseudo-concentration. As ATPE produces light phase that throughout the process is characterized by high HMW purity (92%), the HMW concentration is also small compared to the mAb. It is therefore to be expected that the combination of low concentration and intrinsic fluorescence makes the identification of HMW related changes in the Raman spectra more difficult. LMW prediction on the other hand results in a regression coefficient of R2 = 0.96 (also regressed against SEC determination), with a RMSE of 0.131 g/L or 1% of the final LMW pseudo-concentration. After ATPE the LMW purity in the light phase throughout the process is small (11.6%), so the LMW concentration is high and although LMW consist of wide range of different species, such as proteins, peptides, vitamins etc., their summarized contribution to the overall Raman spectra is different enough to the mAb contribution to enable a PLSR.
In precipitation, the Raman intensity decreases for a higher PEG content. With increasing PEG content more side components co-precipitate and increase in this manner particle density. A similar trend can be observed in Raman raw data for dissolution. Raman intensity decreases with increasing concentration of redissolved mAb. Further preprocessing was applied after evaluation of scatter effects. Spectra were trimmed to 1800–400 cm−1 and the first derivative was taken using the Savitzky-Golay method with three smoothing points per side.
In the case of Raman, preprocessing was equal for precipitation and dissolution. The LMW pseudo-concentration could be well correlated to changes in spectra with an R2 of 0.97 and RMSE of 0.03 g/L. In dissolution, the concentration of mAb could be predicted with an R2 of 0.93 and a RMSE of 0.08 g/L. These deviations are equivalent to 0.3% for LMWs in precipitation and 3.9% for the final mAb concentration in dissolution. It can be concluded that Raman is a suitable detector for precipitation and dissolution.
In chromatography the first derivative of spectral data are calculated. PLSR validation for Raman spectroscopy in chromatography was not possible, as shown in
Figure 7. The reason for this is that the large flow-cell in combination with the low flow rate results in a long retention time of the product causing back-mixing. This is illustrated in
Figure 8. Here, the results of a tracer experiment with (red) and without (black) are depicted. The widened peak after the flow cell is a product of back-mixing occurring in the flow cell. The RMSE value for Raman is 4.7, corresponding to ~80% of the highest value in the Raman samples.
In UF/DF additive effects were observed in raw Raman-spectra. Accordingly, first derivatives were calculated from the raw spectra and a PLSR was performed, yielding a correlation of R2 = 0.951, with a RMSE of 1.08 g/L. At the final concentration of 20 g/L the deviation is 5.4%, which is similar to offline analytical methods such as protein A chromatography.
3.2. Fourier-Transform Infrared Spectroscopy
FTIR and Raman spectroscopy are often referred to as being complementary techniques. While Raman detects the molecules fingerprint signature of inelastic bonds by scattering photons when excited by a laser, FTIR detects the molecules fingerprint signature of bonds that absorb infrared radiation. Both detection principles however cause the bonds within the molecule to convert some of that energy into vibration, and are therefore summarized as vibrational spectroscopy methods. FTIR spectra were measured against air as background. Hence, all spectra have a common offset from water. Compared to Raman spectroscopy, the absorption of water in IR-measurements is strong, and thus overlays the relevant signals from the target components (i.e., mAb and side components). FTIR spectra were trimmed to the relevant (fingerprint) region for mAbs and relevant side components, which was 1800–900 cm−1. In order to remove the offset and make relevant information accessible, the first derivative is calculated. Thereby, the background water signal is removed and two strong peaks can be identified at around 1650 cm−1 corresponding to the amide I band. In contrast to Raman spectroscopy, amide II and amide III bands are less pronounced. PLSR of the mAb, HMW, and LMW concentrations was performed, but yielded generally lower regression coefficients than those in Raman spectroscopy which can partly be attributed to less pronounced amide II and III signals. Moreover, compared to Raman spectroscopy, the overall number and intensity of signals that can clearly distinguished is markedly lower which hampers the prediction. The coefficients of determination for mAb, HMW and LMW are 0.983, 0.986 and 0.989, with RMSEs of 0.102, 0.045, and 0.353 g/L, respectively. These deviations are equivalent to 5.1%, 4.2%, and 1.6% of the final mAb, HMW, and LMW concentrations, respectively.
In ATPE, raw FTIR data of light phase after ATPE reveal less obvious deviations when compared to Raman raw data. It is, however, important to note that the differences that are clearly visible in raw Raman data are only caused by the strong baseline increase due to underlying fluorescence. Indeed, the deviations in-between the FTIR spectra are less pronounced compared to Raman spectra. PLSR coefficients for mAb, HMW, and LMW are generally lower compared to the other methods. A possible explanation for this is that while amide I band can be identified in the FTIR spectra, amide II, and amide III bands are far less pronounced. Hence, the spectral information provides less distinguishable contributions by mAb, and all other species in the multicomponent mixture. Since PLSR-model building relies on these different contributions to the fingerprint of the multicomponent matrix, regression becomes less efficient. The regression coefficients in ATPE were 0.94, 0.94, 0.98, with RMSEs of 0.167, 0.013, and 0.5 g/L, which is 9, 8, and 3.5% of the final mAb, HMW, and LMW concentrations, respectively.
After precipitation, larger deviations occur between wavenumbers 1800 and 1400 cm−1 for dissolution. No further preprocessing is necessary in case of FTIR data in dissolution. PLSR of FTIR-spectra of precipitation resulted in an R2 of 0.94 and RMSE of 0.43 g/L, referring to LMWs. In dissolution, the mAb concentration could be predicted with an R2 of 0.91 and a RMSE of 0.03 g/L. These deviations are equivalent to 4.2% for LMWs in precipitation and 2.8% for the final mAb concentration in dissolution.
For chromatography, spectra were shortened to the fingerprint region. The PLSR modeling for IgG resulted in an R
2 of 0.92 including validation samples. RMSE of the target component was 0.24 g/L or 4% of the highest sample measured.
Figure 9l shows the regression results. In comparison to DAD and fluorescence the salt gradient shows a high influence on FTIR spectra, even in the shortened product-specific region. This is especially apparent between the wavenumbers 1700–1600 cm
−1 and 1000–800 cm
−1. The drift between 1000–800 cm
−1 results mainly from the higher salt concentration, as there is a shift from higher product concentrations (blue) to lower product concentrations (red), see
Figure 9k. Between 1700–1600 cm
−1 the increase is mainly due to higher IgG concentration, as the high salt concentrations do not contribute to a rise in intensity. Best fit was achieved using three principal components in the PLSR model.
In UF/DF first derivatives of the raw FTIR spectra were calculated, as additive effects were the dominant type of effect. PLSR of the processed spectra yielded a regression coefficient of 0.95 with an RMSE of 1.09 g/L, which is equivalent to 5.5% of the final mAb concentration.
3.3. Diode-Array Detector
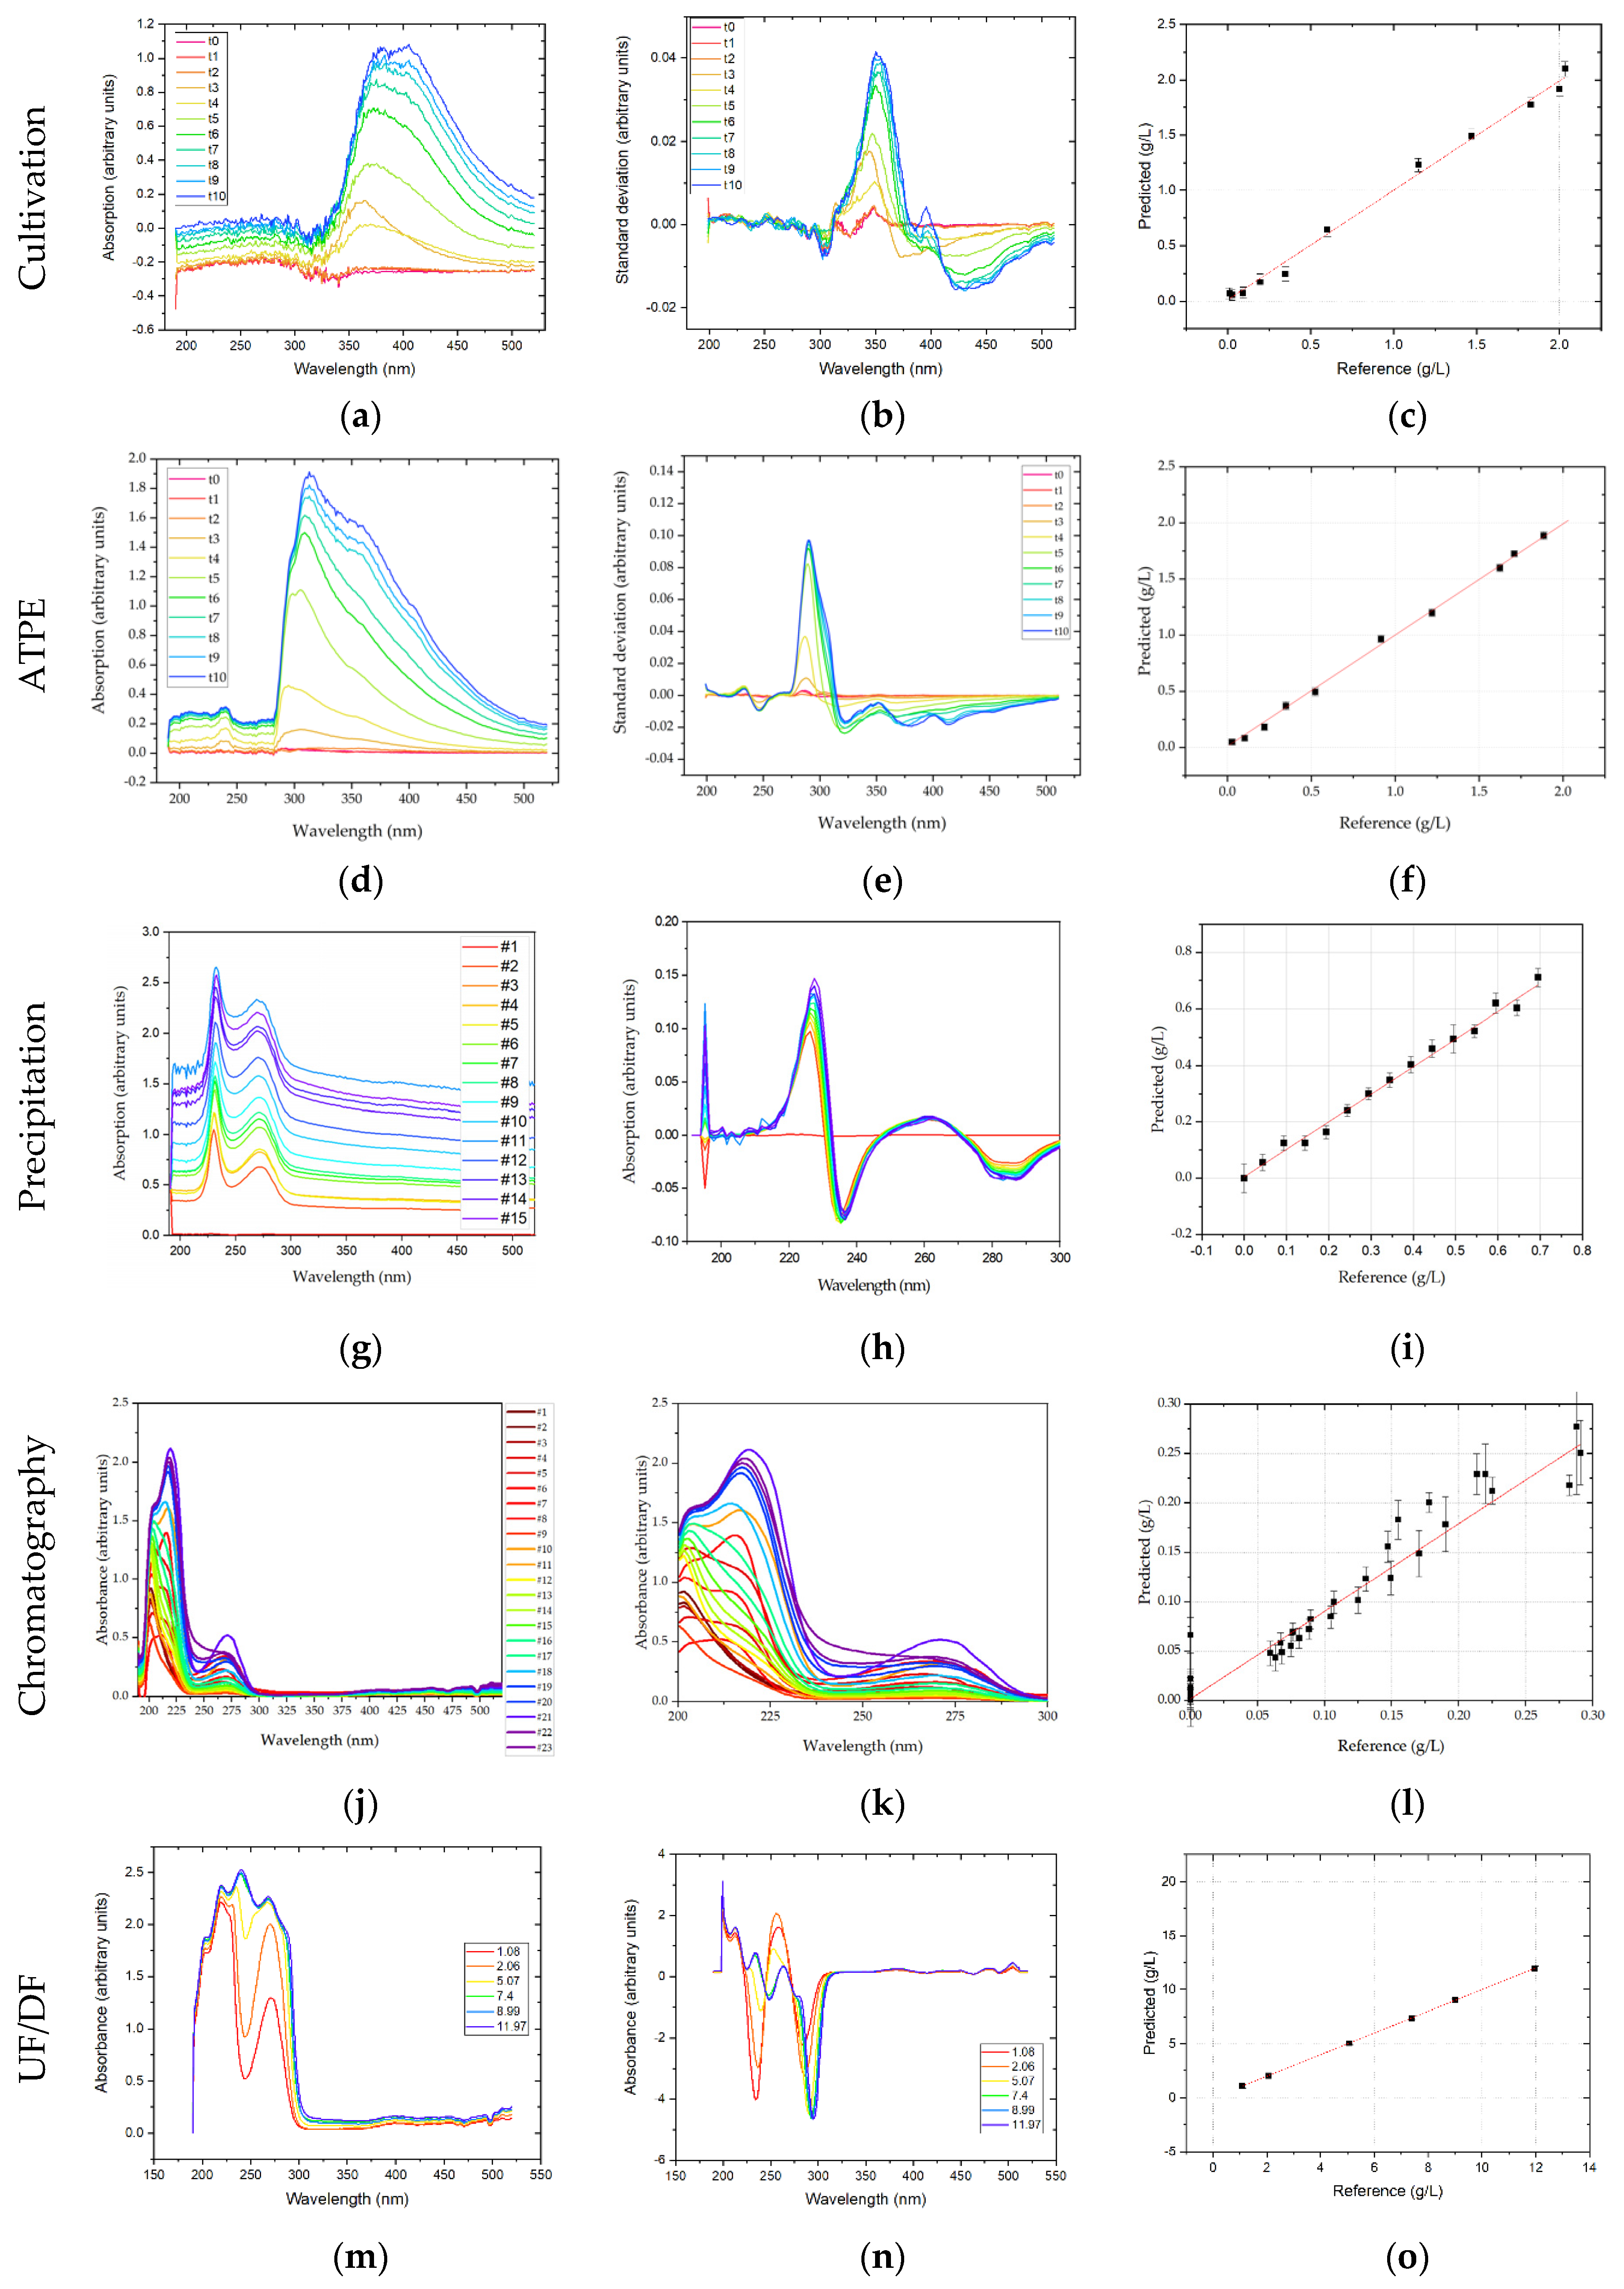
UV-Vis analytics rely on the principle of Lambert–Beer, as the spectrum measured by a DAD shows the absorption of monochromatic light by the analyte matrix. So, if there is only a single species present, or several species with non-overlapping absorption spectra, species concentrations can efficiently be correlated to the measured absorption at their specific absorption maximum. However, in multicomponent mixtures, such as the light phase in ATPE after processing HCCF, there is a significant overlap of all the different species-specific absorption characteristics. Applying the same chemometric methods that are common for Raman and FTIR analysis aims to extract the composition-specific UV-Vis spectral information. DAD spectra were measured in the range of 190–520 nm. Since the method is based on absorption of UV-Vis light, increasing overall concentration leads to increasing absorption. These additive effects are removed by taking the first derivative of the spectra as described above. The derived spectra show that the strongest change in absorption is around 350 nm. The regression coefficients of the prediction were 0.994, 0.983, and 0.994, and RMSEs of 0.059 g/L, 0.050 g/L, and 0.263 g/L, or 3%, 4.7%, and 1.2% of the final concentration, for mAb, HMW, and LMW, respectively. It must be noted however that this region is not unambiguously assignable to protein or DNA, as these biomolecules have an absorption maximum at 280 nm and 260 nm, respectively. It cannot be ruled out that the change in absorption may correlate to the color of the medium, which changes due to the addition of the two feed-media, which are red and green respectively. Moreover, polyaromatic substances like vitamins may absorb in this region. Further validation experiments are needed to validate the DAD predictions.
In ATPE, DAD obtained spectra reveal that with progressing cultivation time the biggest changes to the UV-Vis spectrum are around 280 nm wavelength. In the range of 320–520 nm there are additional smaller pronounced deviations to the spectrum. By using these processed spectra as predictors for the PLSR-model, regression coefficients of 0.99 (mAb), 0.80 (HMW), and 0.95 (LMW) are obtained. The less efficient regression for HMW species is similar to the results in FTIR explainable by their small concentration and, therefore, smaller contribution to the extractable information in the UV-Vis spectrum. RMSE values were 0.027 g/L, 0.011 g/L and 0.22 g/L, or 1.4%, 6.7%, and 1.5% of the final mAb, HMW, and LMW concentrations, respectively.
In precipitation, spectral data for the DAD are not shortened and the full spectrum is shown ranging from 190 nm to 520 nm. The DAD is capable of detecting proteins reliably, but the distinction between different proteins is difficult. A similar trend can be observed in DAD raw data for dissolution. This is to be expected as the absorbance of a DAD increases according to the law of Lambert-Beer. DAD-PLSR regression for precipitation is very good (R2 of 0.97 and RMSE of 0.26) referring to LMWs. In dissolution, convincing results are achieved (R2 of 0.93 and RMSE of 0.02), but for the target component. These deviations are equivalent to 2.3% for LMWs in precipitation and 2.8% for the final mAb concentration in dissolution. It can be concluded that DAD is a suitable detector during precipitation for LMWs and in dissolution for the target component.
In chromatography, DAD spectra were shortened to 200–300 nm. As this is the only part of the spectrum were significant absorption can be observed, see
Figure 10j. Any preprocessing significantly worsened PLSR regression, eliminating effects the PLSR model can explain with the given concentrations. For the shortened DAD spectra, an R
2 of 0.94 for the IgG monomer was achieved in chromatography. RMSE for the DAD-PLSR was 0.021 or 7.6% of the highest sample measured. The regression results are illustrated in
Figure 10. In the regression plot (l) a high variance for the zero-points is appeared. This results from the similar spectra (k). Between 200 and 225 nm the side components show a strong absorbance like the IgG monomer, the specificity of DAD-PLSR results from the stronger absorbance around 275 nm. While the PLSR model can eliminate these overlapping effects to some degree, it is not possible to eliminate this overlapping completely. The best fit was achieved using six factors in the PLSR model.
In UF/DF for the DAD, primarily additive effects were observed in the raw spectra. Thus, first derivatives of the raw spectra were calculated and PLSR was performed. An excellent regression coefficient of >0.999 with a RMSE of 0.005 g/L was found for the prediction of the mAb concentration, which is 0.03% of the final mAb concentration.
3.4. Fluorescence Emission Spectra
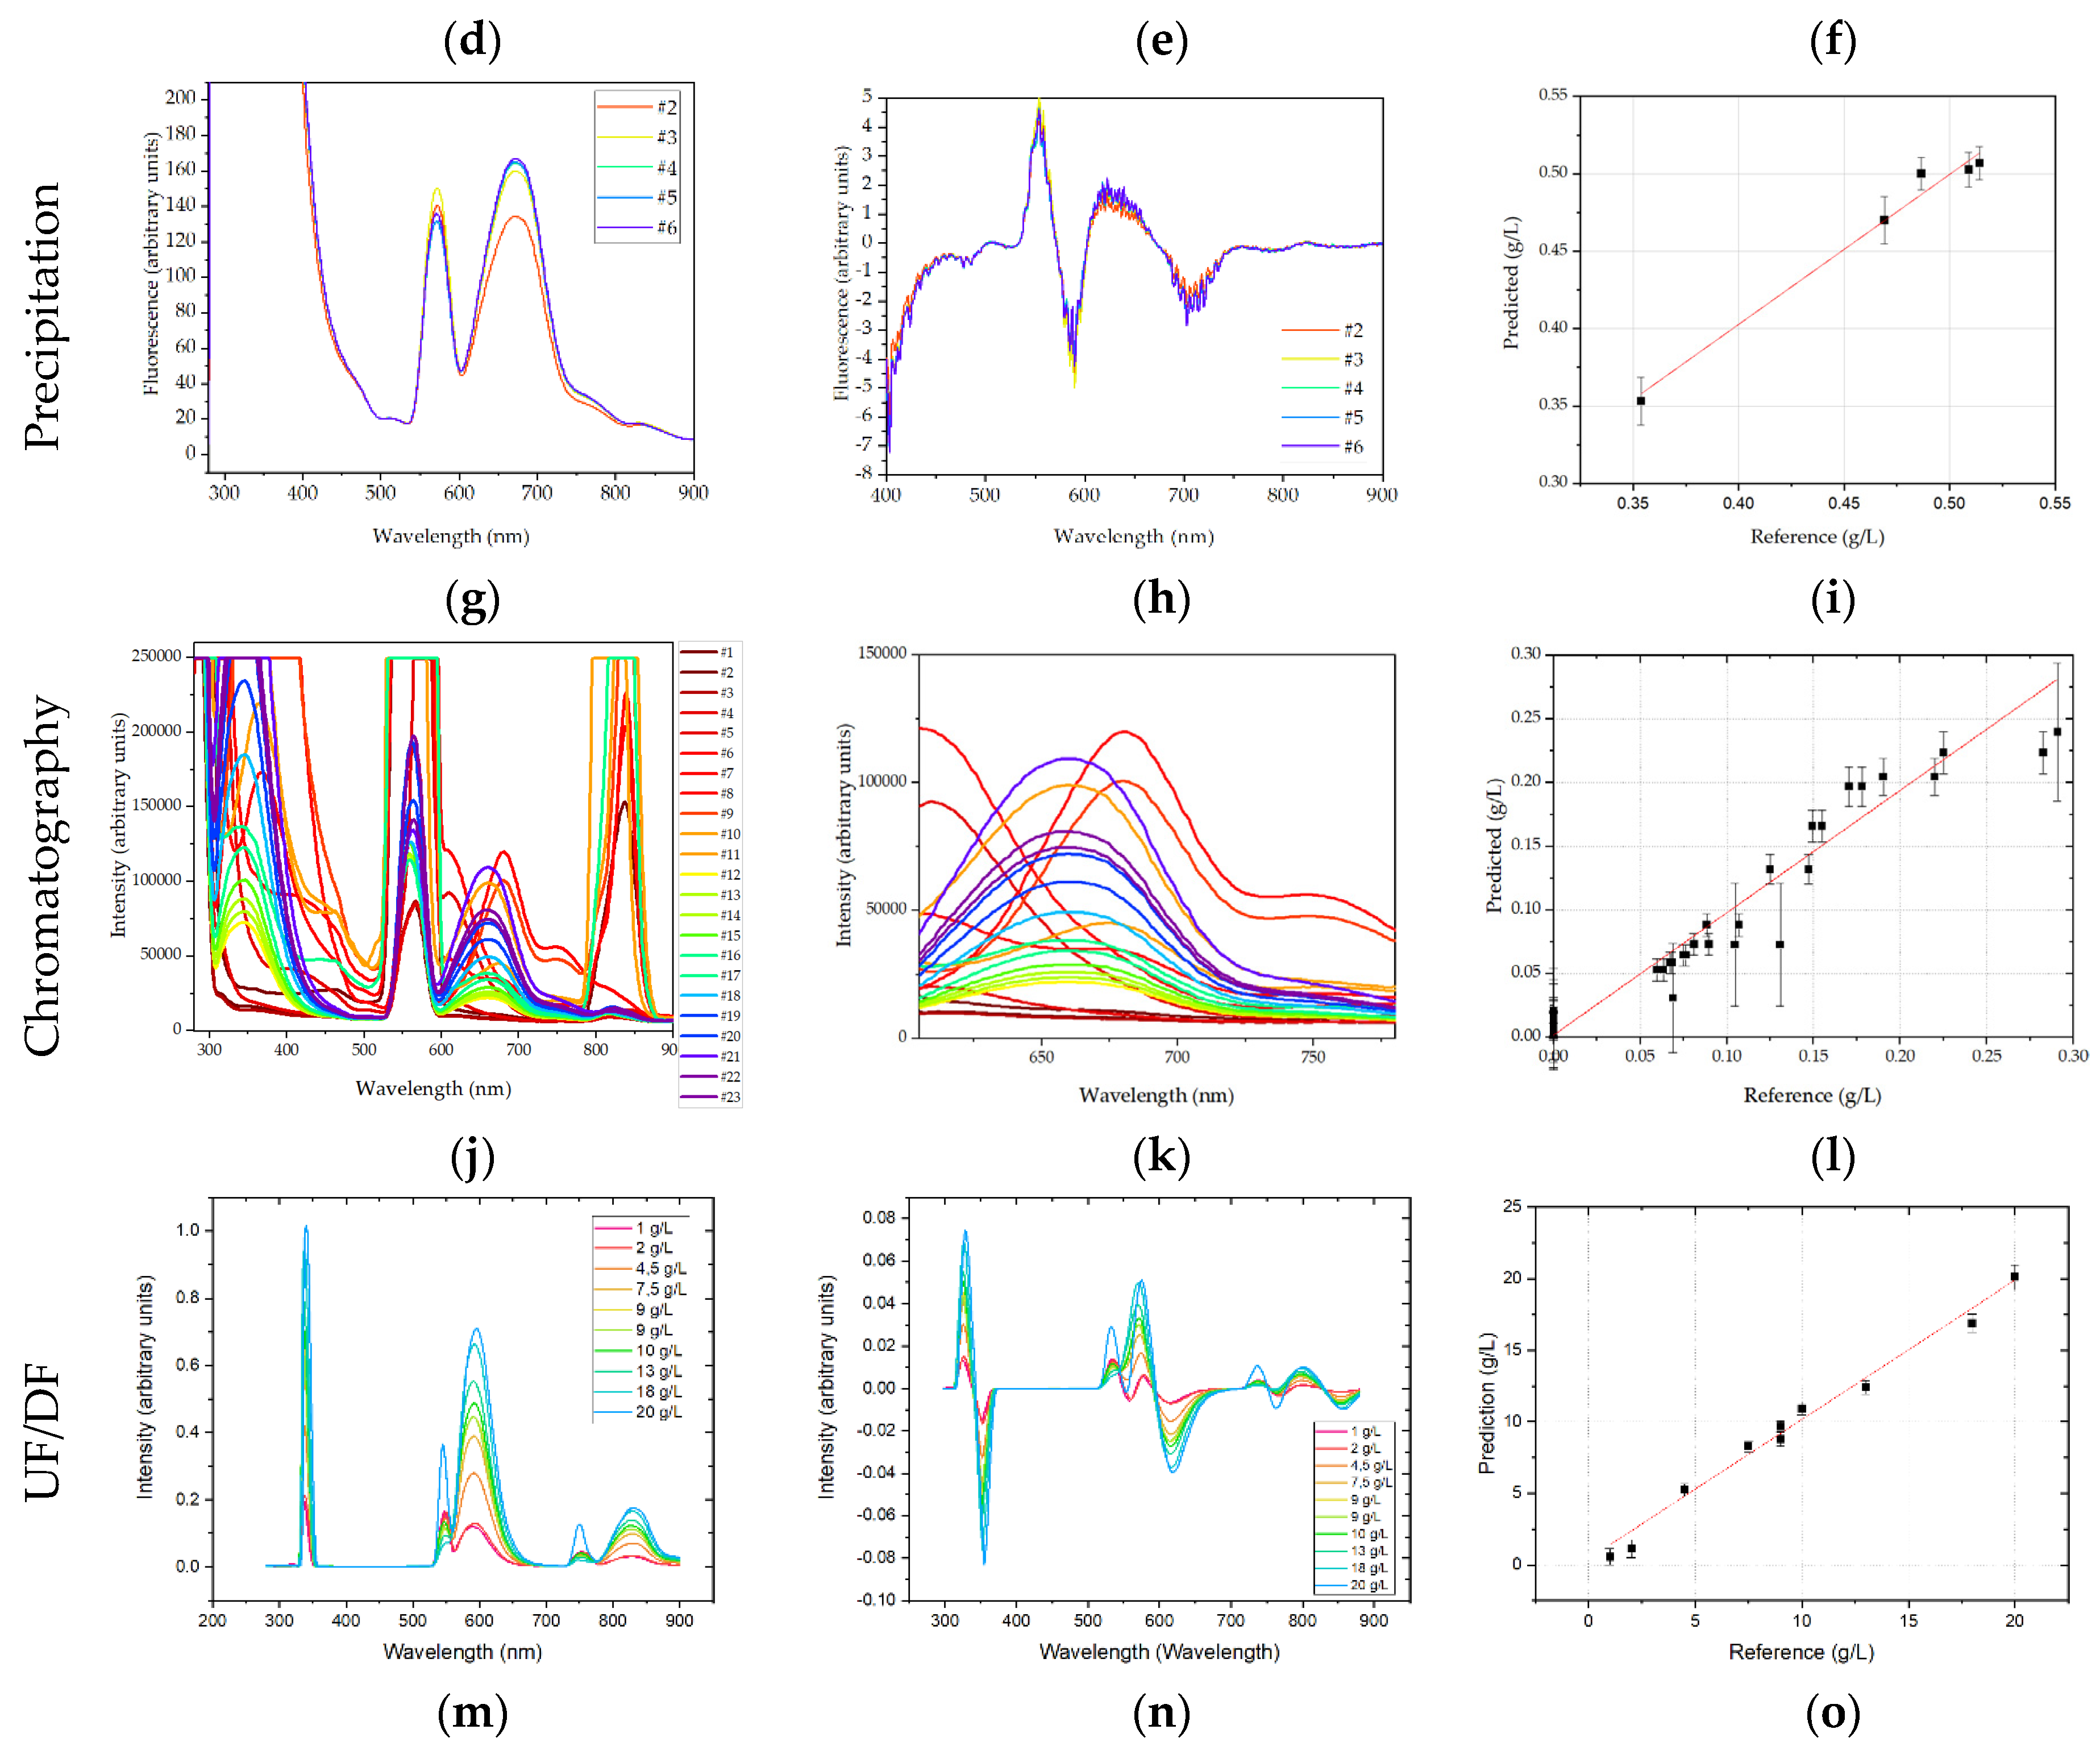
Like UV-Vis measurements, fluorescence spectra are based on the absorption of photons. Therefore, also in fluorescence measurements strong additive effects were observed in USP, which were removed by calculating first derivatives of emission spectra. In the present experimental setup, the samples were excited at 280 nm, which is the absorption maximum of tryptophan. The emission spectrum was recorded from 280 to 900 nm. First derivatives revealed that strong changes in fluorescence intensity are observed at 340–360 nm, which is the emission maximum for tryptophan, i.e., protein. Regression coefficients for mAb, HMW, and LMW were 0.955, 0.892, 0.955, with RMSEs of 0.166 g/L, 0.126 g/L and 0.717 g/L, or 8.3%, 11.8%, and 3.3% of the final concentration, respectively.
In ATPE, the spectra show the expected emission maximum of proteins at 350 nm. A second major peak can be seen 550 nm. Preprocessing included first derivative and SNV normalization. Regression coefficients of 0.85 (mAb), 0.74 (HMW), and 0.85 (LMW) are obtained by PLSR. The corresponding RMSE values were 0.128 g/L, 0.018 g/L, and 0.542 g/L, which is 6.8%, 10.9%, and 3.8% of the final mAb, HMW, and LMW concentrations, respectively.
In precipitation, the entire spectrum was used for analysis. Analyzing the raw data an absorption maximum between 570 and 675 nm can be identified, which describes the concentration increase during dissolution satisfactory. PLSR analysis resulted in an R
2 of 0.90 with a RMSE of 0.02. These deviations are equivalent to 3.8% for the final mAb concentration in dissolution. The regression is depicted in
Figure 11.
In chromatography, fluorescence spectra were shortened to 580–700 nm. Fluorescence data were not preprocessed, which would eliminate some of the information contained in the spectra, worsening PLSR. For fluorescence the R
2 was 0.93. The RMSE was 0.024 or 7.9% of the highest sample. The regression results are depicted in
Figure 11. In comparison to DAD, see
Figure 10. The fluorescence model predicts low concentration samples more accurately. This can be explained interpreting the spectra, see (b). The samples containing high concentrations of IgG emit most light at around 660 nm, while for low IgG concentration samples and high side concentration samples the fluorescence maximum is shifted to 680 nm and 600 nm respectively.
In UF/DF, first derivatives were calculated from the raw emission spectra, which were then regressed using PLSR. A good regression coefficient of 0.986, with a RMSE of 0.705 g/L, was found. This corresponds to a deviation of 3.5% with respect to the final mAb concentration.
3.5. Combination of Spectroscopic Data
For the analysis of cell culture samples, Raman and FTIR spectroscopy showed the most promising results. Therefore, the combined analysis of Raman and fluorescence spectra in one PLSR was evaluated. The combination of Raman and FTIR data yielded similar regression coefficients as the two single methods of 0.991 for mAb, 0.995 for HMW and 0.996 for LMW, with RMSEs of 0.073, 0.028, and 0.207 g/L, 3.7%, 2.6%, and 1% of the final concentration, respectively. Although this might not seem advantageous at first, it must be considered that both methods yield different information, thereby providing potentially a more robust prediction.
Addition of DAD spectra further enhanced the overall regression as the regression coefficients increased to 0.996 (mAb), 0.993 (HMW), and 0.997 (LMW), with RMSEs of 0.048, 0.032, and 0.170 g/L, 2.4%, 3%, and 0.8% of the final concentration, respectively. This indicates, that further orthogonal measurement methods may further improve the overall predictive power of spectroscopic PAT-tools.
In ATPE, the same preprocessing procedure was applied. However, prior to PLSR combined spectra were normalized to their respective maximum to even the amplitudes. The combination of Raman and FTIR yielded regression coefficients of 0.97 (mAb), 0.85 (HMW), and 0.97 (LMW). By further expanding the range of orthogonal predictor data by adding DAD obtained spectra, regression coefficients of 0.99 (mAb), 0.87 (HMW), and 0.96 (LMW) are obtained. This simple approach of combining spectral data reveals that just combining the spectra as predictor set in PLSR does not yield a higher prediction accuracy. Rather it seems that the algorithm still favors the most suitable data, which, in case of ATPE, was Raman. Hence, the obtained regression coefficients are similar to the initial results by Raman alone. More sophisticated approaches in combining different data set, are needed to investigate possible benefits in accuracy. However, having orthogonal detector data at hand, can enhance the reliability of the overall control strategy.
For the precipitation unit, DAD and Raman have each given the best performance in dissolution with an R2 of 0.93 (mAb). Raman correlated to purity with an R2 of 0.85. Prediction of purity was not possible with DAD alone. Therefore, the combination of the two sensors in one PLSR is investigated. Both detectors in combination achieved an R2 of 0.90 for prediction of the target component and resulted in an R2 of 0.72 for purity. Although the regression coefficient for the combination of detectors is lower than for the single detectors, the orthogonal nature of both detectors increases the robustness.
In chromatography, a combination of DAD and fluorescence data showed significant improvement in prediction quality. For IgG concentration an R2 of 0.93 was achieved. In addition, the low prediction error for spectroscopic data with no IgG content, which was observed in fluorescence data but not in DAD data, was reproduced. For LMW 1, an R2 of 0.91; for LMW 2, an R2 of 0.93 was achieved. R2 for the IgG dimer is 0.67 and could not be improved. The reason for this might be the low concentration of 0.022 g/L at maximum, and, therefore, the system-immanent error resulting from offline analytics methodology. RMSE for the combined PLSR model was 0.027 for IgG, 0.0047 for dimer, 0.016 for LMW 1, and 0.014 for LMW 2 which corresponds to 9.7%, 20%, 13.9% and 10% respectively.
3.6. Additional Process Data
PAT may not only cover spectroscopic measurements but also include all other available online data sources for providing means of achieving APC. In cell culture these include measurement of pH and pO
2, but also conductivity [
5], pCO
2, off-gas analysis and turbidity. Changes in pH, pO
2, pCO
2, off-gas composition can be used to predict the metabolic state of the cells by means of oxygen consumption and carbon dioxide production. CHO cells typically exhibit overflow metabolism that is characterized by high rates of lactate excretion. Hence, most carbon from glucose is not initially converted to CO
2. Switch to an oxidative metabolic phenotype might be detected by altered patterns of oxygen consumption and CO
2 excretion, which would also decrease the pH. While turbidity yields information about the total cell concentration, conductivity changes can be correlated to decreasing viability, whereby the combination of both methods can be used to predict viable cell concentration [
5].
In ATPE, the pH (6.4 ± 0.1), conductivity (12 ± 2 mS/cm) and density (1104 ± 4 kg/m3) strongly depend on the properties of the phase forming components, in this case PEG400 and phosphate salt. Since the properties of polymer and salt buffers do not change during the process, no correlation between species concentrations and other sensor data were found. Turbidity (37.5 ± 12.5 FAU) is constantly low. However, it is important to keep in mind that these data still hold value and should be continuously monitored, as they are suitable to check if the process operates within specifications as part of a control strategy.
In precipitation, the pH value remains constant throughout precipitation which indicates that no process information can be correlated to this sensor signal. The conductivity (12 mS/cm) is depend on the light phase which contains residual phosphate salt as described in the ATPE section. Since the added PEG solution is not conductive after PEG addition the conductivity decreases. The resulting conductivity change can be correlated to the composition of the dispersion and can be used as control PAT. Turbidity has, like conductivity, a strong deflection during addition of PEG because precipitate formation occurs instantaneously. Turbidity is not specific to one protein, but can be used as control sensor to monitor precipitation progress. During dissolution, the pH value (pH = 5.9 ± 0.1), conductivity (1.5 ± 0.1 mS/cm) and turbidity (0 FAU) remained constant during redissolution of precipitates.
During chromatography, pH and conductivity were measured. pH maintains constant during chromatography, with a minor change of ±0.02 during side and target component elution at 23 to 30 min. The course of conductivity during chromatography is mainly dominated by the changing salt concentration. While the elution time of the components can be detected using pH, a significant change in the determination coefficient of the PLSR model was not observed. However, especially pH and conductivity changes are especially known to be valid and of substantial aid for process operation performance and maintenance prediction systems [
75].
In UF/DF, the salt concentration can be correlated to conductivity. pH can be correlated to progress of buffer exchange. Turbidity is not applicable anymore such late in the process.
3.7. Analytics
3.7.1. ELISA
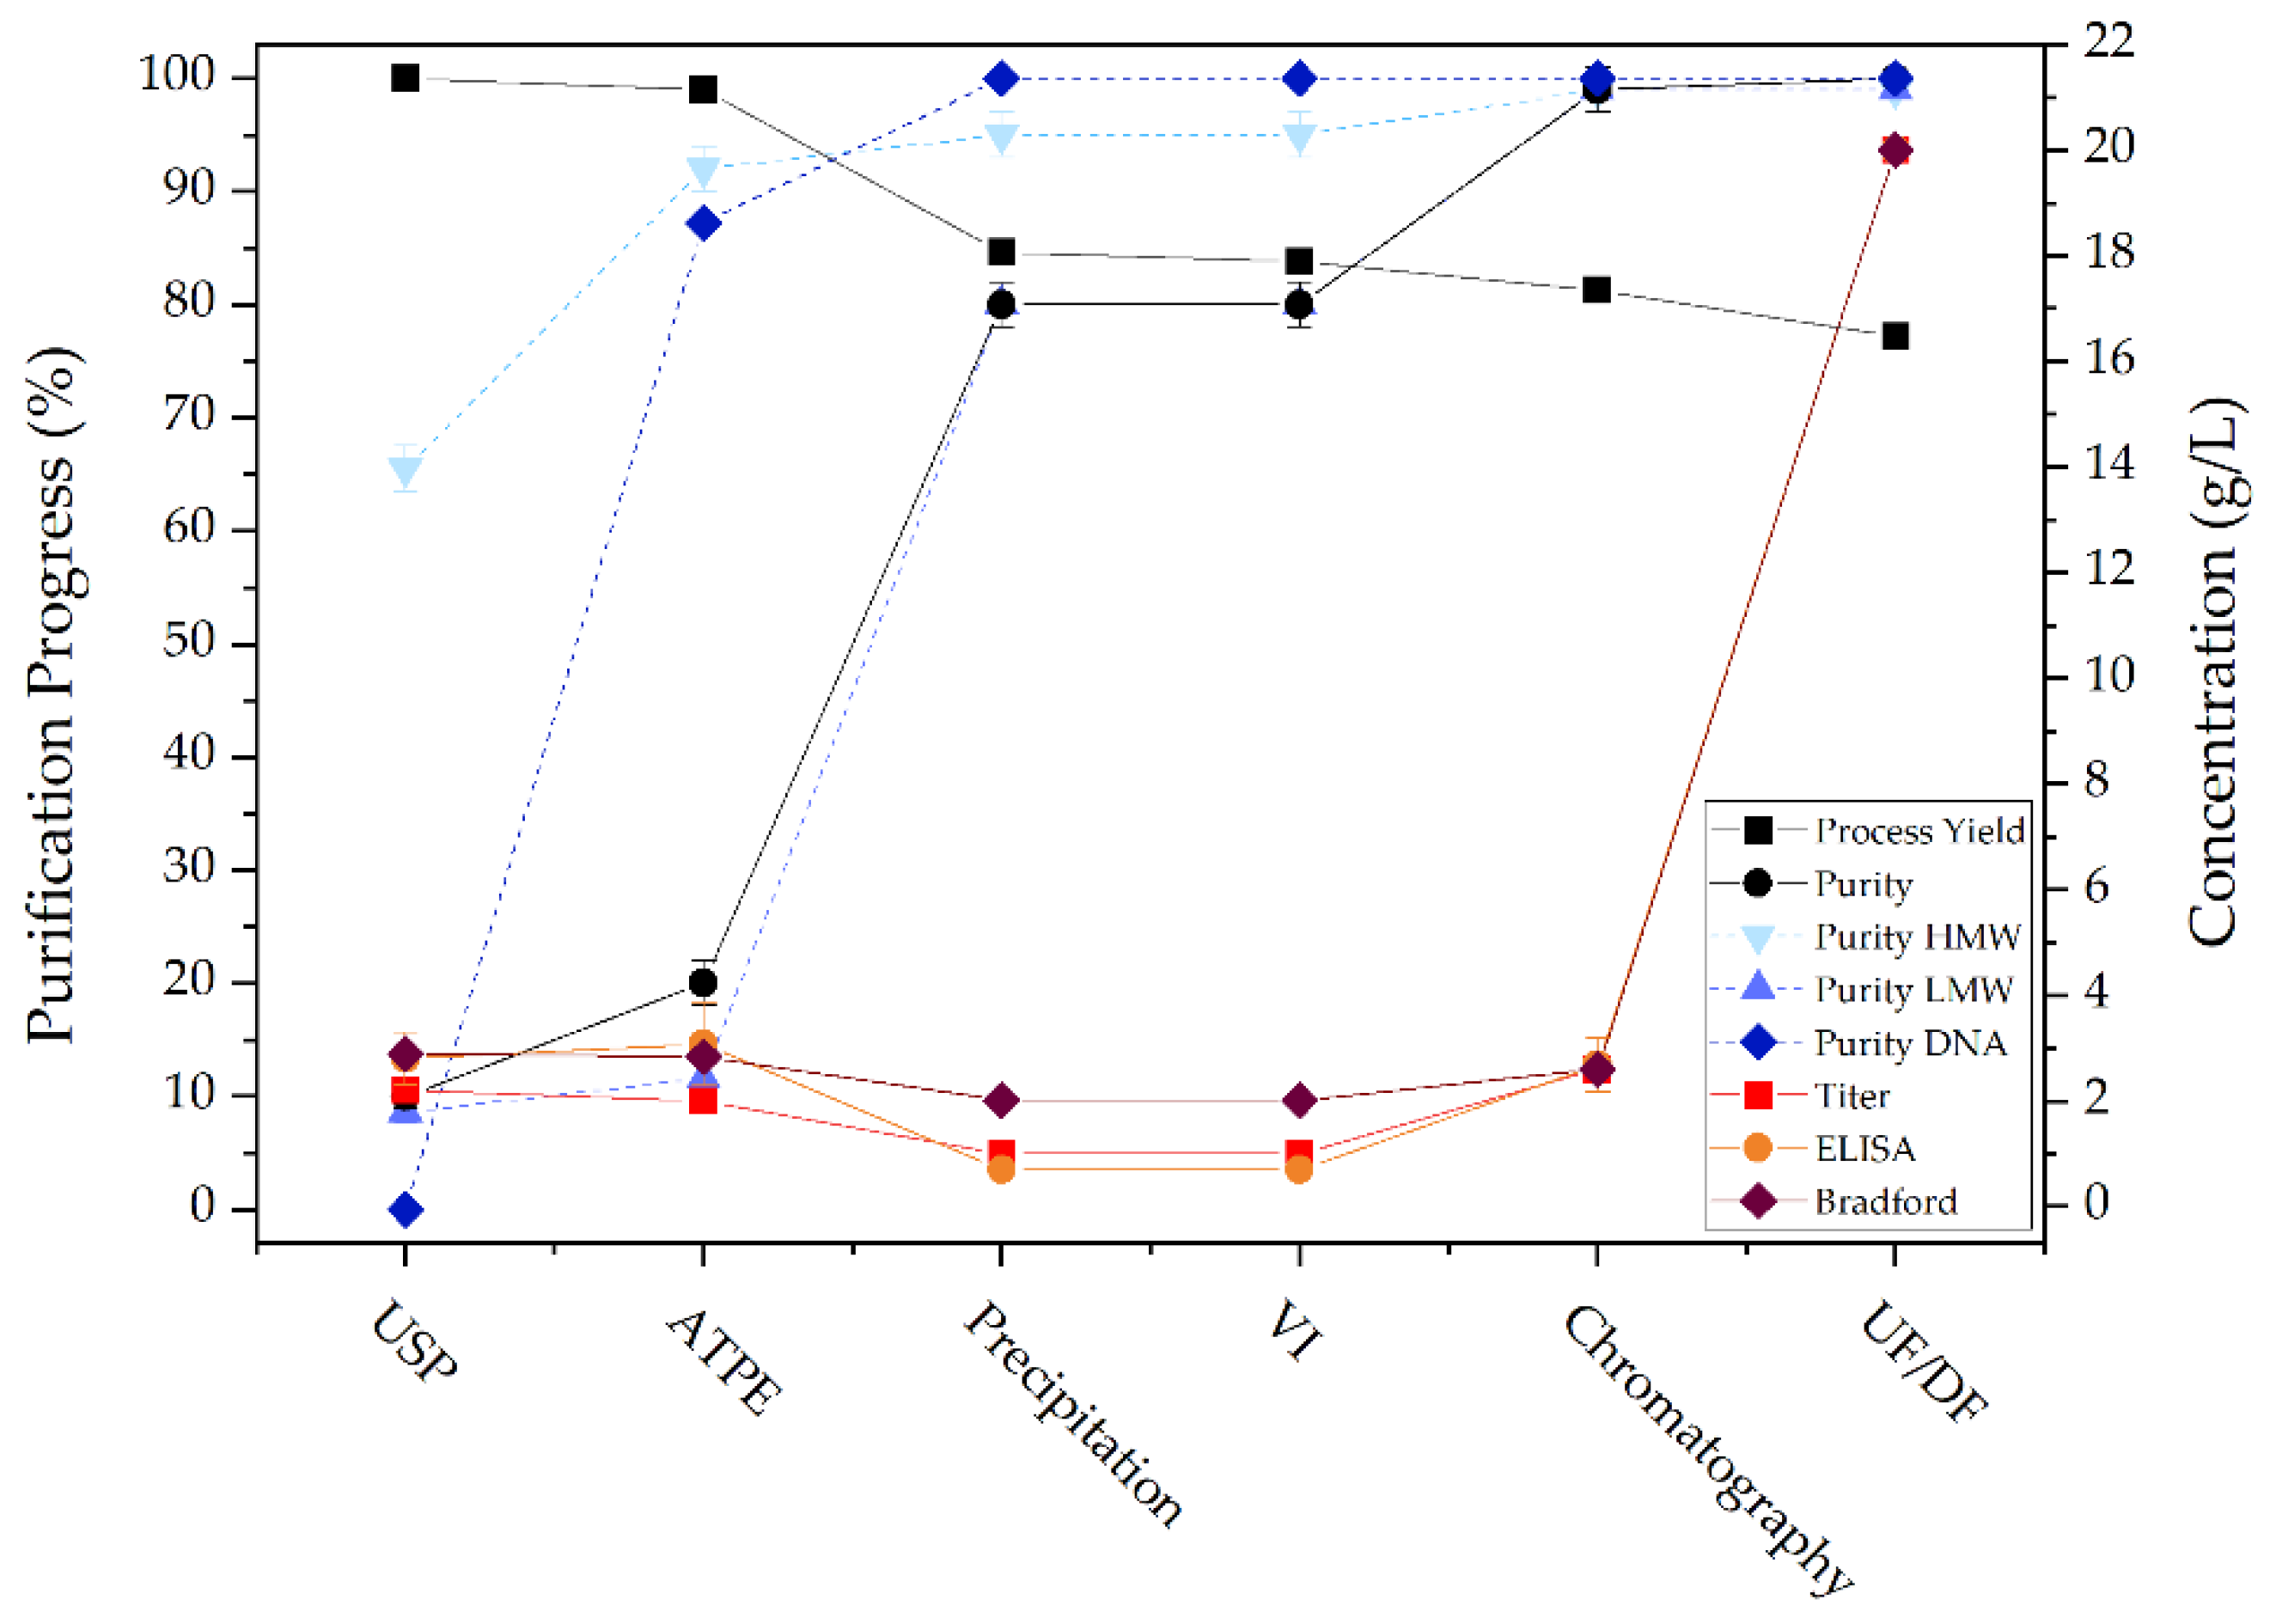
The most critical quality attribute is the biological activity of the therapeutic protein, as this determines whether it retains its efficacy. For this reason, a specific direct enzyme-linked immunosorbent assay (ELISA) was performed to examine the preservation of biological activity after each unit operation. In Figure 17 the activity of detected mAb is shown. It can be seen that biological activity is successfully maintained after ATPE, precipitation and chromatography.
3.7.2. Bradford
The Bradford test is a colorimetric method for determination of total protein concentration. The test is based on the binding of Coomassie Brilliant Blue G-250 to acidic amino acid residues. Upon binding of the dye to the amino acids under acidic conditions, a shift of the dye’s absorption maximum occurs, which causes a color change from red/brown to blue. This color shift is proportional to the total protein concentration, though care must be taken as different protein compositions can cause differences in dye binding intensity and accordingly color change. Therefore, the choice of a proper, representative, protein for generating a calibration curve is very important. Figure 17 shows the results for total protein concentration determination.
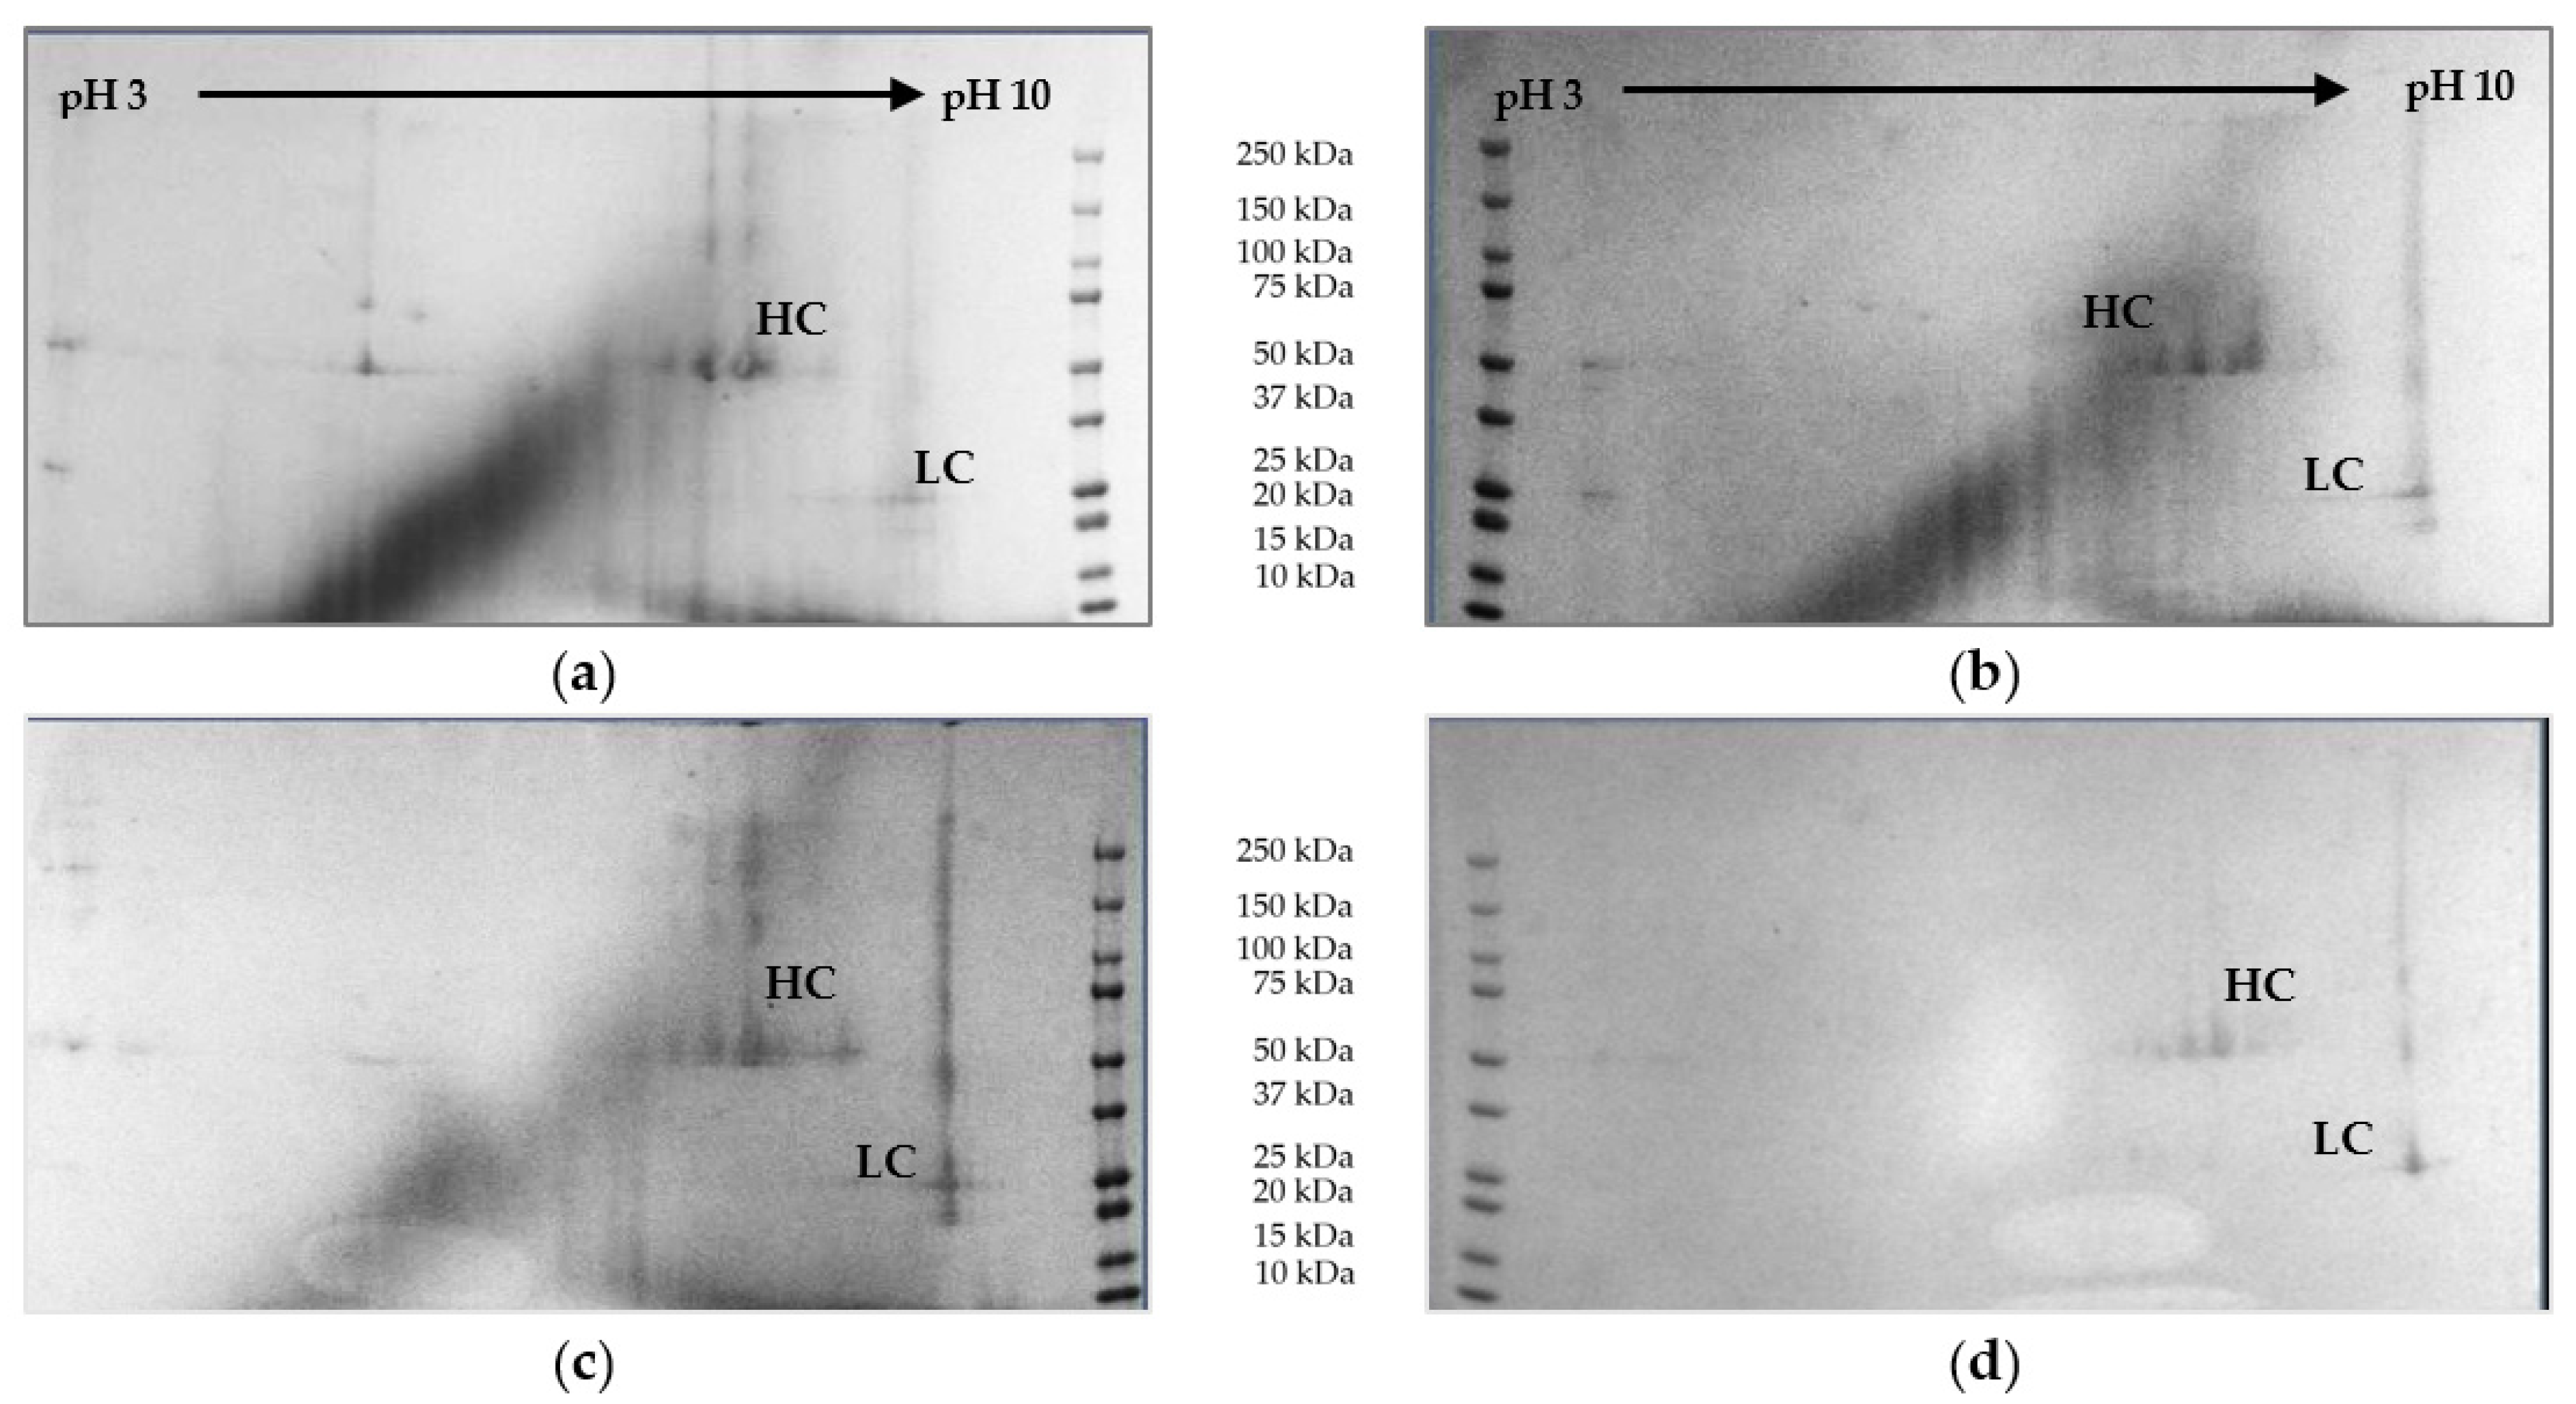
3.7.3. SDS-PAGE
The 2D Gel electrophoresis is used as a visualizing method for detection of proteins. In the first dimension, the proteins are focused according to their isoelectric point in a pH gradient (pH 3–10). Following, they are separated according to their size through gel electrophoresis. Heavy chain (HC) and light chain (LC) of the mAb can be clearly identified. Reduction of protein concentration throughout the process can be observed. The highest side component concentrations are found in cultivation broth (top right). Gels are depicted in
Figure 12.
3.7.4. DNA Concentration Determination
The concentration of double stranded (ds)DNA can be determined using intercalating dyes such as SYBR Green. The DNA-dye complex is excited at 480 nm and the emission is measured at 520 nm. The fluorescence intensity is proportional to the amount of dsDNA and the concentration can be determined by comparison to a fluorescence signal of a sample with known DNA concentration. Figure 17 shows the results for dsDNA concentration determination. It can be seen that ATPE achieves a 90% reduction in DNA concentration and the remaining DNA is removed in precipitation.
3.8. Process Simulation Studies to Propose Advanced Process Control Concepts
In literature concentration fluctuations or a continuous mAb concentration decrease due to decreasing cell specific productivity over process time have been described [
6]. Simulation studies are used to test whether PAT can enable a process control strategy that allows for compensation of titer fluctuations in the subsequent DSP. The scenario for the following simulations is that the mAb concentration and purity (i.e., HMW and LMW concentrations) are continuously measured in the outstream of each unit operation using the detector array presented above. The real time measurement data are continuously forwarded to the following unit operation in the mAb manufacturing process. This information is fed into a process model that calculates the necessary process adjustment to reach either a constant mAb concentration or constant volume flow.
Since the focus of the study presented here is not just simply the process models, but the application and demonstration, in combination with the already discussed spectroscopy-based PAT, we refer here again to the publications on the respective unit operations.
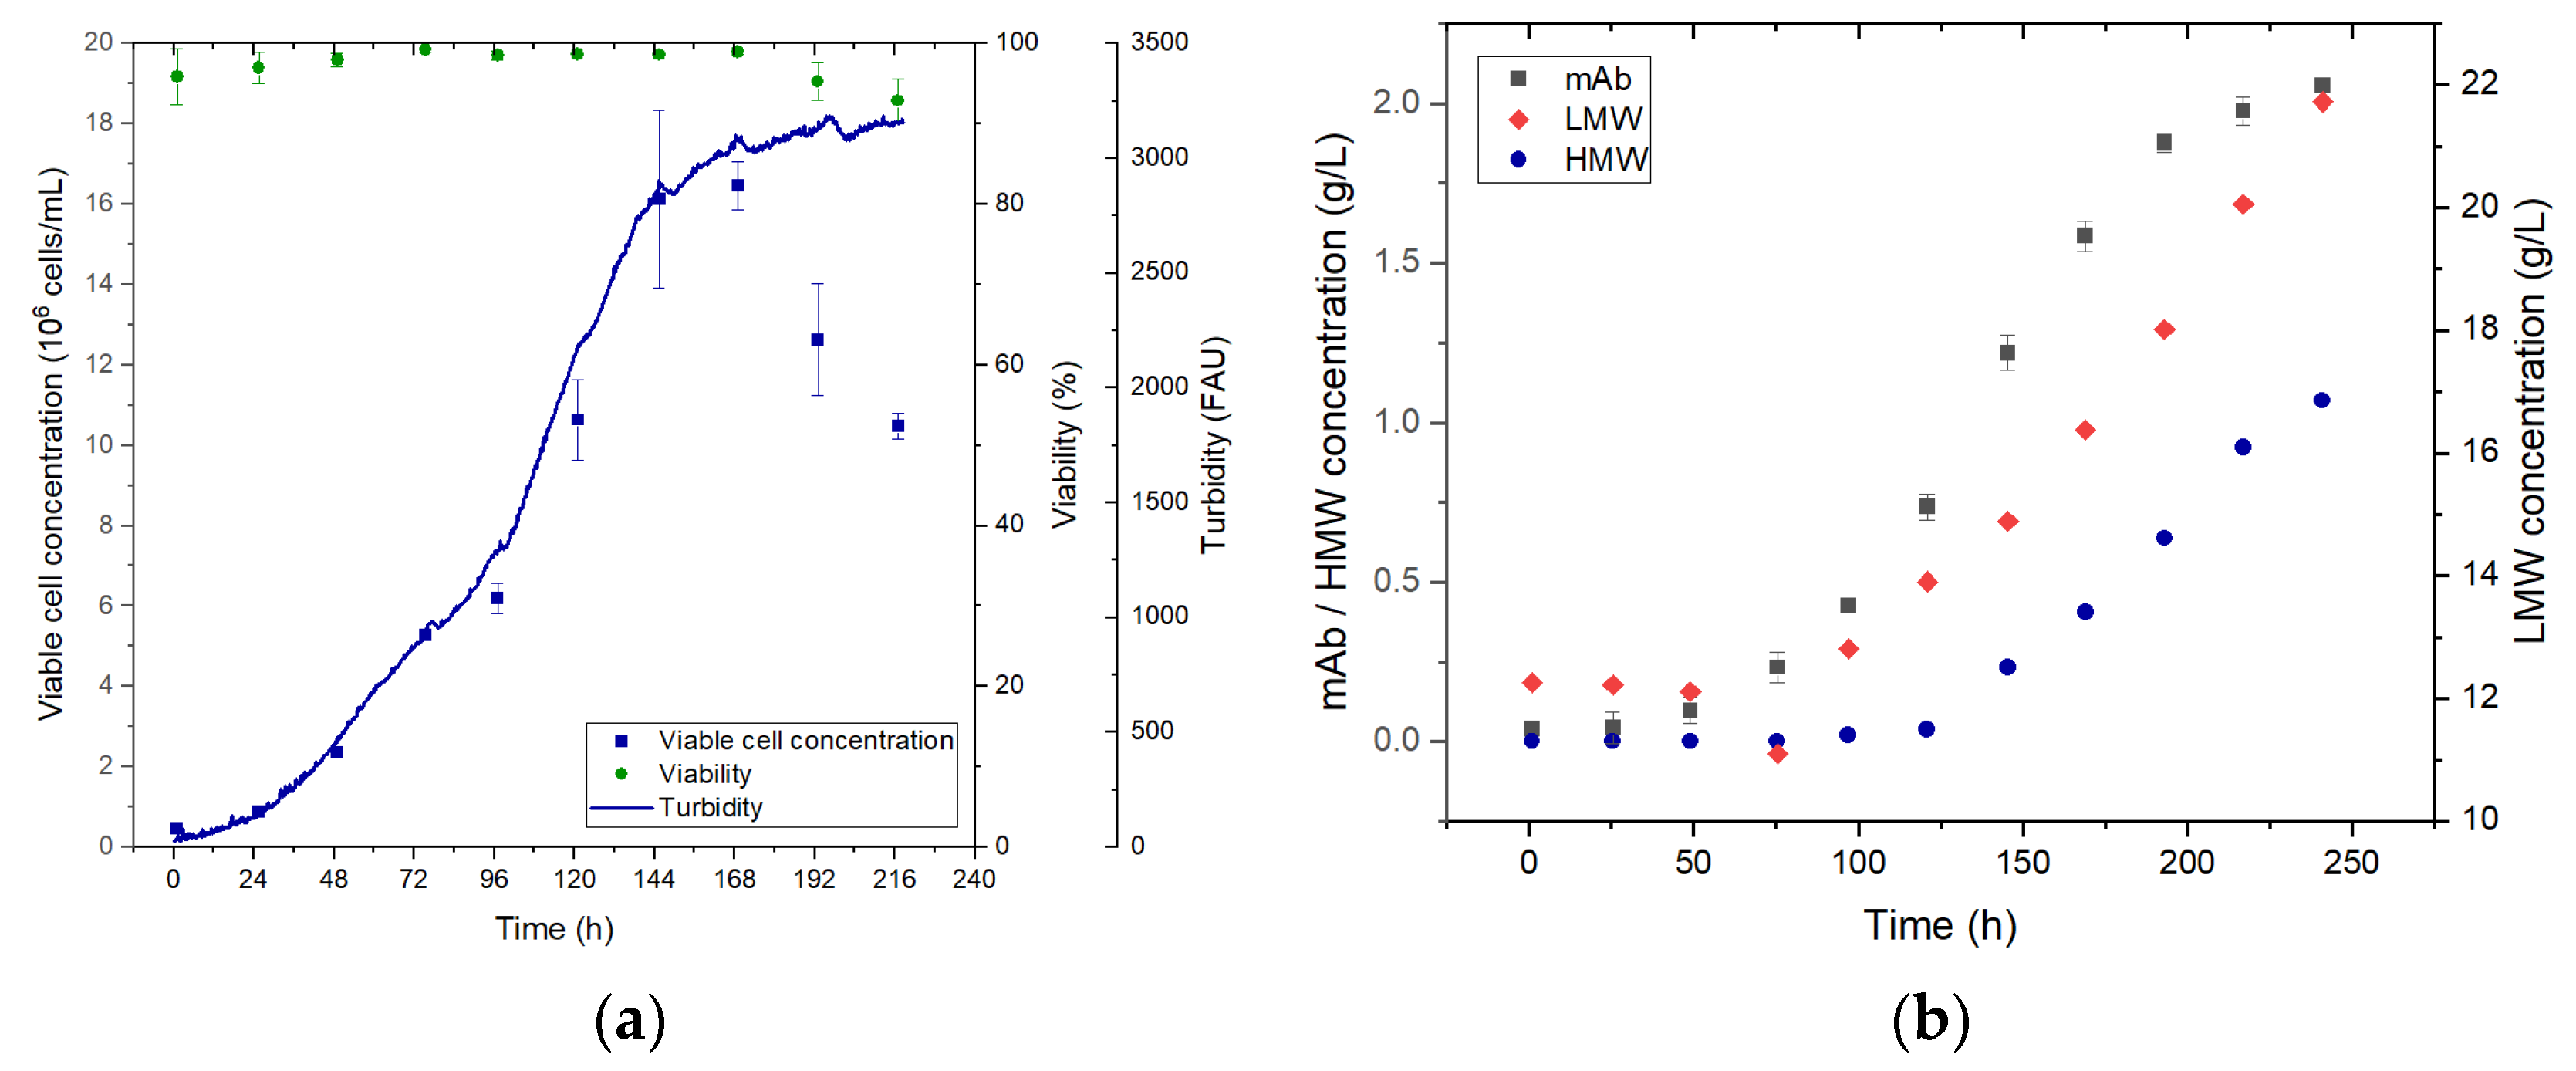
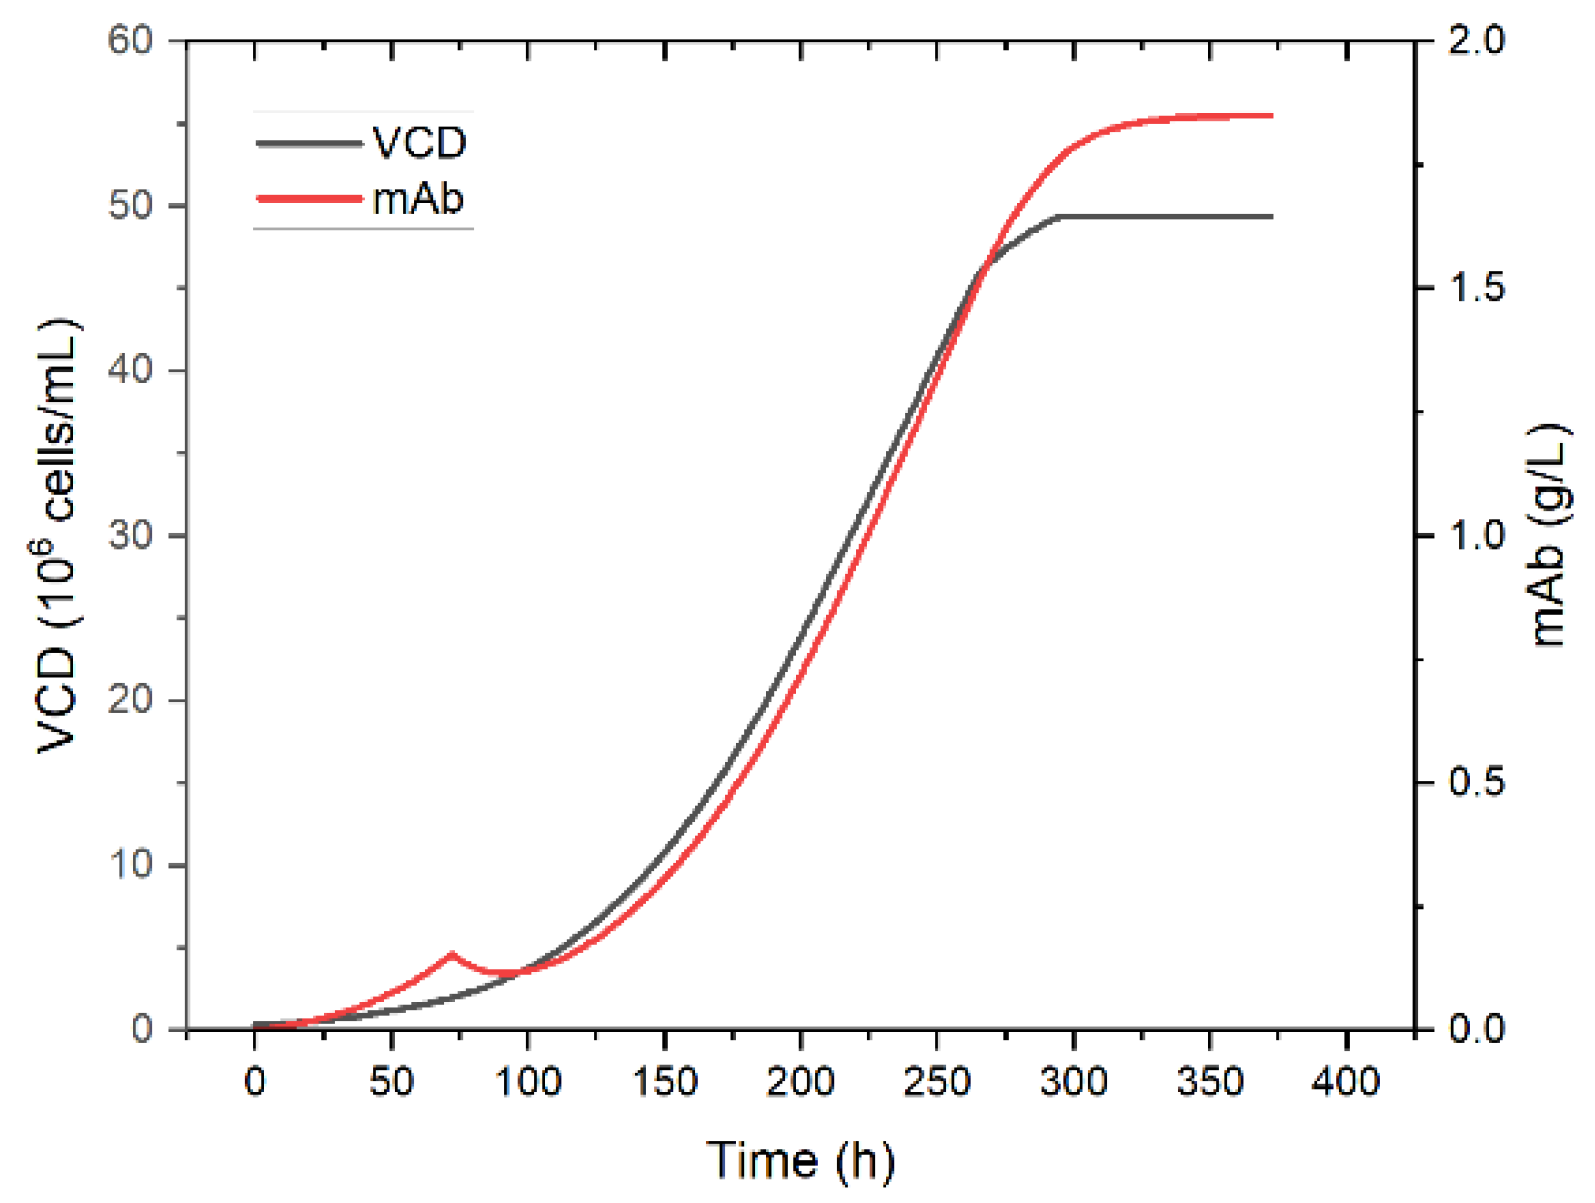
Simulation of viable cell concentration and product concentration in perfusion mode is shown in
Figure 13. The viable cell and product concentration increases over the first 72 h. Then the perfusion is started and the product concentration decreases momentarily since more product is washed out than is produced. Shortly after the concentration increases again proportionally to the viable cell concentration until the steady state is reached after approximately 350 h. Product concentration in the steady state reaches 1.8 g/L. As a basis for the following unit operations, a final steady state concentration of 2 g/L is assumed.
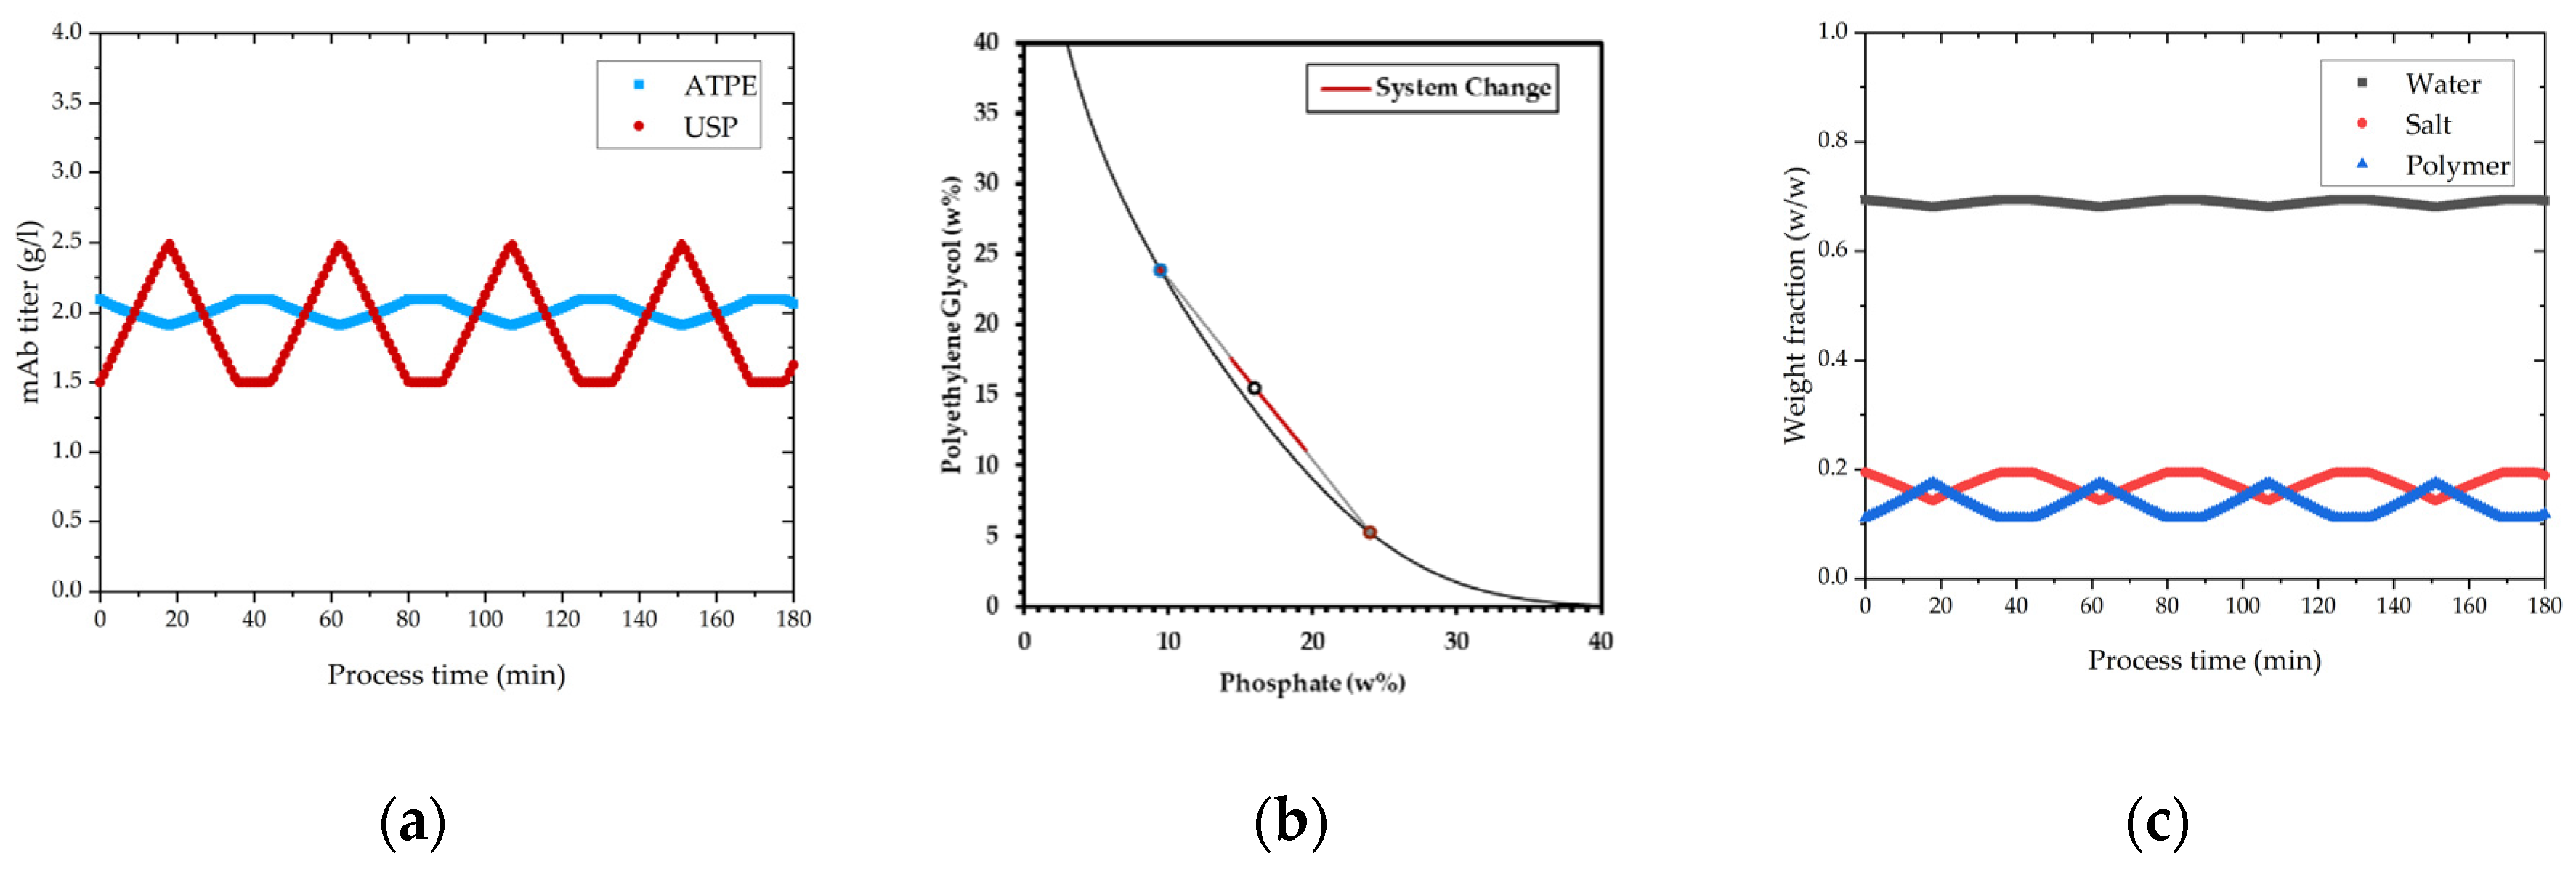
Figure 14 shows how concentration fluctuations in USP are processed to a constant concentration in the product containing light phase. Polymer and salt solutions are mixed based on the phase equilibrium within the same tie-line. Based on the lever-arm rule, either less or more light phase is produced, thereby concentration is kept constant. Operating on the same tie-line is necessary to ensure constant yield and product phase properties.
In
Figure 15, the concentration change in precipitation over process time is depicted. Precipitation is a concentration independent process [
73], which can be also verified with these results. The ratio of PEG solution and light phase do not change with varying mAb concentration because the PEG content is calculated based on the volume coming from extraction and not respectively to the concentration. In this way concentration variations do not affect precipitation. For higher titers precipitation takes slightly longer (few seconds) as show in
Figure 15, but the result is the same, and lead to complete precipitation. Complete precipitation is a function of mixing of light phase and PEG solution.
In contrast, dissolution is concentration dependent and able to react to decreased or increased feed concentration by adjusting the dissolution ratio. In this manner the precipitation unit can provide a constant concentration for chromatography, which is shown in
Figure 15b. For different feed concentrations, the dilution ratio was adjusted resulting in a constant output concentration of 2.6 g/L (±0.05). Changes in flow rate can be compensated with a higher stream of PEG solution to keep precipitations condition constant and ensure complete precipitation. Due to the fact that dead-end filtration eliminates the complete volume of supernatant around precipitates, flow rate fluctuation does not affect dissolution. Hence, concentration and flow rate changes cannot be compensated at once since a constant mAb concentration is accompanied by a fluctuation in flow rate. Compensation of purity was not possible in precipitation.
In
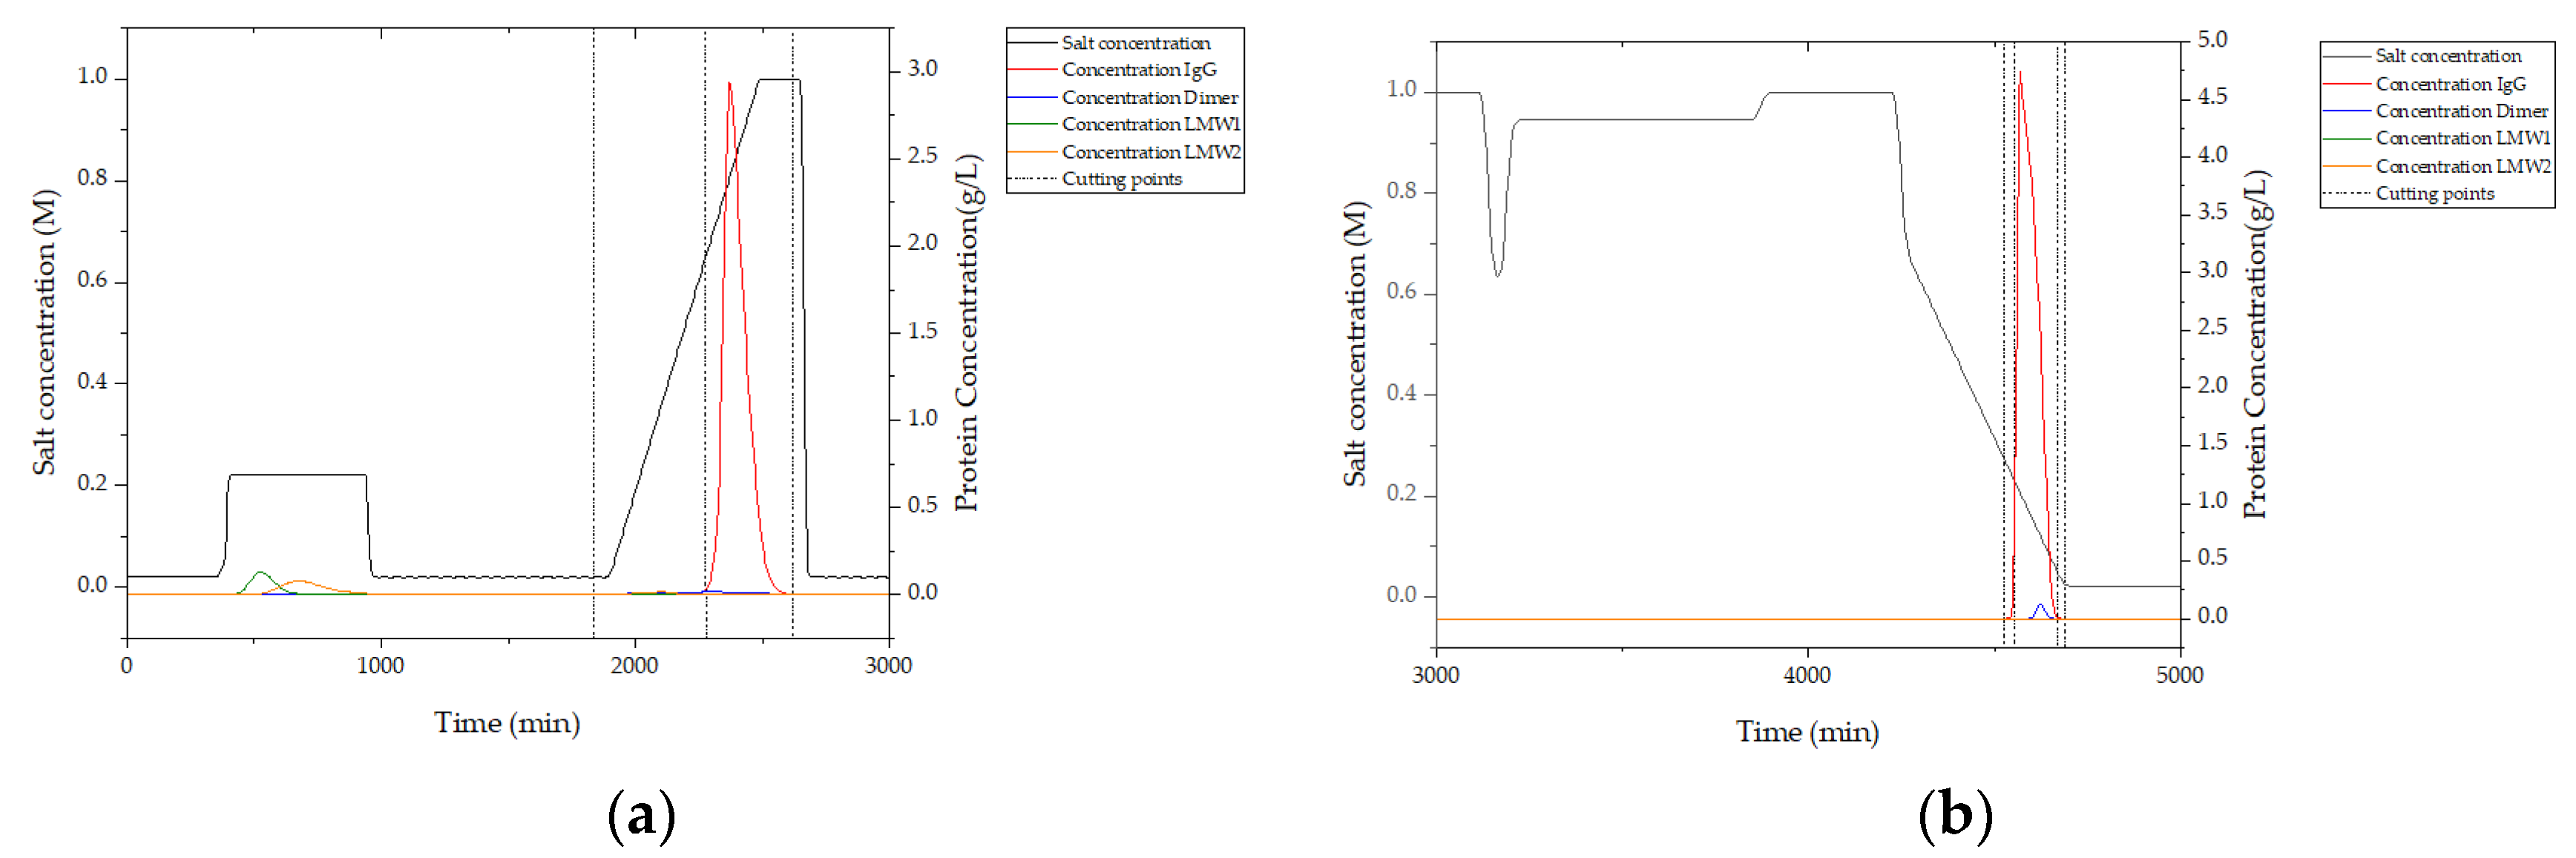
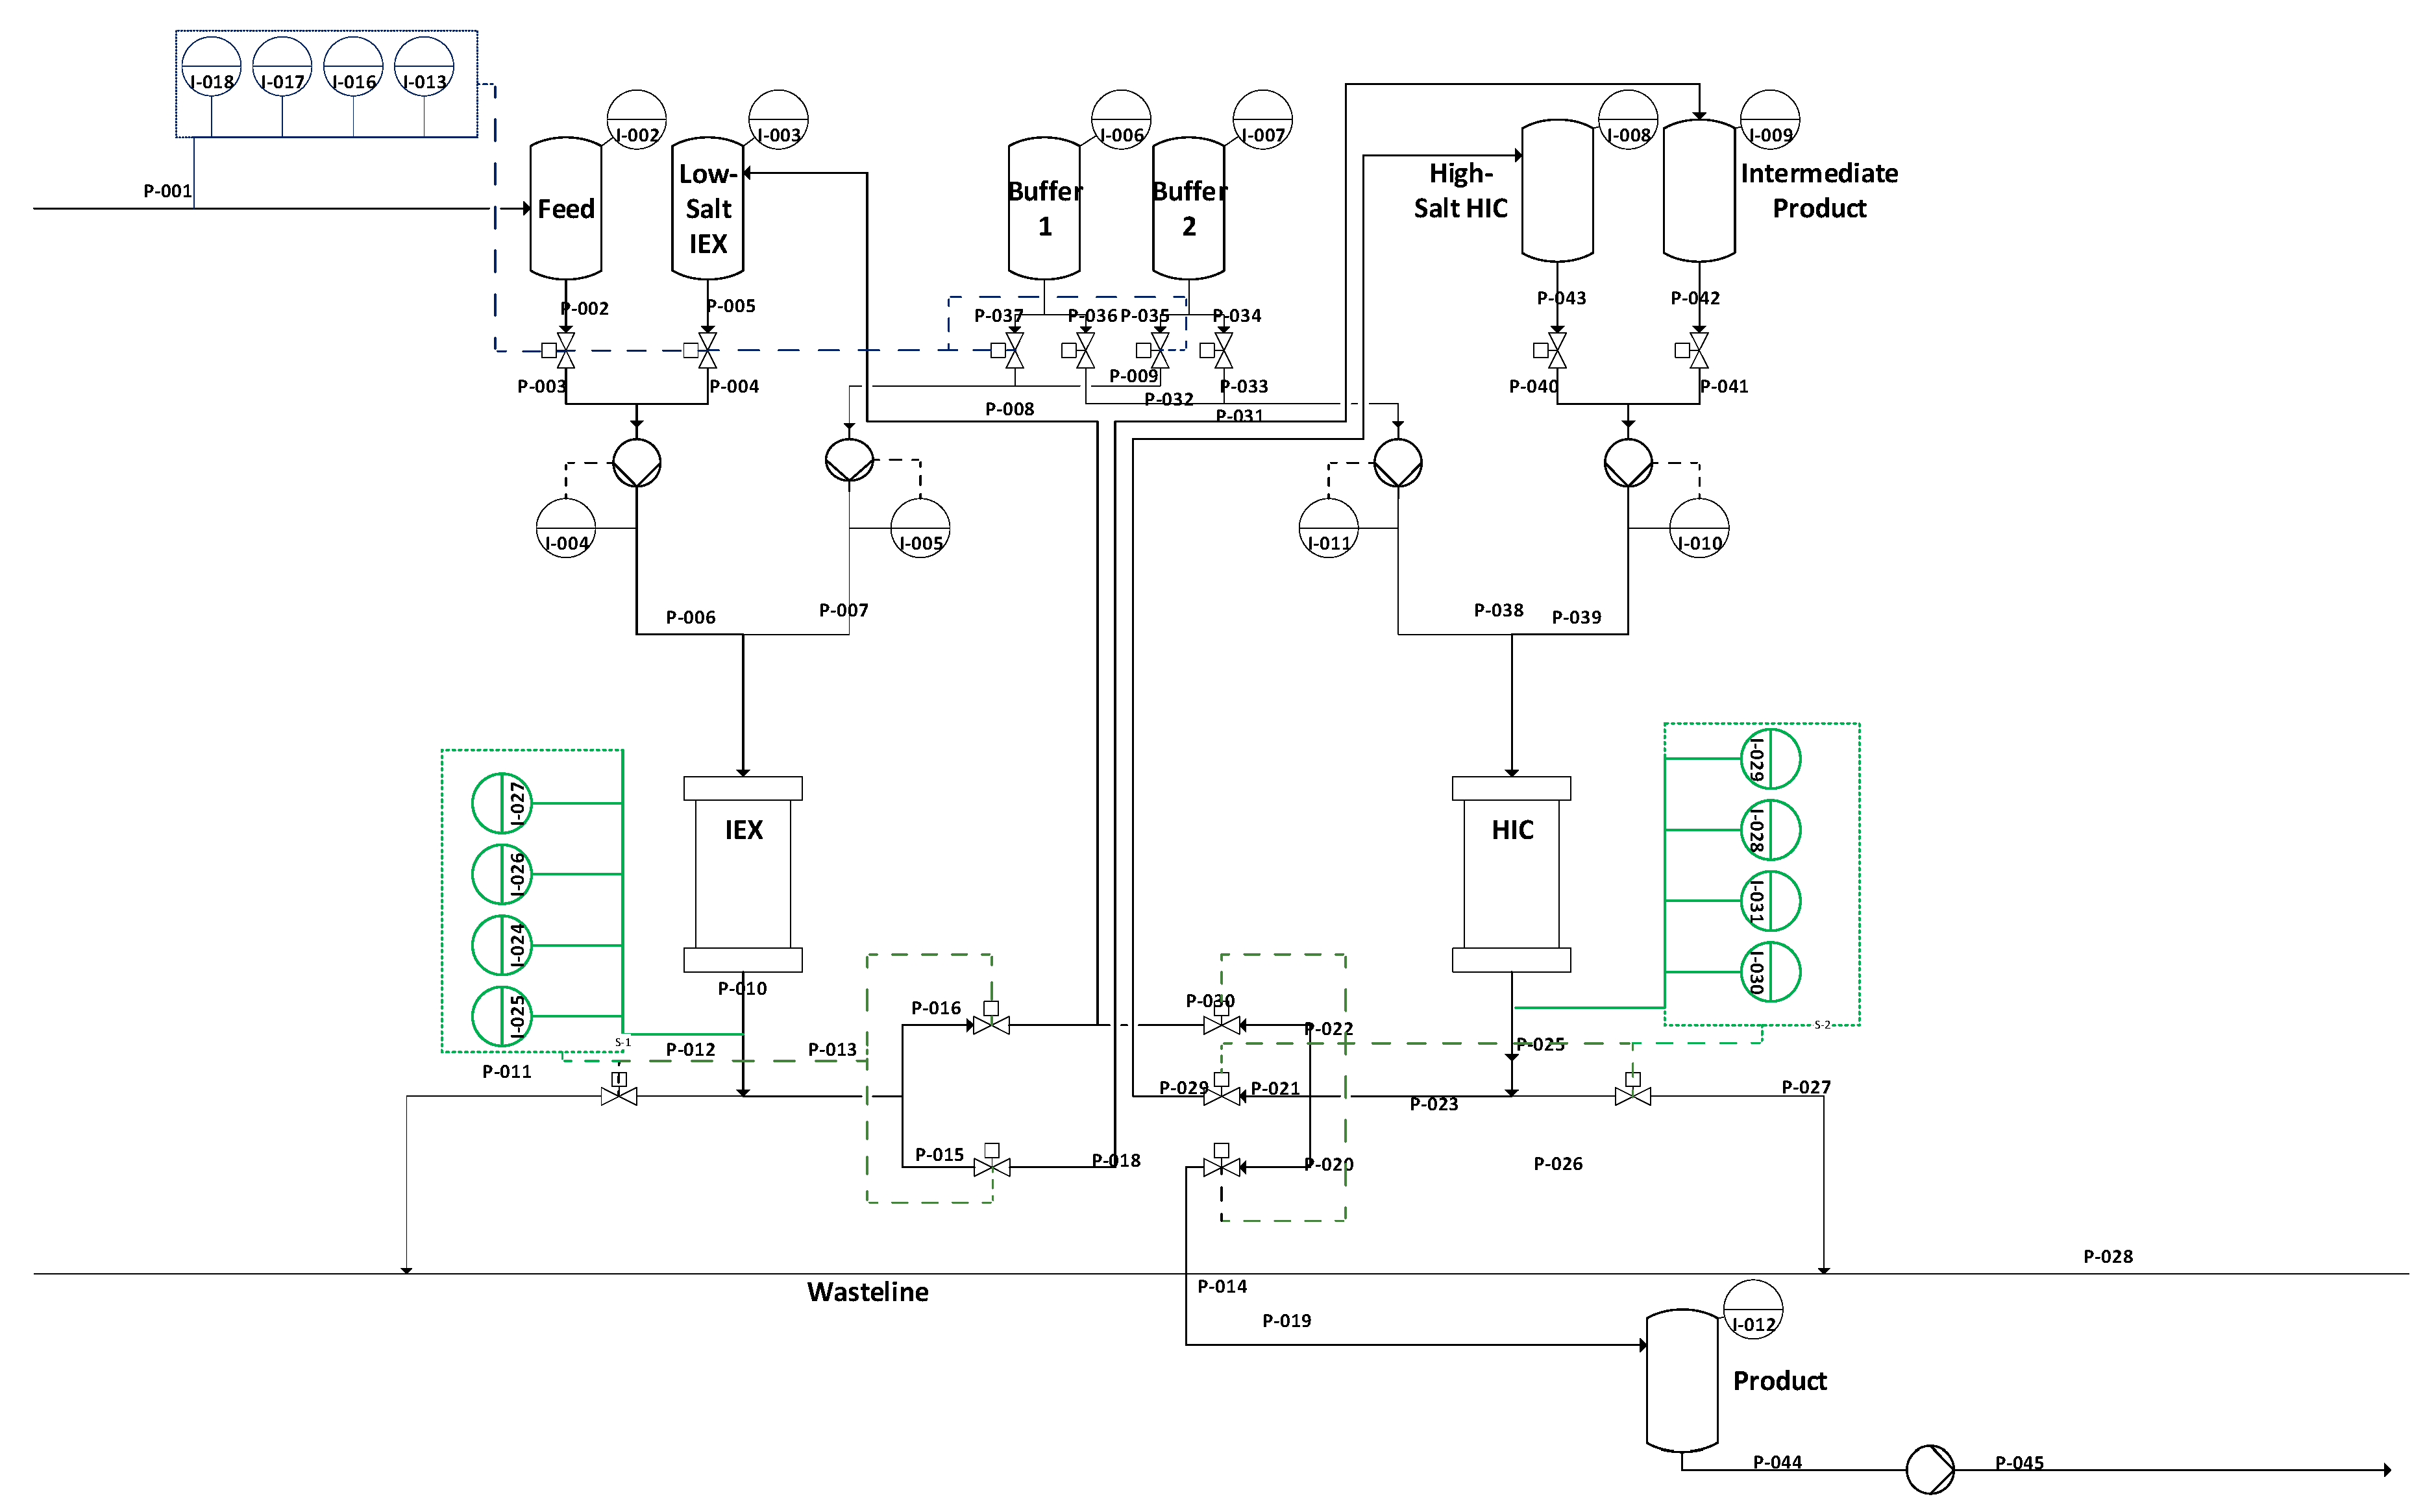
Figure 16, simulation results from integrated counter current chromatography (iCCC) modeling are illustrated. In (a), the chromatogram of ion exchange chromatography (IEX) is given. Between 400 and 1000 s, the majority of LMW 1 and LMW 2 are eluted. This is due to the loading of the strong-binding fraction of hydrophobic interaction chromatography (HIC) and the weak-binding fraction of IEX. IgG is eluted from 2250 to 2500 s. Cutting points are marked with dashed lines and are set at 0.05 g/L which was detectable in chromatography using the PAT system described above.
This simulation shows that an in-line process control using a PAT system of DAD and/or fluorescence leads to a very high process yield, since cutting points in the chromatogram can be automatically detected, controlling the fractionation.
5. Conclusions
In the present study, for a whole mAb manufacturing process, the applicability of a combination of spectroscopic methods has been evaluated to enable APC in continuous manufacturing by PAT.
In USP and the following direct ATPE, Raman-, FTIR-, fluorescence-, and UV/Vis spectroscopy have been successfully applied for titer as well as purity prediction. Raman was the most versatile and robust method and is recommended as primary PAT. In precipitation, similar results were obtained for titer determination. Prediction of purity was challenging for FTIR, fluorescence and UV/Vis, but achievable by Raman spectroscopy. In chromatography, the combination of UV/Vis and fluorescence spectroscopy was able to overcome difficulties in titer and purity prediction induced by overlapping side component spectra, often already reported in literature as well. In final UF/DF, before lyophilization, UV/Vis spectroscopy is applicable for titer concentration determination, however, for high concentration processes, it is important to ensure the DAD employed is able to operate at elevated concentrations. Raman spectroscopy is especially useful in early stages of the process, whereas more traditional detector technology concepts, such as DAD, can be used in late process stages. The combination of spectroscopic data improves the predictivity as shown for chromatography.
Continuous operation generates much smaller hold-up volumes than batch processing. This causes much shorter start-up und shut-down times with smoother systems responses. In addition, system response is much shorter and smoother, i.e., nearly constant, around the continuous operation point. Hence, detector signal acquisition times and corresponding sampling scan rates for continuous processing are much lower than for comparable batch operation. Changes due to natural system variances are less steep, i.e., continuously near constant system responses. In contrast, only typical gradient elution chromatography operation with fraction cut points at steep chromatogram concentration slopes challenge the accuracy in time resolution. These changes in concentration occur within a few seconds, whereas the feasible number of measuring points is limited by the sampling rate, which leads to a resolution of 10–50 points per peak. This results in an image of the concentration profile that is not sufficiently accurate for fractionation. Only typical breakthrough curves of flow-through operation mode in capture steps differ, and are, as well, sufficiently describable with higher acquisition times and averaged scans.
Based on the developed spectroscopic predictions, dynamic process control of the unit operations was demonstrated for the total process in sophisticated simulation studies based on validated digital twins available for all unit operations. As such, a PAT development workflow for any holistic process development is proposed.
To our knowledge, this comprehensive demonstration of the combination of the applicability of different spectroscopic methods, in the context of a holistic process development, including the complete total process simulation of an APC concept based on digital twins, has been shown for the first time, opening up innovative autonomous operation concepts for the future. The next steps will be the transfer towards different biologic types, such as antibody fragments, peptides, and VLPs available at the institute, as well as piloting studies of the APC conception proposed.


 ,
, 


