Comparative Analysis of the Behaviour of Marine Litter in Thermochemical Waste Treatment Processes

 , , and
Abstract
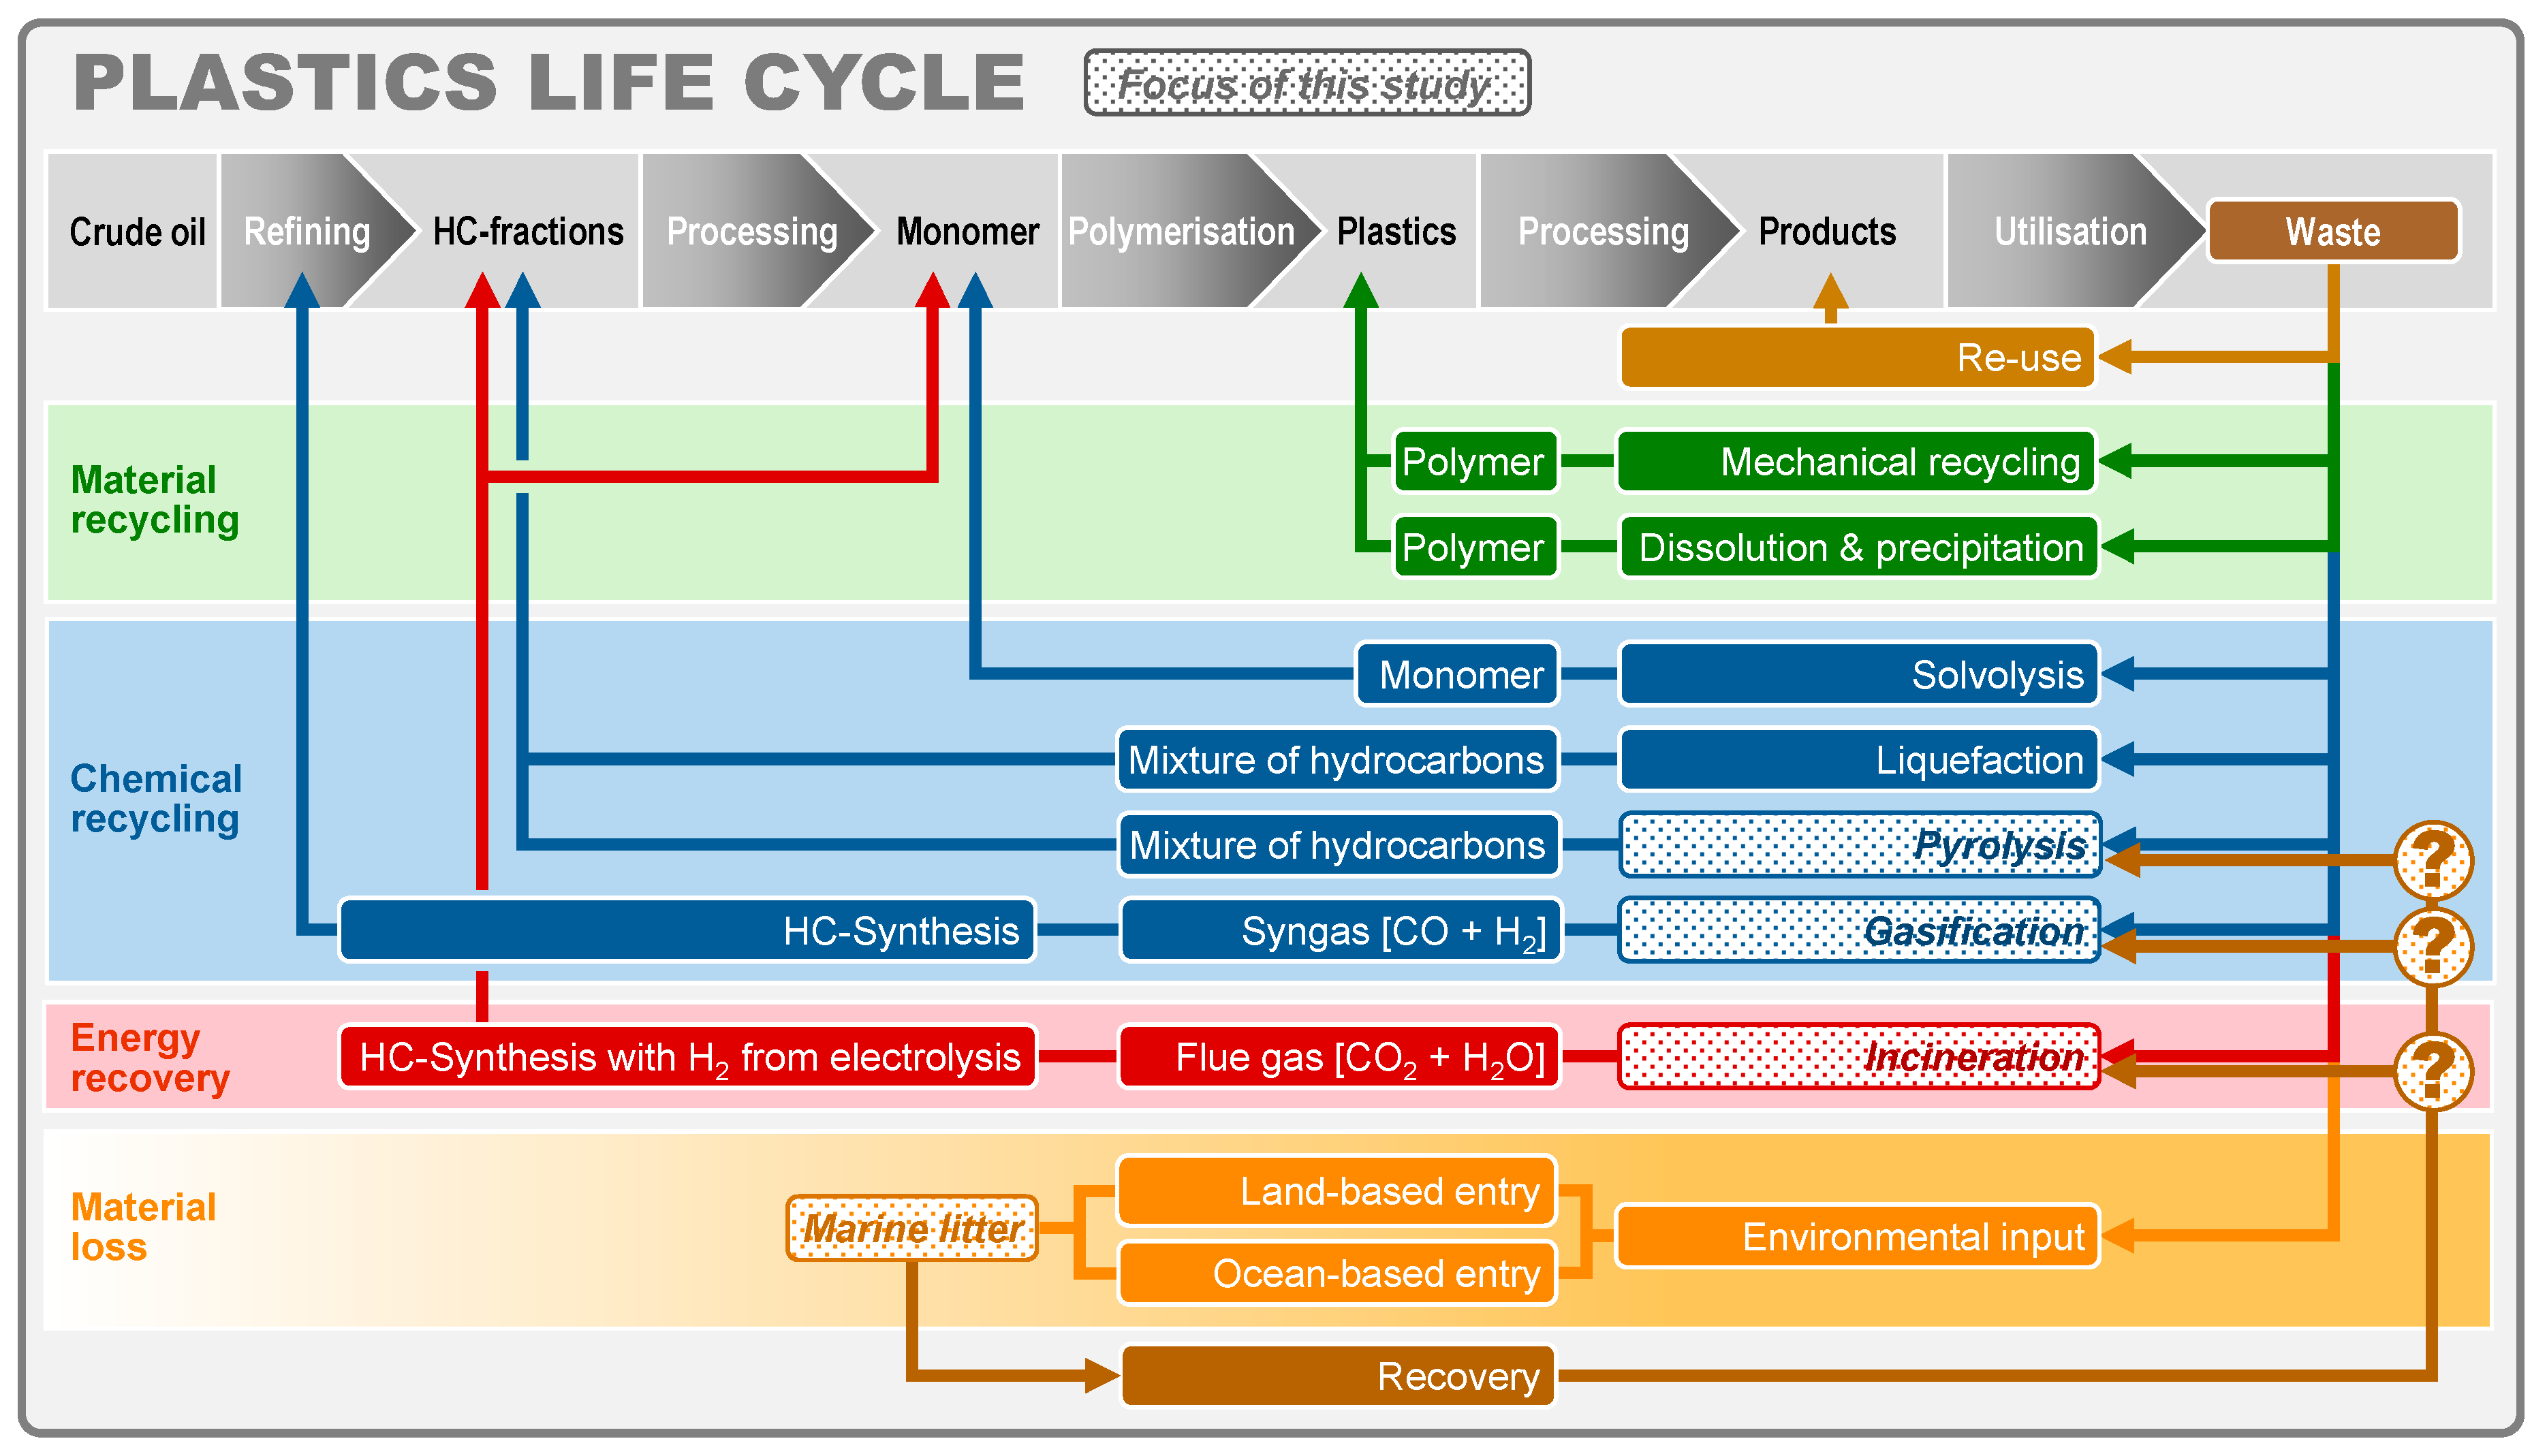
1. Introduction
2. Materials and Methods
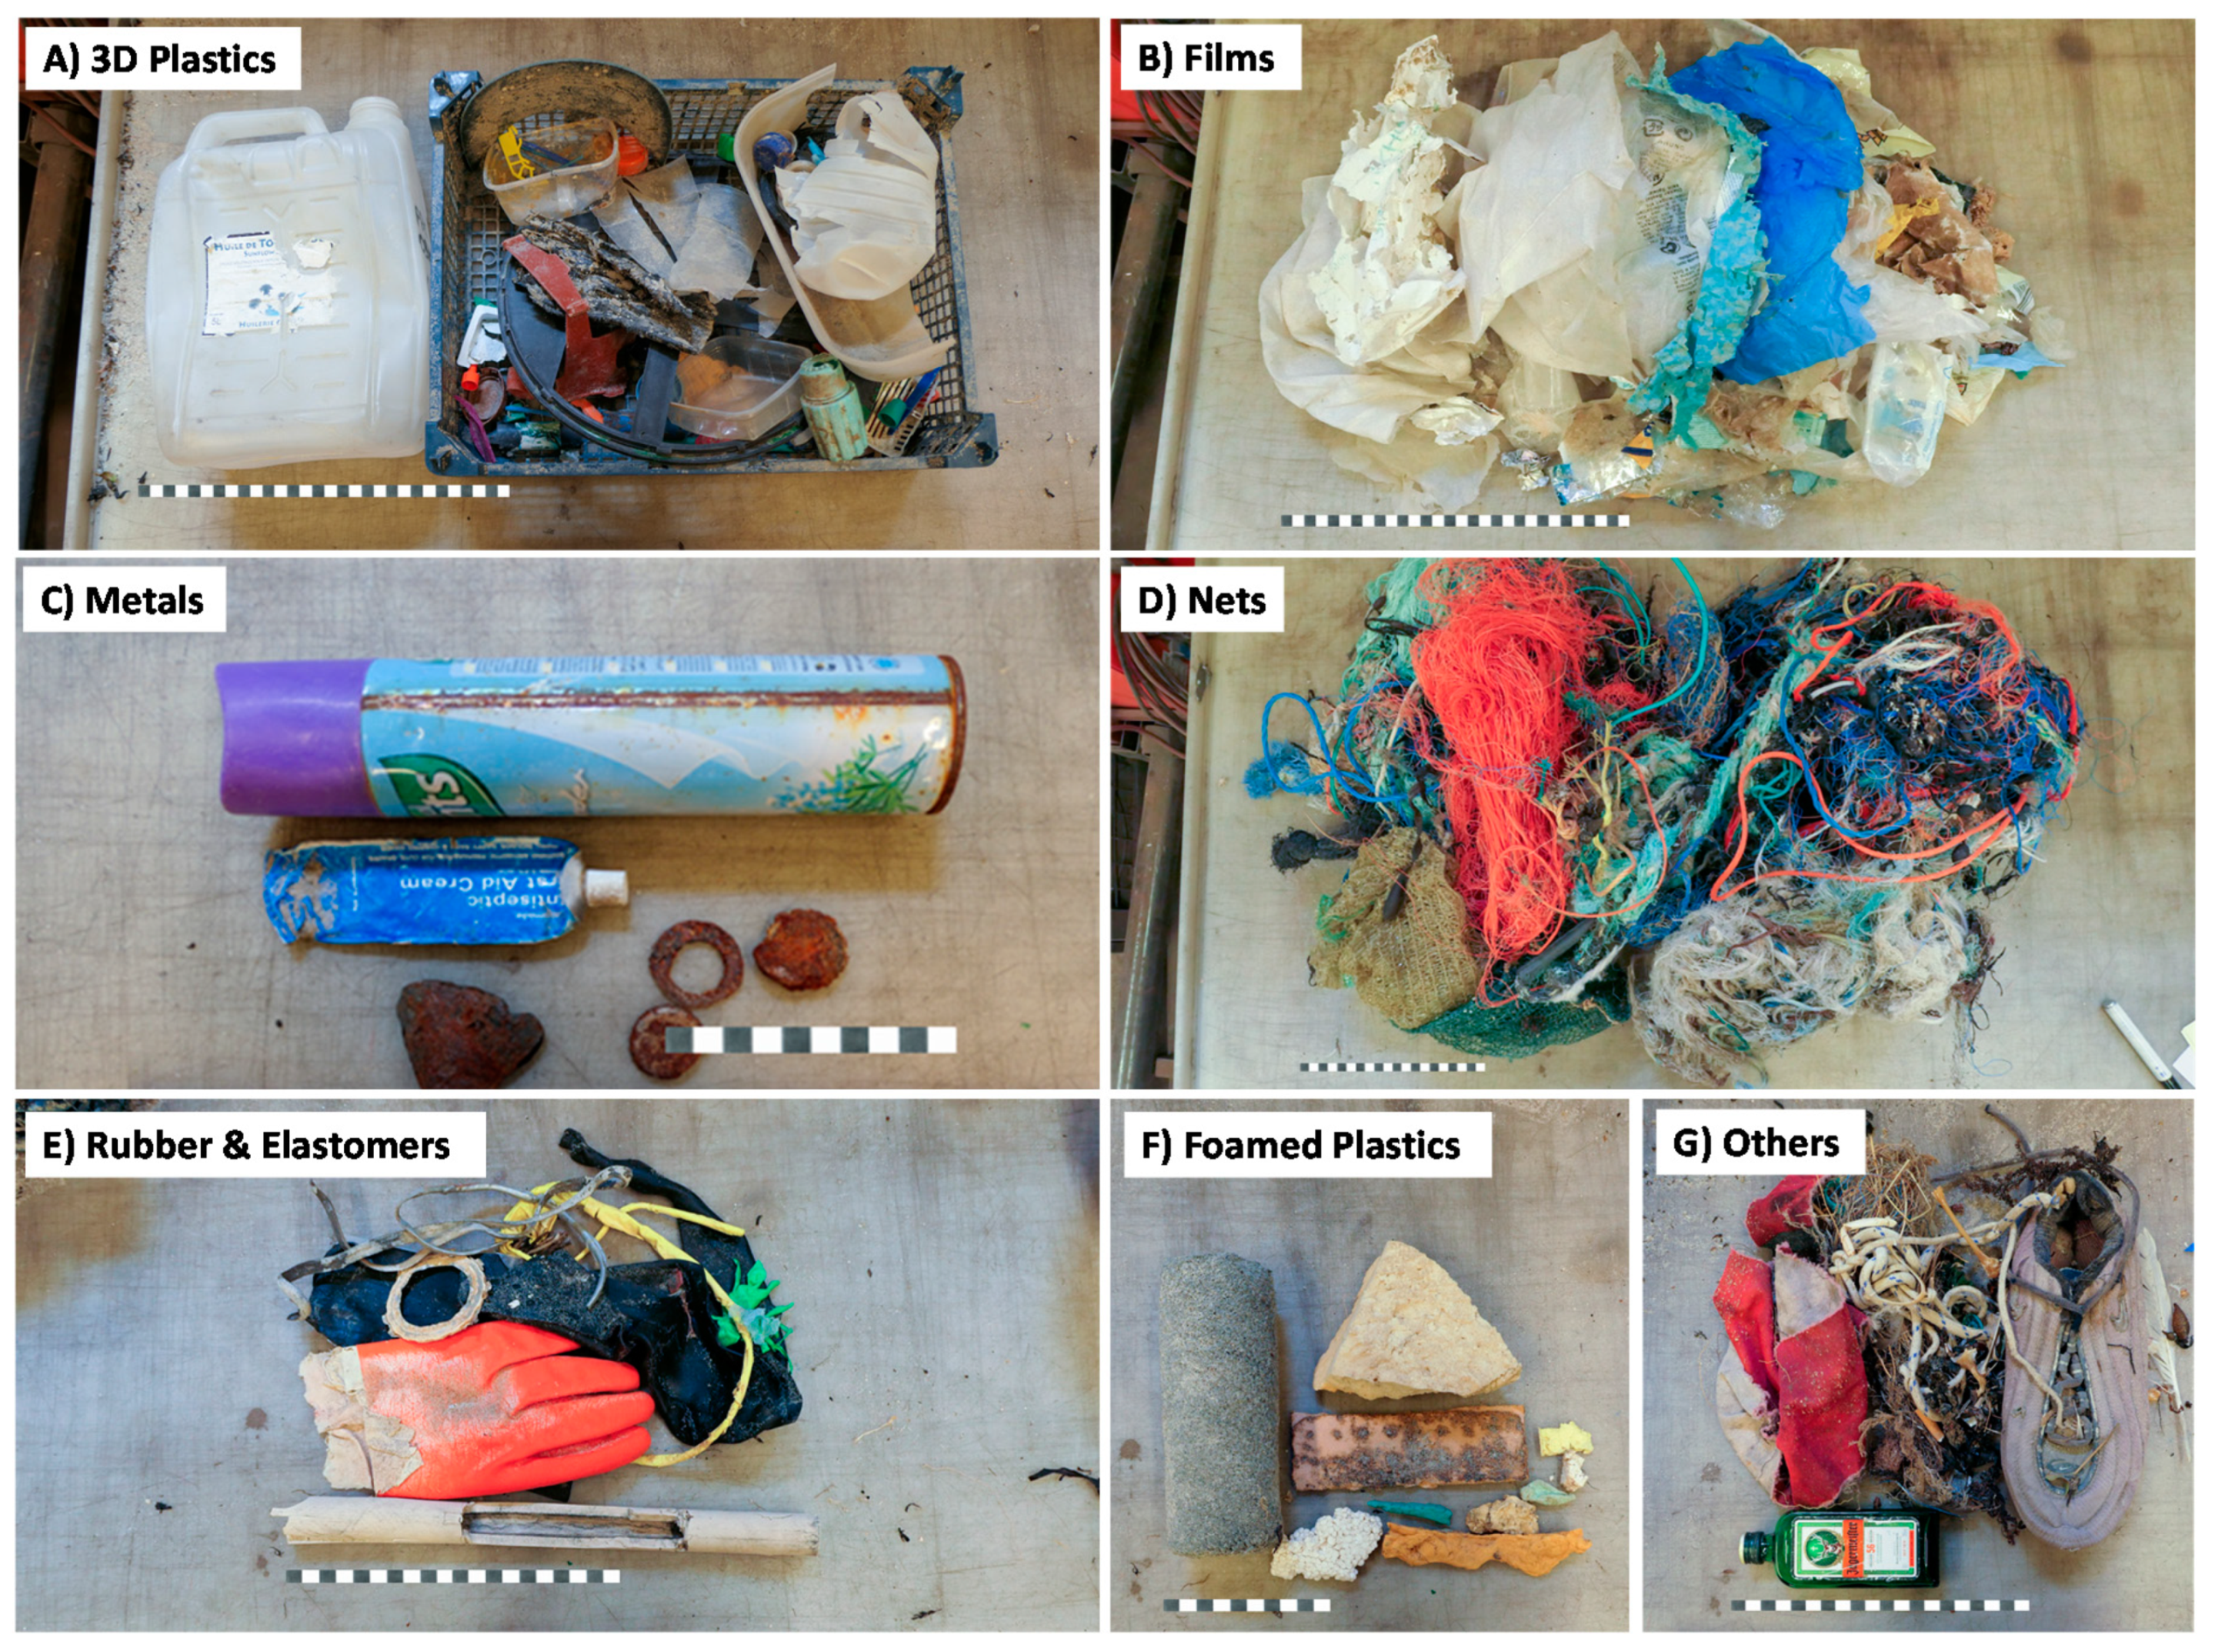
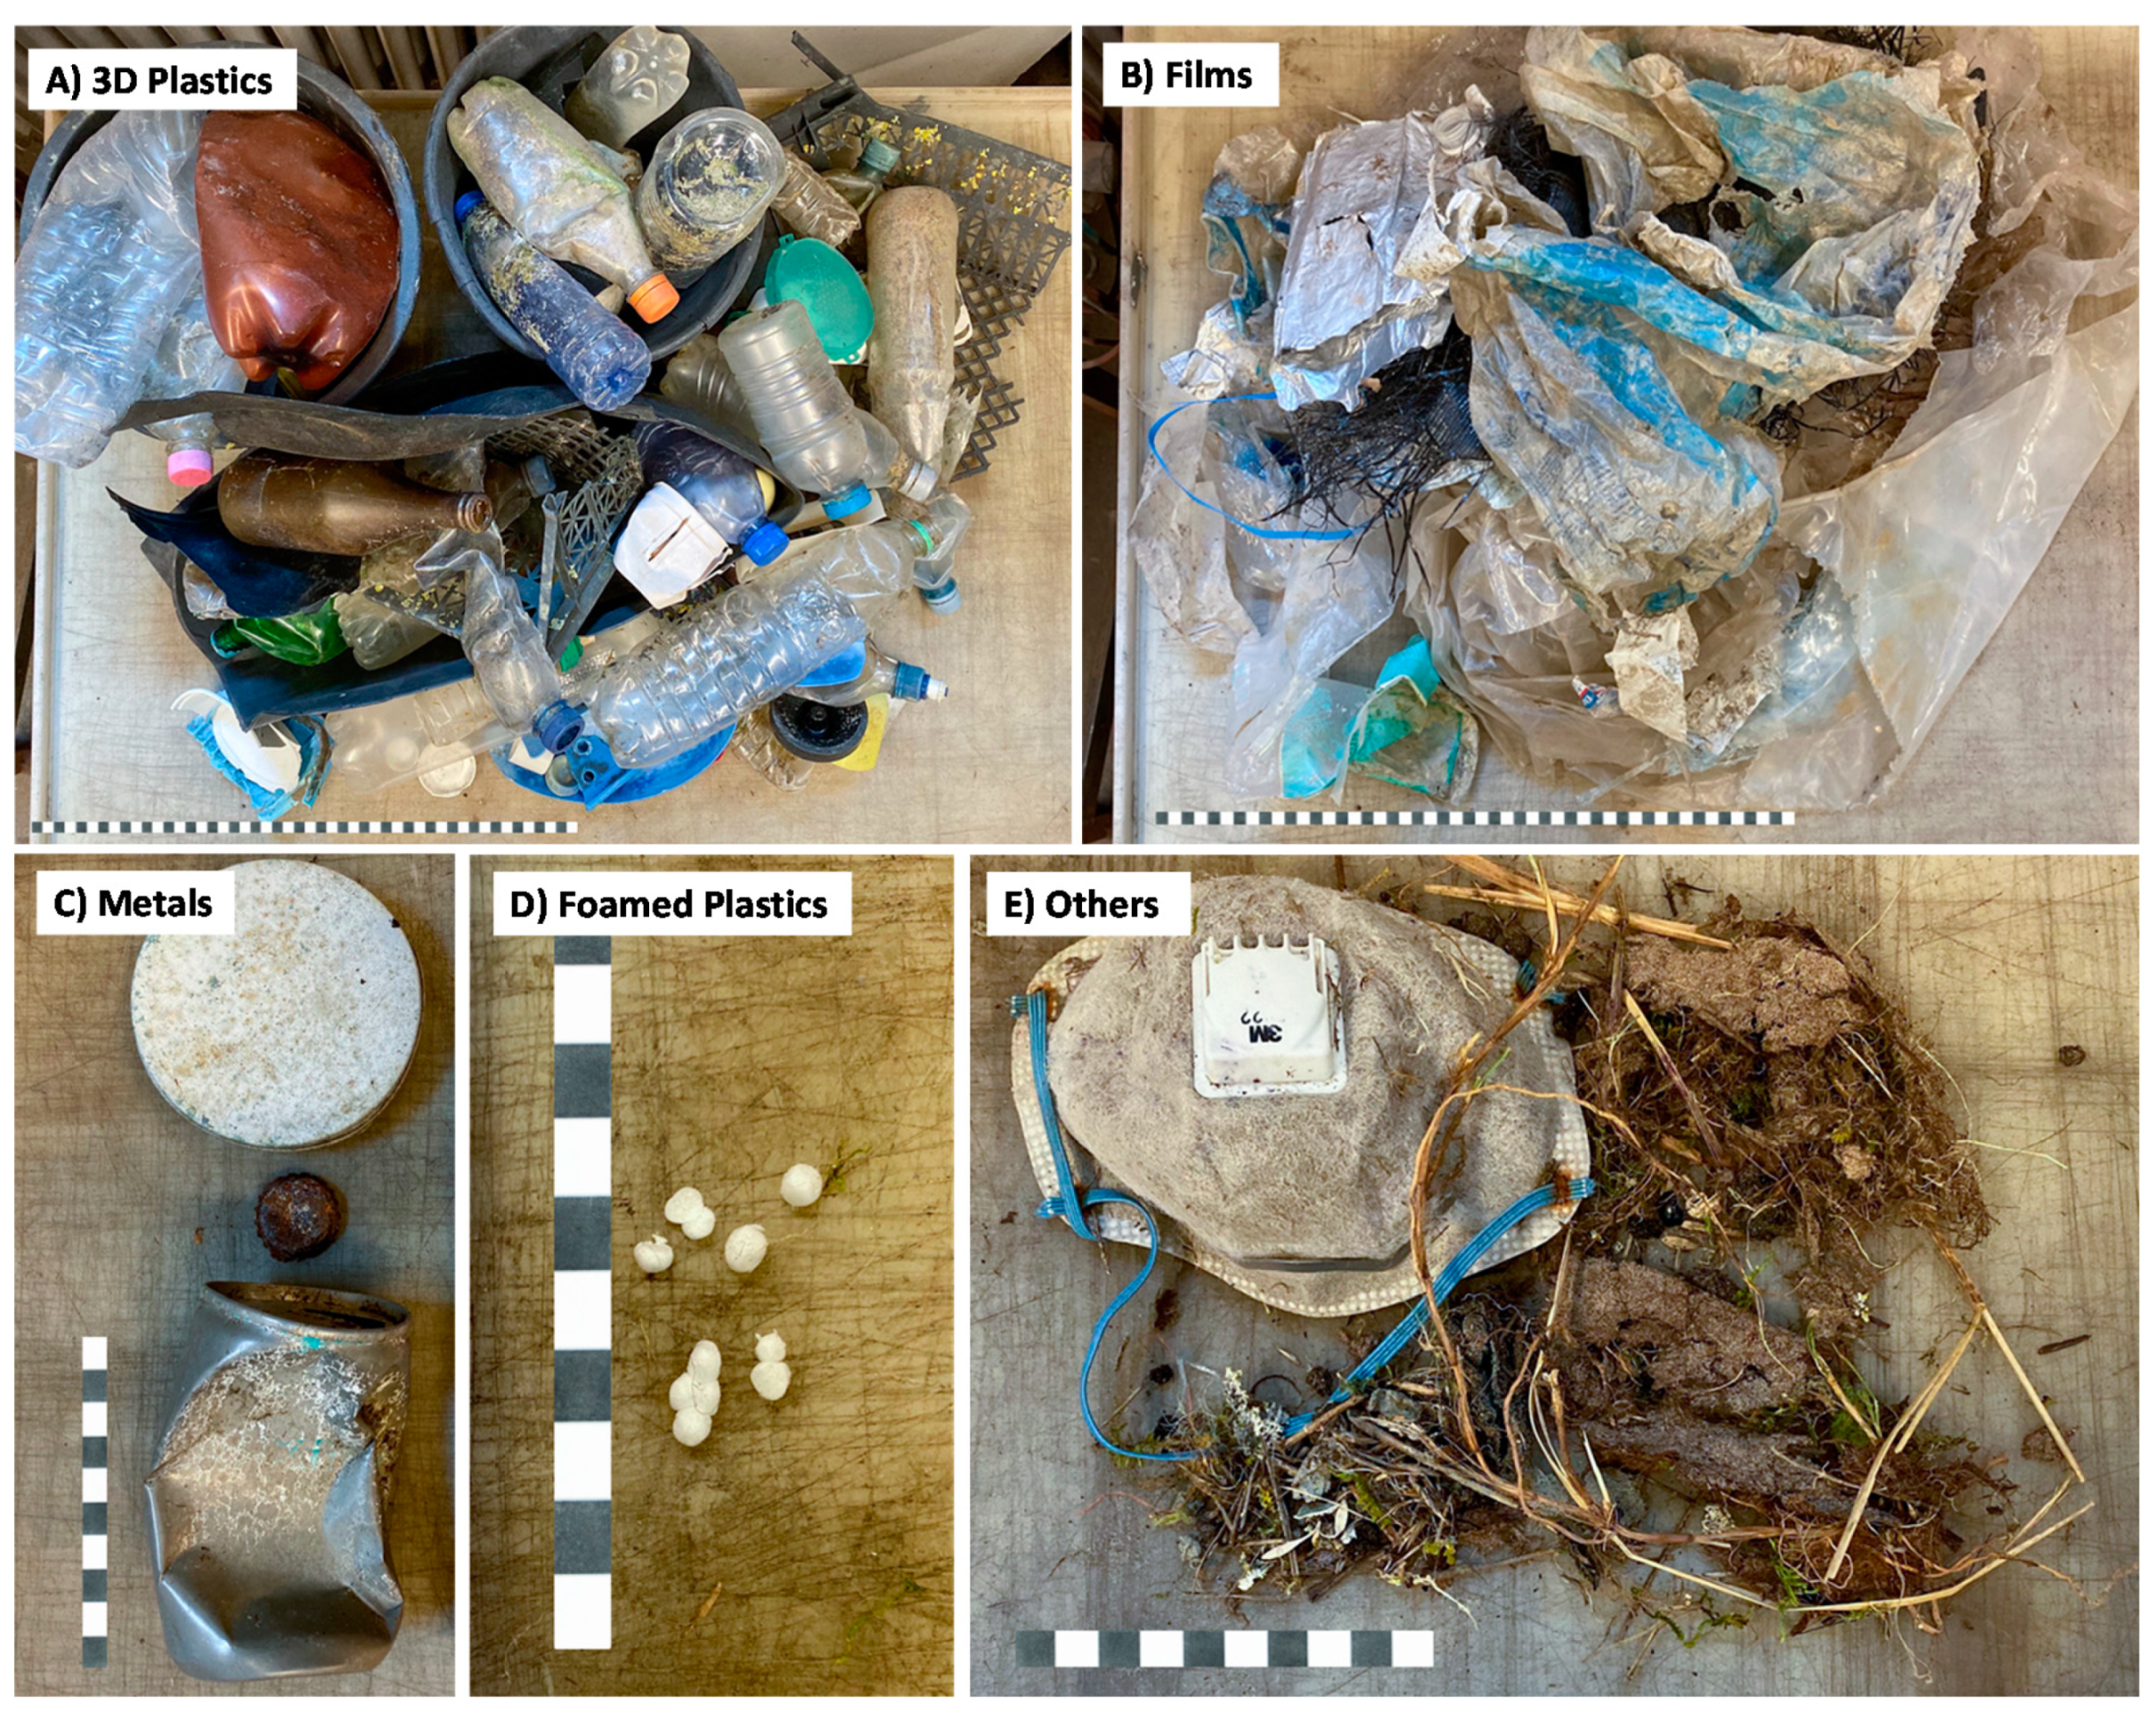
2.1. Material Composition According to Material Group Catalogue
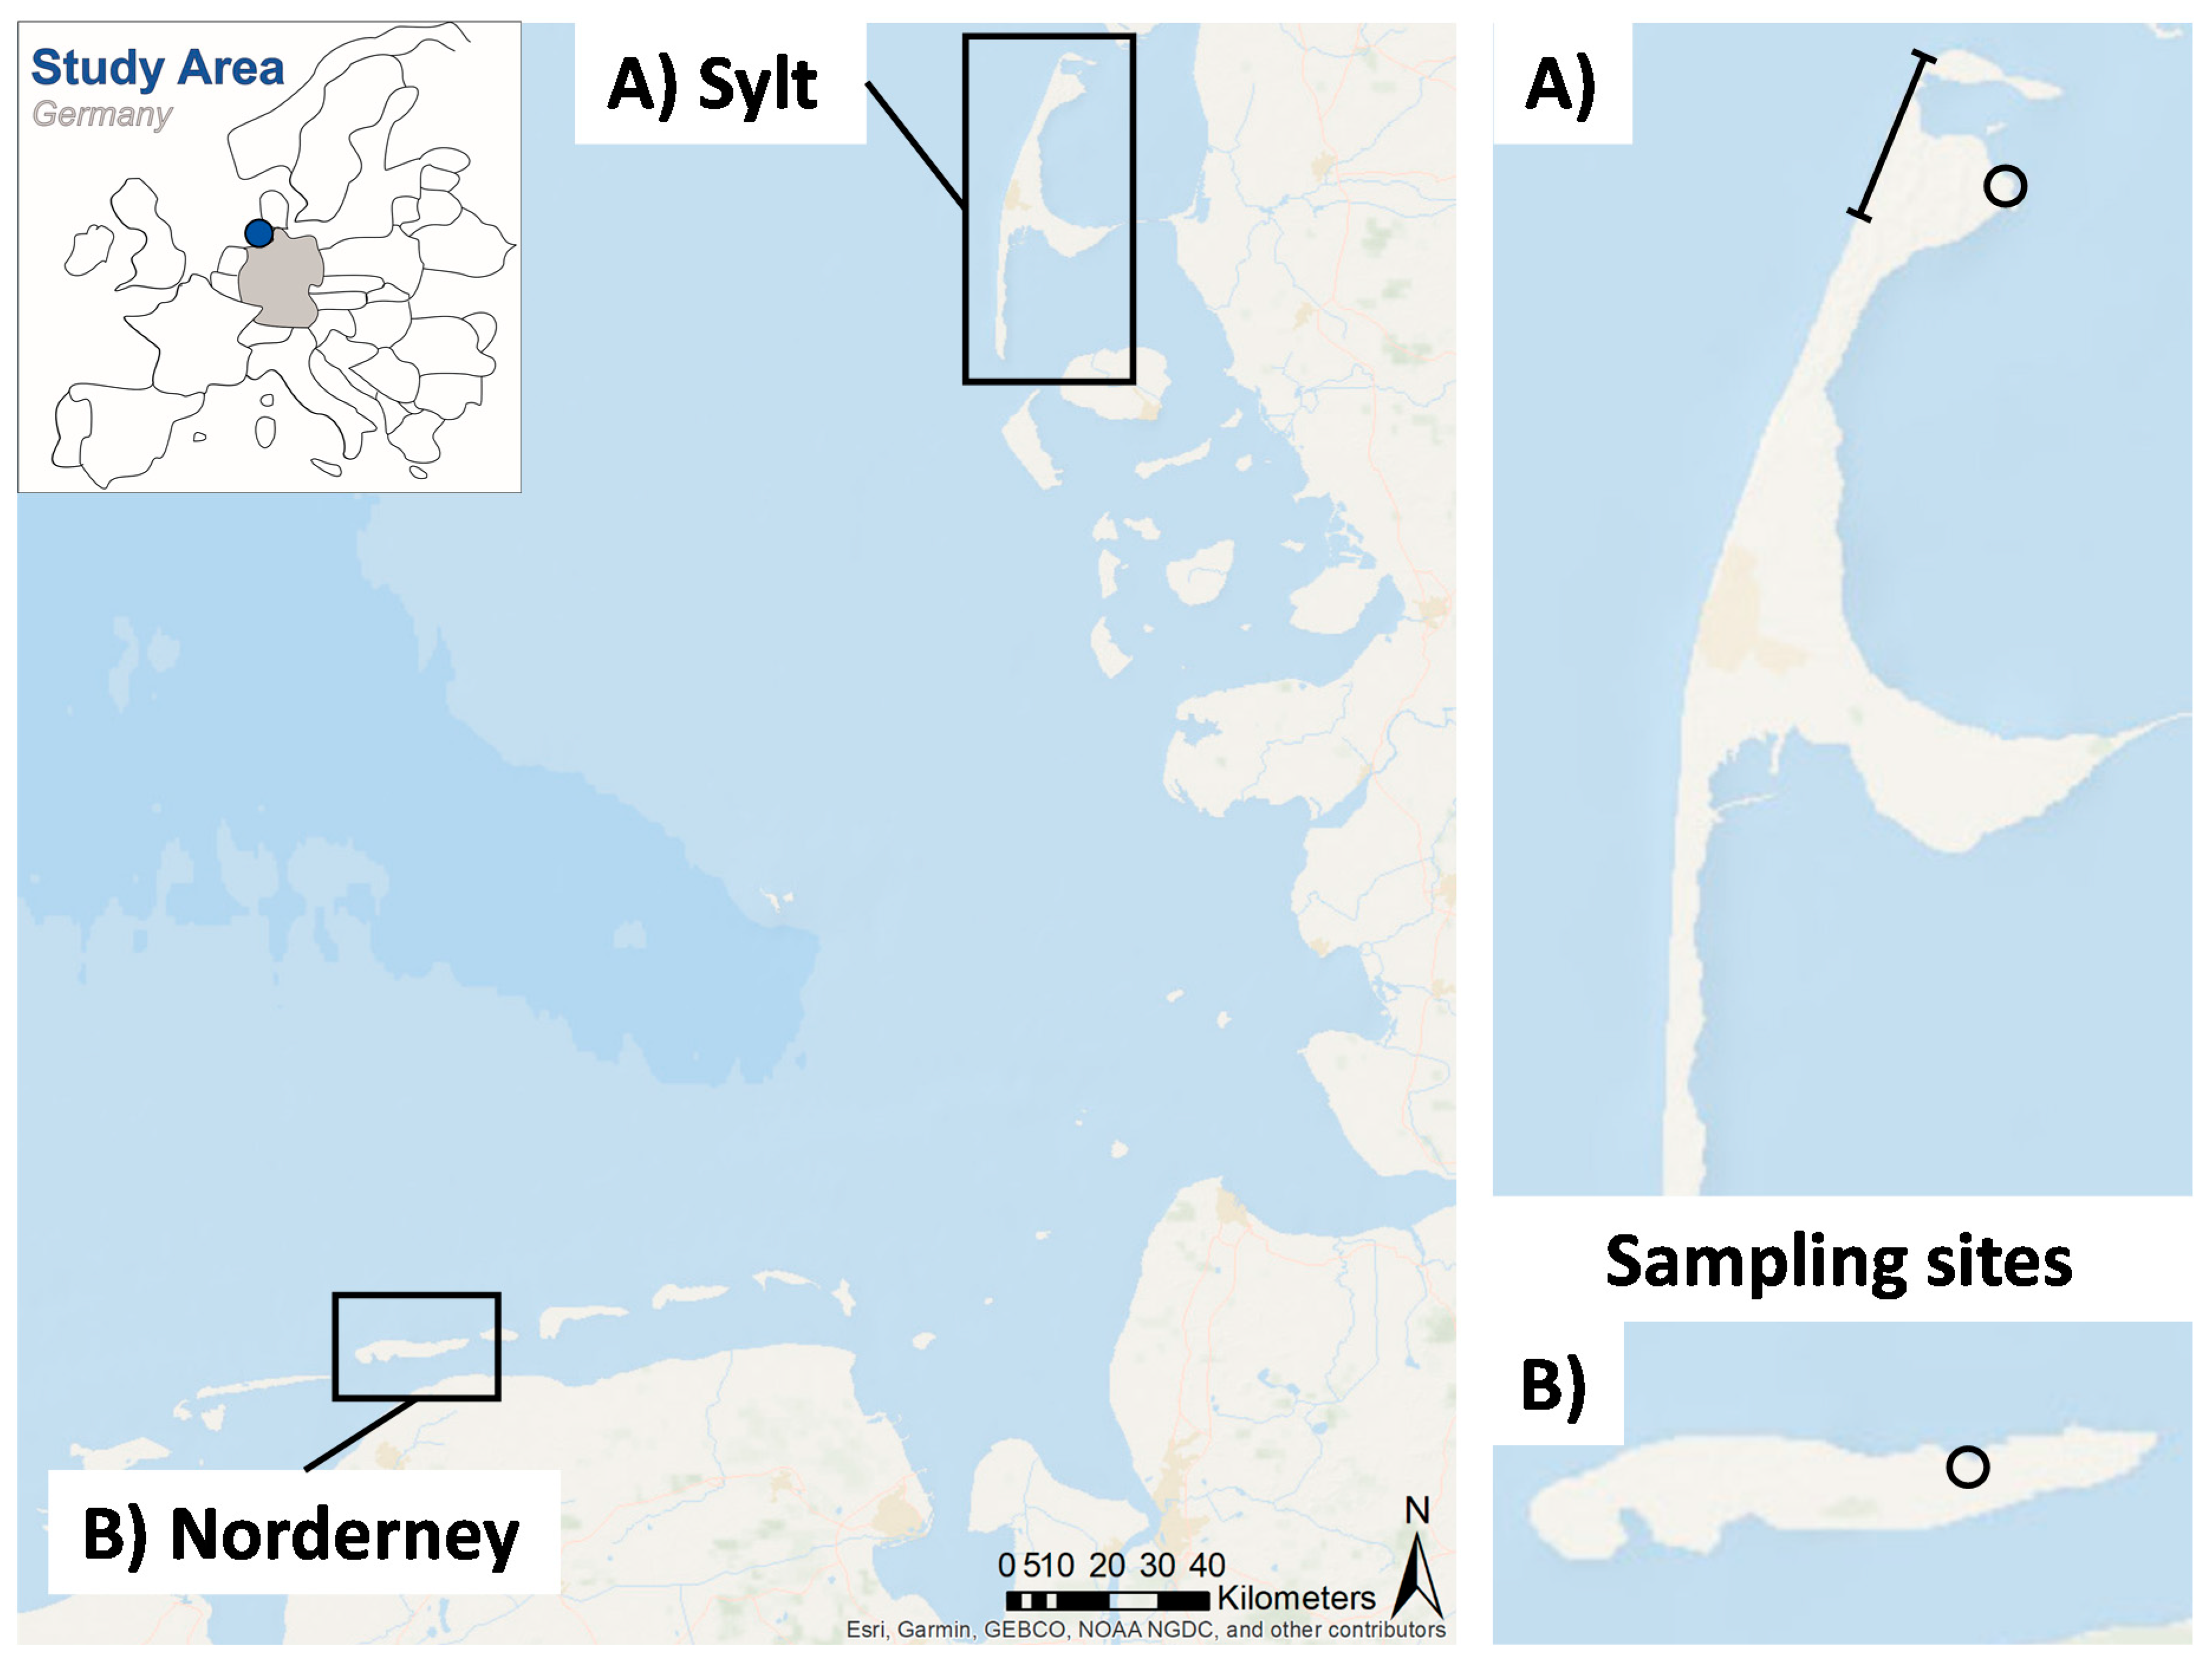
2.2. ML Sylt
2.3. ML Norderney
2.4. Selection of A Comparative Material
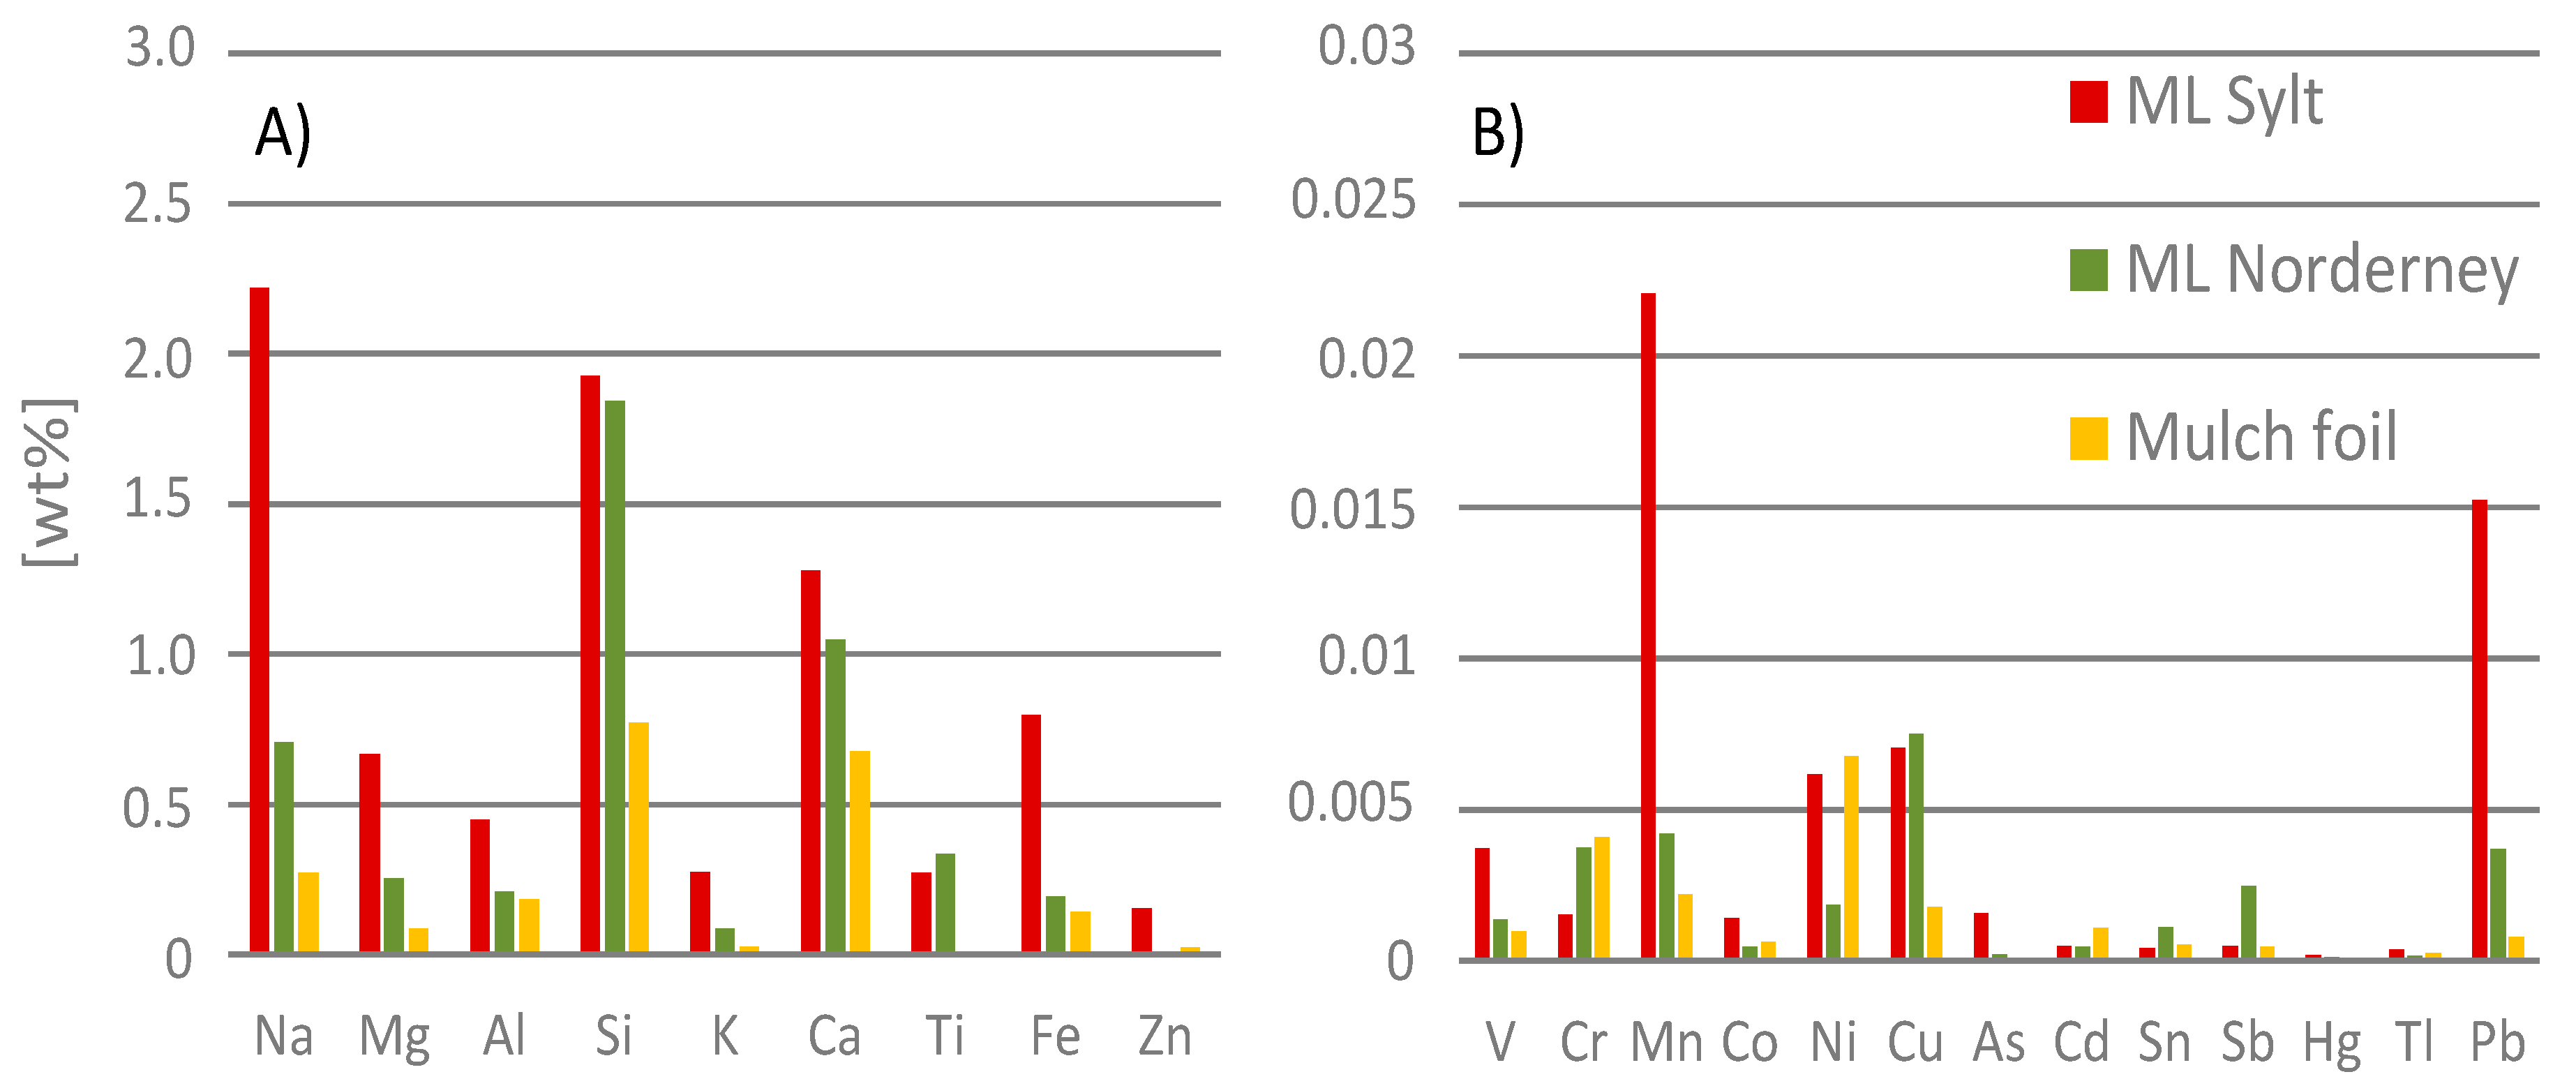
2.5. Chemical Composition of Material Samples
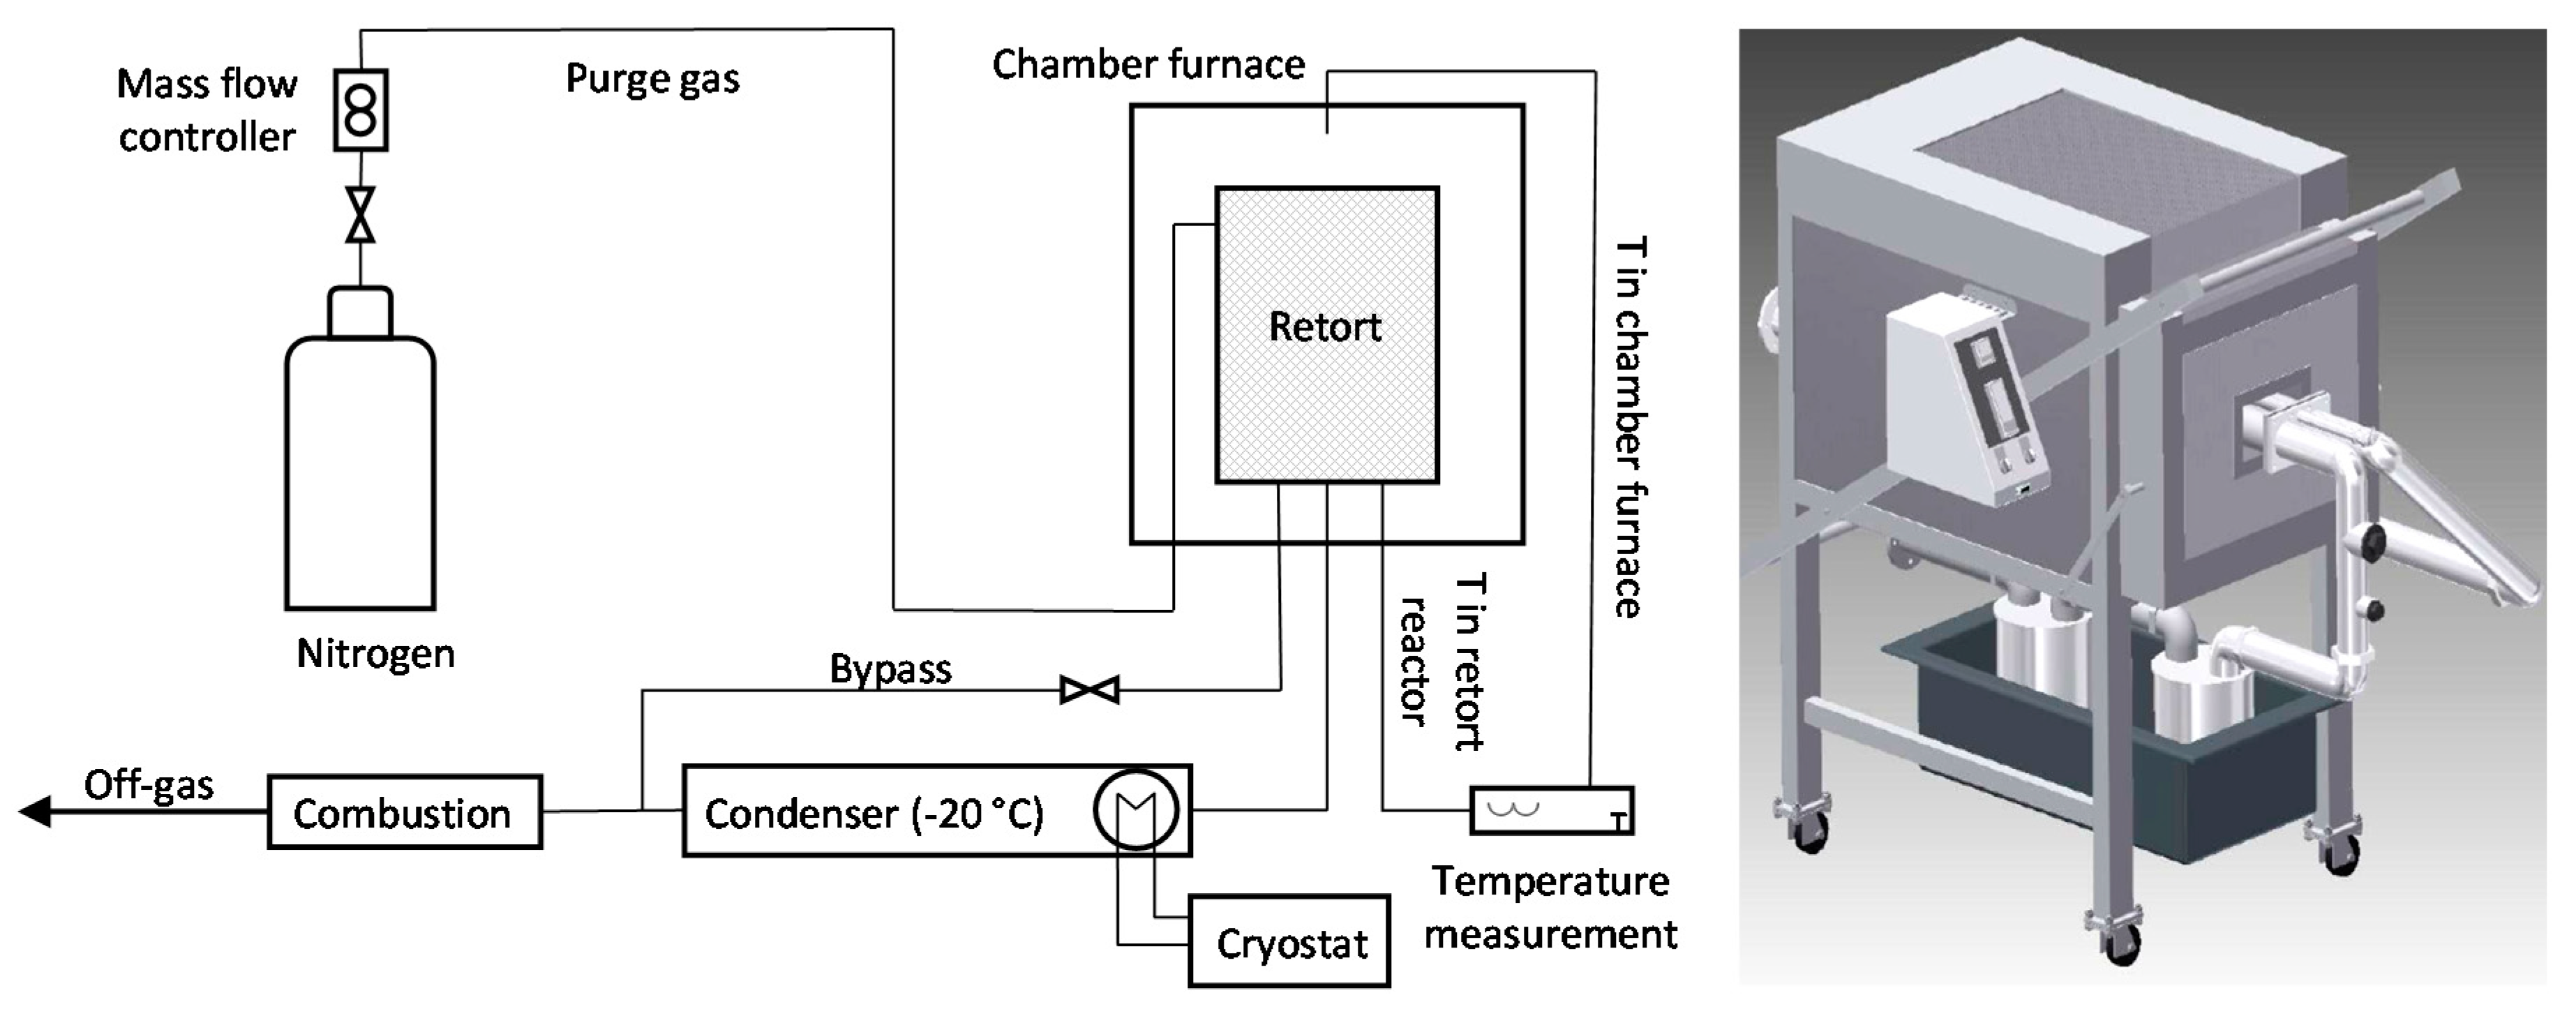
2.6. Experimental Setup
2.7. Biotechnological Upcycling
- The hydrophobic condensate must be introduced into the microbial liquid culture in such a way that the microbes are able to access and use it as carbon source. Some microbes naturally produce biosurfactants to gain access to hydrophobic substrates. To improve substrate uptake, bioavailability can be increased by the targeted application of biosurfactants such as rhamnolipids [20]. With increased organic phase surface, the mass transfer into the water phase or directly to microbes increases, allowing increased conversion rates.
- In the next step, the microbe must be able to transfer the molecule into the cell, while the cell wall normally serves as a barrier for hydrophobic compounds. Therefore, the microbe must possess transporters supporting this transfer such as an alkL pore in the outer cell membrane of some alkane-degrading Pseudomonas [22].
- After uptake of the hydrophobic molecules into the cell, the microbe must be equipped with biochemical pathways for their degradation. Here, the metabolic funnel of microbes allows ideally the co-consumption of alternative carbon and energy sources [23], while the use of synthetic microbial mixed-cultures are discussed, in which microbial members take-up individual degradation tasks, converting the mixed substrate source to a single product [24].
3. Results and Discussion
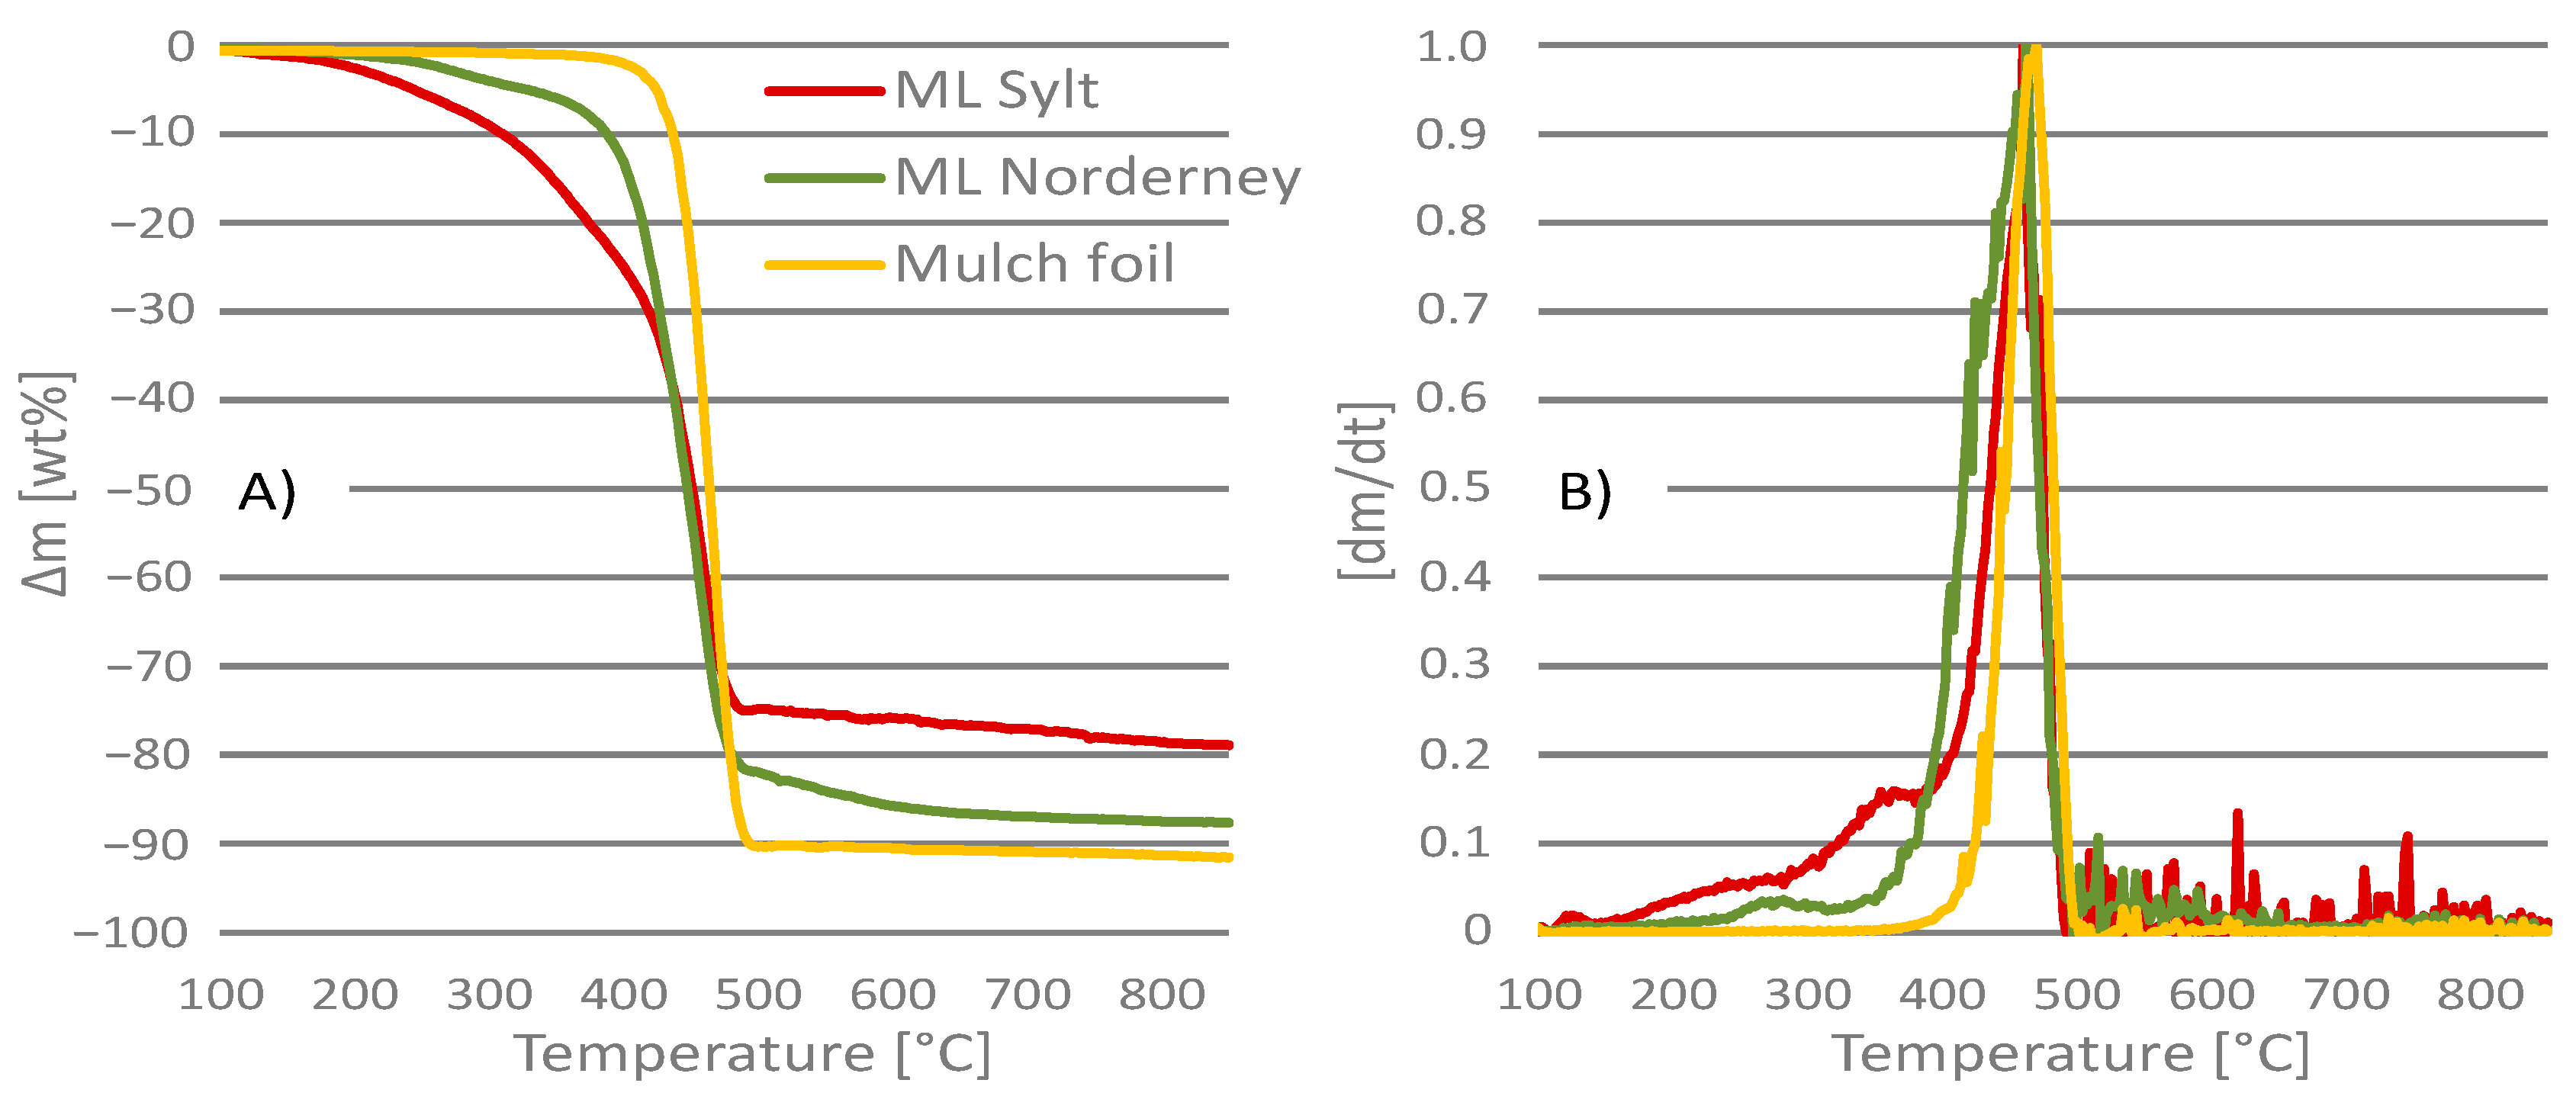
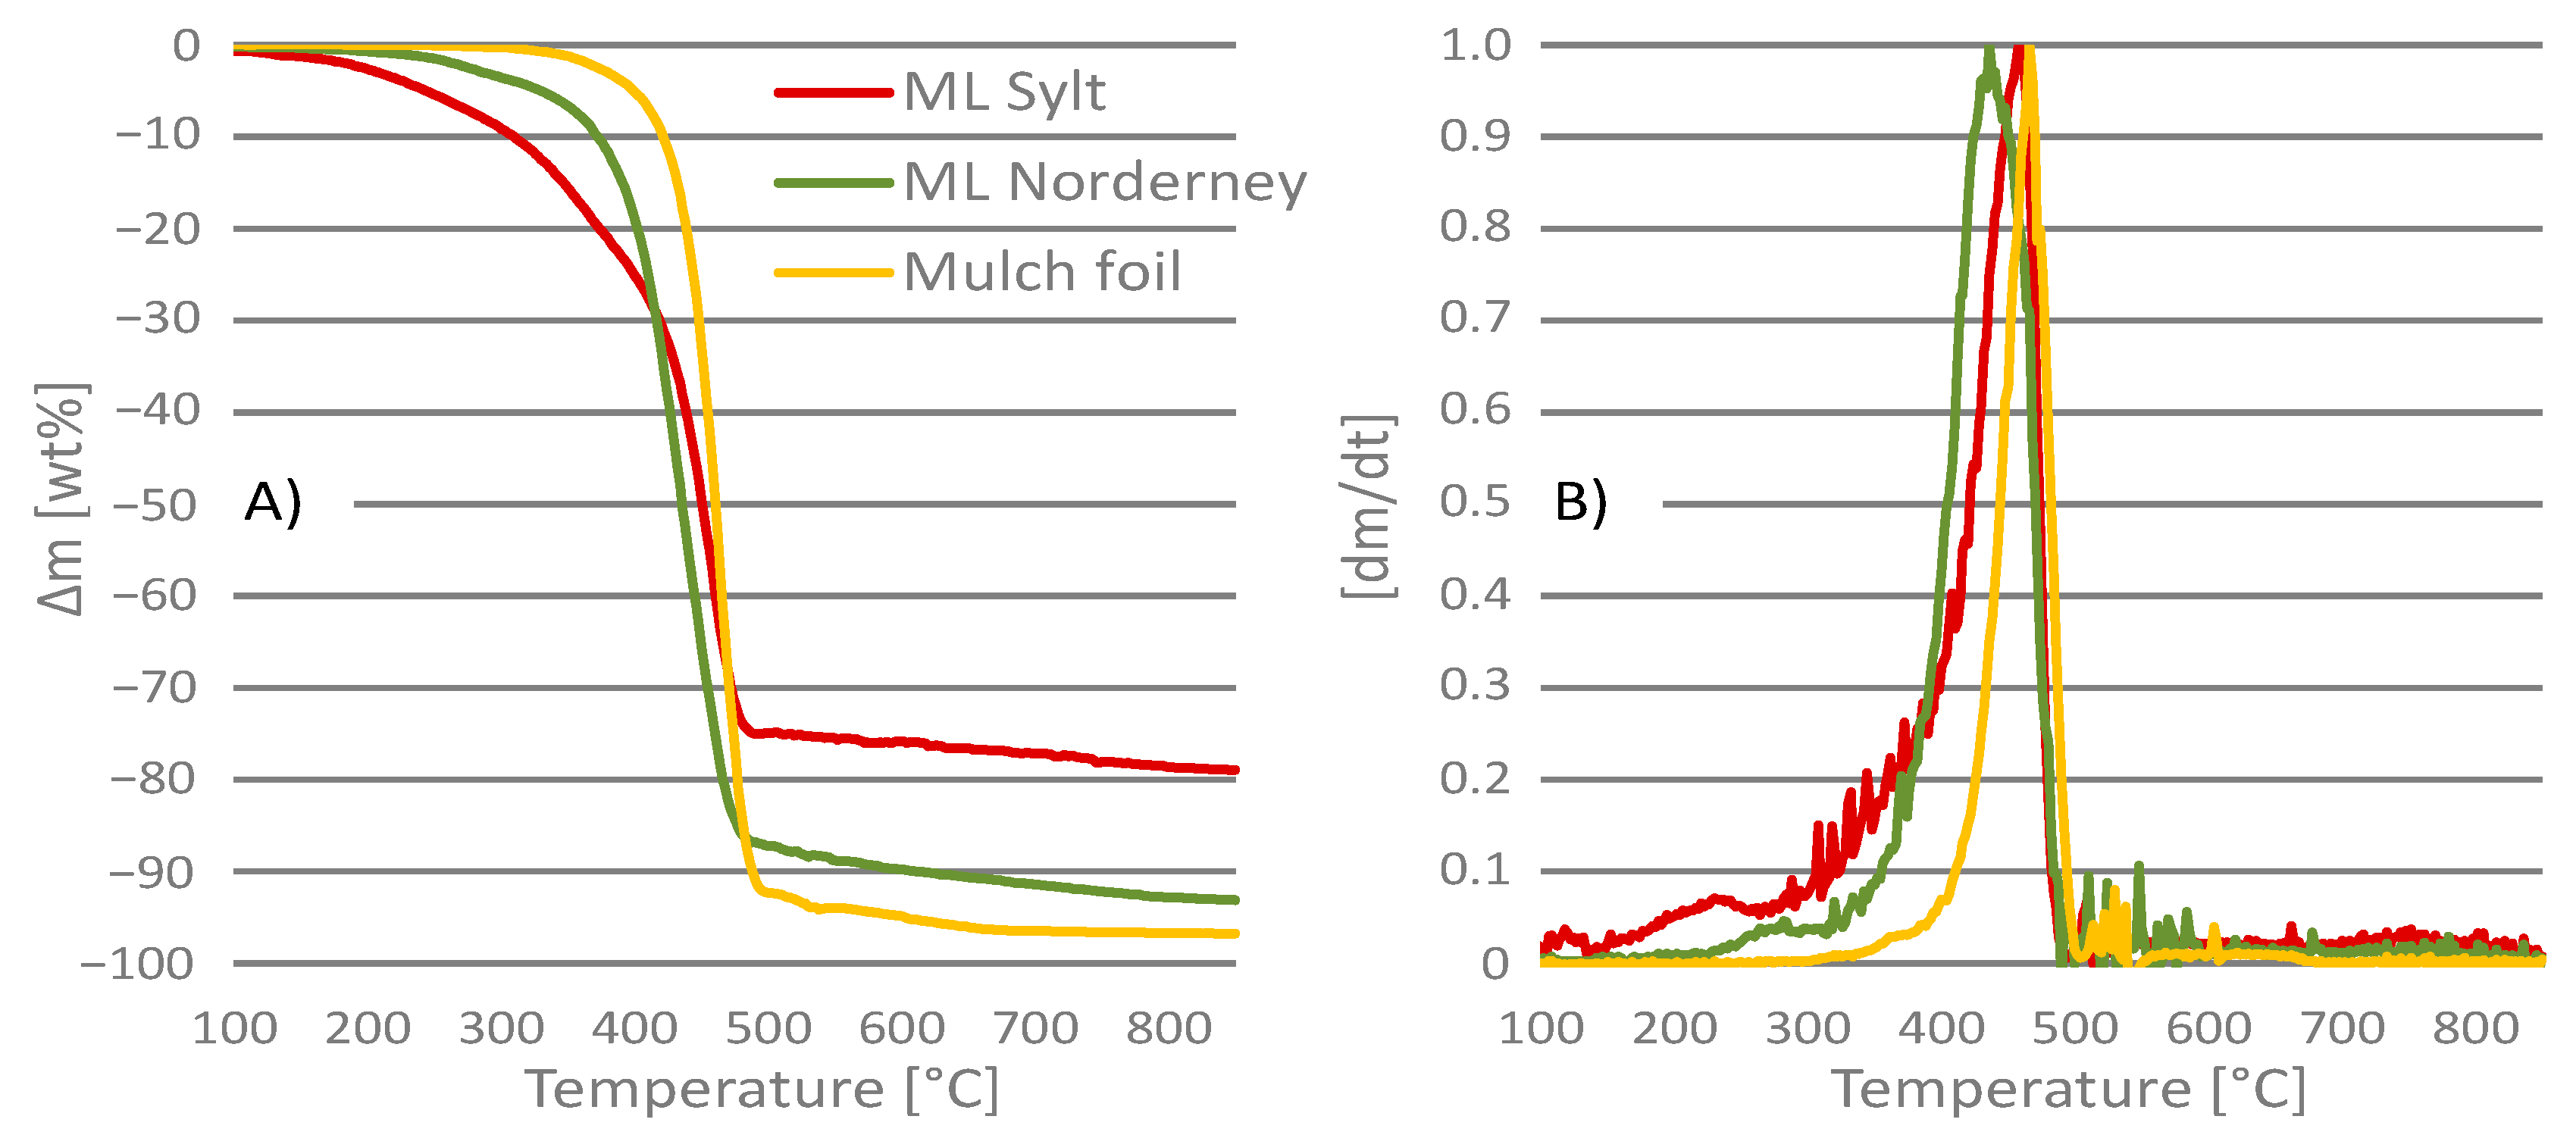
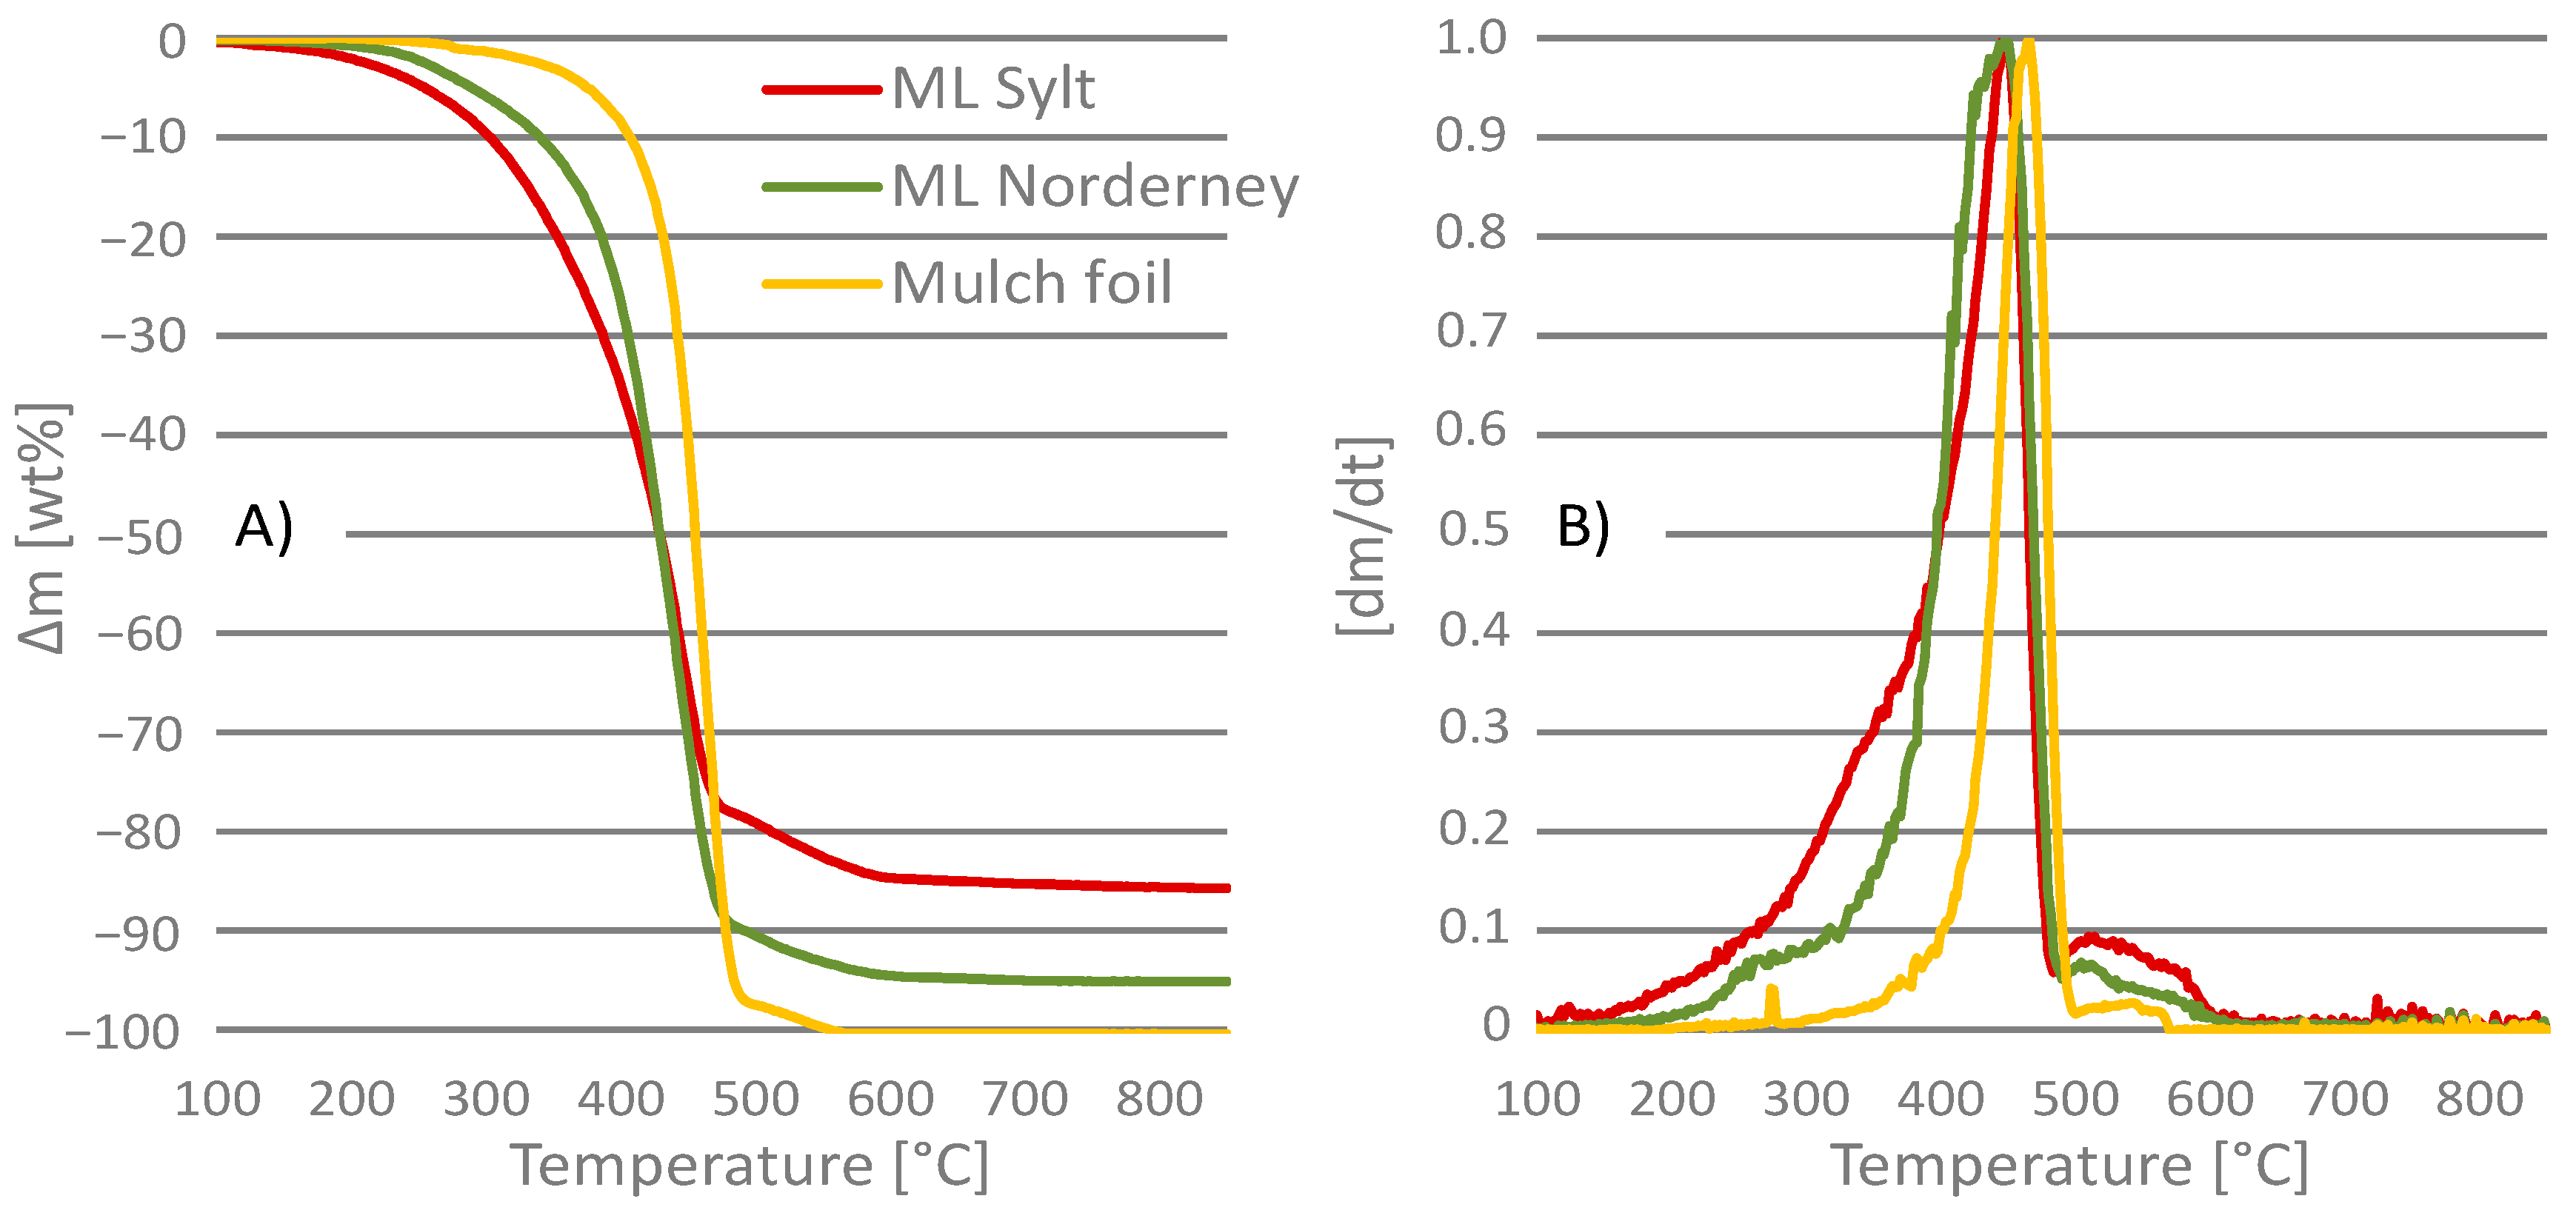
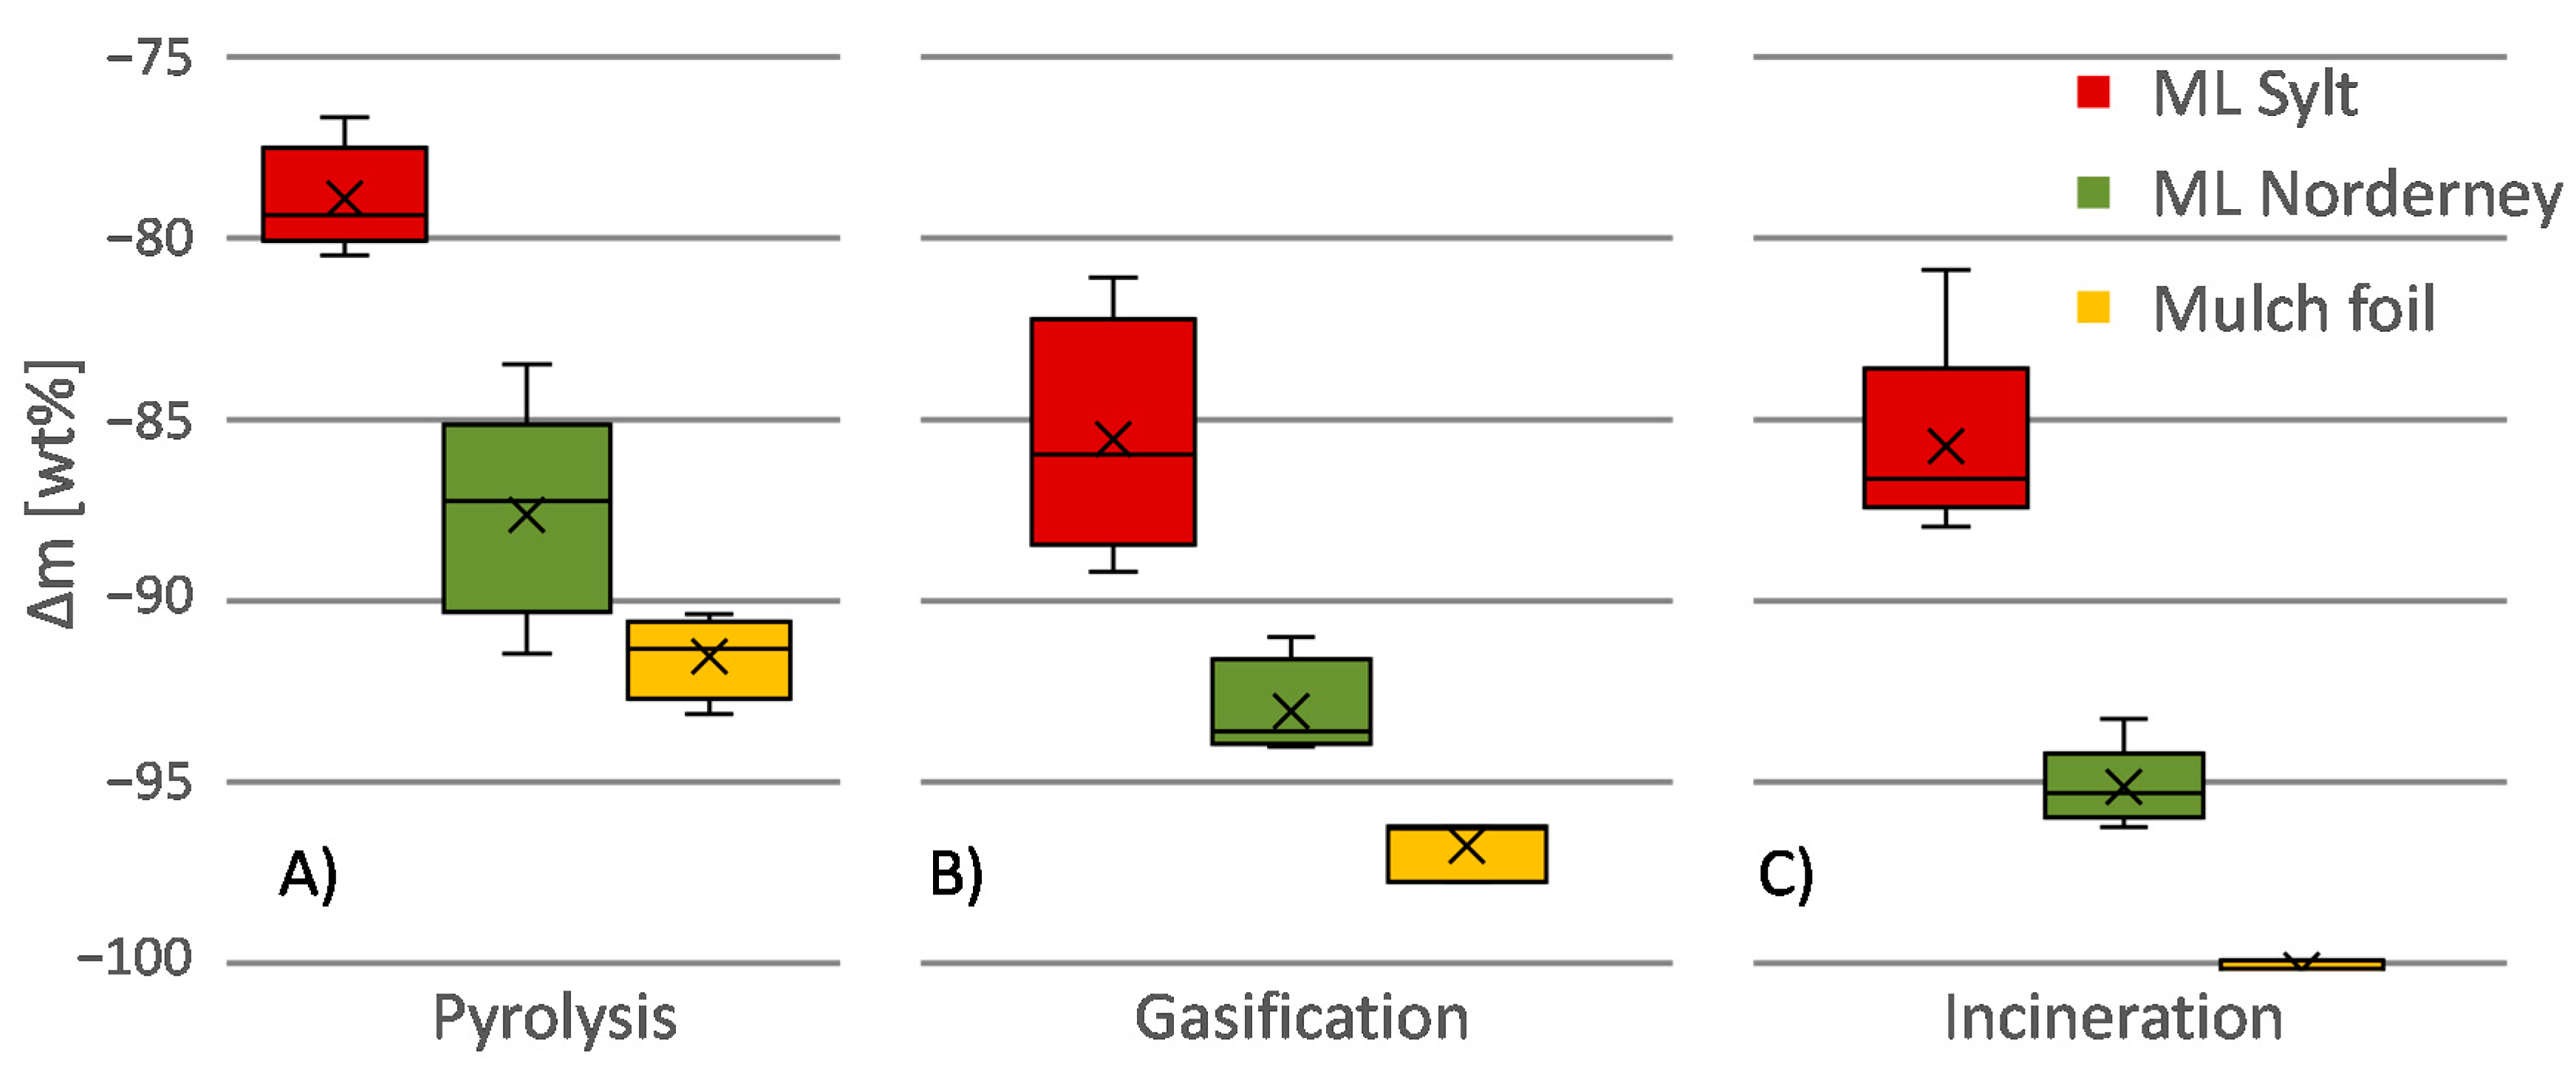
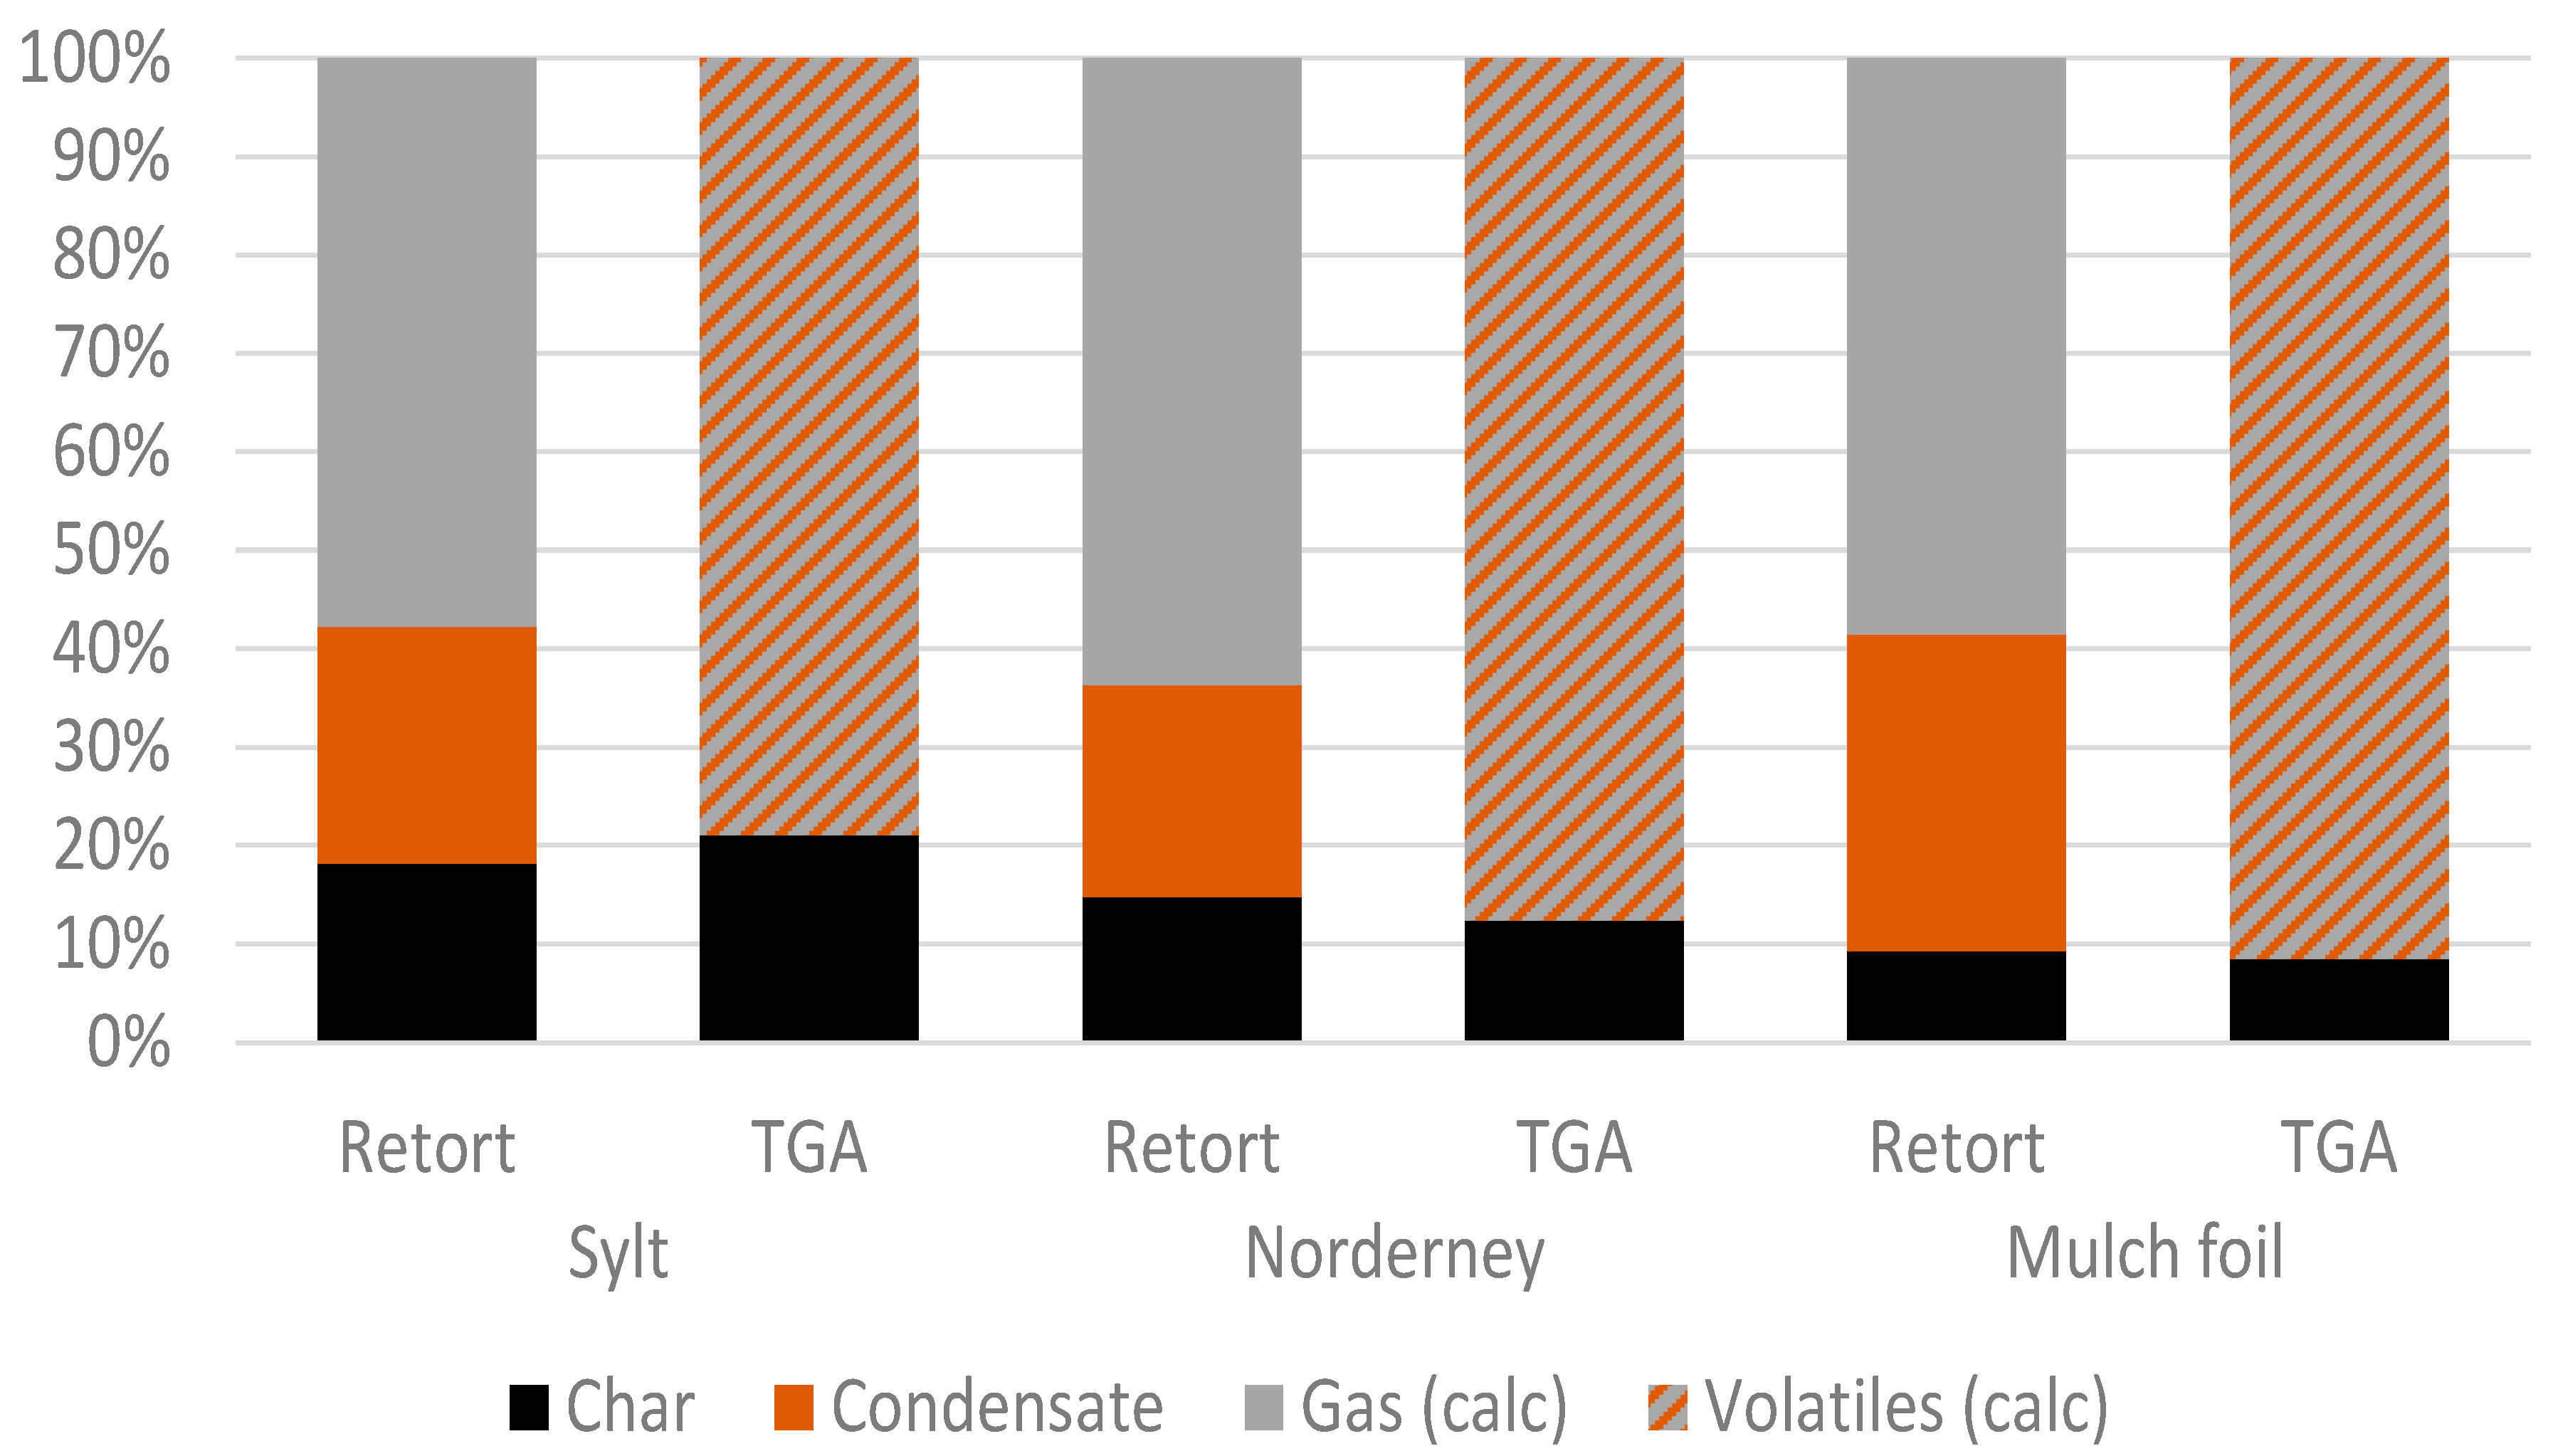
3.1. Thermogravimetric Analysis
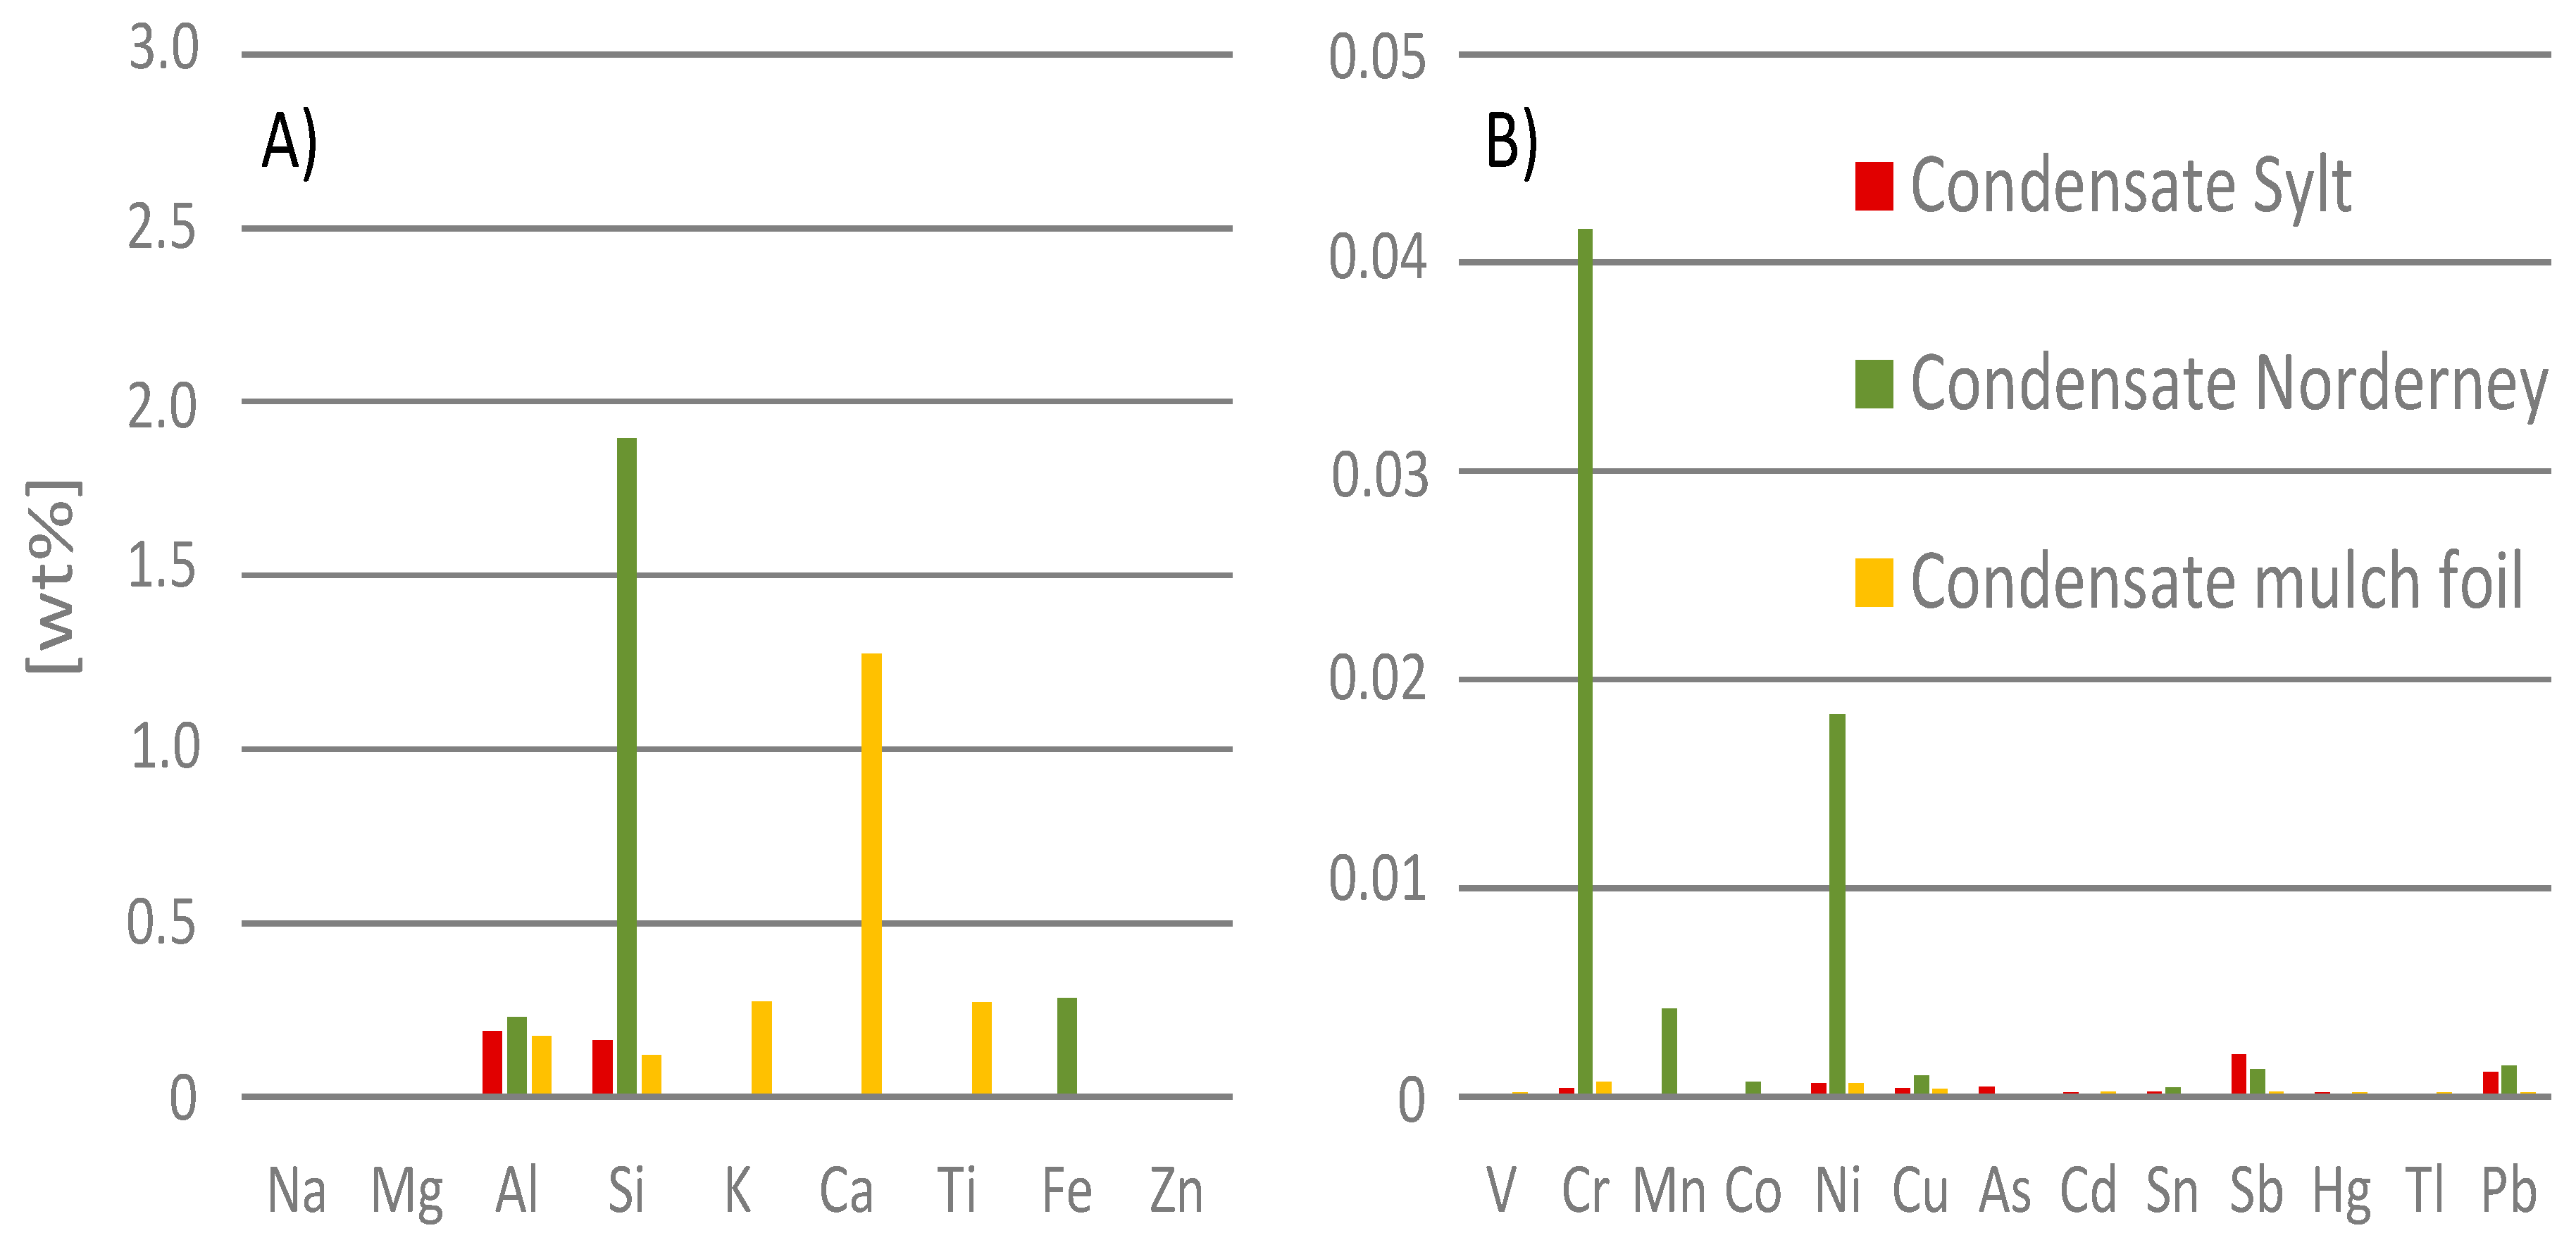
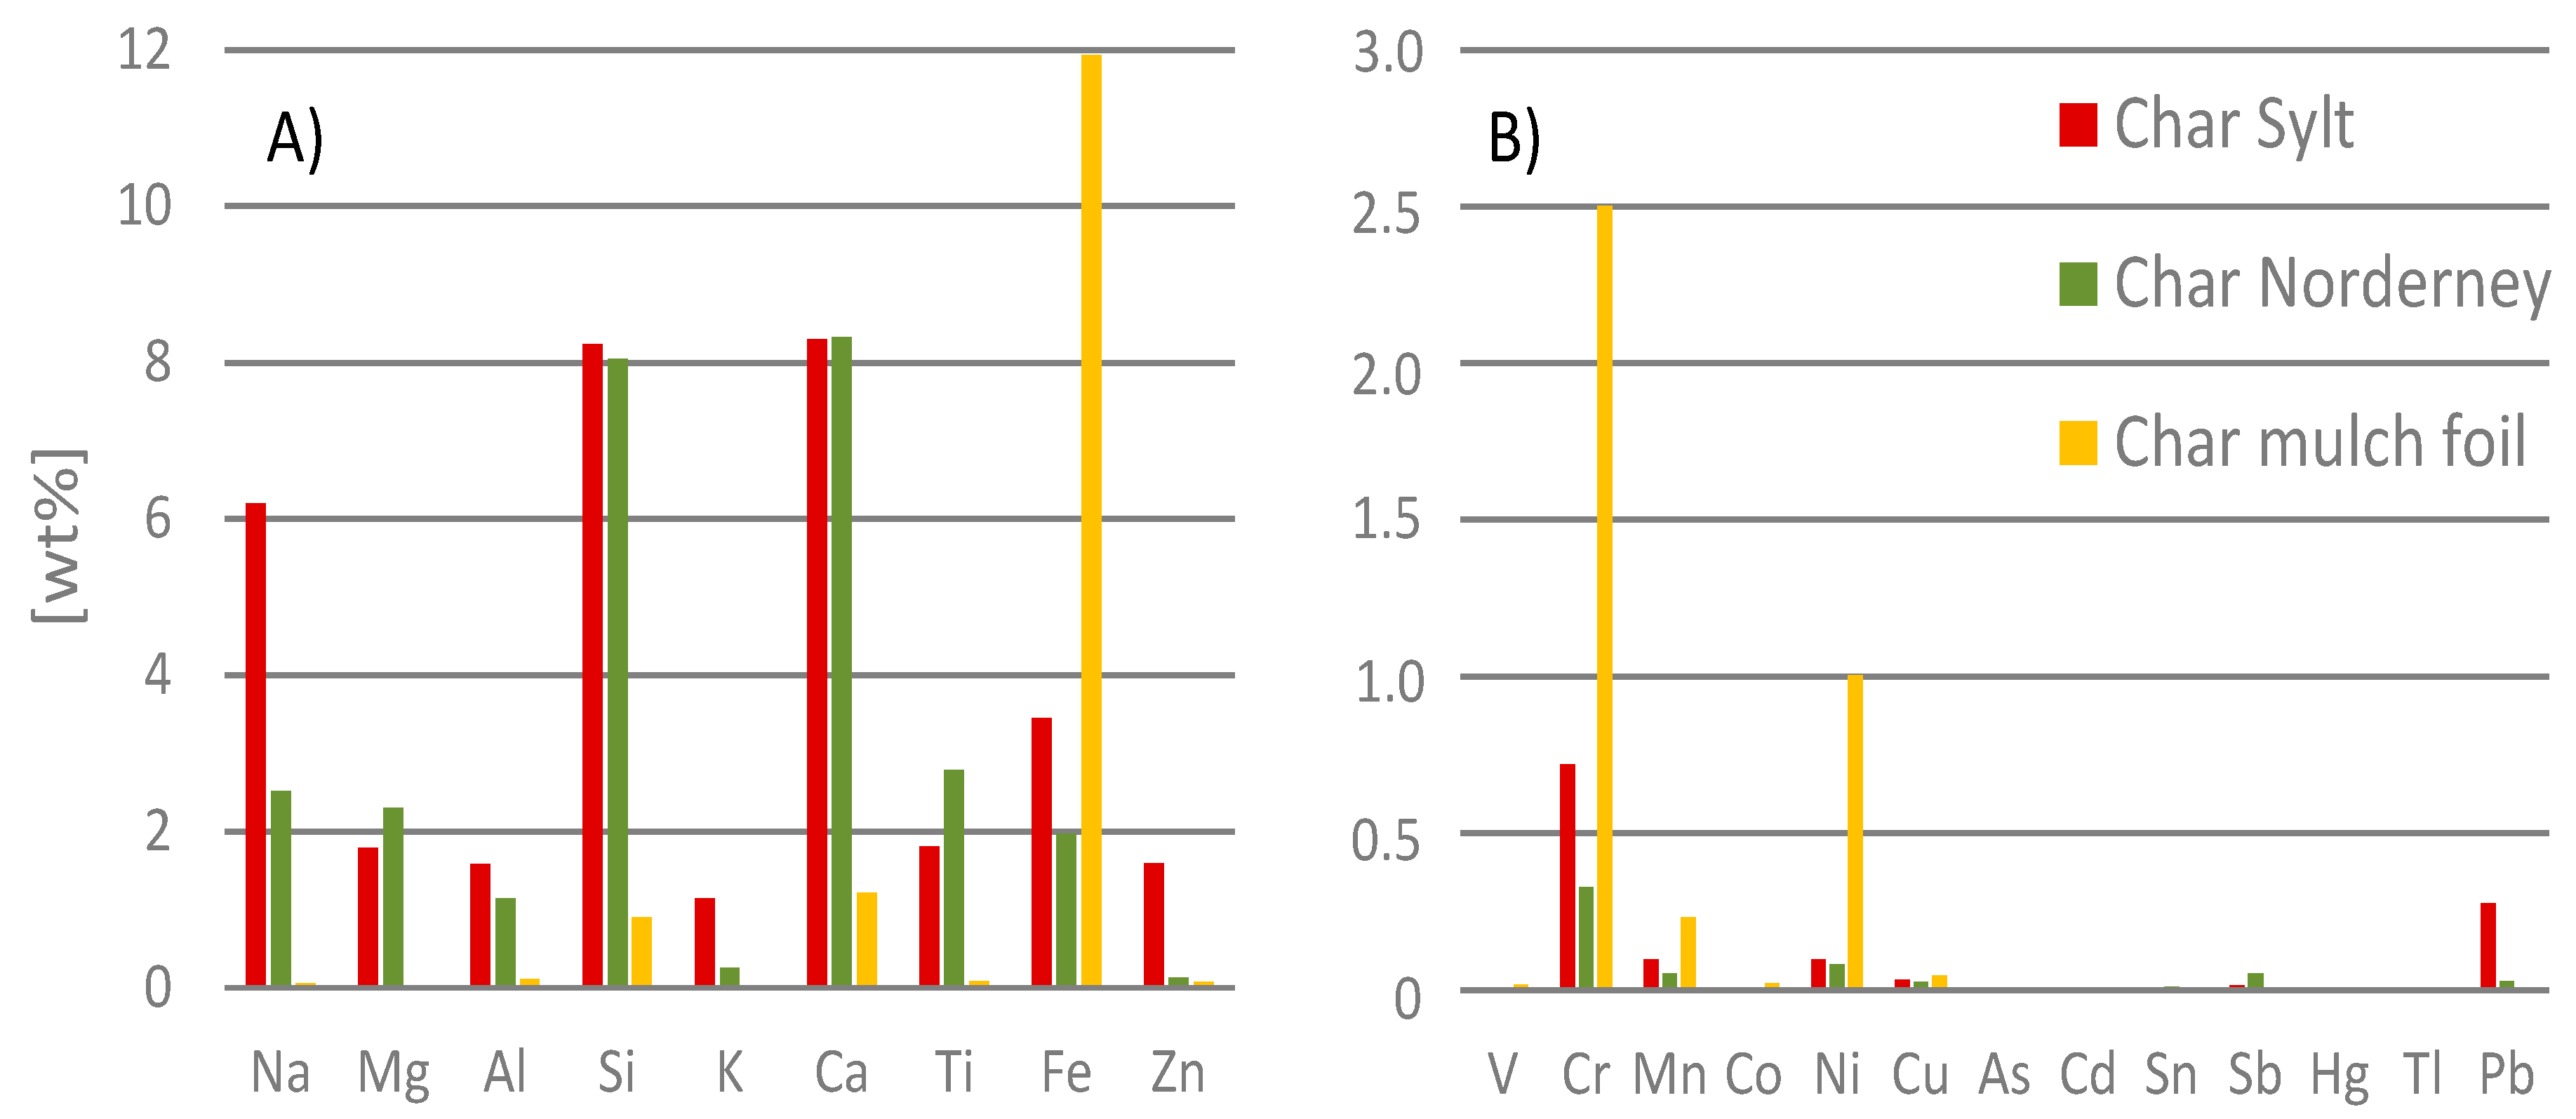
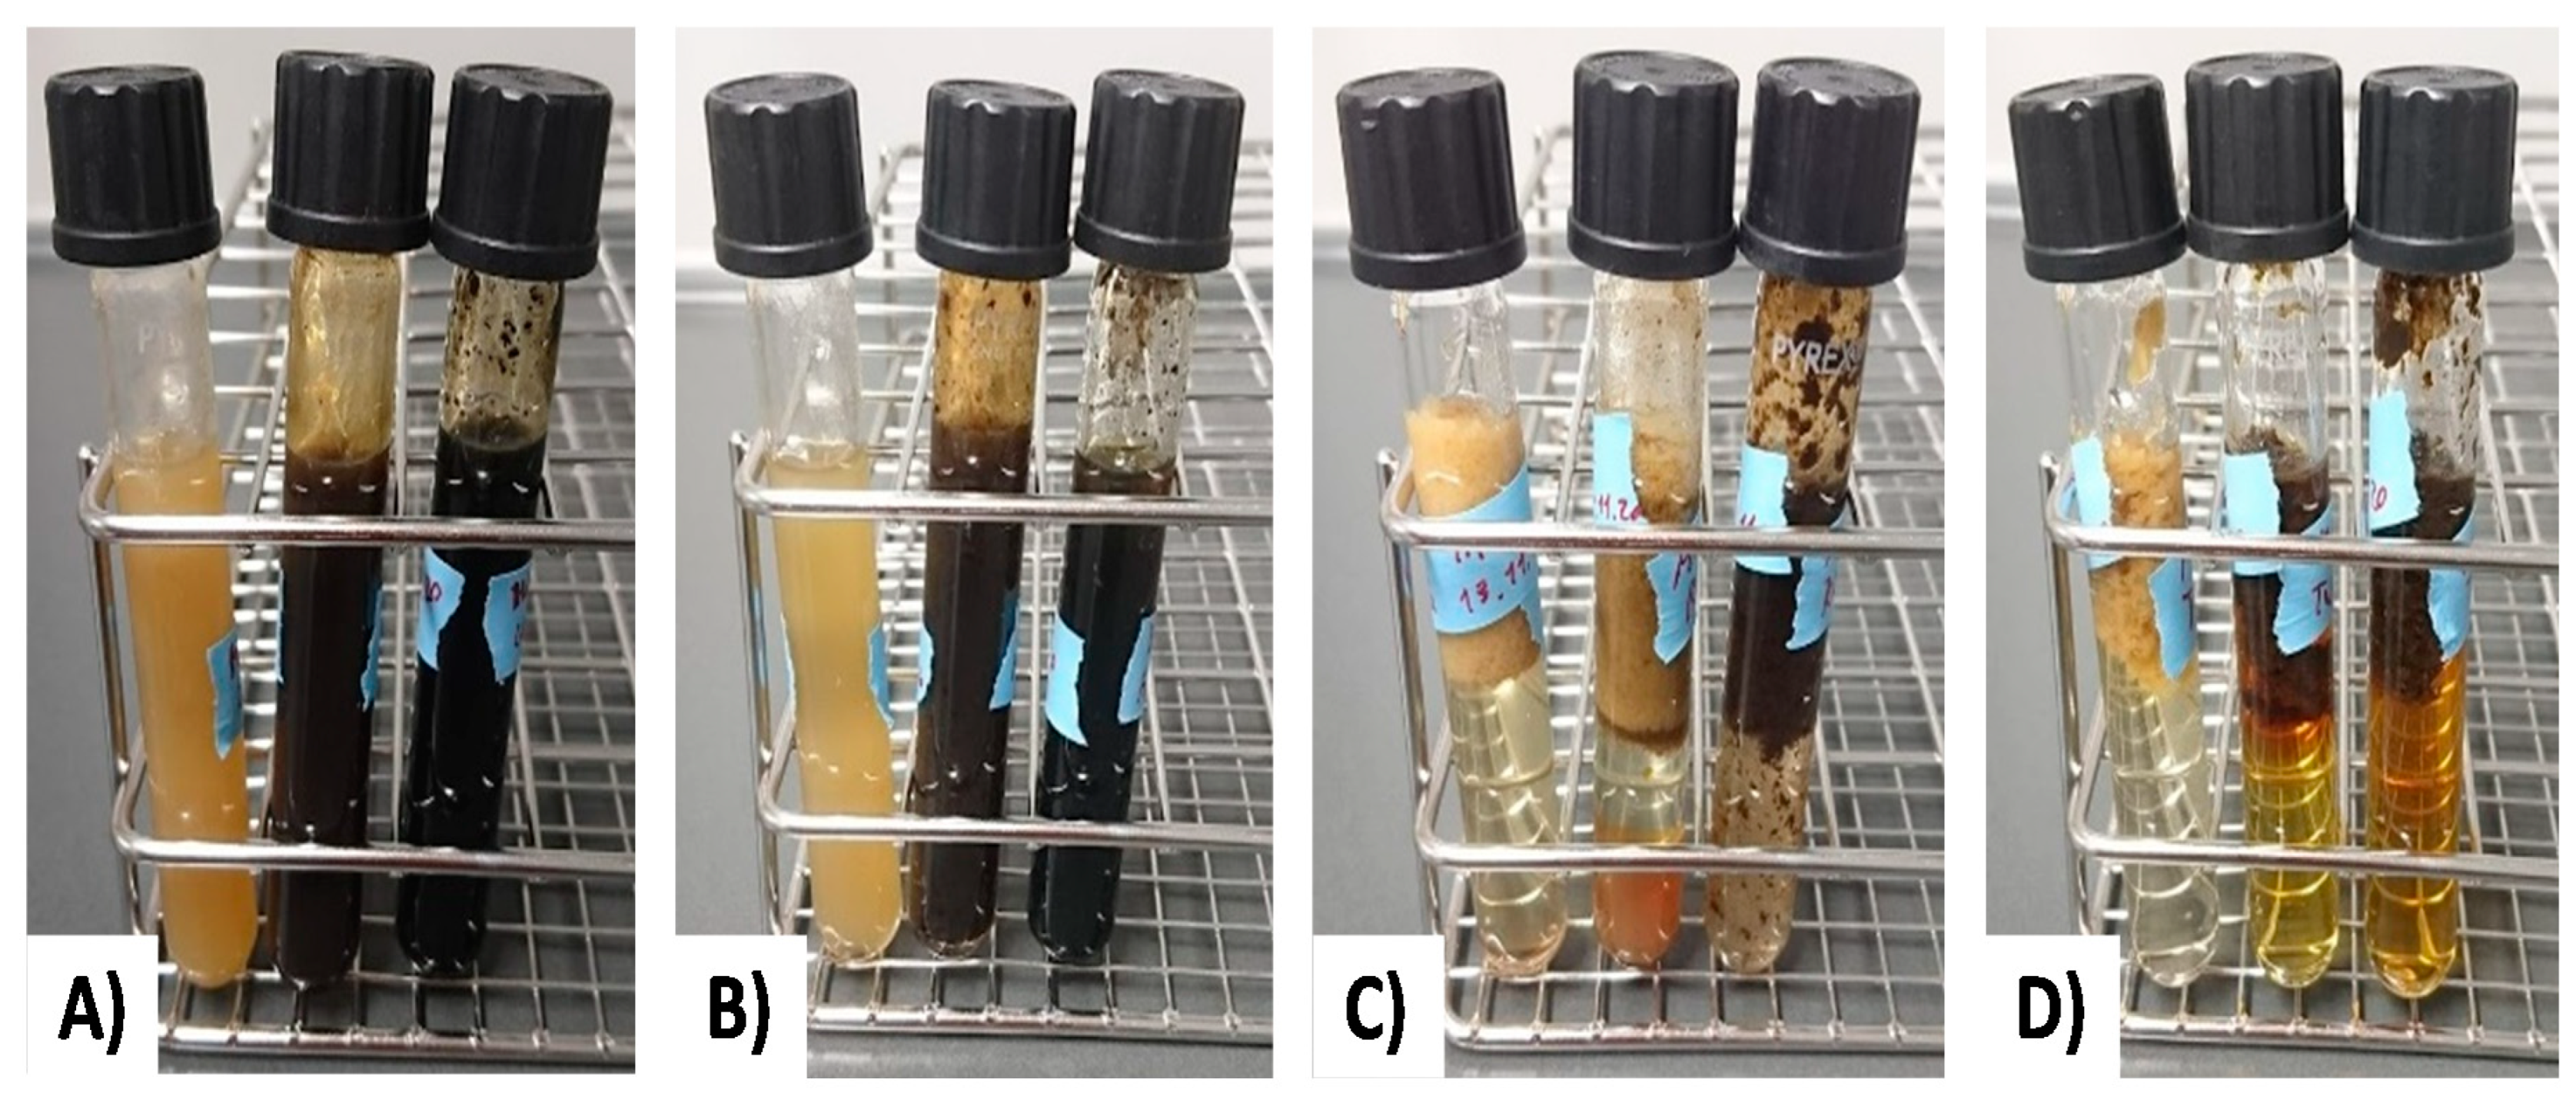
3.2. Retort Furnace
4. Conclusions
Author Contributions
Funding
Acknowledgments
Conflicts of Interest
References
- Hopmann, C.; Michaeli, W. Einführung in die Kunststoffverarbeitung, 7., Aktualisierte Aufl.; Hanser: München, Germany, 2015; ISBN 978-3-446-44627-4. [Google Scholar]
- Geyer, R.; Jambeck, J.R.; Law, K.L. Production, use, and fate of all plastics ever made. Sci. Adv. 2017, 3, e1700782. [Google Scholar] [CrossRef]
- Lechthaler, S.E.; Waldschläger, K.; Stauch, G.; Schüttrumpf, H. The Way of Macroplastic through the Environment. Environment 2020, 7, 73. [Google Scholar] [CrossRef]
- Jambeck, J.R.; Geyer, R.; Wilcox, C.; Siegler, T.R.; Perryman, M.; Andrady, A.; Narayan, R.; Law, K.L. Plastic waste inputs from land into the ocean. Science 2015, 347, 768–771. [Google Scholar] [CrossRef]
- Eriksen, M.; Lebreton, L.C.M.; Carson, H.S.; Thiel, M.; Moore, C.J.; Borerro, J.C.; Galgani, F.; Ryan, P.G.; Reisser, J. Plastic Pollution in the World’s Oceans: More than 5 Trillion Plastic Pieces Weighing over 250,000 Tons Afloat at Sea. PLoS ONE 2014, 9, e111913. [Google Scholar] [CrossRef]
- Carpenter, E.J.; Smith, K.L. Plastics on the Sargasso Sea Surface. Science 1972, 175, 1240–1241. [Google Scholar] [CrossRef] [PubMed]
- UNEP. Marine Litter, an Analytical Overview; UNEP: Nairobi, Kenya, 2005. [Google Scholar]
- European Commission. Our Oceans, Seas and Coasts: Descriptor 10: Marine Litter. Available online: https://ec.europa.eu/environment/marine/good-environmental-status/descriptor-10/index_en.htm (accessed on 16 November 2020).
- GESAMP. Guidelines for the Monitoring and Assessment of Plastic Litter and Microplastics in the Ocean; GESAMP: London, UK, 2019. [Google Scholar]
- Schmaltz, E.; Melvin, E.C.; Diana, Z.; Gunady, E.F.; Rittschof, D.; Somarelli, J.A.; Virdin, J.; Dunphy-Daly, M.M. Plastic pollution solutions: Emerging technologies to prevent and collect marine plastic pollution. Environ. Int. 2020, 144, 106067. [Google Scholar] [CrossRef]
- Chubarenko, I.; Esiukova, E.; Bagaev, A.; Isachenko, I.; Demchenko, N.; Zobkov, M.; Efimova, I.; Bagaeva, M.; Khatmullina, L. Behavior of Microplastics in Coastal Zones. In Microplastic Contamination in Aquatic Environments; Elsevier: Amsterdam, The Netherlands, 2018; pp. 175–223. [Google Scholar]
- Hahladakis, J.N.; Velis, C.A.; Weber, R.; Iacovidou, E.; Purnell, P. An overview of chemical additives present in plastics: Migration, release, fate and environmental impact during their use, disposal and recycling. J. Hazard. Mater. 2018, 344, 179–199. [Google Scholar] [CrossRef]
- Kasirajan, S.; Ngouajio, M. Polyethylene and biodegradable mulches for agricultural applications: A review. Agron. Sustain. Dev. 2012, 32, 501–529. [Google Scholar] [CrossRef]
- Steinmetz, Z.; Wollmann, C.; Schaefer, M.; Buchmann, C.; David, J.; Tröger, J.; Muñoz, K.; Frör, O.; Schaumann, G.E. Plastic mulching in agriculture. Trading short-term agronomic benefits for long-term soil degradation? Sci. Total Environ. 2016, 550, 690–705. [Google Scholar] [CrossRef]
- Wei, R.; Tiso, T.; Bertling, J.; O’Connor, K.; Blank, L.M.; Bornscheuer, U.T. Possibilities and limitations of biotechnological plastic degradation and recycling. Nat. Catal. 2020, 3, 867–871. [Google Scholar] [CrossRef]
- Rojo, F. Degradation of alkanes by bacteria. Environ. Microbiol. 2009, 11, 2477–2490. [Google Scholar] [CrossRef] [PubMed]
- Haritash, A.; Kaushik, C. Biodegradation aspects of Polycyclic Aromatic Hydrocarbons (PAHs): A review. J. Hazard. Mater. 2009, 169, 1–15. [Google Scholar] [CrossRef] [PubMed]
- Blank, L.M.; Narancic, T.; Mampel, J.; Tiso, T.; O’Connor, K. Biotechnological upcycling of plastic waste and other non-conventional feedstocks in a circular economy. Curr. Opin. Biotechnol. 2020, 62, 212–219. [Google Scholar] [CrossRef]
- Ward, P.G.; Goff, M.; Donner, M.; Kaminsky, W.; O’Connor, K.E. A Two Step Chemo-biotechnological Conversion of Polystyrene to a Biodegradable Thermoplastic. Environ. Sci. Technol. 2006, 40, 2433–2437. [Google Scholar] [CrossRef]
- Guzik, M.W.; Kenny, S.T.; Duane, G.F.; Casey, E.; Woods, T.; Babu, R.P.; Nikodinovic-Runic, J.; Murray, M.; O’Connor, K. Conversion of post consumer polyethylene to the biodegradable polymer polyhydroxyalkanoate. Appl. Microbiol. Biotechnol. 2014, 98, 4223–4232. [Google Scholar] [CrossRef]
- Kenny, S.T.; Runic, J.N.; Kaminsky, W.; Woods, T.; Babu, R.P.; Keely, C.M.; Blau, W.; O’Connor, K.E. Up-Cycling of PET (Polyethylene Terephthalate) to the Biodegradable Plastic PHA (Polyhydroxyalkanoate). Environ. Sci. Technol. 2008, 42, 7696–7701. [Google Scholar] [CrossRef]
- Julsing, M.K.; Schrewe, M.; Cornelissen, S.; Hermann, I.; Schmid, A.; Bühler, B. Outer Membrane Protein AlkL Boosts Biocatalytic Oxyfunctionalization of Hydrophobic Substrates in Escherichia coli. Appl. Environ. Microbiol. 2012, 78, 5724–5733. [Google Scholar] [CrossRef]
- Sudarsan, S.; Dethlefsen, S.; Blank, L.M.; Siemann-Herzberg, M.; Schmid, A. The Functional Structure of Central Carbon Metabolism in Pseudomonas putida KT2440. Appl. Environ. Microbiol. 2014, 80, 5292–5303. [Google Scholar] [CrossRef]
- Utomo, R.N.C.; Li, W.-J.; Tiso, T.; Eberlein, C.; Doeker, M.; Heipieper, H.J.; Jupke, A.; Wierckx, N.; Blank, L.M. Defined Microbial Mixed Culture for Utilization of Polyurethane Monomers. ACS Sustain. Chem. Eng. 2020, 8, 17466–17474. [Google Scholar] [CrossRef]
- Baur, E.; Brinkmann, S.; Osswald, T.A.; Rudolph, N.; Schmachtenberg, E.; Saechtling, H. Saechtling Kunststoff Taschenbuch, 31. Ausgabe, [komplett überarb., aktualisiert und zum ersten Mal in Farbe]; Hanser: München, Germany, 2013; ISBN 978-3-446-43442-4. [Google Scholar]
- Hee, J.; Schloegel, K.; Lechthaler, S.; Quicker, P. Plastics in the Oceans: Recycling, WtE or landfilling? In Proceedings of the 11th ISWA Beacon Conference on Waste-to-Energy Malmö, Malmö, Sweden, 29–30 October 2019. [Google Scholar]
- Demling, P.; Von Campenhausen, M.; Grütering, C.; Tiso, T.; Jupke, A.; Blank, L.M. Selection of a recyclable in situ liquid–liquid extraction solvent for foam-free synthesis of rhamnolipids in a two-phase fermentation. Green Chem. 2020. [Google Scholar] [CrossRef]
- Cappelletti, M.; Fedi, S.; Zannoni, D. Degradation of Alkanes in Rhodococcus. In Beneficial Microorganisms in Food and Nutraceuticals; Springer: Berlin, Germany, 2019; pp. 137–171. [Google Scholar]
- Schneiker, S.; Santos, V.A.P.M.D.; Bartels, D.; Bekel, T.; Brecht, M.; Buhrmester, J.; Chernikova, T.N.; Denaro, R.; Ferrer, M.; Gertler, C.; et al. Genome sequence of the ubiquitous hydrocarbon-degrading marine bacterium Alcanivorax borkumensis. Nat. Biotechnol. 2006, 24, 997–1004. [Google Scholar] [CrossRef]


| NP | NA | SP | SA | IO | MED | Total | |
|---|---|---|---|---|---|---|---|
| Count [n × 1010] | 199.0 | 93.0 | 49.1 | 29.7 | 130.0 | 24.7 | 525.0 |
| Weight [t × 102] | 964.0 | 564.7 | 210.2 | 127.8 | 591.3 | 231.5 | 2689.4 |
| ML Sylt | ML Norderney | Mulch Foil | |
|---|---|---|---|
| Characteristics | Marine litter washed up on the beach and mostly collected after high tide | Marine litter washed up on the beach. | Virgin grade LD-PE mulch foil (black) |
| Localization | North Sea Germany, Sylt, Wadden Sea National Park Sylt, West Beach and East Beach | North Sea Germany, Norderney, Wadden Sea National Park Norderney, Norderney East | - |
| Coordinates | 55.014167° N 8.370444° E | 53.715902° N 7.283360° E | - |
| Weight | 5478 g | 4522 g | 975 g |
| Volume | 0.08 m3 | 0.162 m3 | - |
| Date of collection | 22 April–15 May 2020 | 17 April 2020 | - |
| Material Group | ML Norderney | ML Sylt |
|---|---|---|
| 3D plastics | 88 wt% | 15 wt% |
| Films | 10 wt% | 6 wt% |
| Metals | 1 wt% | 2 wt% |
| Nets | - | 55 wt% |
| Rubber & Elastomers | - | 8 wt% |
| Foamed plastics | <<1 wt% | 5 wt% |
| Others | 1 wt% | 9 wt% |
| ML Sylt | ML Nordenery | Mulch Foil | |
|---|---|---|---|
| Proximate analysis * (wt%) | |||
| Moisture | <0.2 | <0.2 | <0.2 |
| Ash (550 °C) | 13.52 | 10.55 | 0.83 |
| Volatile matter | 84.6 | 91.0 | 96.8 |
| Ultimate analysis ** (wt%) | |||
| C | 68.2 | 66.8 | 85.6 |
| H | 9.2 | 9.5 | 13.6 |
| N | 0.7 | <0.1 | <0.1 |
| S | 0.6 | <0.1 | <0.1 |
| Cl | 1.3 | 0.5 | <0.1 |
| Calorific value * (kJ/kg) | |||
| 33,430 | 35,970 | 42,920 |
| ML Sylt | ML Norderney | Mulch Foil | ||
|---|---|---|---|---|
| Ti | [°C] | |||
| Pyrolysis | 137.6 ± 37.1 | 187.6 ± 23.7 | 384.7 ± 5.2 | |
| Gasification | 120.5 ± 9.6 | 226.0 ± 14.0 | 343.3 ± 5.2 | |
| Incineration | 148.4 ± 31.4 | 212.8 ± 16.9 | 285.5 ± 7.0 | |
| Tp | [°C] | |||
| Pyrolysis | 458.8 ± 1.6 | 456.8 ± 3.2 | 466.5 ± 2.2 | |
| Gasification | 459.5 ± 1.7 | 437.5 ± 1.7 | 466.7 ± 0.9 | |
| Incineration | 448.4 ± 4.5 | 440.0 ± 12.0 | 465.5 ± 3.8 | |
| Tc | [°C] | |||
| Pyrolysis | 751.2 ± 20.6 | 666.0 ± 28.0 | 497.0 ± 7.3 | |
| Gasification | 782.0 ± 24.0 | 747.5 ± 5.0 | 634.7 ± 10.5 | |
| Incineration | 633.2 ± 36.2 | 580.8 ± 12.9 | 543.0 ± 6.6 | |
| Sylt Char | Norderney Char | Mulch Foil Char | Sylt Condensate | Norderney Condensate | Mulch Foil Condensate | |
|---|---|---|---|---|---|---|
| Product fraction (wt%) | 18.2 | 14.8 | 9.3 | 24.1 | 21.5 | 32.3 |
| Proximate analysis * (wt%) | ||||||
| Moisture | <0.2 | <0.2 | <0.2 | |||
| Ash (550 °C) | 84.89 | 52.75 | 27.57 | |||
| Volatile matter | 7.3 | 4.1 | 4.3 | |||
| Ultimate analysis ** (wt%) | ||||||
| C | 20.3 | 49.7 | 72.2 | 77.0 | 72.7 | 56.6 |
| H | 0.2 | 1.0 | 0.3 | 11.0 | 10.3 | 8.8 |
| N | 0.7 | 0.3 | <0.1 | 0.4 | <0.1 | <0.1 |
| S | 2.0 | 0.2 | 0.3 | 0.1 | <0.1 | <0.1 |
| Cl | 4.4 | 3.0 | <0.1 | 0.2 | 0.9 | <0.1 |
| Calorific value *(kJ/kg) | ||||||
| 8590 | 18,440 | 25,080 | 41,500 | 37,210 | 42,170 |
Publisher’s Note: MDPI stays neutral with regard to jurisdictional claims in published maps and institutional affiliations. |
© 2020 by the authors. Licensee MDPI, Basel, Switzerland. This article is an open access article distributed under the terms and conditions of the Creative Commons Attribution (CC BY) license (http://creativecommons.org/licenses/by/4.0/).
Share and Cite
Hee, J.; Schlögel, K.; Lechthaler, S.; Plaster, J.; Bitter, K.; Blank, L.M.; Quicker, P. Comparative Analysis of the Behaviour of Marine Litter in Thermochemical Waste Treatment Processes. Processes 2021, 9, 13. https://doi.org/10.3390/pr9010013
Hee J, Schlögel K, Lechthaler S, Plaster J, Bitter K, Blank LM, Quicker P. Comparative Analysis of the Behaviour of Marine Litter in Thermochemical Waste Treatment Processes. Processes. 2021; 9(1):13. https://doi.org/10.3390/pr9010013
Chicago/Turabian StyleHee, Johann, Kai Schlögel, Simone Lechthaler, Jacqueline Plaster, Kristina Bitter, Lars Mathias Blank, and Peter Quicker. 2021. "Comparative Analysis of the Behaviour of Marine Litter in Thermochemical Waste Treatment Processes" Processes 9, no. 1: 13. https://doi.org/10.3390/pr9010013
APA StyleHee, J., Schlögel, K., Lechthaler, S., Plaster, J., Bitter, K., Blank, L. M., & Quicker, P. (2021). Comparative Analysis of the Behaviour of Marine Litter in Thermochemical Waste Treatment Processes. Processes, 9(1), 13. https://doi.org/10.3390/pr9010013