Article

Biodiesel from Crude Tall Oil and Its NOx and Aldehydes Emissions in a Diesel Engine Fueled by Biodiesel-Diesel Blends with Water Emulsions

1
Mechanical Engineering Department, Lakehead University, Thunder Bay, ON P7B 5E1, Canada
2
Bio-Refining Research Institute, Lakehead University, Thunder Bay, ON P7B 5E1, Canada
*
Author to whom correspondence should be addressed.
Processes 2021, 9(1), 126; https://doi.org/10.3390/pr9010126
Submission received: 17 December 2020 / Revised: 1 January 2021 / Accepted: 5 January 2021 / Published: 8 January 2021

Abstract

:
Using biodiesel in diesel engines is beneficial for reducing emissions of carbon monoxide (CO), hydrocarbons (HC) and particulate matters (PM). Biodiesel is usually produced from vegetable oils or animal fats. When produced from plant oil or woody plant sources, biodiesel can reduce a significant amount of carbon dioxide on a life cycle basis. The objective of this study is to produce biodiesel from a non-conventional woody plant source that is, crude tall oil, which is a dark brown viscous liquid extracted and processed in wood pulping plants. It contains a high percentage of fatty acids. From raw crude tall oil, tall oil fatty acids were separated and were successfully used for the production of biodiesel in this study. Although biodiesel produces lower CO, HC and PM than petroleum diesel fuel, it produces higher oxides of nitrogen (NOx) emissions in diesel engines. Water emulsifications of diesel-biodiesel blends are investigated in a direct injection (DI) diesel engine in this work to understand their potential for NOx reduction. When using 10% water in the emulsions, NOx was reduced by nearly 15%. In aldehyde emissions, B100 showed 35% lower aldehydes and B100 with 10% water emulsion produced nearly 90% lower aldehydes than diesel fuel—a substantial reduction. Therefore, this study accomplished the desired goal of producing biodiesel from a non-conventional source, which satisfies ASTM biodiesel standard and results in lower NOx and aldehydes emissions with water emulsifications of diesel-biodiesel blends in a diesel engine compared to that of diesel fuel.

Highlights

  • Biodiesel was produced from crude tall oil by acid esterification reaction.
  • Biodiesel blends emulsified with 5% and 10% water and tested for NOx and aldehydes.
  • Maximum NOx reduction of about 15% was achieved with 10% water-emulsion.
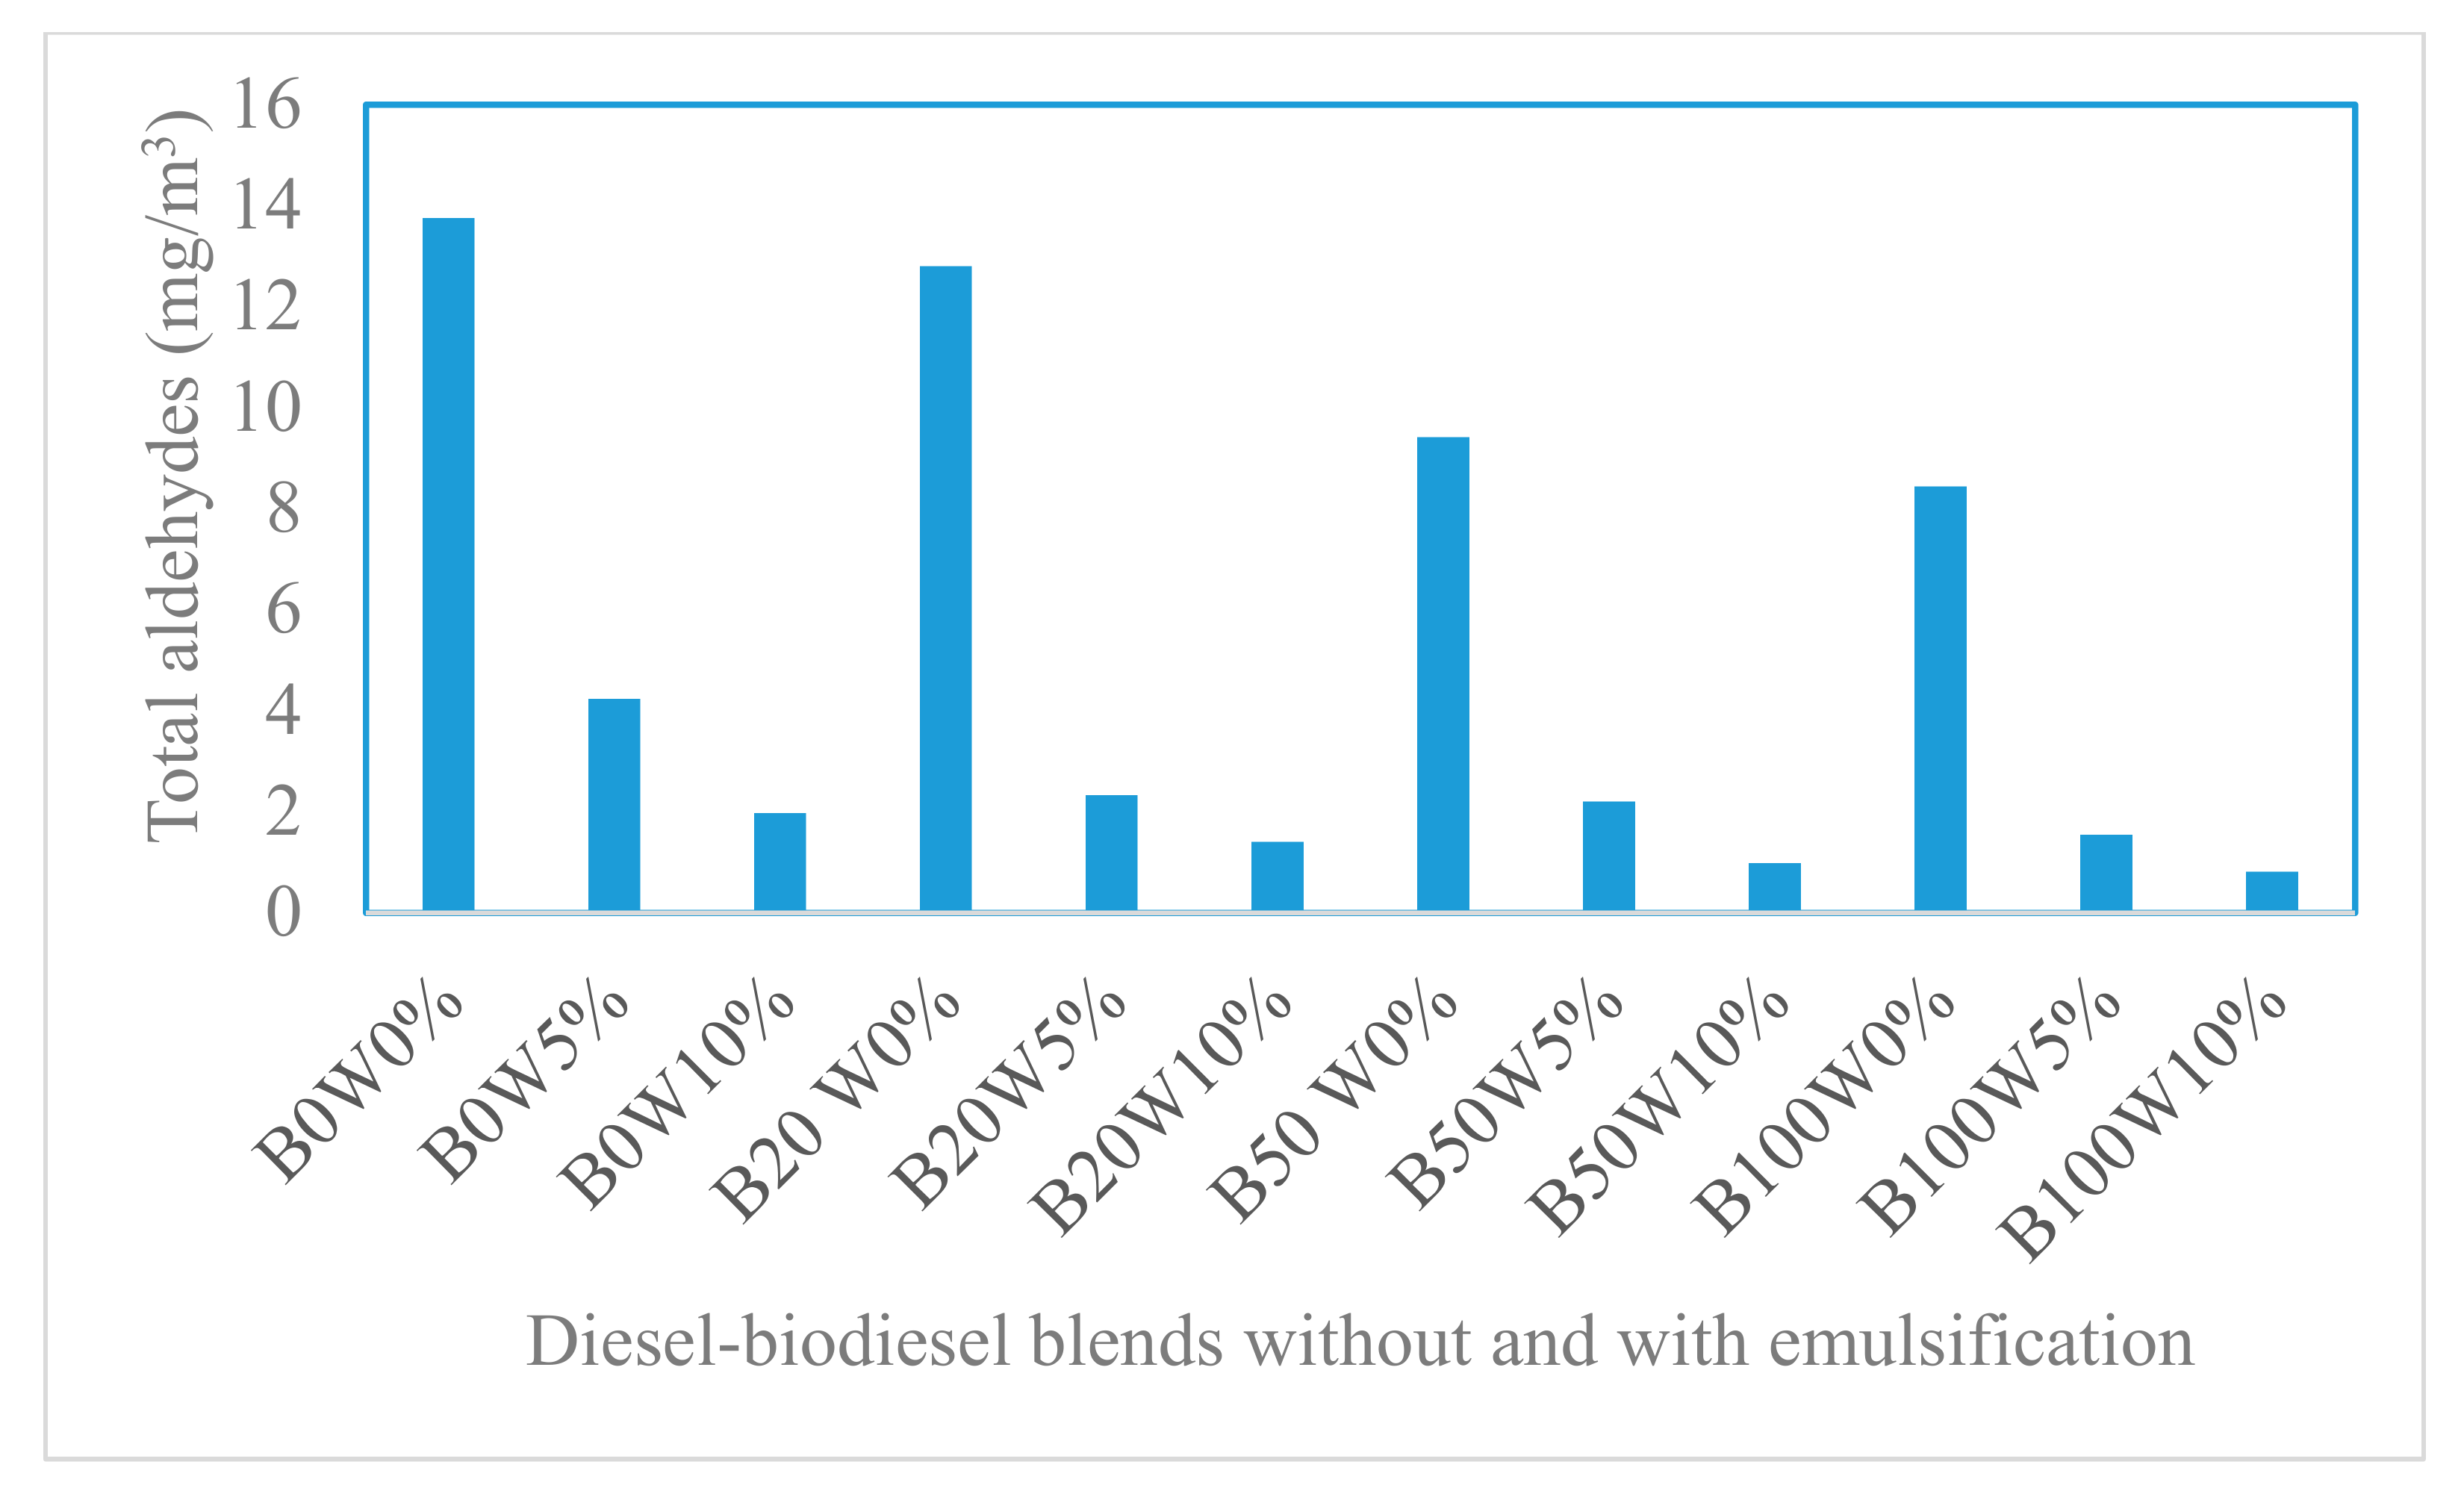
  • Diesel-biodiesel emulsions’ aldehydes were measured, which is the novelty of this study.
  • Maximum aldehyde reduction of 90% was achieved with 10% water with biodiesel.

1. Introduction

Internal combustion (IC) engines are one of the major sources of carbon dioxide (CO2), which is the main greenhouse gas (GHG) that causes global warming. Use of biodiesel in diesel engines can significantly reduce GHG (78%) on a life cycle basis [1]. An investigation on the impacts of biodiesel on exhaust emissions was conducted by the United States Environmental Protection Agency (US EPA) [2]. The study concluded that pure biodiesel can reduce 70% of hydrocarbons (HC) emissions and 50% of particulate matters (PMs) and carbon monoxide (CO) emissions compared to conventional diesel fuel. Many other investigations revealed that the use of biodiesel can result in a substantial reduction in PM, HC and CO emissions [3,4,5,6]. However, an increase in NOx emission was observed by most researchers when biodiesel was used [7,8,9]. In a recent study [10], it was reported that a minor modification to engine parameters, such as compression ratio, injection timing and injection pressure with a binary mixture of 70% amla seed oil biodiesel and 30% eucalyptus oil, can increase brake thermal efficiency and decrease brake-specific fuel consumption more effectively than petroleum diesel. The binary fuel blends also produced lower tailpipe emissions.
Enthusiasm is developing for using diesel-water emulsions to reduce NOx in diesel engines. Water considerably impacts emissions such as oxides of nitrogen (both NO and NO2), CO and smoke. Previous studies [11,12] concluded that NOx can be reduced by more than 30% by using water-washing and water-scrubbing systems, whereas NOx is absorbed through water. These were after-treatments of exhaust gases at the tail pipe. The main components of NOx are NO and NO2. NO is slightly soluble in water, whereas NO2 is highly soluble in water [13], which is why NOx emissions from exhaust gases were reduced following water-washing and water-scrubbing.
Water-emulsified fuels are also expected to reduce in-cylinder temperature. Therefore, NOx reduction can be achieved either by absorption or as a result of lower combustion temperature. A normal water substitution to diesel emulsions ranges between 5% and 15% [14,15]. There is great enthusiasm for water-in-diesel emulsions due to the way that water, as micro-sized beads, results in favourable outcomes on fuel burning. This was initially discovered as a tentative theory [16] and confirmed by hypothesis [17] approximately 50 years ago. The utilization of diesel emulsions appeared to be extremely impactful, namely diminished NOx, lower PM and improved burning efficiency. It has been proven that the addition of 15% water in diesel can decrease NOx emissions by up to 35% under normal conditions [18]. Although this considerable decrease has also been cited by other researchers [16,19], the addition of water resulted in increased CO and HC emissions. In addition, high-water content is hardly economical since it requires large quantities of emulsifier. Furthermore, emulsions of high-water content cause stability problems. For these reasons, this study investigated water emulsions with up to 10% water content.
The above studies [16,17,18,19], as well as many others, focused on water in diesel emulsions and their emissions. The following studies presented water emulsification of binary fuels, B5 [14], B20 [15] and B40 [20]. In Reference [14], 5% palm oil methyl ester and 95% diesel were used with water content from 9–15% and surfactant dosages of 5–15%. Senthil et al. [15] conducted an experimental investigation of diesel engine emissions using B20 with various percentages of water content. In Reference [20], 40% canola oil biodiesel and 60% diesel (B40) were used to investigate the emissions of a light-duty diesel engine at different engine load conditions and speeds. Three levels of water content (5%, 10% and 15%) were investigated. To have a better understanding about pure biodiesel’s emulsification, this study used different diesel-biodiesel blends of up to B100 with 5–10% water content, along with two types of emulsifiers.
Direct-injection (DI) diesel engines emit higher exhaust odor than gasoline engines. Partially-burned combustion products, mainly aldehydes, are primarily responsible for the exhaust odor in DI diesel engines [21,22,23,24,25]. The effect of normal heptane (N-heptane) on formaldehyde (HCHO) and exhaust odor emissions was investigated in a DI diesel engine [26]. There was a strong correlation between HCHO and exhaust odor and a moderate odor increase was noticed with 100% N-heptane than with diesel. At different engine running conditions, the increase in HCHO with 100% N-heptane was approximately 10–25% higher than that of diesel fuel.
Aldehydes are soluble in water, as discovered in ref. [27]—the lower the number of aldehydes, the lower the exhaust odor. Odor reduction of two points (which is very significant) and an 80–90% aldehyde reduction by water-washing of the exhaust gas were reported [28]. It was expected that using water-emulsified diesel-biodiesel fuels would result in similar level of aldehyde reduction. Therefore, investigating aldehydes in exhaust gases with water emulsification of diesel-biodiesel blends is attempted in this study, which is a new area of research. To the best of the authors’ knowledge, no publication exists that focuses on the correlation between exhaust odor and aldehydes for biodiesel fuel. Furthermore, there is no information about aldehyde and ketone emissions from emulsified diesel-biodiesel blends. In Reference [29], a DI diesel engine was tested with diesel, 100% biodiesel (B100) and blends of 80% diesel and 20% biodiesel (B20). B100 showed a 0.5-point reduction in exhaust odor over diesel, which is quite substantial. However, there was no measurement of aldehydes in that study. The following are two recent publications where aldehydes were determined from biodiesel [30,31]. In Reference [30], pollutants of carbonyl compounds of a diesel engine fueled with diesel, B50 and B100 were investigated, whereby mainly aldehyde and ketone compounds with 1–3 carbon atoms, such as HCHO, acetaldehyde (CH3CHO), acrolein and propionaldehyde were detected. The HCHO content was higher than 80% of the total carbonyl pollutants for B100. Within the entire engine load, the concentration of total carbonyl pollutants for diesel was higher than B50 and B100. In Reference [31], diesel and B20 were tested in a diesel engine for aldehyde comparison, in which HCHO and CH3CHO were the dominating aldehydes. B20 showed approximately 15% lower aldehydes than that of diesel. Therefore, the determination of aldehydes and ketones from emulsified diesel-biodiesel blends will fill the current research gap.
Biodiesel is a fuel produced mainly from edible vegetable oils. USA uses soybean oil as feedstock for over half of their total biodiesel production, whereas other countries use canola oil, palm oil and other edible oils. Because this creates a food-fuel conflict, a non-food source for biodiesel production is very important. This study investigates crude tall oil (CTO), which is a non-food source to produce biodiesel. Production of biodiesel from CTO and the fact that its emulsifications are used to fuel a diesel engine, is the novelty of this research. In a few studies, raw CTO without pre-treatment was used for biodiesel production [32,33]. Raw CTO may have impurities such as sodium salts, dissolved lignin, unreacted soap or acid, residual pulping chemicals and so forth, which hinder the distillation process. This study, however, explores pre-treatment of raw CTO in the production of biodiesel. Therefore, use of non-food source CTO and its pre-treatment to produce biodiesel, as well as measurements of aldehydes and ketones from the exhaust gases of the emulsified diesel-biodiesel blends, are an entirely new dimension of research. Furthermore, water-emulsified biodiesel can play a major role in exhaust odor and irritation reduction from diesel engines.

2. Materials and Methods

2.1. Materials

CTO sample was provided by Resolute Forest Products pulp and paper mill in Canada. Urea, ethanol, hexane, sodium chloride, sodium hydrogen carbonate, methanol, acetone and 2,4 dinitrophenyl hydrazine (DNPH) were purchased from Sigma-Aldrich (Canada). Sulphuric acid was purchased from Fisher Scientific (Canada). Atlox 4914, Tween 80 and Span 80 were obtained from a chemical supply store at Lakehead University.

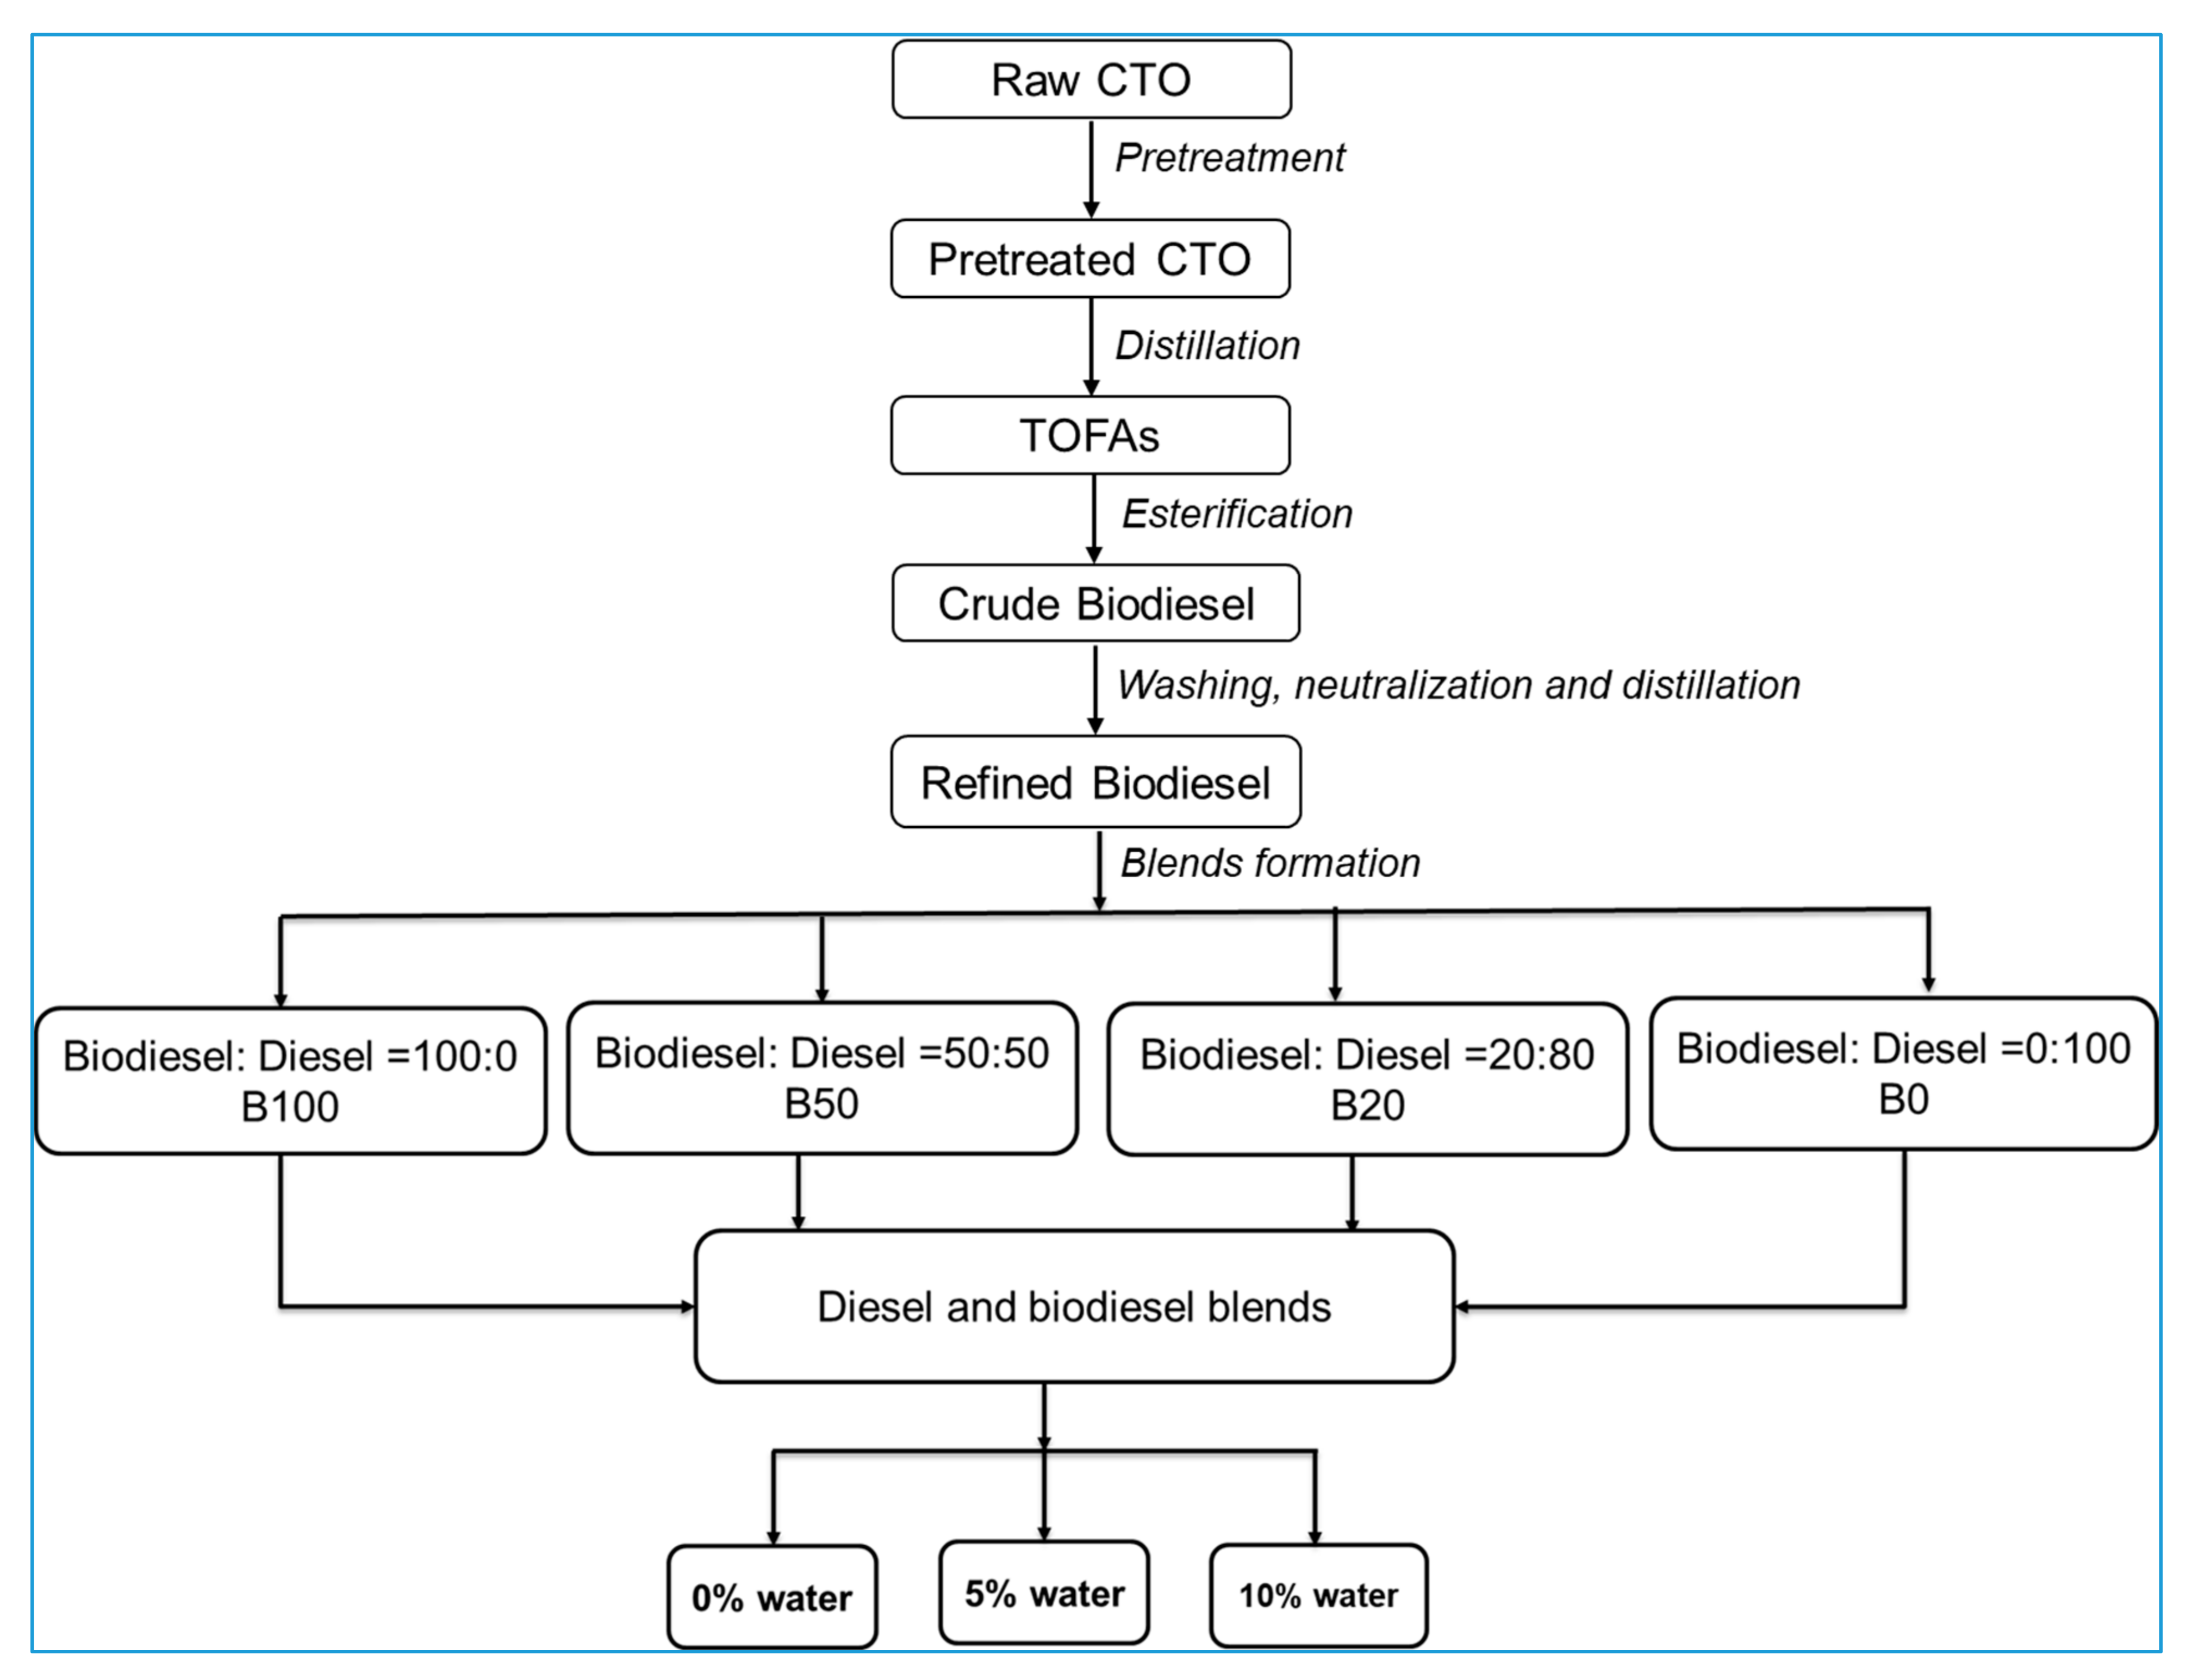
2.2. Extraction of Tall Oil Fatty Acids (TOFA) from CTO

TOFA was separated from raw CTO using a technique developed by Islam et al. [34]. Initially, in order to remove impurities (unwanted particles and chemicals), raw CTO was pretreated with a salt solution (NaCl 1%). The TOFA was then separated through a distillation process at temperatures of between 130 °C and 265 °C, with a vacuum pressure of 10 mm Hg. The yield of TOFA fraction was 48% (w/w), with a recovery rate 89.9% in CTO. The composition of TOFA, which was analyzed by GC, included 42.6% linoleic acid, 14.8% stearic acid, 12.3% palmitic acid 4.7% linolenic acid and 4.5% oleic acid. The TOFA was then used for biodiesel production.

2.3. Production of Biodiesel from TOFA

The biodiesel was produced by esterification reaction of TOFA with methanol and sulphuric acid (H2SO4) was used as a catalyst, as follows:
Processes 09 00126 i001
Because all TOFA in this study contained free fatty acid, the acid catalyst H2SO4 was suitable for the formation of an ester bond.
Esterification reaction was carried out in a round 3-neck glass bottle reactor, which was equipped with a stirrer, a thermometer and a water circulation reflux condenser. 100 g of TOFA was mixed with 20 g of methanol in a 200 ml glass reactor, whereby 7 g of sulphuric acid was used as a catalyst. The reaction mixture was heated to 72 °C and was gently agitated at 200 rpm for approximately two hours. The reaction mixture (crude biodiesel) was then poured into the excess amount of distilled water and thoroughly washed in a separating funnel to remove the excess methanol and catalyst. The distilled water was changed several times until the pH reached 7 (neutral). Finally, the distillation process was performed again up to 270 °C in order to obtain refined methyl ester (biodiesel) from the TOFA. The refined biodiesel fraction was collected at temperatures of between 130 °C and 270 °C to prevent the possibility of contaminating the water or methanol. The amount of refined biodiesel was 85% of TOFA. Figure 1 is a flowchart of biodiesel production from raw CTO and their blends with diesel fuel, along with their water emulsions.

2.4. Biodiesel Blends with Emulsification

Collected pure biodiesel is denoted as B100. The blending percentage of biodiesel with diesel was set to 0%, 20% and 50% and referred to as B0, B20 and B50, respectively. All biodiesel blends were stored at 20 °C in different conical flasks and sealed with aluminum foil for further testing. Biodiesel and diesel were mixed in different proportions (B0, B20, B50, B100) and water was added in quantities of 5% and 10% to produce the particular emulsified fuels. Since water is polar and the biodiesel blend is non-polar, a particular emulsifier (mixture of Tween 80 and Span 80) was used to stabilize the emulsified fuels. External force was then utilized for proper mixing, which was created by stirring each sample of the solution at 4000 rpm for 15 min. The HLB value for the Tween 80 and Span 80 was approximately 8.25. The hydrophile-lipophile balance (HLB) value was maintained by the molar ratio (1.7:1) of Tween 80 and Span 80, which is very important. Finally, 10 g of Span 80 was mixed with 17.7 g of Tween 80 to obtain an average HLB value of 8.25.

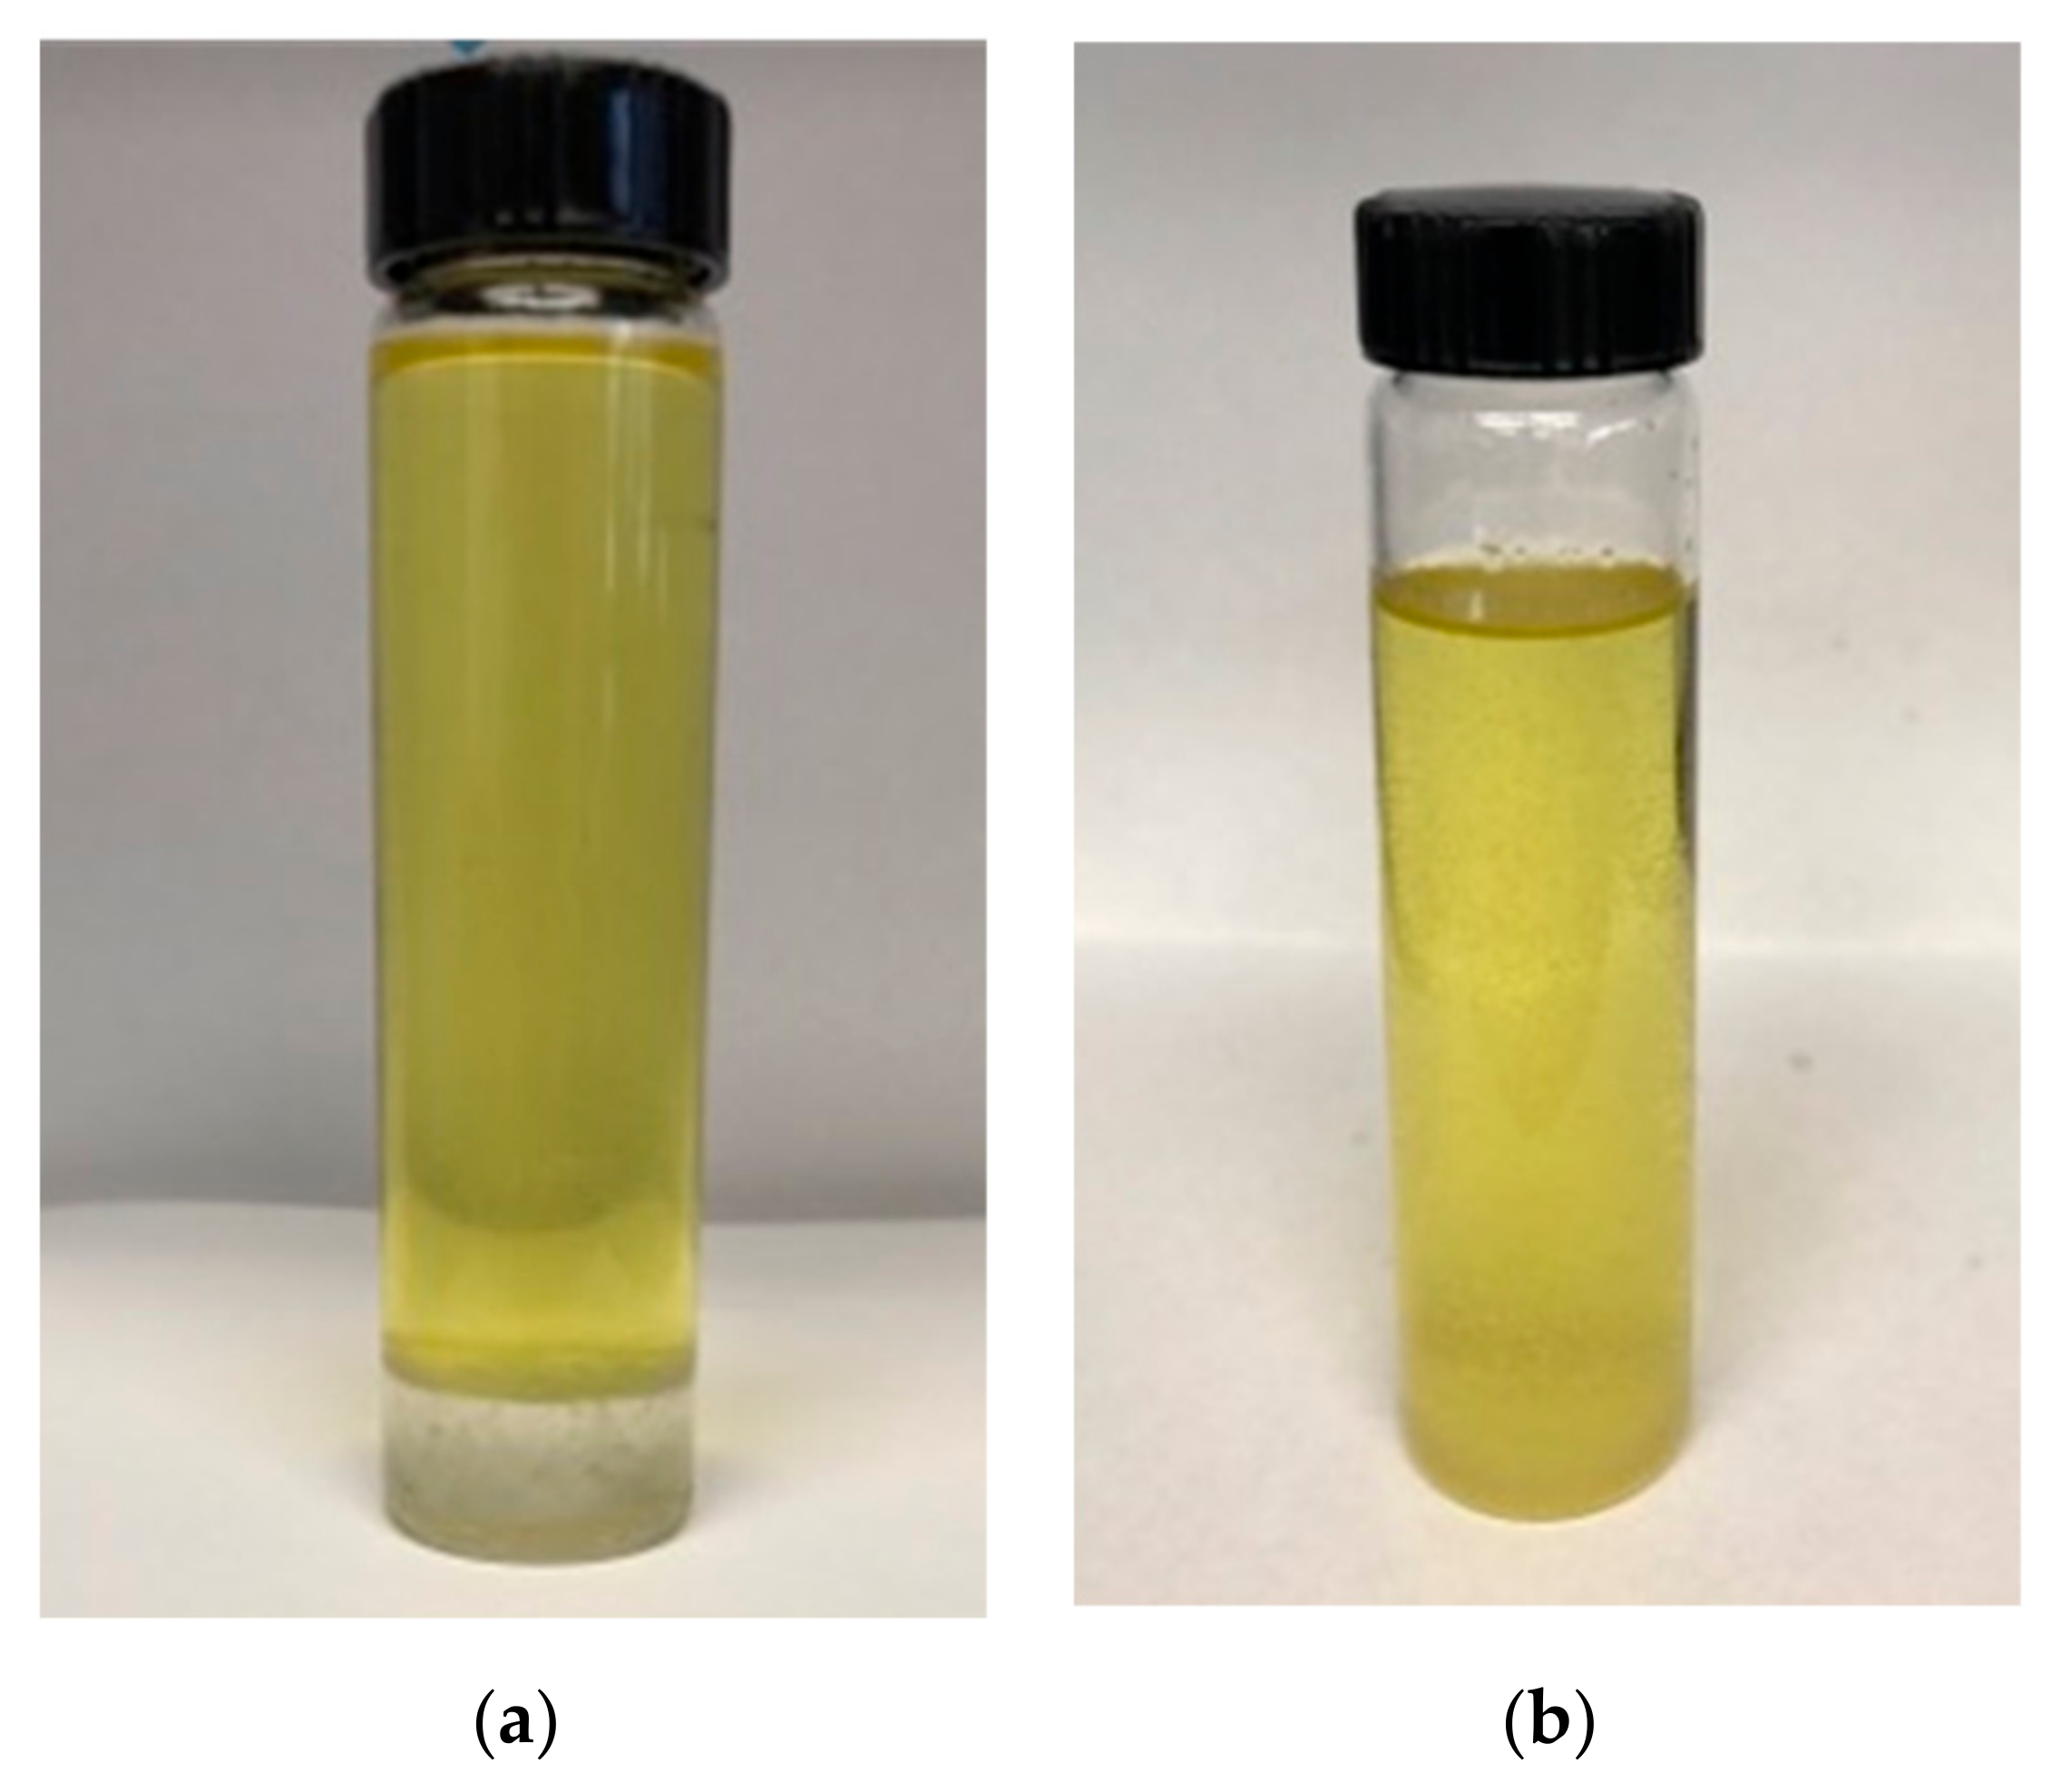
2.5. Emulsion Stability Test

At the point when separation could no longer be detected, the emulsion was considered to have stabilized [35]. Our research investigated the stability at room temperature (20 °C), was measured in days. Three of the best emulsifiers available on the market were used to test the emulsion stability (Atlox 4914, Span 80 and Tween 80). Emulsified biodiesel 20 (EB20) with 5% and 10% water was used for the stability test at room temperature (refer to Figure 2). Atlox 4914 showed layer separation (Figure 2a) for EB20 emulsion with 10% water in 30 days, whereas the mixture of Span 80 and Tween 80 with HLB of 8.25 showed no layer separation in 30 days (Figure 2b). The delay in layer separation from the Span 80 and Tween 80 mixture indicates better stability than that of Atlox 4914. In fact, EB20 emulsion with 10% water had layer separation after 45 days. The Span 80 and Tween 80 mixture with average HLB of 8.25 showed better emulsion stability than that of Atlox 4914 and therefore, the Span 80 and Tween 80 mixture was used in this study as the stabilizer for emulsion preparation.

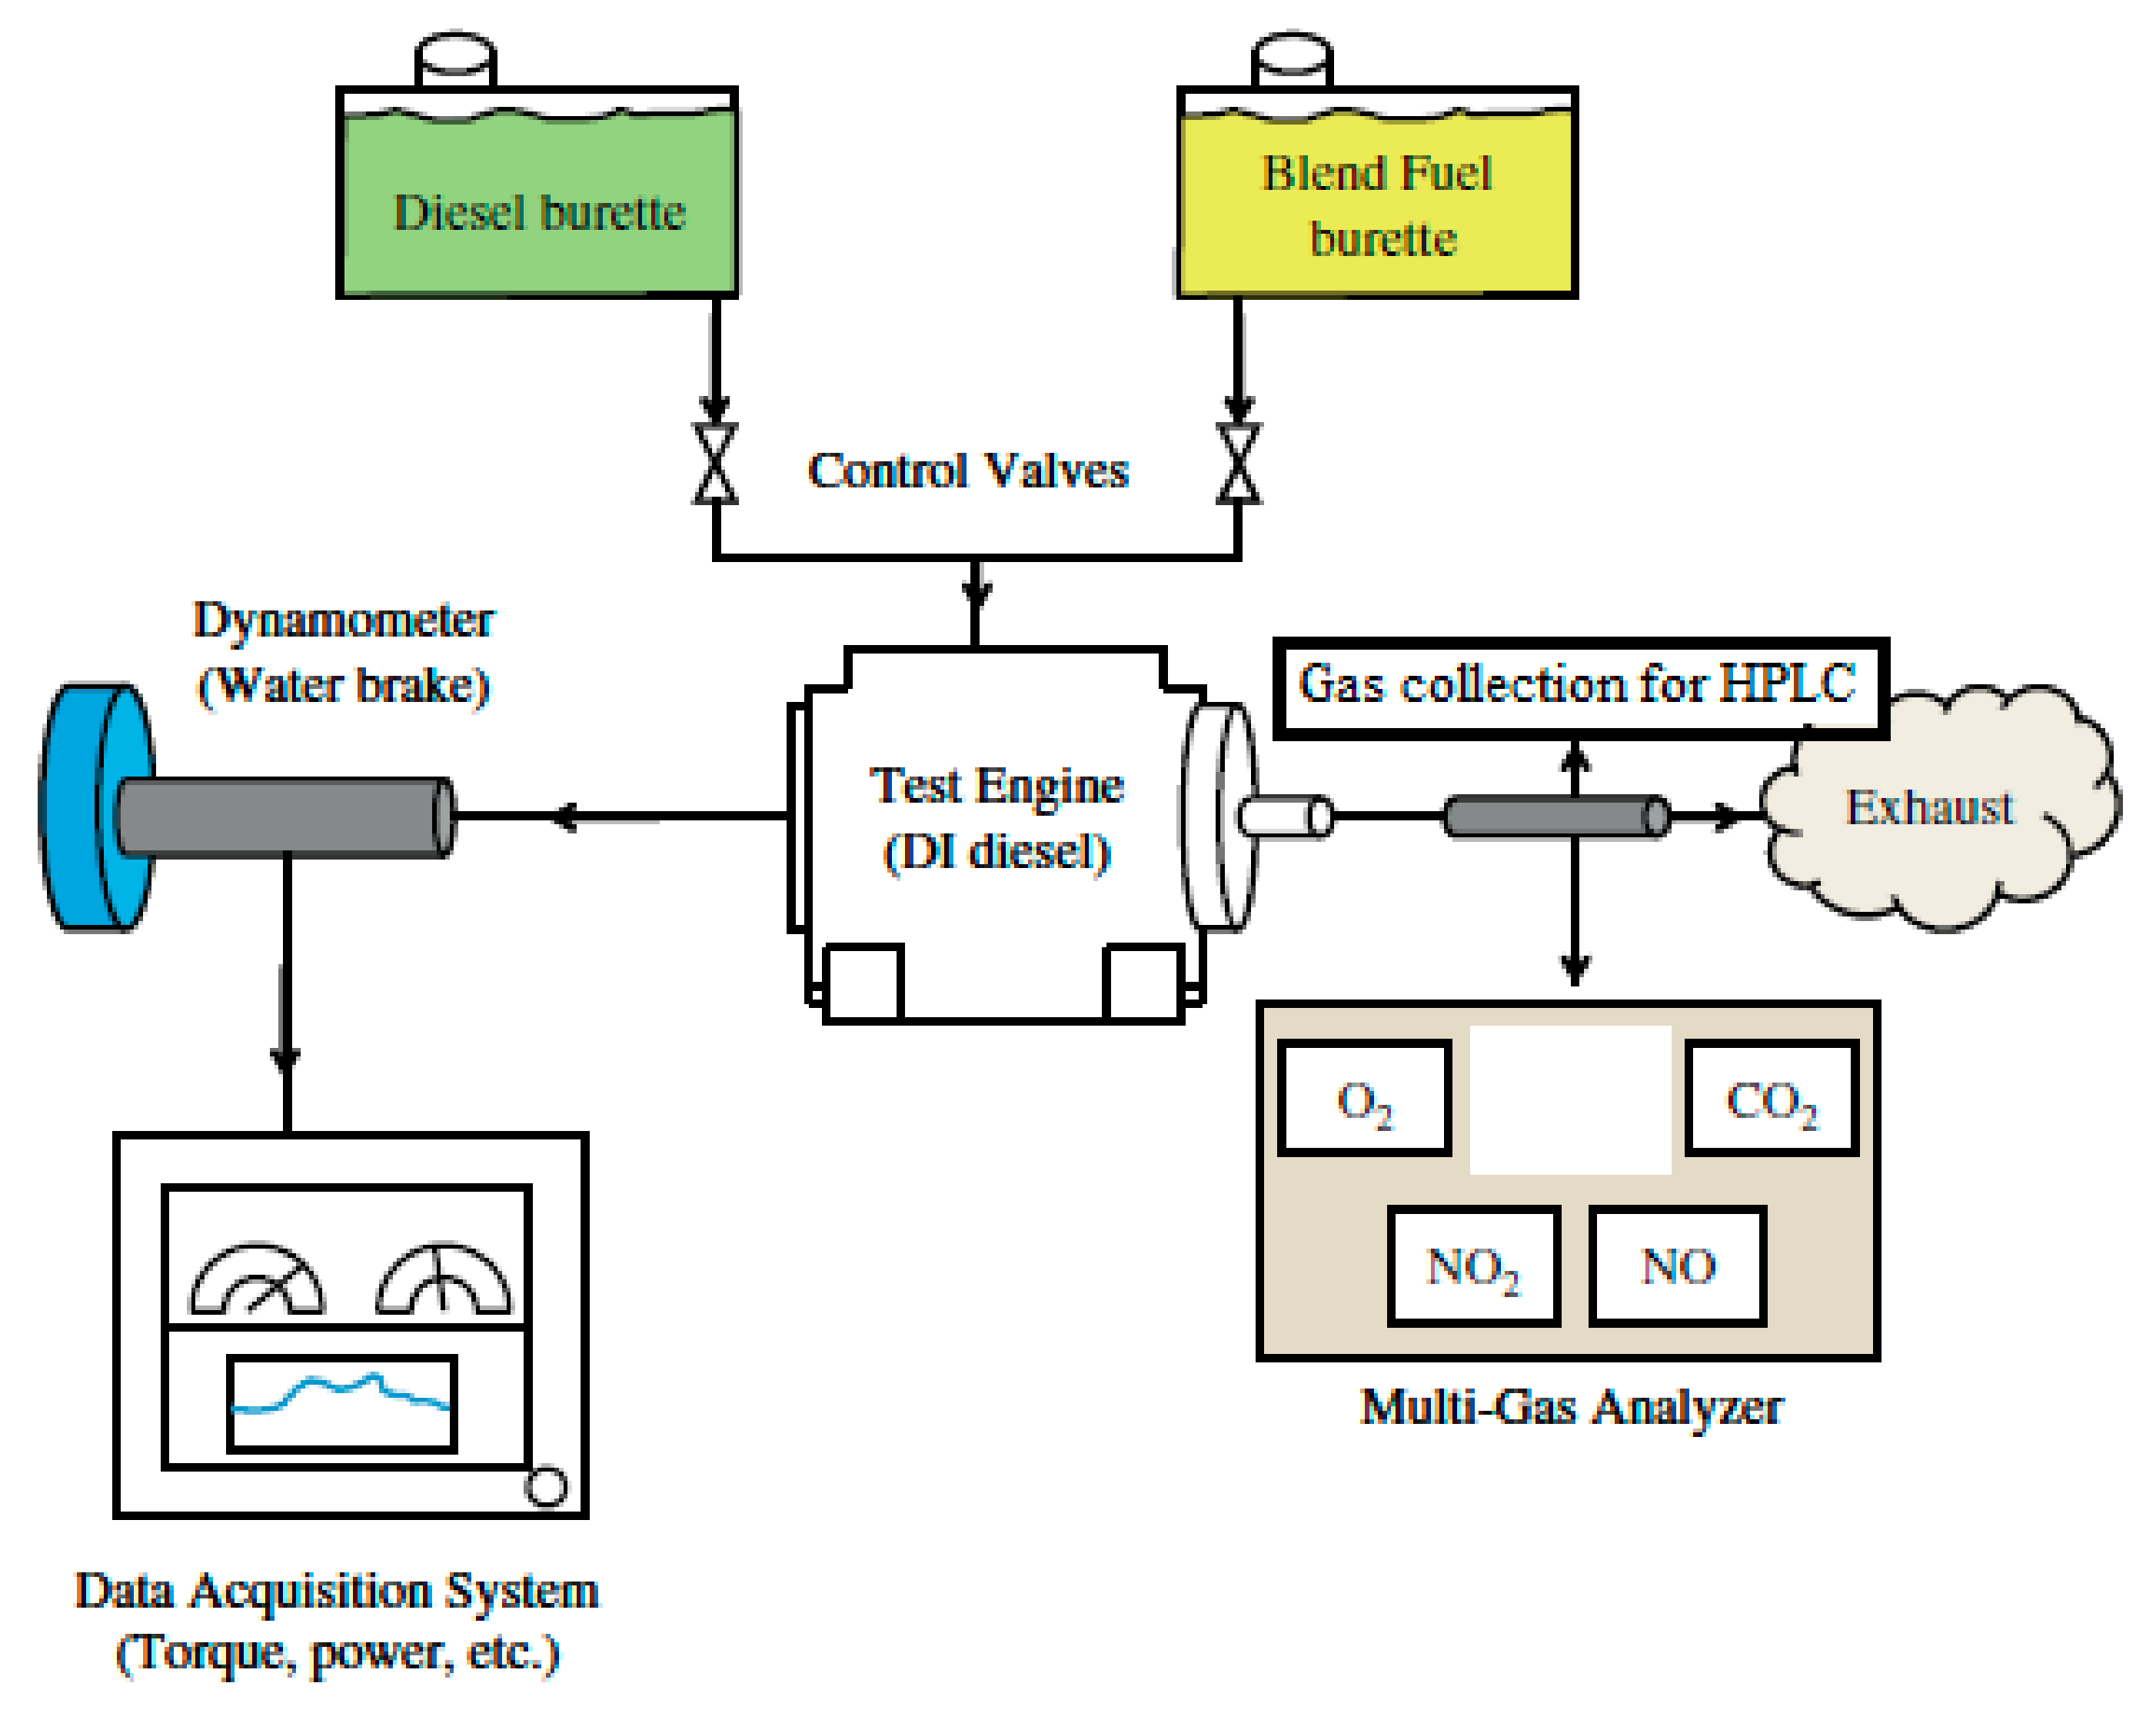
2.6. Engine Specifications and Setup

An air-cooled, 2-cylinder, 4-stroke, light-duty diesel engine with a direct fuel injection system was used in this experiment. The engine specifications are listed in Table 1 and Figure 3 contains a schematic diagram of the diesel engine. The engine was attached to the engine test bed and the exhaust system was connected outside through the roof for ventilation. A hydraulic dynamometer was connected to the engine to apply engine loads. The data acquisition system was connected to a computer system where the data was stored. Engine emission (NOx) was tested under three different engine speeds 1000 rpm (minimum engine speed), 2100 rpm (speed for the maximum torque) and 3000 rpm (speed for the maximum power) and at full load condition. A Nova analyzer was used to measure NO and NO2. The range of NO and NO2 is 0–2000 ppm and 0–800 ppm, respectively. The resolution for both components was 1 ppm, with ± 2% accuracyThe gas analyzer measured the emissions in ppm unit, which was converted to g/kWh according to the formulas in the reference [36]. The absolute mass concentration of NOx was calculated as a sum of measured NO and NO2 mass concentrations. In every test case for NO, NO2 and NOx, data were taken for three repetitions and results were displayed graphically with ± standard error of average value. The engine ran between 10 and 15 min to stabilize the parameters (brake power, torque and rpm) and the data was collected once it stabilized. A USB port was connected to a computer programmed with the data acquisition system. The year-round temperature in the engine lab was 20 °C.

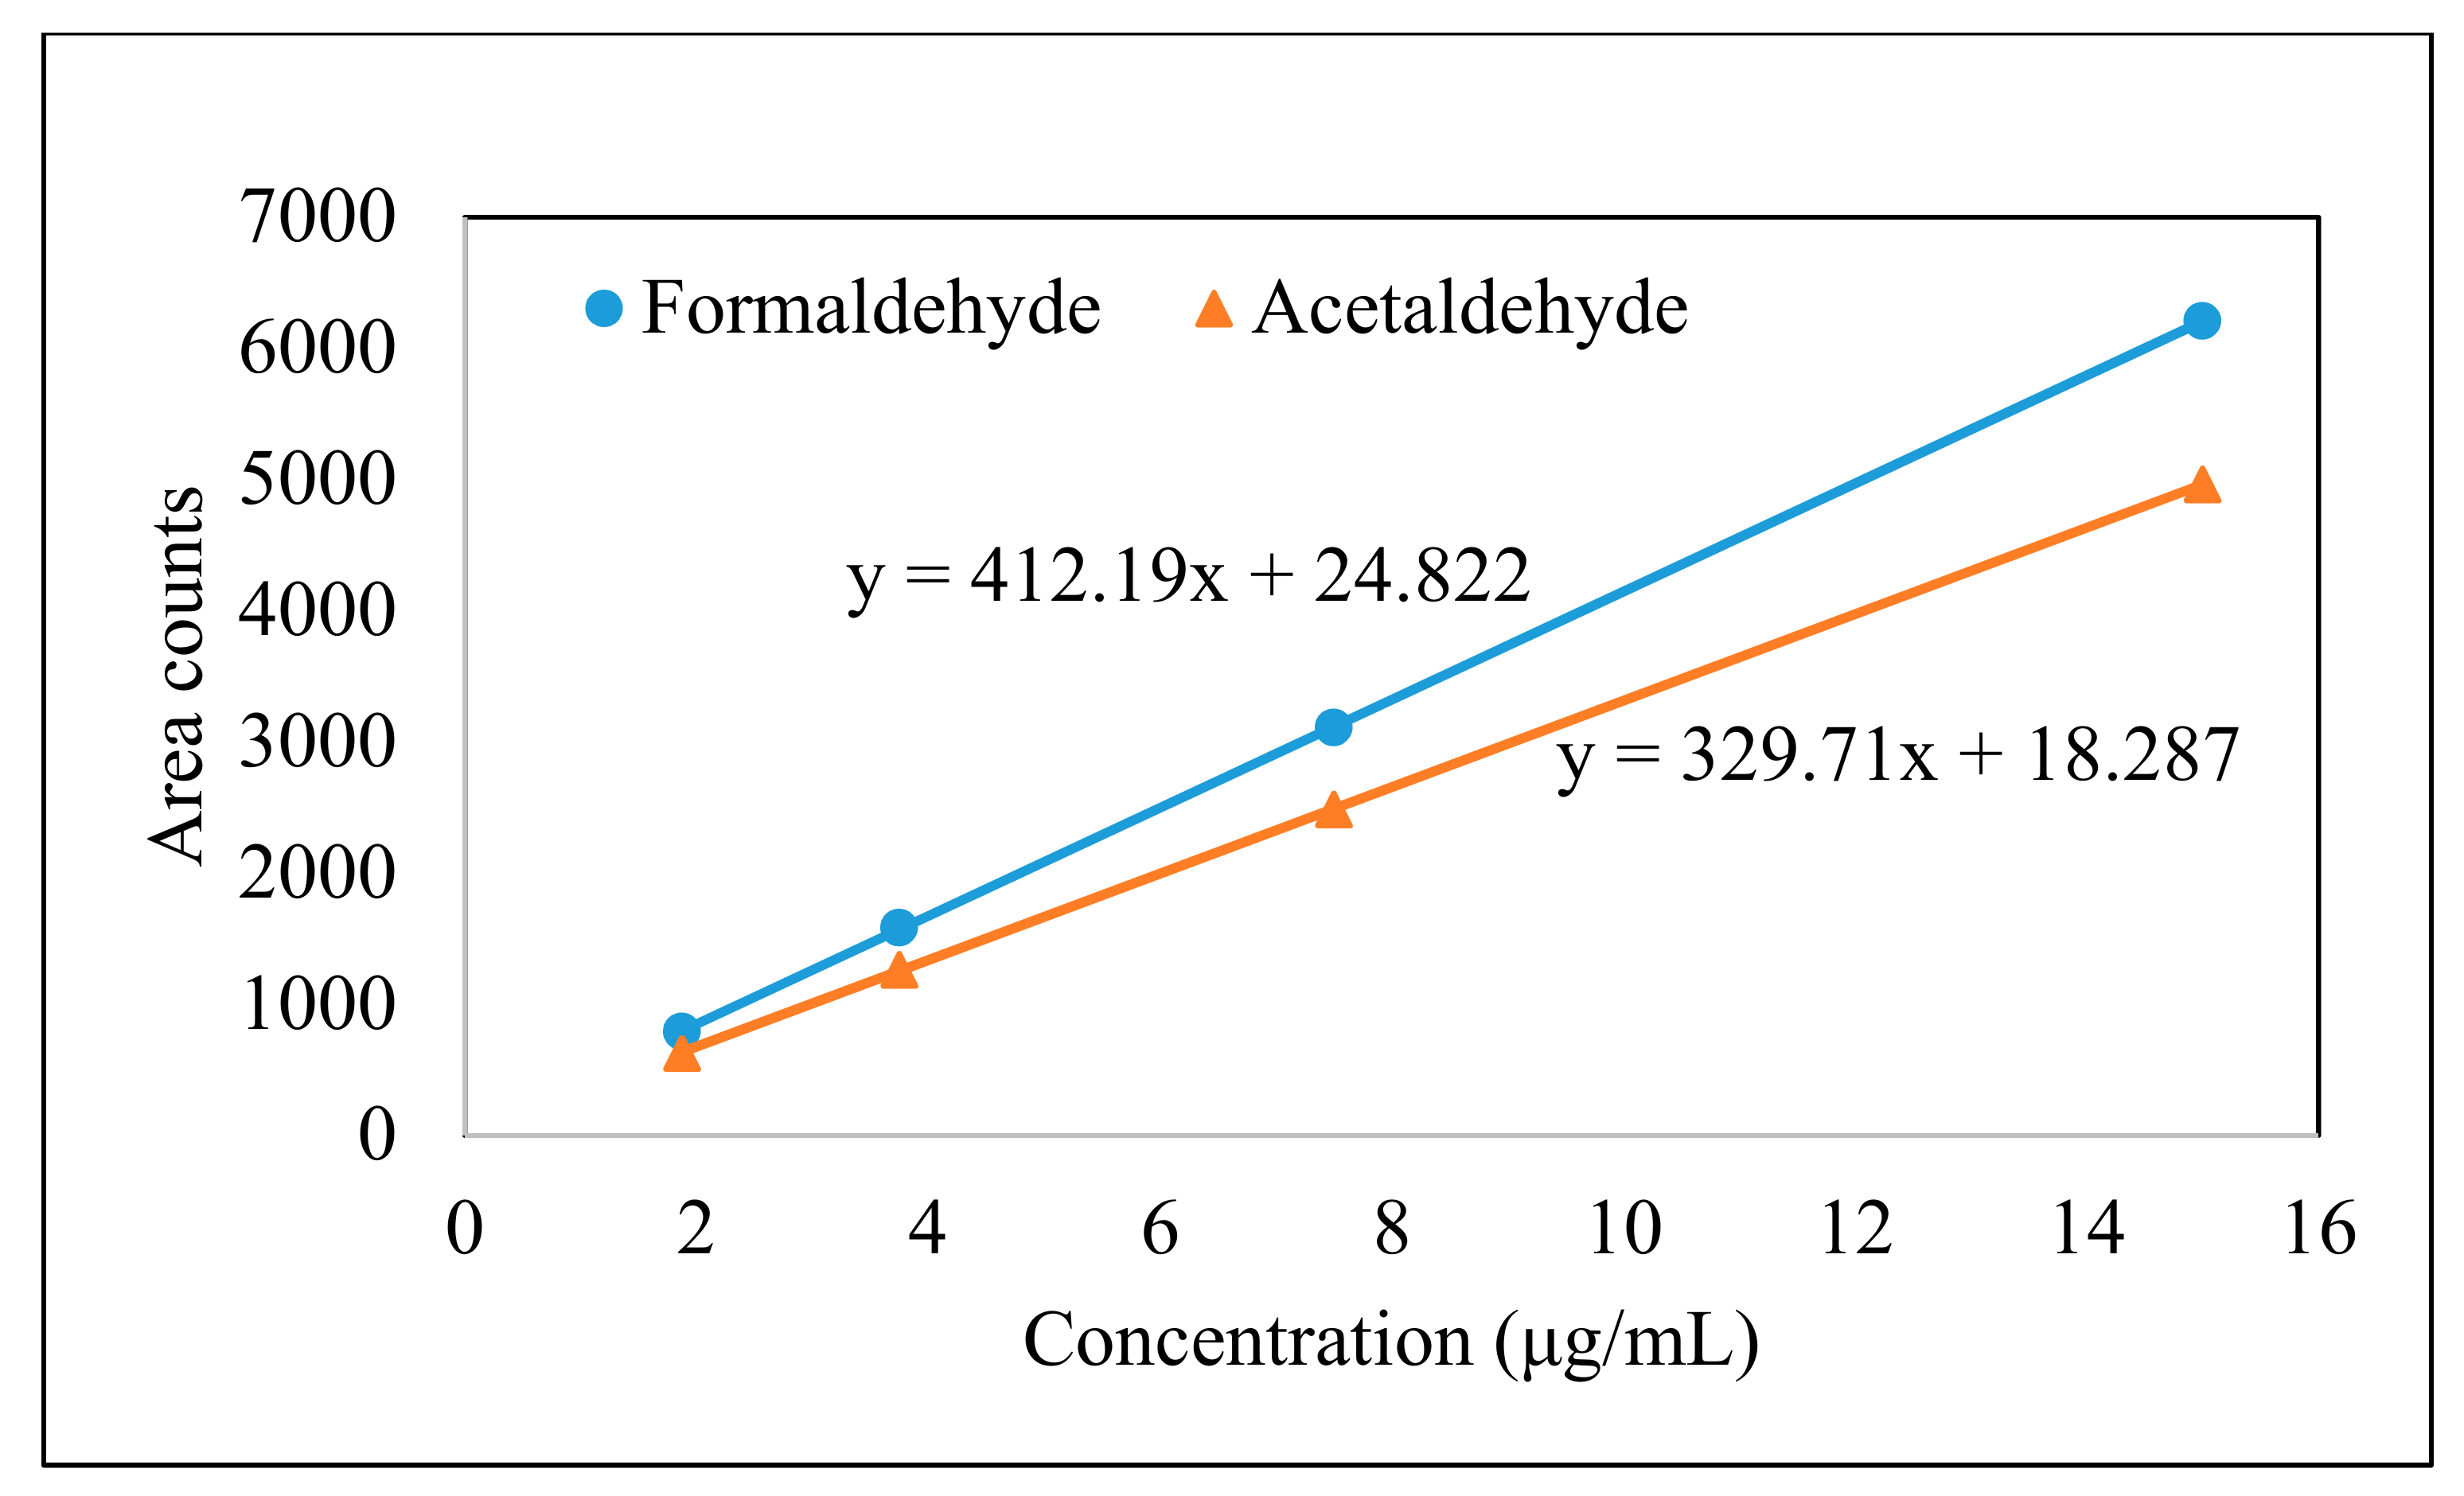
2.7. High Pressure Liquid Chromotagraphy (HPLC) for Aldehyde Analysis

Aldehyde and ketone compounds in exhaust gases were identified and measured by HPLC with ultraviolet (UV) detection in References [37,38]. This study used the bag sampling method similar to the one in Reference [39]. Transient checking is acceptable using the bag sampling method because sampling can be completed in approximately 5 s. Furthermore, the bag sampling method is simpler and less costly. The DNPH was used as the derivatizing reagent to form the corresponding di-nitro phenyl hydrazones and two aldehydes were separated (HCHO and CH3CHO). The other higher aldehyde concentrations in exhaust gas were very minor and could not be separated. In this study, 0.12 g of DNPH was added to 1 L of HPLC-grade acetonitrile [40], followed by 3.92 g of sulphuric acid to render it an absorbing acidic solution. The acidic DNPH solution provided a clear peak in HPLC. The reaction between an aldehyde and acidified DNPH solution is outlined below:
Aldehyde + DNPH = Aldehyde-DNPH derivative + water.
After collecting 10 L of exhaust gas, 20 mL of DNPH solution was poured into the gas sampling bag. The bag was then well shaken to force the solution to properly interact the exhaust gas. 10 µL of the sample solution was injected into the HPLC using an automatic micro-syringe. Two pumps were used to control the gradient program: mixtures of 50:50 HPLC-grade acetonitrile and water and 100% acetonitrile. The sample was sent to the checking column and a UV detector was used to detect the signal from the aldehyde-DNPH derivatives. The output from the detector was sent to a PC-controlled data acquisition system for identification and measurement of the peaks. Figure 4 is a schematic diagram of HPLC [39] and the HPLC conditions are presented in Table 2.
Aldehyde/ketone-DNPH working standard-13 was used for calibration. Working standard-13 contains 13 aldehydes and ketones from formaldehyde to hexanaldehyde in known concentrations. Working standard-13 was first investigated by HPLC in various concentrations. Figure 5 illustrates a typical liquid chromatogram of working standard-13. The different peaks of aldehydes and ketones are indicated by numbers ranging from 1 to 13. The y-axis of the chromatogram is a measure of the intensity of absorbance represented in milli-Absorbance Units (mAU). Table 3 shows peak identification with different peaks with their retention times. To evaluate the equation for calculating aldehydes, standard-13 was run in different concentrations and the standard curves were drawn. Figure 6 shows calibration curves between area counts of the detector and aldehyde concentration of standard samples. Here, two calibration curves are plotted, one for formaldehyde and the other for acetaldehyde, because all the fuels’ exhaust gases contain only formaldehyde and acetaldehyde. There is a linear correlation between the area counts (detector response) and the concentrations of formaldehyde and acetaldehyde. The abscissa indicates the concentration of aldehydes in micrograms (µg) per milliliter (mL) of DNPH-acetonitrile solution. The two equations obtained from the liner regression are as follows:
y = 412.19x + 24.822, for formaldehyde
and
y = 329.71x + 18.287, for acetaldehyde

3. Results

3.1. Fuel Properties

Biodiesel properties are determined and shown in Table 4. All properties are satisfactory within the ASTM limit [36]. The produced biodiesel showed lower cloud point (−5 °C) than the standard type produced from canola oil (−3 °C) [36]. This would extend CTO-biodiesel use over standard biodiesel in the winter. The heating value of CTO biodiesel was about 5% higher than regular biodiesel. Table 5 shows the density, heating value and viscosity of the emulsified fuels. It was noticed that heating value decreased 4.86% and 9%, with 5% and 10% of water emulsions, respectively and that density and viscosity gradual increased when adding more water in the emulsion.

3.2. Emissions

3.2.1. NO, NO2 and NOx Emissions

Figure 7 presents NO, NO2 and NOx emissions of different emulsified fuels at different engine speeds at full load condition. There was a noticeable increasing trend of NO and NO2, as well as of NOx in biodiesel than in diesel. The maximum NO was obtained at 5 g/kWh for B100. B50 or B100 produced similar amounts of NO2 (≈0.9 g/kWh). Both maximum NO or NO2 occurred at 3000 rpm when the in-cylinder temperature was at its highest. As outlined in Figure 7, the average NOx emission for B100 was higher than for B0 by approximately 37%. The results revealed that the higher the percentage of biodiesel in diesel and biodiesel blends, the higher the NOx emissions. The main reason for this phenomenon was the excess amount of oxygen that was present in biodiesel, as well as the higher in-cylinder temperature. B100 contained approximately 12% oxygen and its exhaust temperature was about 10 °C higher than that of B0 [41]. For B0 with 0% water, NOx emissions at 1000 rpm, 2100 rpm and 3000 rpm were 2.72 g/kWh, 3.95 g/kWh and 4.29 g/kWh, respectively, indicating that NOx emissions increased when the engine speed increased. The exhaust gas temperatures (230.2 °C, 280.8 °C and 340.1 °C) were measured at those three engine speeds, respectively [41]. Higher exhaust gas temperatures might be an indication of increased in-cylinder/flame temperature and hence, increased NOx formation. According to the results, NOx emissions decreased when the percentage of water concentration increased from 0% to 10% in the same base fuel and at the same engine operating conditions. Average NOx reduction with 5% water was approximately 3–5%, whereas with 10%, the reduction was 8–14% than without emulsified fuel. NO reduction for B100 with 10% water at 3000 rpm was approximately 10% than B100 with no water, whereas, NO2 reduction for the same fuel and the same water content was about 22%, which is more than double. A similar trend in higher NO2 reduction than NO was also noticed in other diesel-biodiesel blends. Water particles contained in the fuel reduced the flame temperature, thus also reducing NOx formation. The average reduction in exhaust gas temperature was 15–20 °C with 5% water and 27–33 °C with 10% water. Furthermore, higher solubility of NO2 than NO in water is thought to be another reason for higher reduction of NO2 than NO.

3.2.2. Aldehydes Analysis of Exhaust Gas

In this study, aldehydes analysis for all fuels was performed at maximum torque speed (2100 rpm) and at maximum power speed (3000 rpm) at full load condition. The total aldehyde emission trend is similar at both engine speeds. Hence, the results of one engine speed (2100 rpm) are presented in Figure 8, Figure 9, Figure 10 and Figure 11, whereby peak 1 defines formaldehyde, whereas peak 2 represents acetaldehyde, which were obtained from HPLC analysis of exhaust gases for different fuels without and with water-emulsification. The other higher aldehydes and ketones are insignificant or absent.
Figure 8 shows liquid chromatogram of B0: Figure 8a is without emulsion, Figure 8b with 5% water and Figure 8c with 10% water. Peak 1 is formaldehyde at the retention time of 4.070 min and peak 2 is acetaldehyde at 5.064 min. From the detector response (Y-axis), B0 with no emulsification has a formaldehyde peak, which is approximately 250 mAU. However, B0 with 5% water has a formaldehyde peak of only about 80 mAU; the formaldehyde peak for B0 with 10% water is further reduced to about 35 mAU. The area counts under the peaks and corresponding concentrations of formaldehyde and acetaldehyde are presented in Table 6. It is understood from Figure 8, as well as the Y-axis values in Figure 8a–c, that aldehyde emissions gradually decreased with the addition of more water. It is clear that there are no peaks from the previous standard-13 list following the retention time of 5.064 (acetaldehyde). Therefore, no higher aldehyde and ketone emissions are present in this newer diesel engine. However, in a previous publication [39], there were five aldehydes and ketones from older diesel engines: formaldehyde, acetaldehyde, acetone, acrolein and propionaldehyde.
Figure 9a–c present liquid chromatograms of B20 with no water, 5% water and 10% water, respectively. These chromatograms show only the known formaldehyde and acetaldehyde peaks. The trend is similar to that of B0, that is, aldehyde emissions are the highest without emulsification and there is a gradual reduction in aldehyde emissions when adding more water. A few smaller peaks are observed after acetaldehyde peak in the chromatograms of 5% and 10% water-emulsified B20. However, they were not identified as any of the known peaks by the chromatogram program. Again, the area counts and corresponding concentrations of formaldehyde and acetaldehyde are shown in Table 6 for B20 fuel series without and with emulsification.
Figure 10 shows B50 fuel’s chromatograms without emulsification (Figure 10a), with emulsification―5% water (Figure 10b) and with emulsification―10% water (Figure 10c). Total aldehydes without emulsification for B50 is lower than both B20 and B0 (refer to Table 6). Although the chromatogram shows a peak after acetaldehyde with 0% water, the chromatogram program did not recognize this peak as any of the previously-identified peaks. Similarly, a few small peaks after acetaldehyde with 5% and 10% water were not recognized. The trend in aldehyde emission shows a similar pattern: the higher the water content in the fuel, the lower the total aldehydes.
B100 fuel’s chromatograms without emulsification (Figure 11a), with emulsification—5% water (Figure 11b) and with emulsification—10% water (Figure 11c) are presented in Table 6. B100 shows further lower total aldehydes than that of B50. Although a peak after acetaldehyde is seen in the chromatogram of 5% water, the chromatogram program did not recognize this peak. Once again, the higher water content greatly reduced the total aldehydes.
Table 6 presents areas under formaldehyde and acetaldehyde peaks, as well as their corresponding concentrations in μg/mL of DNPH-acetonitrile solution. Equations (1) and (2) derived from standard curves are used for this calculation. The last column indicates the final concentration of formaldehyde and acetaldehyde in exhaust gases. The following calculation is used to convert μg/mL to mg of aldehydes/m3 of exhaust gas:
Sample calculation for B0—0% water: formaldehyde is 6.210 μg/mL. This means that 1 mL DNPH-acetonitrile solution collects 6.210 μg of formaldehyde. As 20 mL DNPH-acetonitrile solution is used in 10 L of exhaust gas, the formaldehyde is 6.210 × 20 = 124.2 μg in 10 L of exhaust gas. Therefore, it is (124.2/10) × 1000 = 12,420 μg per m3 of exhaust gas. The formaldehyde value in mg is 12,420/1000, which is 12.42 mg/m3. Similarly, the acetaldehyde value of 0.241 μg/mL is equivalent to 0.482 mg/m3. It is obtained from the last column of Table 6 that formaldehyde reductions with 5% water in diesel-biodiesel blends are 68–81% and with 10% water, the reductions are 84–90%. Acetaldehyde reductions with 5% water for different fuels are 89–96%. Reductions are 94–99% with 10% water except for pure diesel, whereas diesel with 5% water shows only 53%. In diesel with 10% water, acetaldehyde reduction is about 67%. Therefore, 5–10% water-emulsification of B20, B50 and B100 emerged as an excellent method of total aldehyde reductions from the exhaust in diesel engines. Water emulsification is also very effective to reduce total aldehyde emissions for pure diesel fuel. Formaldehyde emission gradually and consistently decreases with a higher amount of biodiesel in the blend without emulsification; however, acetaldehyde emission increases up to B50 and then decreases for B100. This type of inconsistent emissions of acetaldehyde and acetone were also found in Reference [30]. Therefore, further investigations are necessary to confirm the trends of all aldehydes for diesel-biodiesel blends without emulsification at different engine running conditions.
Figure 12 illustrates the total amount of aldehydes present in the exhaust gases in the different diesel-biodiesel blends and their emulsions. According to the figure, the total amount of aldehydes was higher in B0 fuel than in B100 (12.902 mg/m3 and 8.444 mg/m3, respectively). This means that B100 emitted about 35% less total aldehydes than B0. The higher the percentage of biodiesel in the blend, the lower the total aldehydes present in the exhaust gas. A similar pattern in aldehyde reduction was reported in ref. [30], where carbonyl pollutants of diesel engine fueled with B0, B50 and B100 were tested. The formaldehyde content was the highest—more than 80% of the total carbonyl pollutants. Within the entire engine load, the total carbonyl pollutants concentration for B0 was higher than B50 and B100. Formaldehyde emissions were reported 23% lower for B20 fuel (20% biodiesel from waste cooking oil and 80% diesel) than that of B0 fuel in Reference [32]. In this study, formaldehyde reduction with CTO B20 is only about 5%, whereas they are 28% with B50 and 35% with B100. Higher flame temperatures with higher percentage of biodiesel in diesel-biodiesel blends are responsible for aldehyde reduction [30].
The decreasing trend in aldehyde was also obtained from the increase in water percentage into the fuels examined in this study. For example, the amounts were 12.902 mg/m3 and 2.132 mg/m3 for B0 with 0% water and B0 with 10% water, respectively (approximately 83.5% lower). This reduction is comparable with a previous research report [28], where the average total aldehyde reduction by water-washing was 85%. The water-washing was used as an external method (outside of the cylinder) of aldehyde and ketone reduction in that study. However, the water-emulsification technique in this study is an internal method (inside of the cylinder) to reduce aldehydes. Therefore, water-emulsification to modify the combustion inside the cylinder is equally effective to that of water-washing for aldehyde reduction. The average reduction of total aldehydes for B20, B50 and B100 with 5% water was approximately 80%; a 90% reduction was observed with 10% water compared to non-emulsified blends. It is known from a previous publication [38] that the higher the aldehyde, the higher the odor and irritation. Therefore, emulsified diesel-biodiesel blends have fewer odor and irritation effects than diesel fuel.

4. Conclusions

Fatty acids extracted from crude tall oil were utilized for the production of biodiesel through acidic esterification reaction in this study. The yield of tall oil fatty acids from crude tall oil was 48% and the final yield of biodiesel production was 85% of tall oil fatty acids. The properties of biodiesel are found satisfactory (i.e., within the ASTM limit). Moreover, the produced biodiesel has a 2 °C lower cloud point than the standard type produced from canola oil.
Afterwards, diesel, biodiesel and their blends were emulsified with different percentages of water (5% and 10%). Furthermore, the fuels were investigated by conducting tests on a light-duty diesel engine to explore NOx and aldehyde emissions. At maximum load engine test condition, where the engine produced the maximum power, B100 produced 37% more NOx than B0. Water-emulsification of diesel-biodiesel blends reduced NOx emissions than that of non-emulsified fuels. NOx reduction of 3–5% was achieved with 5% water, whereas with 10% water, NOx reduction was 8–14% than without emulsified fuels. Furthermore, NO2 reduction was much higher than that of NO reduction for emulsified fuels, suggesting that high solubility of NO2 may have played an important role.
HPLC with UV detection was successful in identifying and measuring aldehydes in diesel exhaust gas by using the bag-sampling method. The presence of two aldehydes (formaldehyde and acetaldehyde) in diesel exhaust gas is significant for emulsified diesel-biodiesel blends, of which formaldehyde was higher than 90%. B100 emits 35% less total aldehydes than B0 without emulsification. 5–10% water-emulsification of B20, B50 and B100 emerged as an excellent method of total aldehyde reduction from the exhaust in diesel engines. The average reduction of total aldehydes for biodiesel blends with 5% water emulsion compared to that with no emulsion was about 80%; with 10% water emulsion, the total aldehydes were nearly 90% less than non-emulsified blends, which are substantial reductions. As it has been proven that higher aldehydes create higher exhaust odor and irritation from diesel exhaust, water-emulsified diesel-biodiesel fuel blends can be an excellent replacement for pure diesel fuel.

Author Contributions

Conceptualization, M.M.R. and M.N.A.; methodology, M.S.I.; software, M.S.I.; validation, M.M.R., M.S.I. and M.N.A.; formal analysis, M.S.I.; investigation, M.S.I.; resources, M.M.R.; data curation, M.S.I.; writing—original draft preparation, M.M.R.; writing—review and editing, M.M.R.; visualization, M.M.R.; supervision, M.M.R. and M.N.A.; project administration, M.M.R.; funding acquisition, M.N.A. All authors have read and agreed to the published version of the manuscript.

Funding

This research was funded by the Natural Science and Engineering Council of Canada (NSERC), grant number RGPIN-2017-05355 (Md Nur Alam) and The APC was funded by RGPIN-2017-05355.

Data Availability Statement

Data is contained within the article.

Acknowledgments

The authors would like to thank Resolute Forest Products for providing us with crude tall oil. We also wish to acknowledge the financial support provided by the NSERC discovery grant (No. RGPIN-2017-05355), which made it possible to complete this project. Thanks also to the following individuals at Lakehead University for their assistance throughout this project: Shrikanta Sutradhar, Chemistry student, Joe Ripku, Technologist in the Mechanical Engineering Department and Greg Kepka, Technologist in the Instrumentation Lab.

Conflicts of Interest

The authors declare no conflict of interest.

References

  1. Sheehan, J.; Camobreco, V.; Duffield, J.; Graboski, M.; Shapouri, H. Life Cycle Inventory of Biodiesel and Petroleum Diesel for Use in an Urban Bus. Final Report for US Department of Energy’s Office of Fuel Development and the US Department of Agriculture’s Office of Energy by the National Renewable Energy Laboratory. NERL/SR-580-24089. 1988. Available online: https://doi.org/10.2172/658310 (accessed on 1 May 1998).
  2. US Environmental Protection Agency. A Comprehensive Analysis of Biodiesel Impacts on Exhaust Emissions. EPA420-P-02-001. 2002. Available online: https://nepis.epa.gov/Exe/ZyPDF.cgi/P1001ZA0.PDF?Dockey=P1001ZA0.PDF (accessed on 1 October 2002).
  3. Kannan, G.R.; Karvembu, R.; Anand, R. Effect of metal-based additive on performance emission and combustion characteristics of diesel engine fueled with biodiesel. Appl. Energy 2011, 88, 3694–3703. [Google Scholar] [CrossRef]
  4. Di, Y.; Cheung, C.; Huang, Z. Experimental investigation on regulated and unregulated emissions of a diesel engine fueled with ultra-low sulfur diesel fuel blended with biodiesel from waste cooking oil. Sci. Total. Environ. 2009, 407, 835–846. [Google Scholar] [CrossRef] [PubMed]
  5. Buyukkaya, E. Effects of biodiesel on a DI diesel engine performance, emission and combustion characteristics. Fuel 2010, 89, 3099–3105. [Google Scholar] [CrossRef]
  6. Ng, J.-H.; Ng, H.K.; Gan, S. Characterization of engine-out responses from a light duty diesel engine fueled with palm methyl ester (PME). Appl. Energy 2012, 90, 58–67. [Google Scholar] [CrossRef]
  7. Hazar, H. Cotton methyl ester usage in a diesel engine equipped with insulated combustion chamber. Appl. Energy 2010, 87, 134–140. [Google Scholar] [CrossRef]
  8. Sun, J.F.; Caton, J.A.; Jacobs, T.J. Oxides of nitrogen emissions from biodiesel-fueled diesel engines. Prog. Energy Combust. Sci. 2010, 36, 677–695. [Google Scholar] [CrossRef]
  9. Xue, J.; Grift, T.E.; Hansen, A.C. Effect of biodiesel on engine performances and emissions. Renew. Sustain. Energy Rev. 2011, 15, 1098–1116. [Google Scholar] [CrossRef]
  10. Singh, P.; Chauhan, S.R.; Goel, V.; Gupta, A.K. Enhancing Diesel Engine Performance and Reducing Emissions Using Binary Biodiesel Fuel Blend. J. Energy Resour. Technol. 2020, 142, 1–28. [Google Scholar] [CrossRef]
  11. Roy, M.M. Charcoal-adsorption, water-washing, and air-dilution systems to reduce diesel emissions with special emphasis on odor reduction. J. Energy Resour. Technol. 2007, 129, 338–347. [Google Scholar] [CrossRef]
  12. Roy, M.M.; Parvez, R.; Sarker, R.I. Exhaust odor and smoke rduction of stationary DI diesel engines to acceptable level by water-scrubbing and air-dilution system. Appl. Energy 2011, 88, 2391–2399. [Google Scholar] [CrossRef]
  13. Kameoka, Y.; Pigford, R.L. Absorption of Nitrogen Dioxide into Water, Sulfuric Acid, Sodium Hydroxide, and Alkaline Sodium Sulfite Aqueous Solutions. Ind. Eng. Chem. Fundam. 1977, 16, 163–169. [Google Scholar] [CrossRef]
  14. Abdul Karim, Z.A.; Khan, M.Y.; Aziz, A.R.A. Evolution of microexplosion phenomenon in parent–child droplets of water in biodiesel emulsions enhanced by different surfactant dosages and hydrophilic–lipophilic balance values. J. Energy Resour. Technol. 2019, 141, 102204–102217. [Google Scholar] [CrossRef]
  15. Senthil, R.; Arunan, K.; Silambarasan, R. Experimental investigation of a diesel engine fueled with emulsified biodiesel. Int. J. ChemTech Res. 2015, 8, 190–195. [Google Scholar] [CrossRef]
  16. Cook, D.H.; Law, C.K. A preliminary study on the utilization of water-in-oil emulsions in diesel engines. Combust. Sci. Technol. 1978, 18, 217–221. [Google Scholar] [CrossRef]
  17. Law, C.K. A model for the combustion of oil/water emulsion droplets. Combust. Sci. Technol. 1977, 17, 29–38. [Google Scholar] [CrossRef]
  18. Lawson, A.; Vergeer, E.C.; Mitchell, E.W.; Dainty, E.D. Heavy-Duty Diesel Emission Control: A Review of Technology; CIM: Montreal, QC, Canada, 1986; Volume 36, p. 238. [Google Scholar]
  19. Srivastava, S.P. AQUAZOLE: Practical Experience Using a Diesel/Water Emulsion. Int. Symp. Fuels Lubr. 2000, 2, 435–444. [Google Scholar] [CrossRef]
  20. Elsanusi, O.A.; Roy, M.M.; Sidhu, M.S. Experimental investigation on a diesel engine fueled by diesel-biodiesel blends and their emulsions at various engine operating conditions. Appl. Energy 2017, 203, 582–593. [Google Scholar] [CrossRef]
  21. Rounds, F.G.; Pearsall, H.W. Diesel Exhaust Odor Its Evaluation and Relation to Exhaust Gas Composition. SAE Tech. Pap. Ser. 1957, 65, 608–627. [Google Scholar] [CrossRef]
  22. Tanaka, T.; Kobashi, K.; Sami, H. Development of a diesel odor measurement method and its application to odor reduction. SAE Tech. Pap. 1992, 920726. [Google Scholar] [CrossRef]
  23. Roy, M.M.; Tsunemoto, H.; Ishitani, H.; Akiyama, J.; Minami, T.; Noguchi, M. Influence of Aldehyde and Hydrocarbon Components in the Exhaust on Exhaust Odor in DI Diesel Engines. SAE Tech. Pap. Ser. 2000, 4, 2398–2405. [Google Scholar] [CrossRef]
  24. Roy, M.M.; Tsunemoto, H. Investigation of odorous components and improvement in odor assessment procedure in DI diesel engines. SAE Tech. Pap. 2002, 1, 2875. [Google Scholar] [CrossRef]
  25. Shiozaki, T. Study of the white smoke and the odor of DI diesel engines in a cold weather environment. Proc. JSAE 1991, 912247, 57–60. [Google Scholar]
  26. Roy, M.M. Normal heptane-diesel combustion and odorous emissions in direct-injection diesel engines. J. Energy Resour. Technol. 2008, 13, 11101–11108. [Google Scholar] [CrossRef]
  27. Stephenson, R.M. Mutual solubility of water and aldehydes. J. Chem. Eng. Data 1993, 38, 630–633. [Google Scholar] [CrossRef]
  28. Roy, M.M. Effect of engine operation parameters, fuel property and exhaust gas treatment on exhaust odor in direct injection diesel engines. Proc. Inst. Mech. Eng. Part D J. Automob. Eng. 2006, 220, 595–609. [Google Scholar] [CrossRef]
  29. Roy, M.M. Performance and emissions of a diesel engine fueled by diesel-biodiesel blends with special attention to exhaust odor. Can. J. Mech. Sci. Eng. 2011, 2, 1–10. [Google Scholar] [CrossRef]
  30. Ruina, L.; Wang, Z.; Xu, G. Study on Carbonyl Emissions of Diesel Engine Fueled with Biodiesel. Int. J. Chem. Eng. 2017, 2017, 1–12. [Google Scholar] [CrossRef]
  31. Peng, C.-Y.; Yang, H.-H.; Lan, C.-H.; Chien, S.-M. Effects of the biodiesel blend fuel on aldehyde emissions from diesel engine exhaust. Atmos. Environ. 2008, 42, 906–915. [Google Scholar] [CrossRef]
  32. Adewale, P.; Vithanage, L.N.; Christopher, L. Optimization of enzyme-catalyzed biodiesel production from crude tall oil using Taguchi method. Energy Convers. Manag. 2017, 154, 81–91. [Google Scholar] [CrossRef]
  33. Keskin, A.; Gürü, M.; Altıparmak, D. Biodiesel production from tall oil with synthesized Mn and Ni based additives: Effects of the additives on fuel consumption and emissions. Fuel 2007, 86, 1139–1143. [Google Scholar] [CrossRef]
  34. Islam, M.S.; Christopher, L.P.; Alam, M.N. Separation and purification of ω-6 linoleic acid from crude tall oil. Separations 2020, 7, 9. [Google Scholar] [CrossRef] [Green Version]
  35. Chen, J.; Zhang, P. Preparation and characterization of nano-sized phase change emulsions as thermal energy storage and transport media. Appl. Energy 2017, 190, 868–879. [Google Scholar] [CrossRef]
  36. Roy, M.M.; Wang, W.; Bujold, J. Biodiesel production and comparison of emissions of a DI diesel engine fueled by biodiesel–diesel and canola oil–diesel blends at high idling operations. Appl. Energy 2013, 106, 198–208. [Google Scholar] [CrossRef]
  37. California Air Resources Board. California Non-Methane Organic Gas Test Procedure. 1993. Available online: https://ww2.arb.ca.gov/sites/default/files/2019-09/nmogtps_2017%2B%20MY_clean%20complete_10-15_accessible.pdf (accessed on 2 September 2015).
  38. Iwamoto, A.; Sasaki, S.; Tsuruga, F. Sampling and HPLC analysis of aldehydes in automobile exhaust gas. J. Jpn. Automob. Res. Inst. 1996, 18, 22–27. [Google Scholar] [CrossRef]
  39. Roy, M.M. HPLC analysis of aldehydes in automobile exhaust gas: Comparison of exhaust odor and irritation in different types of gasoline and diesel engines. Energy Convers. Manag. 2008, 49, 1111–1118. [Google Scholar] [CrossRef]
  40. Reşitoğlu, İ.A.; Altinişik, K.; Keskin, A. The pollutant emissions from diesel-engine vehicles and exhaust aftertreatment systems. Clean Technol. Environ. Policy 2005, 17, 15–27. [Google Scholar] [CrossRef] [Green Version]
  41. Sidhu, M.S.; Roy, M.M.; Wang, W. Glycerine emulsions of diesel-biodiesel blends and their performance and emissions in a diesel engine. Appl. Energy 2018, 230, 148–159. [Google Scholar] [CrossRef]
Figure 1. Flowchart of biodiesel production from raw crude tall oil (CTO) and their blends with emulsifications.
Processes 09 00126 g001
Figure 2. Stability test of emulsified B20 with 10% water with Atlox 4914 and mixture of Span 80 and Tween 80. (a) EB20W10% (Atlox 4914, layer separation); (b) EB20W10% (Span and Tween 80, no layer separation).
Processes 09 00126 g002
Figure 3. Schematic diagram of the engine test.
Processes 09 00126 g003
Figure 4. Schematic diagram of HPLC.
Processes 09 00126 g004
Figure 5. Experimental liquid chromatogram of standard-13.
Processes 09 00126 g005
Figure 6. Calibration between area and two aldehyde concentrations of standard samples.
Processes 09 00126 g006
Figure 7. NO, NO2 and NOx emission of different fuel blends at different engine speeds. (a) NO emission; (b) NO2 emission; (c) NOx emission.
Processes 09 00126 g007
Figure 8. Liquid chromatogram of B0, (a) no emulsion, (b) 5% water, (c) 10% water.
Processes 09 00126 g008
Figure 9. Liquid chromatogram of B20, (a) no emulsion, (b) 5% water, (c) 10% water.
Processes 09 00126 g009
Figure 10. Liquid chromatogram of B50, (a) no emulsion, (b) 5% water, (c) 10% water.
Processes 09 00126 g010
Figure 11. Liquid chromatogram of B100, (a) no emulsion, (b) 5% water, (c) 10% water.
Processes 09 00126 g011
Figure 12. Total aldehydes in exhaust gases of different fuel blends.
Processes 09 00126 g012
Table 1. Engine Specifications.
Engine ParameterSpecifications
Engine make and modelHATZ 2G40
Engine type4-stroke, air-cooled
Number of cylinders2
Bore/stroke92 mm/75 mm
Displacement997 cc
Compression ratio20.5:1
Mean piston speed at 3000 rpm7.5 m/s
Continuous rated power13.2 kW @ 3000 rpm
Maximum power15.6 kW @ 3600 rpm
Maximum torque50.1 N.m @ 2100 rpm
Table 2. Specifications of HPLC for Aldehyde and Ketone Test.
Analysis MethodHPLC-UV
Main columnZorbax Eclipse XDB-C18
Guard columnInertsil ODS 1 cm
Column temperature50 °C
Mobile phase50%:50% = water:acetonitrile
Flow rate of sample0.8 mL/min
Total time20 min
Wavelength365 nm
Table 3. Aldehyde and Ketone Peak Identification.
Peak No.IdentificationRetention Time (min)
1Formaldehyde4.070
2Acetaldehyde5.064
3Acetone6.334
4Acrolein6.512
5Propionaldehyde7.106
6Crotanaldehyde8.504
72-Butanone9.254
8Methacrolein9.682
9n-Butyraldehyde9.933
10Benzaldehyde11.092
11Valeraldehyde14.438
12m-Tolualdehyde16.010
13Hexanaldehyde21.501
Table 4. Biodiesel Properties.
Name of PropertiesTesting MethodBiodiesel
Cetane indexASTM D473750.84
Glycerol contentASTM D76370
Cloud pointASTM D2500−5 °C
Copper corrosionASTM D1301
Acid numberAcid base titration0.46 mg KOH/g
Kinematic viscosityASTM D4455.7 cSt
Calorific valueBomb calorimeter41.3 MJ
Water and sedimentASTM D1796<0.005%
Flash pointASTM D9387 °C
Sulphur contentASTM D54531200 ppm
Carbon residueASTM D1890.01%
Sulfated ashASTM D8740.01%
Table 5. Properties of Emulsified Fuels.
Name of FuelDensity
(kg/m3)
Heating Value
(MJ/kg)
Viscosity
(cSt @ 40 °C)
B0 W0%84043.21.74
B0 W5%85741.12.46
B0 W10%87639.32.67
B20 W0%84742.822.24
B20 W5%87540.752.87
B20 W10%88138.952.96
B50 W0%85642.253.02
B50 W5%87840.23.62
B50 W10%88438.43.78
B100 W0%86741.35.70
B100 W5%88339.35.81
B100 W10%88737.66.0
Table 6. Area under the Peaks and Their Corresponding Concentrations for Different Fuels.
Name of FuelArea under Formaldehyde PeakFormaldehyde Concentration (μg/mL)Area under Acetaldehyde PeakAcetaldehyde Concentration (μg/mL)Formaldehyde + Acetaldehyde in Exhaust Gas (mg/m3)
B0 W0%2584.326.21097.770.24112.420 ± 0.482
B0 W5%853.162.00555.780.1144.010 ± 0.228
B0 W10%4320.98844.090.0781.976 ± 0.156
B20 W0%2464.415.919177.580.48311.838 ± 0.966
B20 W5%486.41.12032.640.0442.240 ± 0.088
B20 W10%301.430.67128.200.0301.342 ± 0.060
B50 W0%1866.84.469238.30.6678.938 ± 1.334
B50 W5%468.51.07626.090.0242.152 ± 0.048
B50 W10%219.30.47222.680.0130.944 ± 0.026
B100 W0%1686.614.03281.070.1908.064 ± 0.380
B100 W5%342.470.77124.950.0201.542 ± 0.040
B100 W10%187.670.39518.980.0020.790 ± 0.004
Publisher’s Note: MDPI stays neutral with regard to jurisdictional claims in published maps and institutional affiliations.

