Article

Optimization of Antimony Removal by Coagulation-Flocculation-Sedimentation Process Using Response Surface Methodology

1
Institute of Environmental Sciences and Engineering (IESE), School of Civil and Environmental Engineering (SCEE), National University of Sciences and Technology (NUST) H-12 Campus, Islamabad 44000, Pakistan
2
Department of Chemical Engineering, Quaid-e-Awam University of Engineering, Science and Technology (QUEST), Nawabshah Sindh 67480, Pakistan
3
Graduate School of Water Resources, Sungkyunkwan University (SKKU), 2066, Suwon 16419, Korea
4
Department of Civil Engineering, Quaid-e-Awam University of Engineering, Science and Technology (QUEST), Campus Larkana, Sindh 77110, Pakistan
5
Shandong Key Laboratory of Water Pollution Control and Resource Reuse, School of Environmental Science and Engineering, Shandong University, Qingdao 266200, China
6
Department of Chemistry, Quaid-i-Azam University, Islamabad 45320, Pakistan
*
Author to whom correspondence should be addressed.
Processes 2021, 9(1), 117; https://doi.org/10.3390/pr9010117
Submission received: 14 December 2020 / Revised: 2 January 2021 / Accepted: 5 January 2021 / Published: 7 January 2021
(This article belongs to the Special Issue Wastewater Treatment Processes)

Abstract

:
Coprecipitation-adsorption plays a significant role during coagulation-flocculation-sedimentation (C/F/S) of antimony (Sb) in water. This work uses a Box–Behnken statistical experiment design (BBD) and response surface methodology (RSM) to investigate the effects of major operating variables such as initial Sb(III, V) concentration (100–1000 µg/L), ferric chloride (FC) dose (5–50 mg/L), and pH (4–10) on redox Sb species. Experimental data of Sb(III, V) removal were used to determine response function coefficients. The model response value (Sb removal) showed good agreement with the experimental results. FC showed promising coagulation behavior of both Sb species under optimum pH (6.5–7.5) due to its high affinity towards Sb species and low residual Fe concentration. However, a high dose of 50 mg/L of FC is required for the maximum (88–93%) removal of Sb(V), but also for the highest (92–98%) removal of low initial concentrations of Sb(III). Furthermore, BBD and RSM were found to be reliable and feasible for determining the optimum conditions for Sb removal from environmental water samples by a C/F/S process. This work may contribute to a better understanding and prediction of the C/F/S behavior of Sb(III, V) species in aqueous environments, to reduce potential risks to humans.

Graphical Abstract

1. Introduction

Antimony (Sb) has been used extensively worldwide in various commercial applications, including the manufacture of chemicals, plastics, batteries, ceramics, semiconductor materials, and flame retardants [1,2]. As a result, inorganic antimony (trivalent antimony (Sb[III]) and pentavalent antimony (Sb[V])) shows elevated concentrations in natural water bodies in different parts of the world. For example, Sb concentrations of 239, 6384, and 157 µg/L have been found in Stampede and Slate Creek watersheds (Alaska, USA), rivers around antimony mines in the Xikuangshan area (Hunan Province, China), and lakes in the South East region (Sindh, Pakistan), respectively [3,4,5]. Oral uptake of water-soluble Sb into the human body imparts toxic health impacts, including abdominal cramps, cardiac toxicity, vomiting, and diarrhea [6]. Therefore, Sb is considered to be a pollutant of high priority interest by the United States Environmental Protection Agency (USEPA) and the European Union (EU) [7]. To protect human health and the environment, the USEPA (6 µg/L), EU (10 µg/L), World Health Organization (WHO) (5 µg/L), South Korea (20 µg/L), and Pakistan (5 µg/L) have set regulatory standards for Sb in drinking water [8,9,10].
Antimony is an emerging pollutant. It exist as Sb(III) under anoxic conditions and Sb(V) in aerobic waters, leading to long and persistent contamination when it is released into an aqueous environment [11]. Several treatment techniques including membrane separation, coagulation, adsorption, ion exchange, phytoremediation, and electrochemical methods have been extensively applied for the removal of Sb from drinking water [12]. However, coagulation-flocculation-sedimentation (C/F/S) processes are still favored by the drinking water industry. They have been identified as cost-effective and efficient treatment technologies to remove several heavy metals from water [13]. During the removal process, coagulant type and dosage, pH, and initial contaminant loading are key factors in determining the overall C/F/S performance of heavy metals in water. For instance, extensively used commercial coagulants such as ferric chloride (FC) and ferric sulfate (FS) have demonstrated more efficient Sb removal than aluminum-based coagulants [12,13]. High Sb(III) removal has been previously reported over a broad pH range (4–10). However, a significant decline in Sb(V) removal at alkaline pH conditions has been observed owing to a significant decrease in Fe solubility [14,15,16]. Higher FC coagulant doses in various aqueous environments lead to greater removal of both Sb(III, V) species [11,12,15]. The initial Sb loading affects the overall C/F/S performance, with higher removal for solutions with higher initial Sb(III, V) concentration than those with lower contaminant loading [11,12]. The treatment of Sb-rich water has been addressed in a number of studies [11,12,14,15,16,17] using the C/F/S process. However, previous studies are limited to “one-factor-at-a-time” experiments to determine the coagulation behavior of Sb species in water. Studies that comprehensively determine the interactive effect of major operating parameters on Sb removal involved in the coagulation process are insufficient. Therefore, it is essential to explore an experimental approach for simulating Sb removal by C/F/S.
Toxic Sb species pose substantial threats to human health and the environment. Therefore, their removal from drinking water supplies by C/F/S is of essential importance. Furthermore, it is necessary to optimize the treatment efficiency of the C/F/S process by taking into consideration the concentration and characteristics of Sb species in order to achieve high Sb coagulation efficiency. The jar test procedure has been extensively employed to optimize Sb removal performance by a C/F/S process [11,12,14,15,16,17,18]. This classical approach is also referred to as the one-factor-at-a-time method, changing the level of one factor while keeping other factors constant. However, it is usually incapable of considering the interactive behavior of various operating factors. Thus, it is an insignificant approach to determine optimum conditions [19,20,21]. To overcome such a problem, numerous statistical and mathematical models have been developed for analyzing and optimizing experimental operating factors. For such a purpose, the Box–Behnken statistical experiment design (BBD) is a classical response surface methodology (RSM) used for modeling and analyzing experimental data [22]. The RSM is an empirical statistical technique for designing experiments, building models, evaluating the effect of variables, and searching for the optimum conditions of variables to predict targeted responses. It uses regression analysis of experimental data to solve a system of equations to obtain a single function response (the dependent variable examined), which can be graphed as a response surface [23,24,25]. It does not require a large number of runs. It does not require too many levels of independent variables either [26].
Up to date, a limited number of research studies have been conducted to investigate the coagulation process in drinking water using the RSM technique. Previously, the RSM technique has been applied to optimize the coagulation conditions for arsenic (As) removal using various coagulants [25,27]. The interaction of As and natural organic matter has also been investigated using RSM. The model has been validated with real groundwater samples containing both As and organic matter [28]. To the best of our knowledge, studies that simulate the C/F/S performance of Sb by FC coagulant using RSM have not been reported yet. It is essential to systematically investigate the removal performance of Sb by the C/F/S process using a mathematical modeling approach.
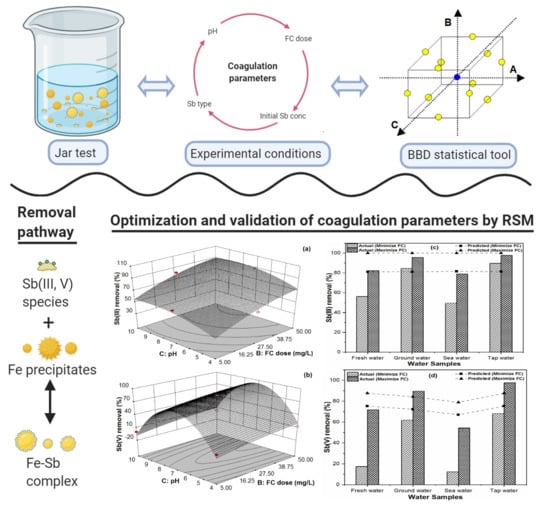
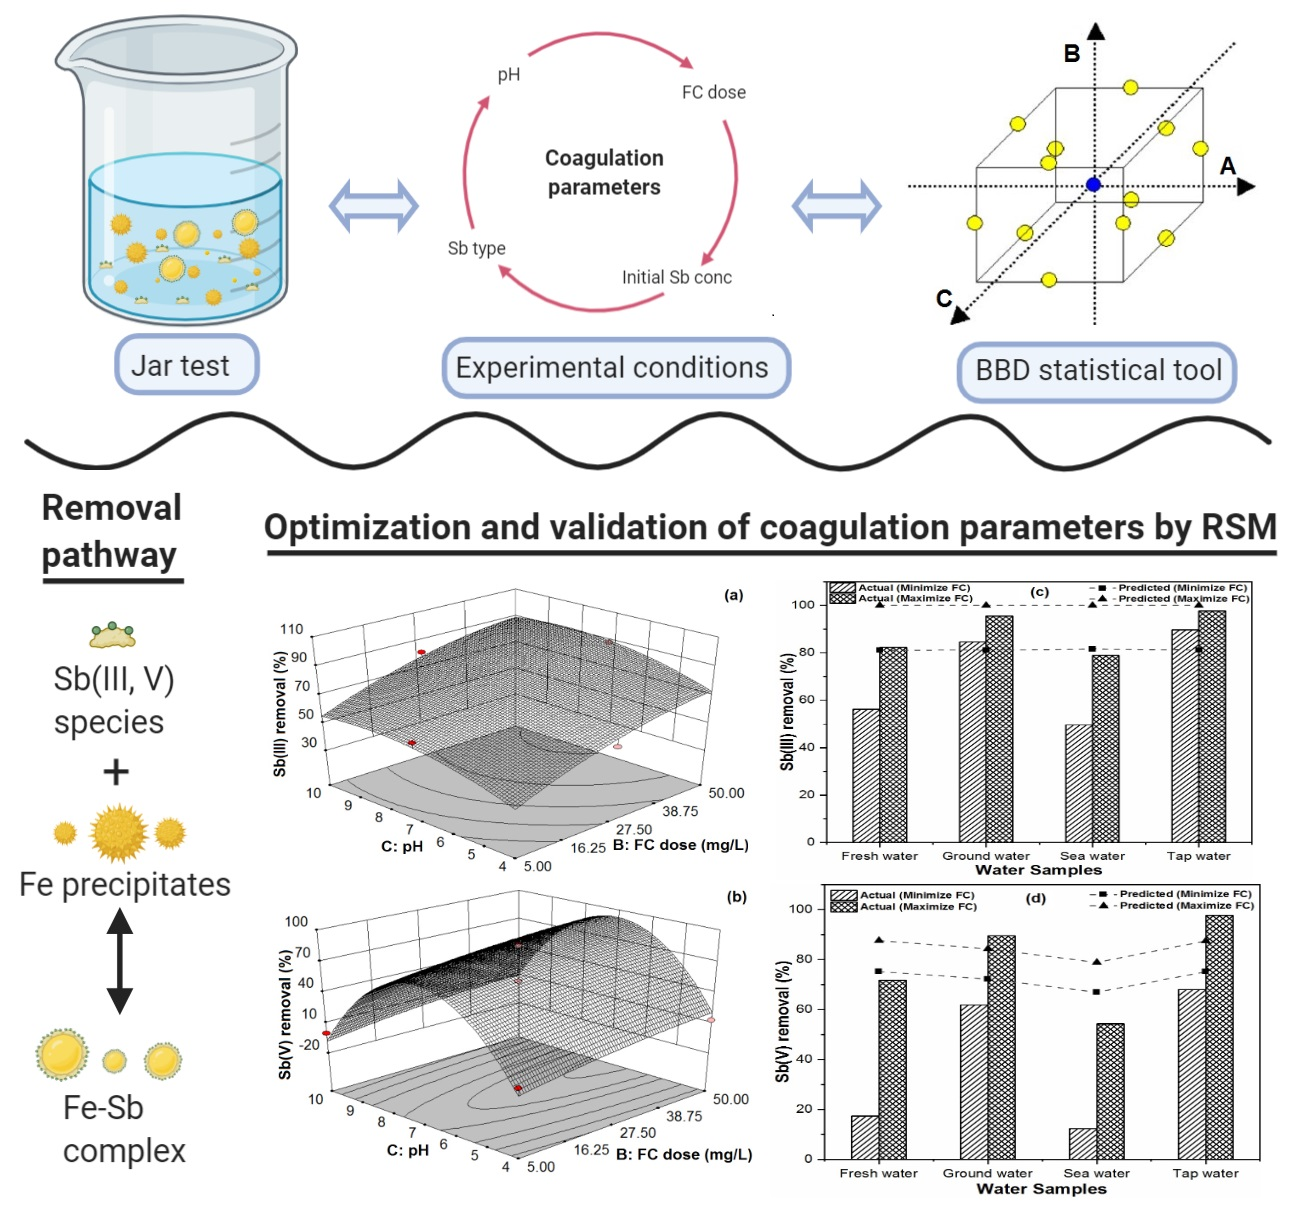
Accordingly, the aim of the present study was to explore the removal capability of redox Sb(III, V) species from aqueous solutions by coprecipitation-adsorption using FC as a coagulant. A Box–Behnken experimental design was used to investigate the effects of various coagulation factors such as pH, FC coagulant doses, and initial Sb(III, V) concentration on the removal efficiency of Sb and to find desirable operating conditions for achieving the maximum Sb removal. Secondly, the adequacy of the model and the reliability of statistical analysis with various experimental data points were determined by comparing the experimental and predicted response values of Sb removal efficiencies. Lastly, observed and modeled removal response values for real water matrices were compared to further illustrate the suitability of the model for Sb removal from drinking water using the C/F/S process.

2. Materials and Methods

2.1. Reagents and Stock Solutions Preparation

Potassium hexahydro-antimonate (KSb(OH)6), antimony (III) oxide (Sb2O3), and humic acid were purchased from Sigma Aldrich (St. Louis, MO, USA). Iron (III) chloride hexahydrate (FeCl3·6H2O), potassium chloride (KCl), sodium sulfate (Na2SO4), sodium bicarbonate (NaHCO3), nitric acid (HNO3), magnesium chloride (MgCl2), hydrochloric acid (HCl), and sodium hydroxide were procured from Samchun (Samchun pure Chemicals Co., Ltd., Pyeongteak-si, Korea). Deionized (DI) water was produced in the laboratory using a water purification system (Milli-Q, Millipore Co., Bedford, MA, USA). Stock solutions of Sb(V) and Sb(III) were prepared at 1000 mg/L by dissolving KSb(OH)6 and Sb2O3 in DI water and 2M HCl solution, respectively, for further dilution to obtain solutions with the desired Sb(III, V) concentrations. A stock solution of Fe(III) was prepared at 500–5000 mg/L by dissolving FeCl3·6H2O in DI water for further dilution to obtain the desired Fe(III) concentrations for a particular experimental run. A stock solution of model organic matter was prepared at 0.1 g C/L by dissolving humic acid in DI water following a similar procedure as described in our previous studies [14,17,18]. In order to avoid the interference of unwanted contaminants, all glass vessels and glassware were initially washed with 15% HNO3 solution followed by rinsing with DI water.

2.2. Experimental Procedure

Prior to the coagulation experiment, 100 mL of synthetic water was added in a 250 mL beaker. The predetermined amount of FC coagulant was added and a small quantity of 0.1 M HCl and 0.1 M NaOH solution was added to adjust the pH. A jar tester apparatus with six beakers (Model: SJ-10, Young Hana Tech Co., Ltd., Gyeongsangbuk-Do, Korea) was used to conduct the C/F/S experiments at a temperature of 25 ± 1 °C. C/F/S experimental conditions included a rapid coagulation at 140 rpm for 3 min, a flocculation at 40 rpm for 20 min, a sedimentation for 30 min, and a filtration using a 0.45 µm glass fiber filter [14,15,16,17,18]. Aliquots (50 mL) were collected after the filtration process and stored in the dark at 4 °C for further analysis.

2.3. Analytical Methods

A pH meter (HACH: HQ40d Portable pH, Conductivity, oxidation reduction potential (ORP) and ion selective electrode (ISE) Multi-Parameter Meter, Loveland, CO, USA) was used to measure solution pH after calibration with buffer solutions of 4.01, 7.00, and 10.01 at 25 °C. A popular statistical modeling software Design Expert (Version 7.0.0, Stat-Ease Inc., Minneapolis, MN, USA) was used for the experimental design, co-efficient determination, statistical data analysis, and response graph plotting. An inductively coupled plasma optical emission spectrometry (ICP-OES: Model Varian, Agilent technologies, Santa Clara, CA, USA) was used to analyze the residual Sb concentration from aqueous matrices. All experiments were performed in duplicate and average values were reported.

2.4. Response Surface Methodology

In order to explore the interactions of various major operating factors on antimony removal by the coagulation process and further optimize coagulation conditions, the Box–Behnken experimental design method [24] was used in this study. The following three major independent factors were chosen for the experimental design: initial Sb(III, V) concentration (A: 100–1000 µg/L), FC coagulant dose (B: 5–50 mg/L), and pH (C: 4–10). This BBD design was used to investigate all three factors at three equally spaced coded levels designated as −1 (low), 0 (middle), and +1 (high) levels of each variable. Actual values of coded levels of each factor are presented in Table 1.
The Box–Behnken statistical design provided 17 different combinations of experiments in a randomized order to minimize the effects of uncontrolled variables on responses, with the central point of the model repeated five times in order to quantify the error. Experimental data points of the three independent variables for BBD are shown in Table 2. Responses were modeled as an empirical second order polynomial equation in the form presented in Equation (1):
Y = f ( x ) = β 0 + i = 1 k ( β i x i ) + i = 1 k   x   j = i + 1 k   ( β i j x i x j ) + i = 1 k ( β i i   x i 2 )
where Y was the predicted response (Sb(III, V) removal); k was the number of factors; xi and xj were coded values of factors that influenced the predicted response Y; β0 was the model coefficient; and βi, βii, and βij were linear, square, and interactive effects, respectively, of various independent variables.
Regression analysis was performed for experimental data thus obtained using Design Expert software. The statistical significance of the model was accessed by analysis of variance (ANOVA) in Design Expert, which was also used to depict the 3D response surface for the validation of experimental data by comparing it with predicted values. Furthermore, the model was used to find the maximum removal of response variable (Sb(III, V) removal) during the coagulation process under similar experimental conditions in an aqueous environment.

2.5. Environmental Water Samples

In order to extend the application of BBD for antimony removal, four different environmental water samples were examined in this study. Three water samples (freshwater, groundwater, and seawater) were synthetically prepared in DI water in accordance with our previous study [29], while a tap water sample was collected from Sungkyunkwan University, Korea. An amount of 1000 µg/L Sb(III, V) was added into all water samples to understand the coagulation behavior of antimony in a natural water environment. Actual experimental values were compared with modeled values to determine the accuracy of the model. Table 3 presents detailed characteristics of various environmental water samples.

3. Results and Discussions

3.1. Identifying Best Response Function for Experimental Data

The removal of Sb(III, V) from drinking water following the coprecipitation-adsorption mechanism was investigated by the C/F/S process using FC coagulant. RSM was applied to model the experimental data obtained from 3-factor BBD, including initial Sb(III, V) concentration, FC dose and pH as process variables [17]. Experimental and predicted response variables (Sb(III)/Sb(V) removal) using FC as a coagulant are presented in Table 4. Different response functions such as linear, interactive, quadratic, and cubic models were generated and correlated with experimental data for regression analysis. To decide the adequacy of each model to represent Sb(III)/Sb(V) removal by FC, model summary statistics were conducted. The results are presented in Table 5. For both response variables (Sb(III) and Sb(V) removal), the quadratic model was selected for further analysis as it fitted the experimental data the best with the lowest standard deviations, the highest correlation coefficients, adjusted R2, predicted R2 values, and the lowest p values without the aliasing, which occurred in the cubic model where sufficient points in the estimation of model coefficients were not available. The second order polynomial response equation was fitted for Sb(III) and Sb(V) removal to obtain the model constant, three linear, interactive, and quadratic effects, as indicated in Equation (1). Both response functions with determined coefficients for Sb(III) and Sb(V) removal in terms of coded factors are presented in Equations (2) and (3). Coefficients A, B, and C represent initial Sb(III, V) concentration (µg/L), FC dose (mg/L), and pH, respectively.
Sb(III) removal = 86.30 + 5.32A + 17.54B + 6.57C + 0.40AB − 1.67AC − 0.16BC − 2.25A2 − 6.13B2 − 8.49C2
Sb(V) removal = 85.82 + 2.71A + 9.85B − 4.47C − 3.68AB − 0.49AC − 0.76BC − 4.20A2 − 3.05B2 − 76.89C2
The predicted response variables (Sb(III)/Sb(V) removal) for BBD were determined by response functions with obtained coefficients (Table 4). The predicted responses presented good correlation with experimental values, as indicated by their regression coefficients (Sb(III)-R2: 0.9452) and (Sb(V)-R2: 0.9821). Table 6 presents the results of the analysis of variance for the two quadratic models as well as regression coefficient R2 and adjusted R2. It was evident that the modeled responses fitted experimental values well. Hence, the equations were highly reliable. Furthermore, the values of adjusted R2 (Sb(III): 0.8748; and Sb(V): 0.9590) suggested that 12% and 4% of the total variation in Sb(III) and Sb(V) removal, respectively, could not be explained by the model. The value of the adequate precision measures the signal to noise ratio (desirable > 4). In the current study, these ratios for Sb(III) and Sb(V) were found to be 12.899 and 15.235, respectively, indicating an adequate signal. Therefore, the chosen quadratic model can be used to navigate the design space (i.e., to predict antimony removal responses) by the C/F/S process.
In order to explore the influencing factor responsible for Sb(III, V) removal during the C/F/S process, the linear, interactive, and quadratic effects of factors of two responses were investigated. The statistical significance of the response function generated was checked by F-test and ANOVA results for both response surface quadratic models and model terms (Table 6). In both response functions, the model F value and very low probability values (Sb(III): 0.0012; and Sb(V): <0.0001) indicated that these models were statistically significant and model equations could be adequately used to describe Sb(III, V) removal under various operating parameters. The p value is a statistical parameter used to check the significance of each coefficient. Therefore, factors having p values < 0.05 in both response functions indicate that the model and model terms are statistically significant [30].
For the Sb(III) removal response, the statistical analysis showed that the initial Sb(III) concentration, FC dose, and pH were significant linear terms with one significant quadratic term (pH × pH), while the remaining quadratic and interactive terms were found to be insignificant (Table 6). The most significant terms were FC dose and (pH × pH) for Sb(III) removal. In contrast, only two factors (i.e., one linear (FC dose) term and one quadratic (pH × pH) term) were significant in Sb(V) removal response, with (pH × pH) as the most significant term influencing Sb(V) removal. Such results were in good agreement with our previous studies [14,15,16], in which high FC doses were required to enhance Fe precipitation and achieve good Sb removal in various aqueous matrices. Since other linear, interactive, and quadratic terms were insignificant, they were still considered in Equations (2) and (3) because it was a hierarchical model. In general, the analysis showed that the quadratic model chosen to explain the relationship between factors and response was satisfactory. Thus, it can be used for predicting Sb(III, V) removal efficiencies for a wide range of operating conditions during the C/F/S process.

3.2. Effect of Initial Sb(III, V) Concentration, FC Dose and pH on the Modelled Responses

Three-dimensional response surfaces along with contour plots for two quadratic models generated for the removal of Sb(III) and Sb(V) are presented in Figure 1 and Figure 2. ANOVA results indicated that FC dose and (pH × pH) were among the most significant factors for both responses (Table 6). Therefore, independent variables such as FC dose and pH were used to illustrate modelled responses with a third factor, initial Sb(III) and Sb(V) concentrations held at each level investigated: 100 µg/L, 550 µg/L, and 1000 µg/L. In each 3D plot, experimental values are presented as a circle for each design point while model responses are shown as a 3D surface.
Variations in Sb(III) removal efficiency with FC doses at different pHs were observed for initial Sb(III) concentrations of 100 µg/L, 550 µg/L, and 1000 µg/L, as presented in Figure 1a–f. The Sb(III) removal efficiency increased with increasing pH. The optimum pH range for Sb(III) removal by FC coagulation was 6.5–8.5. As evidenced from Figure 1, the lowest Sb(III) removal was observed in the acidic pH range at low initial Sb(III) concentration of 100 µg/L. Such an observation may be attributable to the fact that amorphous ferric hydroxide precipitates are unstable at acidic pH conditions [31]. Compared with the Sb(III) response variable, Sb(V) removal was significantly affected by highly acidic and highly alkaline pH conditions (Figure 2a–f). The highest Sb(V) removal was achieved at an optimum pH range of 6.5–7.5 and a medium level of initial Sb(V) concentration (550 µg/L). These obtained results were consistent with previous observations, showing efficient Sb(III) removal over a broad pH range and a decline in Sb(V) removal under acidic and basic pH conditions [12,15,16]. The effect of pH range on Sb(III, V) removal efficiency is also related to Fe solubility. It has been previously reported that the presence of Sb(V) species has a remarkable impact on ferric hydroxide precipitates formation at acidic and alkaline conditions, thus enhancing the mobility of Sb(V) species in an aqueous environment [15,16].
In contrast to the Sb(III) response, the Sb(V) species removal was highly pH dependent, as depicted by the results of BBD for FC. However, the BBD response function did not include the linear effect of pH, but rather incorporated the FC dose followed by the quadratic effect of (pH × pH) as the most statistically significant factor for Sb(V) removal. This argument is related to the significant contribution of (pH × pH) and FC dose to Sb(V) removal (Table 6). Higher FC doses resulted in improved Sb(V) removal efficiencies across a pH range of 6–8 during the coagulation process, as presented in Figure 2a–f. In general, the dose of ferric chloride is crucial to determine the level of Sb(III, V) removal from water. When FC is added to antimony contaminated water, it dissociates and forms ferric hydroxide precipitates [31]. Precipitation, coprecipitation, and adsorption are three possible mechanisms involved in Sb removal. Since the formation of FeSbO3 or FeSbO4 is not favorable under thermodynamic conditions, the precipitation mechanism can be discarded. Initially, coprecipitation (i.e., incorporation of soluble Sb species into a growing iron hydroxide phase via inclusion or exclusion) takes place in an aqueous environment. Furthermore, the uptake of soluble Sb species onto the amorphous iron hydroxide solid surface via adsorption occurs [12,17]. Possible chemical equations of FC coagulation are as follows:
FeCl3·6H2O ➯ Fe3+ + 3 HCl + 3OH + 3H2O  Ferric chloride dissociation
Fe3+ + 3H2O ➯ Fe(OH)3 + 3H+ Ferric precipitation
Sb(OH)3 + Fe(OH)3 ➯ Fe-Sb(III) complex Coprecipitation/Adsorption
S b ( O H ) 6 + F e ( O H ) 3     Fe-Sb ( V )   c o m p l e x C o p r e c i p i t a t i o n / A d s o r p t i o n
As shown above, an increase in FC dose would cause a substantial increase in Sb(III, V) removal by complexation of Sb species with iron hydroxide precipitates. Therefore, the BBD design also presented FC dose as the most significant factor responsible for Sb(III, V) removal. When the FC dose is increased in aqueous solution, more ferric hydroxide precipitation will occur, resulting in a greater surface area for Sb(III, V) sorption, thereby lowering the residual Sb concentration in contaminated water [32]. However, an increase in Sb(III) removal above a certain FC dose was found to be insignificant in respect of various levels of initial Sb(III) concentrations under optimum pH conditions (Figure 1). For instance, at a low level (100 µg/L Sb(III)), the FC dose of 50 mg/L presented the highest Sb(III) removal at about 91.66%. However, at medium and high levels (550 and 1000 µg/L Sb(III)), the highest Sb(III) removal rates of 97.6% and 98.32% were achieved by FC doses at 45.44 and 40.39 mg/L, respectively. It was noteworthy that a high FC dose was required for a solution with a low initial Sb(III) concentration compared to a higher level of Sb(III) contaminated water. This may be attributable to higher collision probabilities of colloids in Sb(III) rich water as compared to low Sb(III) polluted water [27]. However, an FC dose of 50 mg/L was required to achieve the highest Sb(V) removal rates of 89.46%, 92.71%, and 87.56% for low, medium, and high levels of initial Sb(V) concentration, respectively (Figure 2). These results suggest that the optimization of coagulation parameters plays a significant role in Sb removal from various aquatic environments.

3.3. Model Validation with Independent Experimental Data

Experiments different from the BBD design points and within the range of independent variables were conducted to evaluate the reliability of predicted Sb(III, V) removal responses under optimum coagulation conditions (Table 7). Model predicted values and experimental results were compared to evaluate the validity of the model. Validation experiments confirmed the suitability and accuracy of the model. As the predicted response variables were in close agreement with the experimental results, BBD was a reliable and effective method for determining the optimum coagulation conditions for Sb removal. In general, the current study provided insights into the usefulness and reference conditions for heavy metal removal using BBD for the drinking water industry.

3.4. Antimony Removal Considering Variations in Residual Iron

The ferric chloride dose has a significant influence on Sb(III, V) removal. However, residual iron (Fe) concentration obtained after the sedimentation/filtration process must be considered owing to its health effects, including gene mutations, skin diseases, and so on. The WHO has recommended the guideline value for Fe in drinking water to be 300 µg/L [33,34]. Obtained results in current study indicate that a high FC dose is required to achieve the maximum Sb(III, V) removal efficiency. Therefore, residual Fe concentration was monitored for the solution with a high Sb level to evaluate the C/F/S process. The effect of FC dose on Sb removal and its relationship with residual Fe concentration for a high initial Sb(III, V) concentration level (1 mg/L) are presented in Figure 3. The residual Fe concentration was a function of Sb species type. More residual Fe was observed in the presence of Sb(III) than Sb(V) species. Similar results were observed in our previous study, where Sb(III) species impaired Fe solubility under neutral pH conditions [15]. Above a certain FC dose (40 mg/L), an insignificant increase in Sb(III) removal was observed, where residual Sb(III) concentration slightly decreased but residual Fe increased. Such an observation indicated that an overdose of FC coagulant could result in a high residual level of Fe. Since the maximum allowable concentration of Fe in drinking water is 300 µg/L, FC is found to be an effective and reliable coagulant due to its residual Fe concentration and high Sb removal affinity from drinking water sources.

3.5. Comparison of Predicted and Actual Antimony Removal Efficiencies in Environmental Water Samples

In order to verify the applicability of the model in aquatic environments, experiments were performed for different synthetic and natural water samples and obtained Sb(III, V) removal results were compared with predicted values, as shown in Figure 4. In order to select desirable operating conditions, two criteria (i.e., minimum and maximum values of FC dose) were obtained from the model. Furthermore, experiments were conducted by selecting minimum and maximum criteria for the FC dose to analyze residual Sb(III, V) concentration in each water sample. The pH of the environmental water sample was readjusted after the addition of a selected amount of FC dose. For all studied waters, the model selected a 50 mg/L FC dose for maximum FC criteria for both Sb(III) and Sb(V) species. However, in the case of minimum FC criteria, the model chose a 5 mg/L FC dose for Sb(V) and an 18.5 mg/L FC dose for Sb(III) species. Such an observation was in good agreement with our previous results (Table 6) showing that the FC dose was the most significant factor affecting the C/F/S performance of Sb(III) species, as indicated by its p value (<0.0001 for Sb(III) and 0.0122 for Sb(V)).
Sb(III, V) removal efficiencies were evaluated for various water samples (i.e., fresh water, ground water, sea water, and tap water) under relevant environmental conditions (Figure 4). It was noteworthy that a high residual Sb(V) concentration was observed in all water samples as compared to residual Sb(III) irrespective of FC dose. The Sb removal trend obtained after experiments was found to be Tap water > Ground water > Fresh water > Sea water. As shown in Figure 4, an overestimation of Sb(III, V) removal responses in fresh water and sea water and overestimated Sb(V) removal responses in water samples with minimum FC dose criteria were observed. Such a deviation from experimental values might be related to the presence of various competing species in water samples having strong adsorption affinity towards amorphous iron hydroxide precipitates, which might have hindered the complexation of Sb(III, V) species with active Fe surface sites [11,13,14,17]. In contrast, an underestimation of Sb(III) and Sb(V) removal responses was observed for ground water and tap water with minimum and maximum FC dose criteria, respectively. Such an observation might be attributable to the fact that 12% and 4% of the total variations in Sb(III) and Sb(V) removal, respectively, could not be explained by the model (Table 6). Therefore, the presence of other factors might have affected the coagulation behavior of Sb(III, V) species in an integrated environmental system.
To further explore the influencing factors in various aqueous matrices, experimental and predicted values were evaluated based on the characteristics of water samples. It was evidenced that the characteristics of tap water were similar to our model design parameters. Therefore, the experimental results of tap water presented good correlations with the Sb(III, V) removal response variables of our model. For instance, the experimental data for Sb(III) and Sb(V) removal efficiencies in the case of tap water were found to be 89.74% and 67.91%, respectively, close to the predicted responses of 81.22% and 75.11%, respectively, with minimum FC dose criteria. The experimental values of 97.68% and 97.59% were also close to the model values of 100% and 87.46%, respectively. Such a discrepancy in observed values was associated with the presence of bicarbonates (HCO3) known to compete for Fe surface sites with Sb species in tap water [11]. Similarly, ground water also presented a better fitting of experimental data with model values, as presented in Figure 4. A significant decrease in Sb(III, V) removal efficiency was observed for freshwater and sea water samples. High values of total organic carbon (TOC), chlorides, sulfates, and phosphates in these water samples might have resulted in drastic decreases in Sb removal efficiencies (Table 3). It has been demonstrated that organic matter forms stable complexes onto the Fe surface and, thus, can effectively compete for Fe adsorption sites with Sb species [35]. Similarly, an adverse effect of sulfate on Sb removal has been evidenced in previous studies [36,37], presenting insights into the inner sphere complexation of sulfate with iron oxyhydroxide. The phosphate having identical chemical properties can compete with Sb species in water environments by forming specific inner sphere complexes onto the iron hydroxide surface, thus drastically decreasing the Sb removal efficiency [38]. Furthermore, Fe solubility is remarkably influenced by anionic species in an aquatic environment, thus enhancing the Sb mobility in a heterogeneous system, as evidenced by various studies in the literature [11,14,15,16,17]. These findings suggest that the current model may be suitable and appropriate in predicting the optimum coagulation conditions for Sb removal in a natural water environment. Further studies are needed to understand the complex physicochemical interactions between Sb species and various factors in heterogeneous water matrices.

4. Conclusions

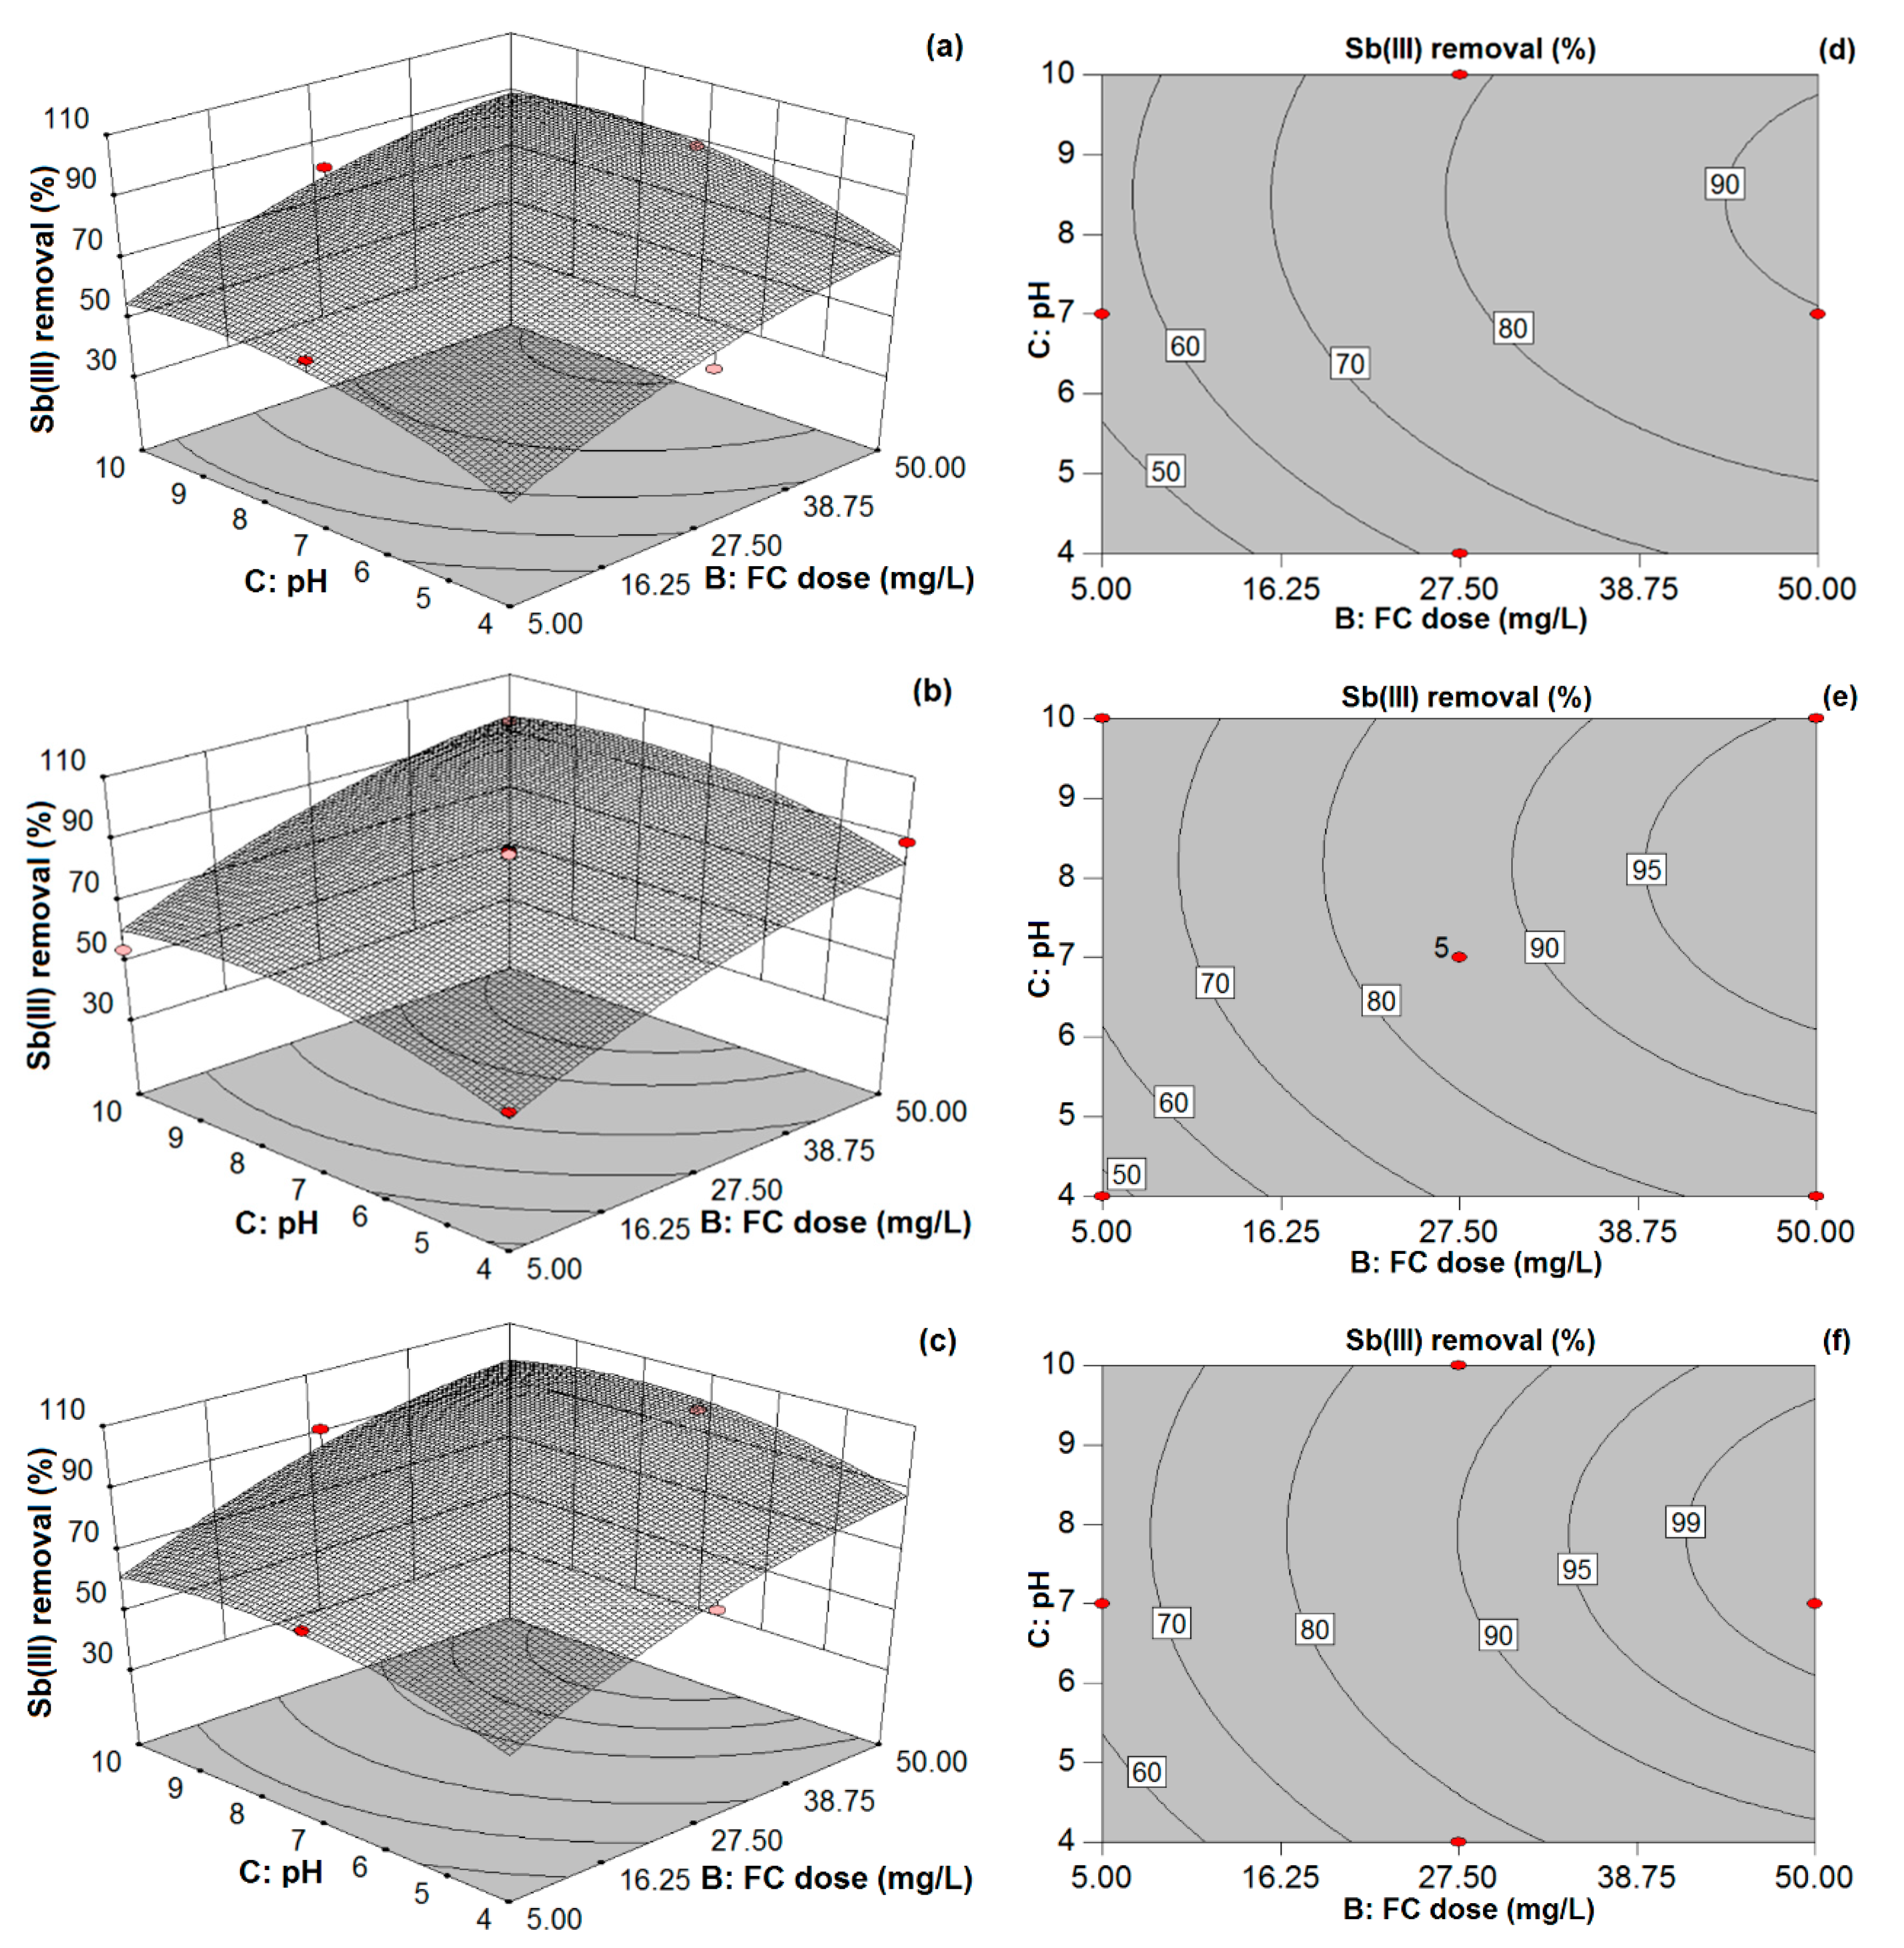
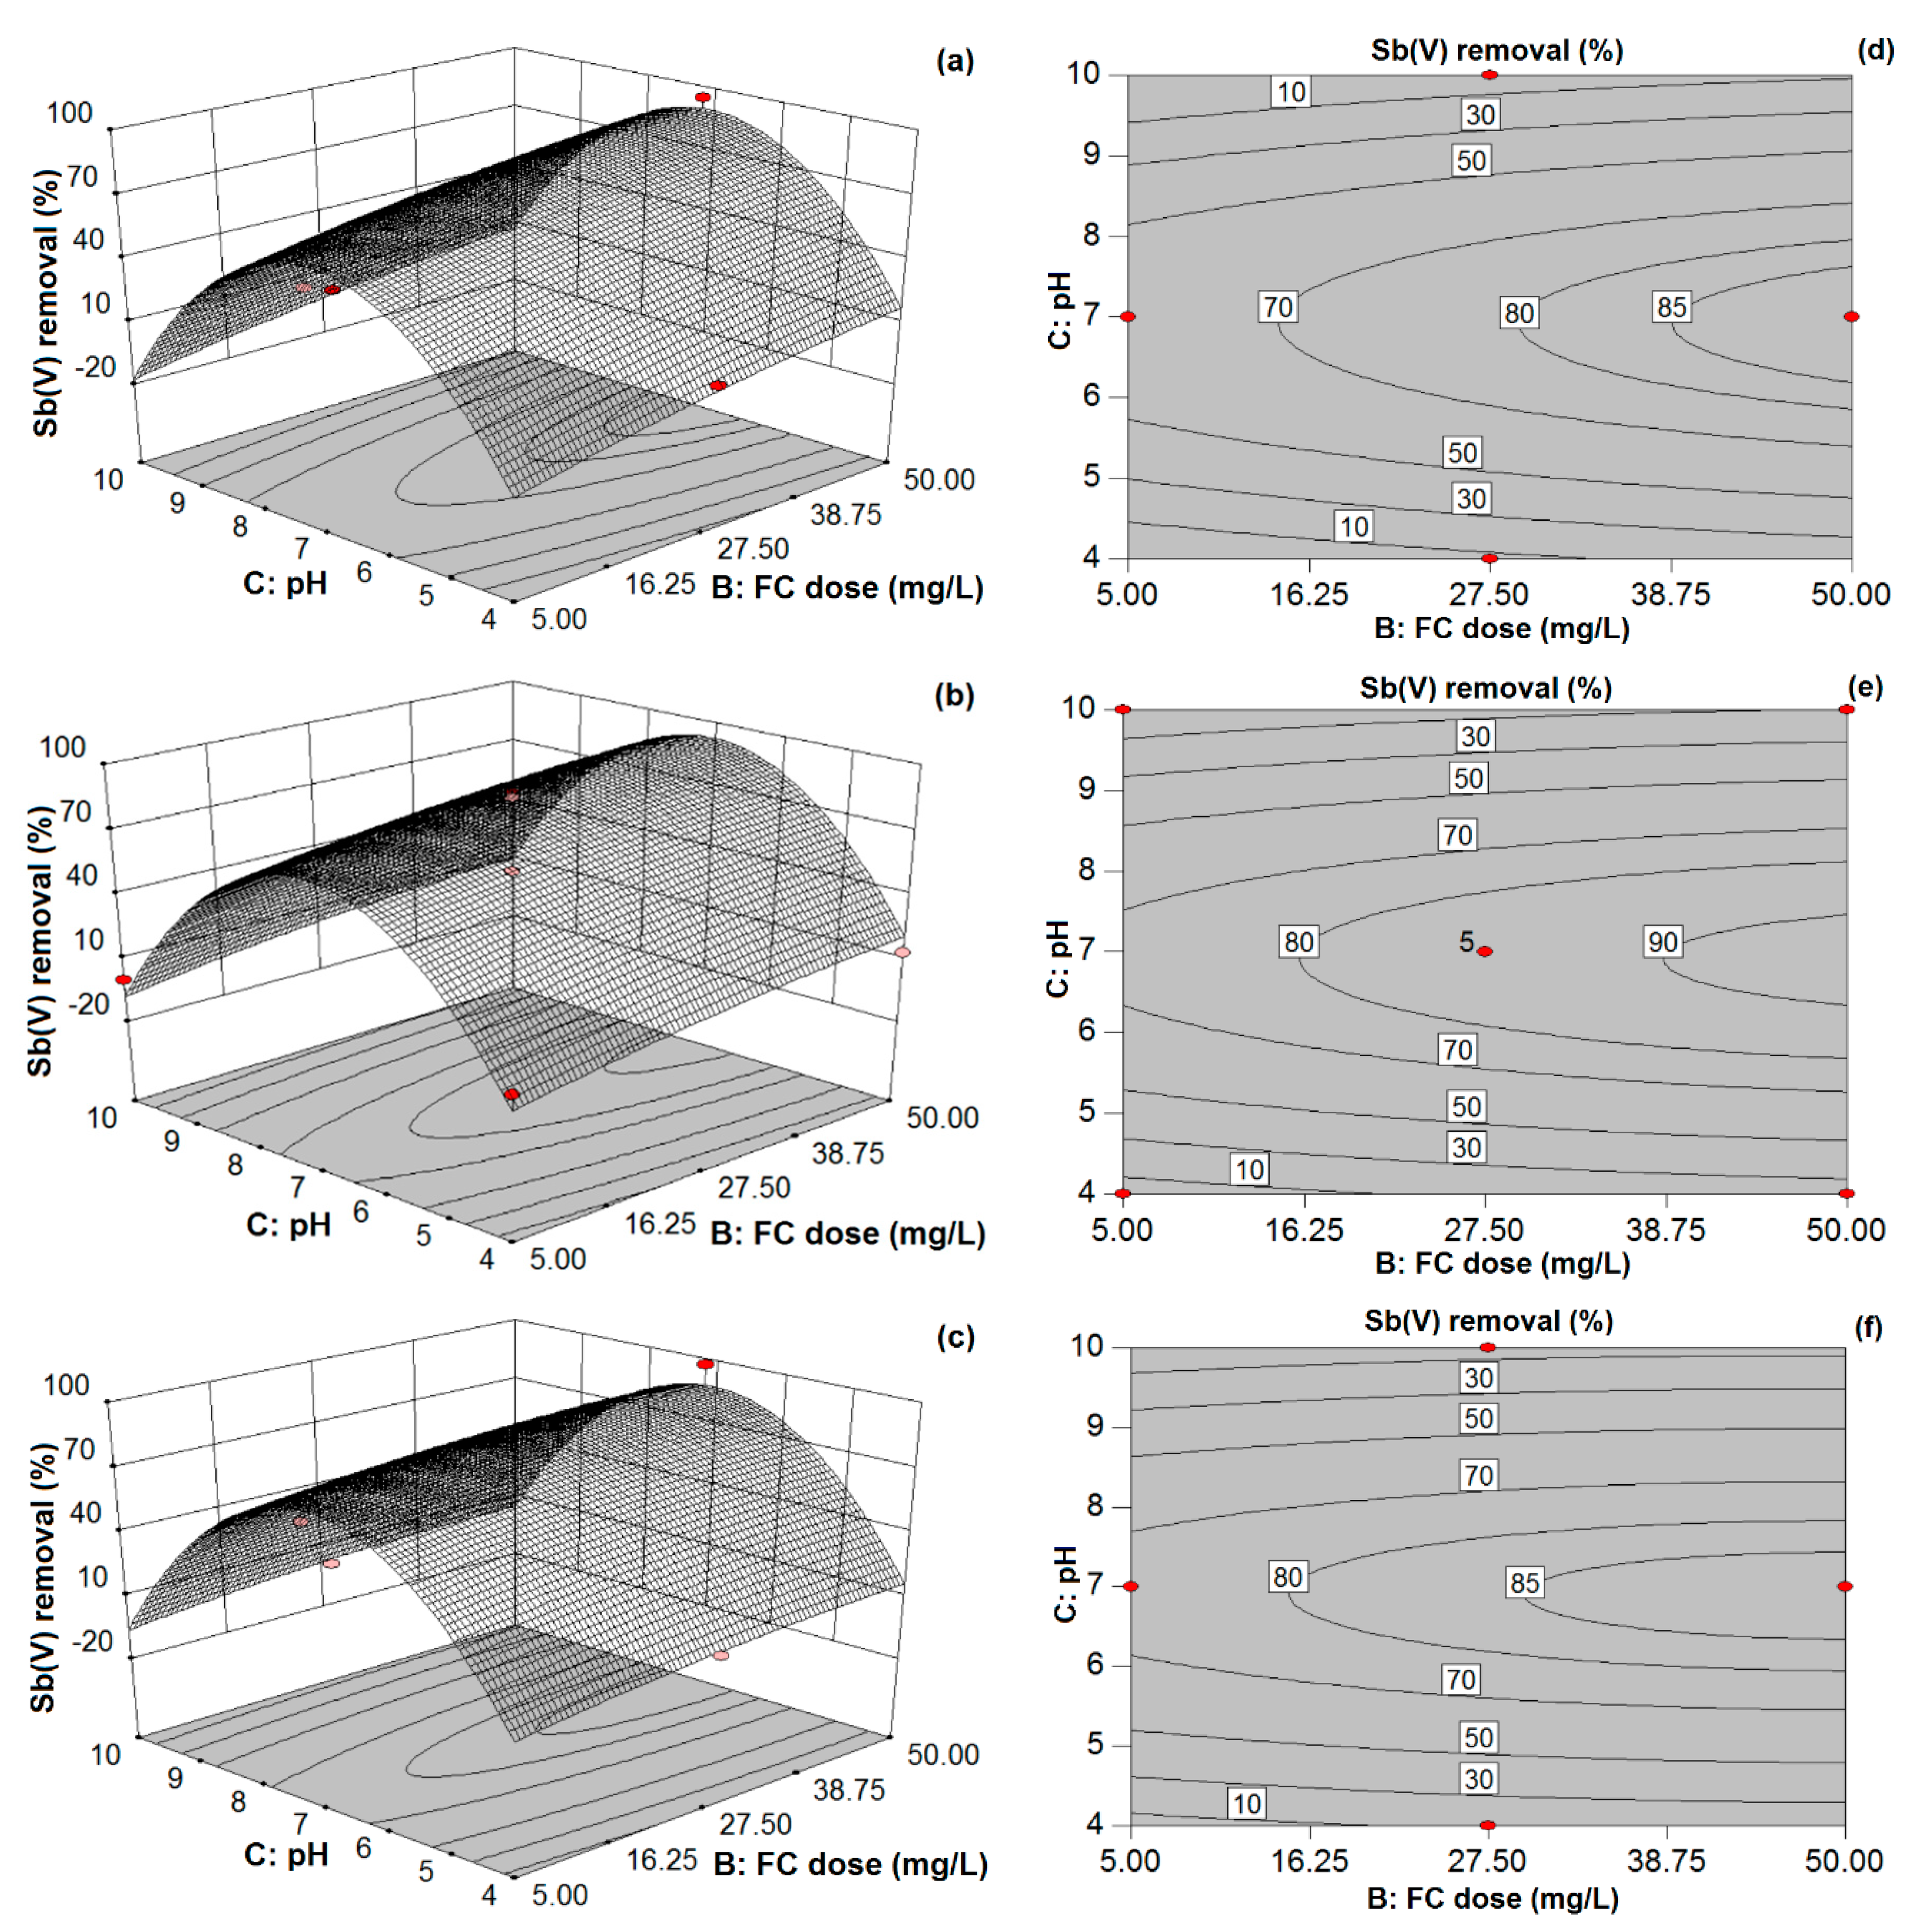
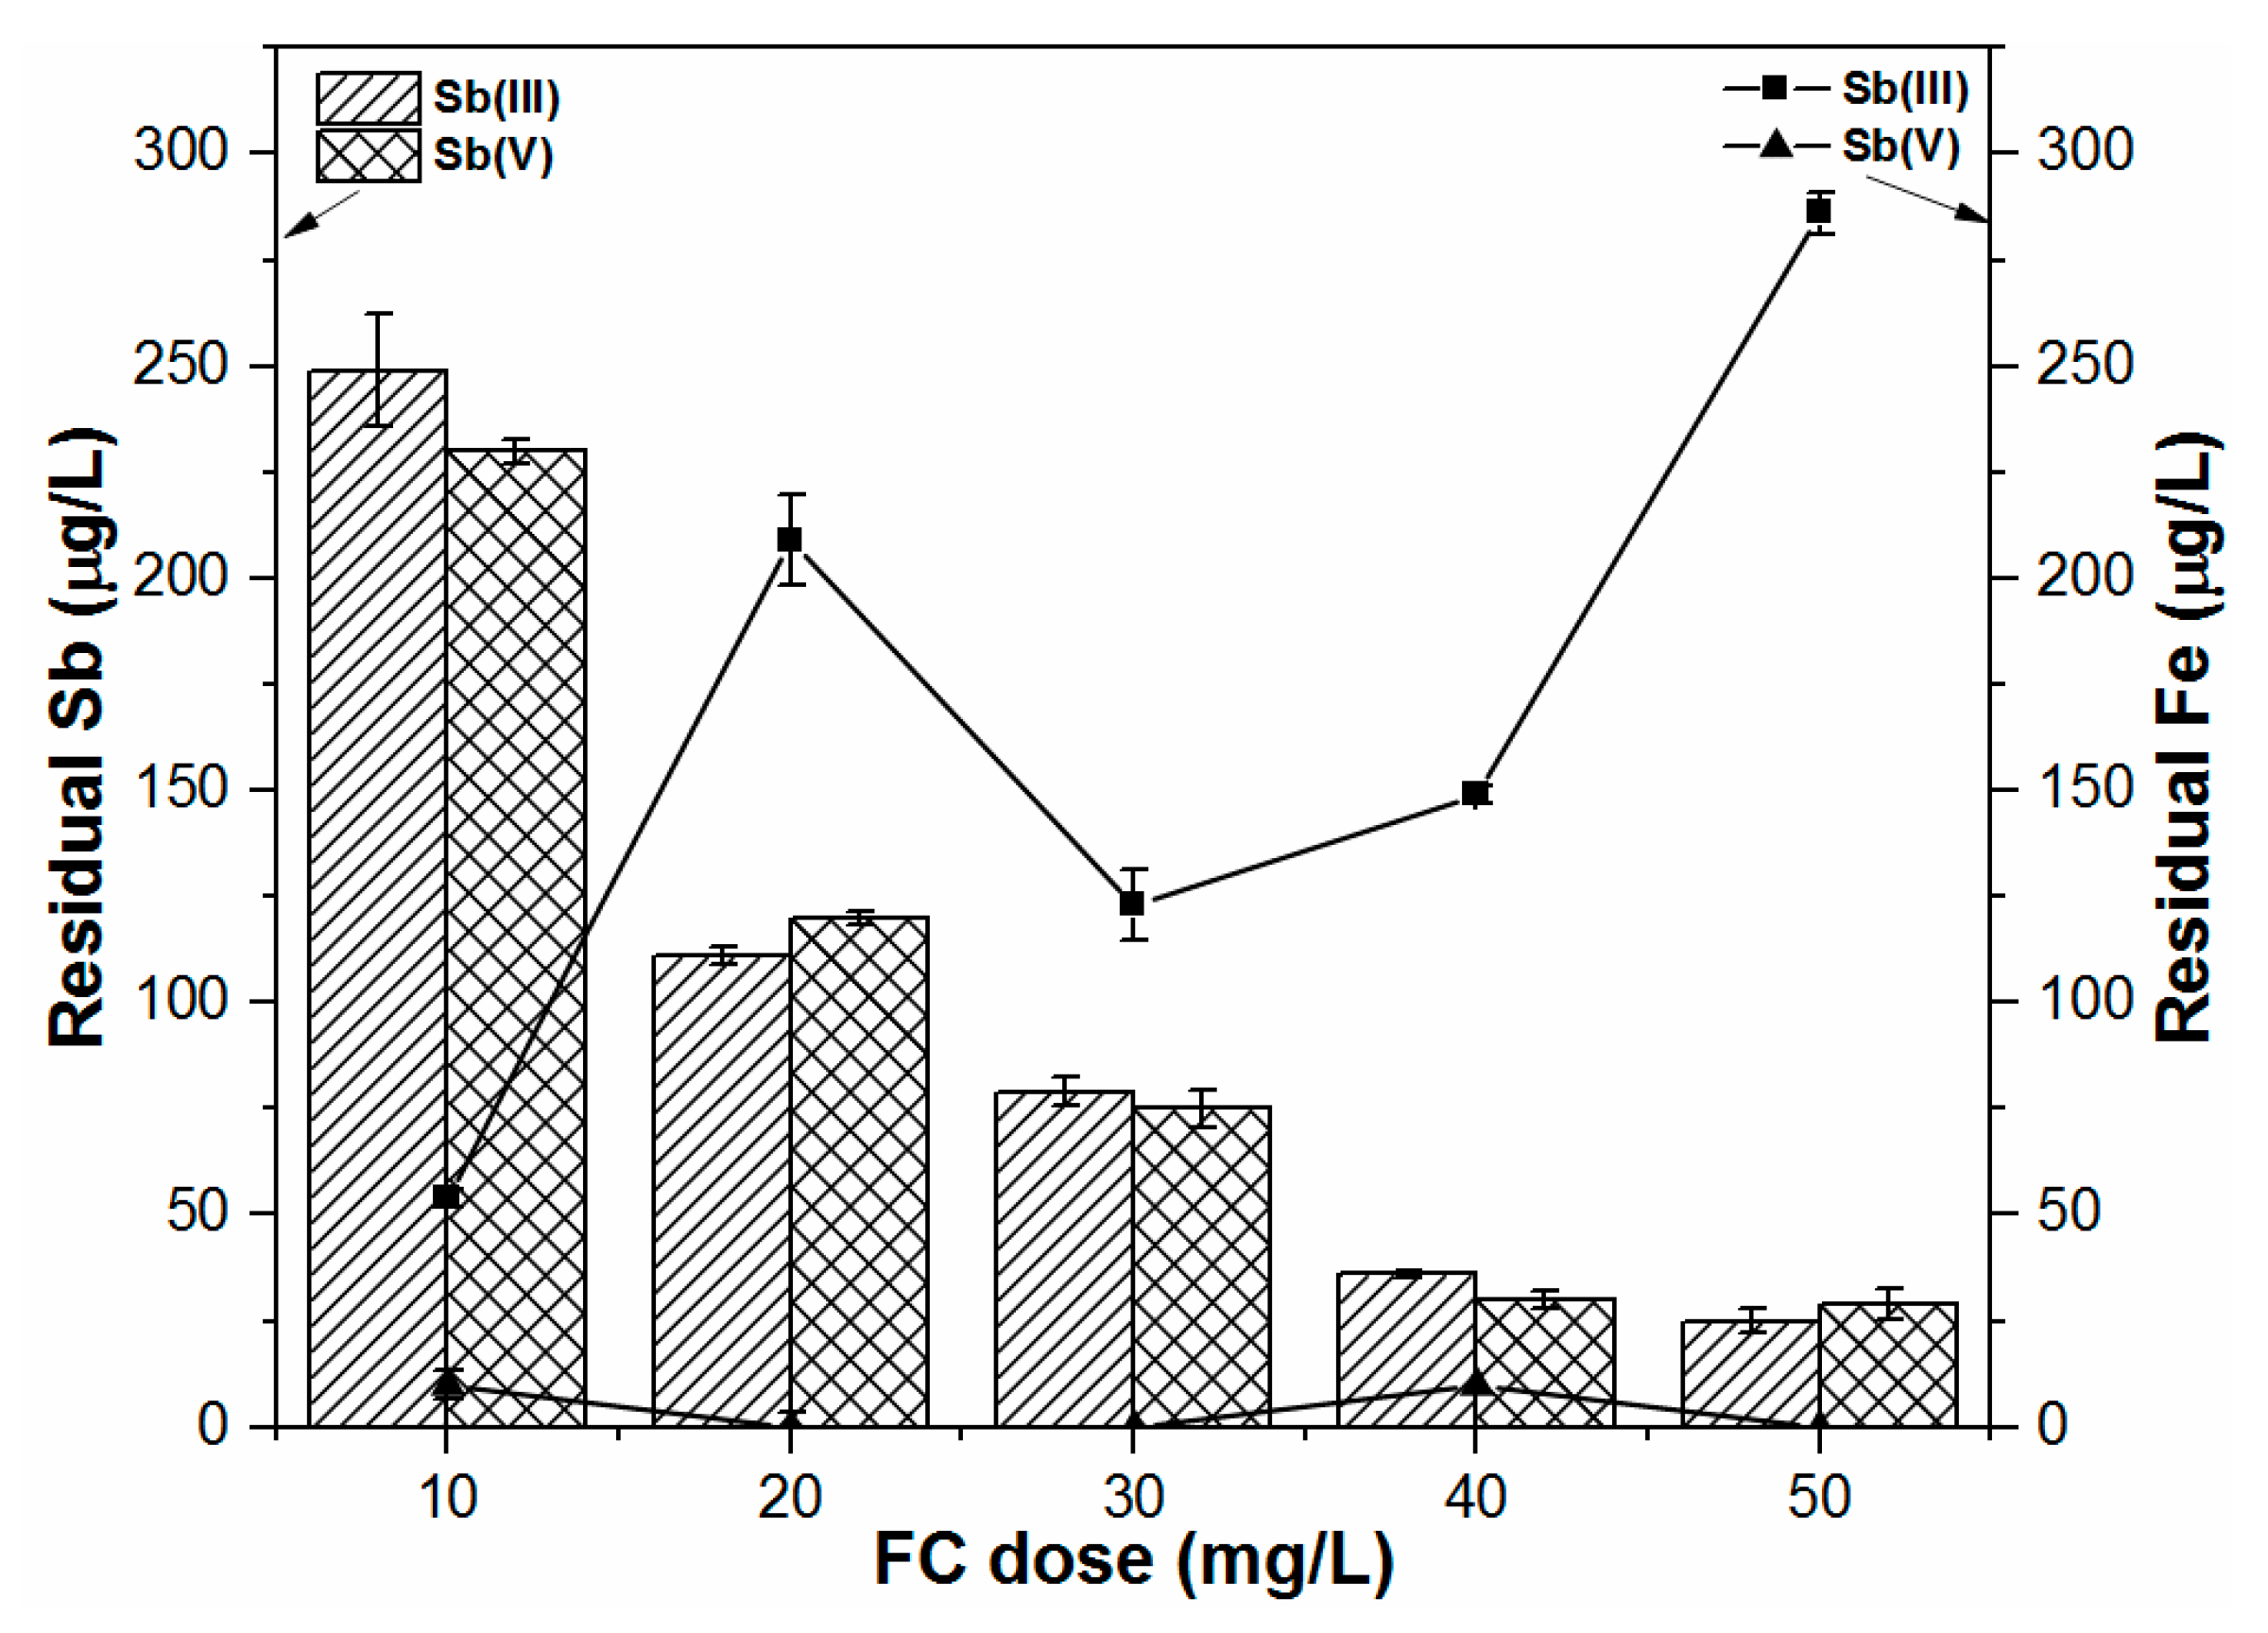
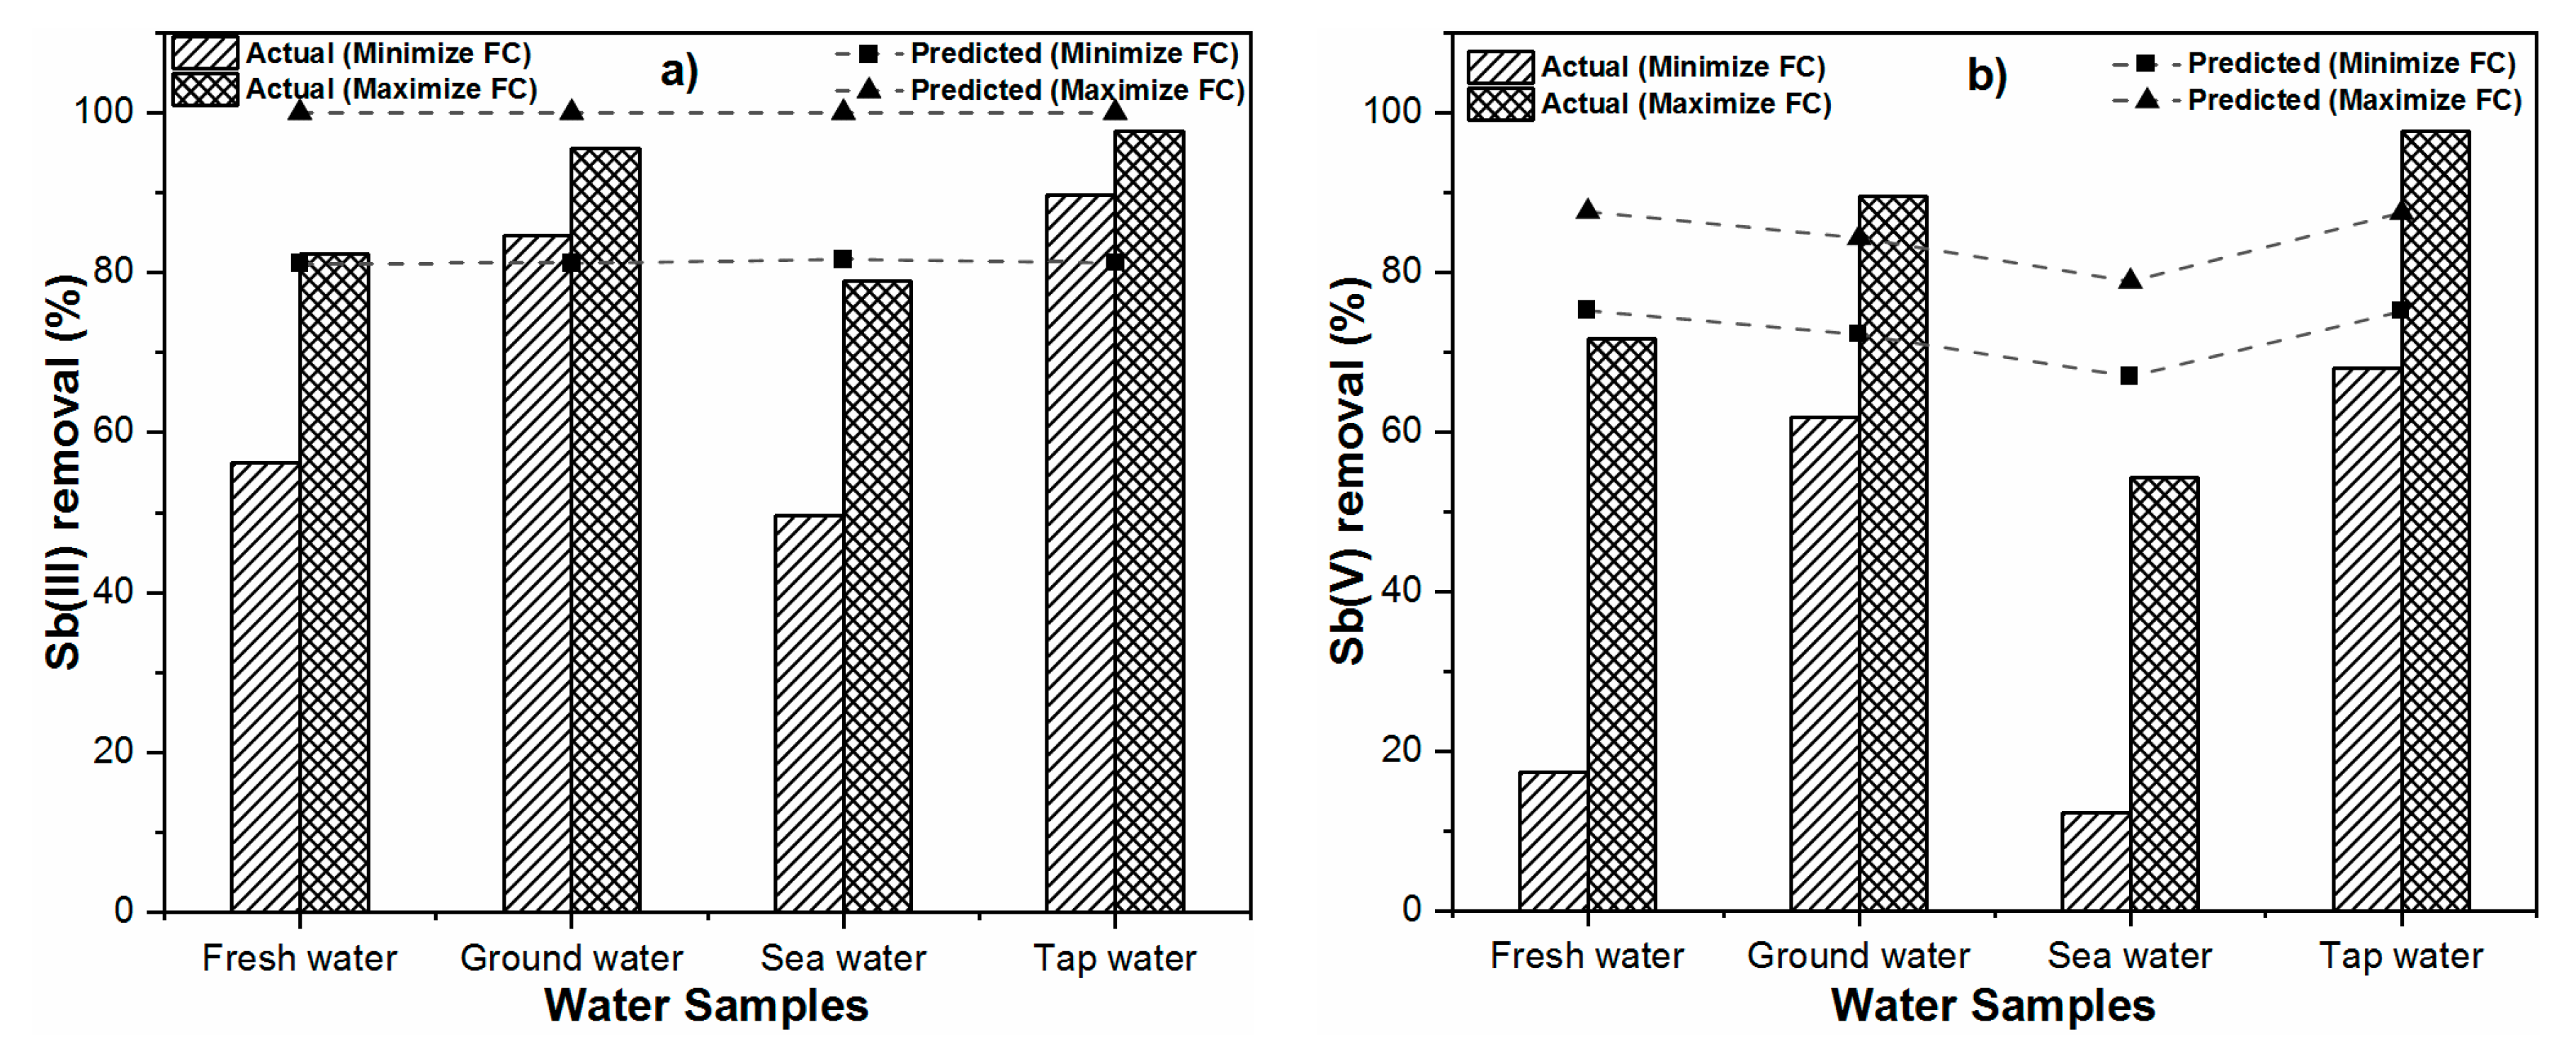
In this study, the coprecipitation-adsorption method was employed to determine the effects of various parameters (i.e., Sb(III, V) concentration, FC dose, and pH) on Sb(III, V) removal to achieve statistically reliable results for both pollutants by FC coagulation. BBD and RSM techniques were applied to determine the optimum C/F/S process conditions for maximizing Sb(III, V) removal from water. The obtained results suggest the potential feasibility of the statistical design approach for Sb(III, V) removal and its usefulness for determining the optimal conditions during Sb removal by FC coagulation with limited experimental trials. Experimental results illustrate that FC is an efficient and effective coagulant for Sb(III, V) removal in respect of the required FC dose, residual Fe and Sb(III, V) concentrations. The optimum pH range obtained for Sb(III, V) removal by the C/F/S process was between 6.5 and 7.5. In order to maximize the Sb(III, V) removal performance (88–98%), model responses suggested that the required FC doses were 50 and 40.39 mg/L for low and high initial Sb(III) loading, respectively, while a 50 mg/L FC dose was required for the studied Sb(V) concentration (100–1000 µg/L). Further, the applicability of the model was assessed for different real water samples, in which ground water and tap water spiked with Sb(III, V) solutions showed good agreement for Sb(III, V) removal. However, discrepancies in Sb(III, V) removal were observed for freshwater and sea water samples owing to other influential parameters not incorporated in the current model. Therefore, future research shall focus on complex environmental waters to evaluate the optimum C/F/S conditions for Sb(III, V) removal using statistical modeling.

Author Contributions

Conceptualization, M.A.I.; methodology, M.A.I. and R.K.; software, M.A.I.; validation, M.A.I., R.K. and I.T.Y.; formal analysis, R.K., I.T.Y., A.S.B., M.A. and M.W.I.; investigation, M.A.I.; resources, M.A.I., I.T.Y., A.S.B., M.A. and M.W.I.; data curation, M.A.I.; writing—original draft preparation, M.A.I.; writing—review and editing, M.A.I., R.K., I.T.Y., A.S.B., M.A. and M.W.I.; visualization, M.A.I. and R.K.; supervision, M.A.I.; project administration, M.A.I. All authors have read and agreed to the published version of the manuscript.

Funding

This research was jointly supported and conducted in the Institute of Environmental Sciences and Engineering (IESE), School of Civil and Environmental Engineering (SCEE), National University of Sciences and Technology (NUST), Islamabad, Pakistan and Sungkyunkwan University (SKKU), Suwon, Korea. The article processing charges (APC) is funded internally by National University of Sciences and Technology (NUST), Islamabad, Pakistan.

Institutional Review Board Statement

Not applicable.

Informed Consent Statement

Not applicable.

Data Availability Statement

All data used to support the findings of this study are included within the article.

Conflicts of Interest

The authors declare no conflict of interest.

Abbreviations

C/F/SCoagulation-flocculation-sedimentation
BBDBox-Behnken statistical experiment design
RSMResponse surface methodology
FCFerric chloride
USEPAUnited States Environmental Protection Agency
EUEuropean Union
WHOWorld Health Organization
ANOVAAnalysis of variance
TOCTotal organic carbon
DIDeionized
2FITwo factor interaction model
dfDegree of freedom

References

  1. Filella, M.; Belzile, N.; Chen, Y.W. Antimony in the environment: A review focused on natural waters: I. Occurrence. Earth-Sci. Rev. 2002, 57, 125–176. [Google Scholar] [CrossRef]
  2. Mubarak, H.; Chai, L.Y.; Mirza, N.; Yang, Z.H.; Pervez, A.; Tariq, M.; Shaheen, S.; Mahmood, Q. Antimony (Sb)—Pollution and removal techniques—Critical assessment of technologies. Toxicol. Environ. Chem. 2015, 97, 1296–1318. [Google Scholar] [CrossRef]
  3. Arain, M.; Kazi, T.; Baig, J.; Jamali, M.; Afridi, H.; Shah, A.; Jalbani, N.; Sarfraz, R. Determination of arsenic levels in lake water, sediment, and foodstuff from selected area of Sindh, Pakistan: Estimation of daily dietary intake. Food Chem. Toxicol. 2009, 47, 242–248. [Google Scholar] [CrossRef]
  4. Ritchie, V.J.; Ilgen, A.G.; Mueller, S.H.; Trainor, T.P.; Goldfarb, R.J. Mobility and chemical fate of antimony and arsenic in historic mining environments of the Kantishna Hills district, Denali National Park and Preserve, Alaska. Chem. Geol. 2013, 335, 172–188. [Google Scholar] [CrossRef]
  5. Wang, X.; He, M.; Xi, J.; Lu, X. Antimony distribution and mobility in rivers around the world’s largest antimony mine of Xikuangshan, Hunan Province, China. Microchem. J. 2011, 97, 4–11. [Google Scholar] [CrossRef]
  6. Herath, I.; Vithanage, M.; Bundschuh, J. Antimony as a global dilemma: Geochemistry, mobility, fate and transport. Environ. Pollut. 2017, 223, 545–559. [Google Scholar] [CrossRef]
  7. Ungureanu, G.; Santos, S.; Boaventura, R.; Botelho, C. Arsenic and antimony in water and wastewater: Overview of removal techniques with special reference to latest advances in adsorption. J. Environ. Manag. 2015, 151, 326–342. [Google Scholar] [CrossRef]
  8. Daud, M.K.; Nafees, M.; Ali, S.; Rizwan, M.; Bajwa, R.A.; Shakoor, M.B.; Arshad, M.U.; Chatha, S.A.S.; Deeba, F.; Murad, W.; et al. Drinking Water Quality Status and Contamination in Pakistan. BioMed Res. Int. 2017, 2017, 1–18. [Google Scholar] [CrossRef]
  9. Guo, W.; Fu, Z.; Wang, H.; Liu, S.; Wu, F.; Giesy, J.P. Removal of antimonate (Sb (V)) and antimonite (Sb (III)) from aqueous solutions by coagulation-flocculation-sedimentation (CFS): Dependence on influencing factors and insights into removal mechanisms. Sci. Total Environ. 2018, 644, 1277–1285. [Google Scholar] [CrossRef] [PubMed]
  10. Jo, M.; Kim, T.; Choi, S.; Jung, J.; Song, H.-I.; Lee, H.; Park, G.; Lim, S.; Sung, Y.; Oh, J. Investigation of Antimony in Natural Water and Leaching from Polyethylene Terephthalate (PET) Bottled Water. In Proceedings of the 3rd World Congress on New Technologies (NewTech’17), Rome, Italy, 6–8 June 2017; pp. 6–8. [Google Scholar]
  11. Wu, Z.; He, M.; Guo, X.; Zhou, R. Removal of antimony (III) and antimony (V) from drinking water by ferric chloride coagulation: Competing ion effect and the mechanism analysis. Sep. Purif. Technol. 2010, 76, 184–190. [Google Scholar] [CrossRef]
  12. Guo, X.; Wu, Z.; He, M. Removal of antimony(V) and antimony(III) from drinking water by coagulation-flocculation-sedimentation (CFS). Water Res. 2009, 43, 4327–4335. [Google Scholar] [CrossRef] [PubMed]
  13. Kang, M.; Kamei, T.; Magara, Y. Comparing polyaluminum chloride and ferric chloride for antimony removal. Water Res. 2003, 37, 4171–4179. [Google Scholar] [CrossRef]
  14. Inam, M.A.; Khan, R.; Park, D.R.; Khan, S.; Uddin, A.; Yeom, I.T. Complexation of Antimony with Natural Organic Matter: Performance Evaluation during Coagulation-Flocculation Process. Int. J. Environ. Res. Public Health 2019, 16, 1092. [Google Scholar] [CrossRef] [PubMed] [Green Version]
  15. Inam, M.A.; Khan, R.; Park, D.R.; Lee, Y.W.; Yeom, I.T. Removal of Sb(III) and Sb(V) by Ferric Chloride Coagulation: Implications of Fe Solubility. Water 2018, 10, 418. [Google Scholar] [CrossRef] [Green Version]
  16. Inam, M.A.; Khan, R.; Park, D.R.; Ali, B.A.; Uddin, A.; Yeom, I.T. Influence of pH and Contaminant Redox Form on the Competitive Removal of Arsenic and Antimony from Aqueous Media by Coagulation. Minerals 2018, 8, 574. [Google Scholar] [CrossRef] [Green Version]
  17. Inam, M.A.; Khan, R.; Akram, M.; Khan, S.; Yeom, I.T. Effect of Water Chemistry on Antimony Removal by Chemical Coagulation: Implications of ζ-Potential and Size of Precipitates. Int. J. Mol. Sci. 2019, 20, 2945. [Google Scholar] [CrossRef] [Green Version]
  18. Inam, M.A.; Khan, R.; Akram, M.; Khan, S.; Park, D.R.; Yeom, I.T. Interaction of Arsenic Species with Organic Ligands: Competitive Removal from Water by coagulation-flocculation-sedimentation (C/F/S). Molecules 2019, 24, 1619. [Google Scholar] [CrossRef] [Green Version]
  19. Mason, R.L.; Gunst, R.F.; Hess, J.L. Statistical Design and Analysis of Experiments: With Applications to Engineering and Science; John Wiley & Sons: Hoboken, NJ, USA, 2003. [Google Scholar]
  20. Trinh, T.K.; Kang, L.S. Response surface methodological approach to optimize the coagulation–flocculation process in drinking water treatment. Chem. Eng. Res. Des. 2011, 89, 1126–1135. [Google Scholar] [CrossRef]
  21. Tshukudu, T.; Zheng, H.; Hua, X.; Yang, J.; Tan, M.; Ma, J.; Sun, Y.; Zhu, G. Response surface methodology approach to optimize coagulation-flocculation process using composite coagulants. Korean J. Chem. Eng. 2012, 30, 649–657. [Google Scholar] [CrossRef]
  22. Kammoun, R.; Naili, B.; Bejar, S. Application of a statistical design to the optimization of parameters and culture medium for α-amylase production by Aspergillus oryzae CBS 819.72 grown on gruel (wheat grinding by-product). Bioresour. Technol. 2008, 99, 5602–5609. [Google Scholar] [CrossRef]
  23. Del Castillo, E. Process Optimization: A Statistical Approach; Springer Science & Business Media: Berlin, Germany, 2007. [Google Scholar]
  24. Bezerra, M.A.; Santelli, R.E.; Oliveira, E.P.; Villar, L.S.; Escaleira, L.A. Response surface methodology (RSM) as a tool for optimization in analytical chemistry. Talanta 2008, 76, 965–977. [Google Scholar] [CrossRef] [PubMed]
  25. Baskan, M.B.; Pala, A. Determination of arsenic removal efficiency by ferric ions using response surface methodology. J. Hazard. Mater. 2009, 166, 796–801. [Google Scholar] [CrossRef] [PubMed]
  26. Myers, R.H.; Montgomery, D.C.; Anderson-Cook, C.M. Process and product optimization using designed experiments. Response Surf. Methodol. 2002, 2, 328–335. [Google Scholar]
  27. Baskan, M.B.; Pala, A. A statistical experiment design approach for arsenic removal by coagulation process using aluminum sulfate. Desalination 2010, 254, 42–48. [Google Scholar] [CrossRef]
  28. Watson, M.A.; Tubić, A.; Agbaba, J.; Nikić, J.; Maletić, S.; Jazić, J.M.; Dalmacija, B. Response surface methodology investigation into the interactions between arsenic and humic acid in water during the coagulation process. J. Hazard. Mater. 2016, 312, 150–158. [Google Scholar] [CrossRef] [PubMed]
  29. Khan, R.; Inam, M.A.; Zam, S.Z.; Park, D.R.; Yeom, I.T. Assessment of Key Environmental Factors Influencing the Sedimentation and Aggregation Behavior of Zinc Oxide Nanoparticles in Aquatic Environment. Water 2018, 10, 660. [Google Scholar] [CrossRef] [Green Version]
  30. Tripathi, P.; Srivastava, V.C.; Kumar, A. Optimization of an azo dye batch adsorption parameters using Box-Behnken design. Desalination 2009, 249, 1273–1279. [Google Scholar] [CrossRef]
  31. Liu, X.; Millero, F.J. The solubility of iron hydroxide in sodium chloride solutions. Geochim. Cosmochim. Acta 1999, 63, 3487–3497. [Google Scholar] [CrossRef]
  32. Wilkie, J.A.; Hering, J.G. Adsorption of arsenic onto hydrous ferric oxide: Effects of adsorbate/adsorbent ratios and co-occurring solutes. Colloids Surf. A Physicochem. Eng. Asp. 1996, 107, 97–110. [Google Scholar] [CrossRef]
  33. Chaturvedi, S.; Dave, P.N. Removal of iron for safe drinking water. Desalination 2012, 303, 1–11. [Google Scholar] [CrossRef]
  34. World Health Organization. Guidelines for Drinking-Water Quality; World Health Organization: Geneva, Switzerland, 1993. [Google Scholar]
  35. Qiao, J.; Jiang, Z.; Sun, B.; Sun, Y.; Wang, Q.; Guan, X. Arsenate and arsenite removal by FeCl3: Effects of pH, As/Fe ratio, initial As concentration and co-existing solutes. Sep. Purif. Technol. 2012, 92, 106–114. [Google Scholar] [CrossRef]
  36. Paul, K.W.; Borda, M.J.; Kubicki, J.D.; Sparks, D.L. Effect of Dehydration on Sulfate Coordination and Speciation at the Fe−(Hydr)oxide−Water Interface: A Molecular Orbital/Density Functional Theory and Fourier Transform Infrared Spectroscopic Investigation. Langmuir 2005, 21, 11071–11078. [Google Scholar] [CrossRef]
  37. Paul, K.W.; Kubicki, J.D.; Sparks, D.L. Quantum Chemical Calculations of Sulfate Adsorption at the Al- and Fe-(Hydr)oxide-H2O InterfaceEstimation of Gibbs Free Energies. Environ. Sci. Technol. 2006, 40, 7717–7724. [Google Scholar] [CrossRef]
  38. Kwon, K.D.; Kubicki, J.D. Molecular Orbital Theory Study on Surface Complex Structures of Phosphates to Iron Hydroxides: Calculation of Vibrational Frequencies and Adsorption Energies. Langmuir 2004, 20, 9249–9254. [Google Scholar] [CrossRef]
Figure 1. Three-dimensional surface plots and corresponding contour plots showing Sb(III) removal under various pHs (4–10) and FC doses (5–50 mg/L) for an Sb(III) concentration of (a,d) 100 µg/L; (b,e) 550 µg/L; (c,f) 1000 µg/L.
Processes 09 00117 g001
Figure 2. Three-dimensional surface plots and corresponding contour plots showing Sb(V) removal under various pHs (4–10) and FC doses (5–50 mg/L) for an Sb(V) concentration of (a,d) 100 µg/L; (b,e) 550 µg/L; (c,f) 1000 µg/L.
Processes 09 00117 g002
Figure 3. Effect of FC dose (10–50 mg/L) on the residual Fe concentration and Sb(III, V) removal efficiencies under neutral pH (7 ± 0.1), Sb(III, V) concentration (1 mg/L) and temperature (25 ± 1 °C).
Processes 09 00117 g003
Figure 4. Actual and predicted removal efficiencies of (a) Sb(III) and; (b) Sb(V) for various environmental water samples using the Box–Behnken statistical experiment design (BBD) model with minimizing and maximizing FC dose as a considerable factor.
Processes 09 00117 g004
Table 1. Levels of each independent factor for Box–Behnken.
FactorsUnitsSymbolCoded Levels
−10+1
Initial Sb(III, V) concentrationµg/LA1005501000
Ferric chloride (FC) dosemg/LB527.550
pH-C4710
Table 2. Experimental data points used in Box–Behnken experimental design.
Experimental RunInitial Sb(III, V) Concentration (µg/L)FC Dose (mg/L)pH
110027.54
255027.57
355054
4100057
510027.510
6100507
7100027.54
8550510
955027.57
1010057
11100027.510
1255027.57
1355027.57
1455027.57
15550504
161000507
175505010
Table 3. Characteristics of synthetic and natural water samples.
ParameterFresh WaterGround WaterSea WaterTap Water
pH6.907.517.907.02
Conductivity (µS/cm)1199652610082.42
Ionic Strength (mM/L)0.7912.093810.002
TOC (mg/L)605.51-
HCO3 (mg CaCO3/L)1215360>80
PO4 (mg/L)0.6400-
Na+ (mg/L)015863500.31
K+ (mg/L)1.208.592300.06
Mg2+ (mg/L)3.4927.408150.14
Ca2+ (mg/L)1.5049.502450.81
Cl (mg/L)6.61141105000.28
SO42− (mg/L)020950-
Sb (mg/L) *1 *1 *1 *1 *
* indicates Sb(III, V) solutions were spiked in water samples.
Table 4. Comparison of observed and predicted antimony removal efficiency.
Experiment No.Removal Efficiency (%)
Sb(III)Sb(V)
ObservedPredictedObservedPredicted
156.4762.018.485.99
286.7986.3085.3685.82
349.2647.416.890
466.4265.2969.9175.11
581.4778.4900
688.6189.7494.5889.38
773.1275.9810.4312.39
854.2160.8800
985.4886.3086.0985.82
1059.1555.4652.6862.33
1191.3285.7902.49
1287.1886.3085.4885.82
1386.4786.3086.9285.82
1485.5986.3085.2385.82
1589.4982.8213.2620.95
1697.50100.097.1187.46
1793.7895.633.3410.50
Table 5. Model summary statistics for response variables investigated.
SourceSequential p-ValueLack of Fit p-ValueStd. Dev.R2Adjusted R2Predicted R2Remarks
Sb(III) Removal
Linear<0.00010.00017.570.80300.75750.6685
2FI0.9824<0.00018.560.80610.68980.3405
Quadratic0.02460.00025.440.94520.87480.1324Suggested
Cubic0.0002 0.740.99940.9976 Aliased
Sb(V) Removal
Linear0.9174<0.000144.690.0369−0.1854−0.7355
2FI0.9991<0.000150.900.0390−0.5376−2.7713
Quadratic<0.0001<0.00018.310.98210.95900.7144Suggested
Cubic<0.0001 0.700.99990.9997 Aliased
Table 6. ANOVA results for two second order responses (Sb(III) and Sb(V) removal) modelled.
SourceSum of SquaresdfMean SquareF Valuep-Values Prob > F
Sb(III) Removal
Model3571.039396.7813.430.0012 *
A-Sb(III) conc226.241226.247.660.0278 *
B-FC dose2461.9112461.9183.31<0.0001 *
C-pH345.361345.3611.690.0112 *
AB0.6610.660.0220.8858
AC11.15111.150.380.5585
BC0.1110.113.685 × 10−30.9533
A221.33121.330.720.4237
B2158.291158.295.360.0538
C2303.181303.1810.260.0150 *
Lack of Fit204.64368.21122.910.0002 *
Pure Error2.2240.55
R2 = 0.9452, R2adj = 0.8748, adequate precision = 12.899 (>4)
Sb(V) Removal
Model26,475.5592941.7342.63<0.0001 *
A-Sb(V) conc58.92158.920.850.3862
B-FC dose776.381776.3811.250.0122 *
C-pH159.491159.492.310.1722
AB54.02154.020.780.4056
AC0.9510.950.0140.9099
BC2.3012.300.0330.8605
A274.11174.111.070.3345
B239.18139.180.570.4757
C224,894.88124,894.88360.75<0.0001 *
Lack of Fit481.103160.37327.59<0.0001 *
Pure Error1.9640.49
R2 = 0.9821, R2adj = 0.9590, adequate precision = 15.235 (>4)
* Significant (p < 0.05).
Table 7. Comparison of experimental and predicted Sb(III, V) removal efficiencies under optimum experimental design parameters obtained using Box–Behnken method.
Sb(III, V) ConcentrationSb(III) SpeciesSb(V) Species
FC Dose (mg/L)pHRemoval Efficiency (%)FC Dose (mg/L)pHRemoval Efficiency (%)
(µg/L)ObservedPredictedObservedPredicted
100508.439691.66506.919589.46
55045.448.0295.897.60506.909892.71
100040.397.9196.498.32506.8997.587.56
Publisher’s Note: MDPI stays neutral with regard to jurisdictional claims in published maps and institutional affiliations.

