Article

Impact of Altered Trehalose Metabolism on Physiological Response of Penicillium chrysogenum Chemostat Cultures during Industrially Relevant Rapid Feast/Famine Conditions

State Key Laboratory of Bioreactor Engineering, East China University of Science and Technology (ECUST), Shanghai 200237, China
*
Authors to whom correspondence should be addressed.
Processes 2021, 9(1), 118; https://doi.org/10.3390/pr9010118
Submission received: 17 December 2020 / Revised: 4 January 2021 / Accepted: 5 January 2021 / Published: 7 January 2021
(This article belongs to the Special Issue Advances in Microbial Fermentation Processes)

Abstract

:
Due to insufficient mass transfer and mixing issues, cells in the industrial-scale bioreactor are often forced to experience glucose feast/famine cycles, mostly resulting in reduced commercial metrics (titer, yield and productivity). Trehalose cycling has been confirmed as a double-edged sword in the Penicillium chrysogenum strain, which facilitates the maintenance of a metabolically balanced state, but it consumes extra amounts of the ATP responsible for the repeated breakdown and formation of trehalose molecules in response to extracellular glucose perturbations. This loss of ATP would be in competition with the high ATP-demanding penicillin biosynthesis. In this work, the role of trehalose metabolism was further explored under industrially relevant conditions by cultivating a high-yielding Penicillium chrysogenum strain, and the derived trehalose-null strains in the glucose-limited chemostat system where the glucose feast/famine condition was imposed. This dynamic feast/famine regime with a block-wise feed/no feed regime (36 s on, 324 s off) allows one to generate repetitive cycles of moderate changes in glucose availability. The results obtained using quantitative metabolomics and stoichiometric analysis revealed that the intact trehalose metabolism is vitally important for maintaining penicillin production capacity in the Penicillium chrysogenum strain under both steady state and dynamic conditions. Additionally, cells lacking such a key metabolic regulator would become more sensitive to industrially relevant conditions, and are more able to sustain metabolic rearrangements, which manifests in the shrinkage of the central metabolite pool size and the formation of ATP-consuming futile cycles.

Graphical Abstract

1. Introduction

The filamentous fungus Penicillium chrysogenum has long been explored for its production of β-lactam antibiotics (e.g., penicillin G, cephalosporin C), and the potential of the biosynthetic gene clusters in Penicillium species has recently been revisited, revealing that it would be a promising cell factory for the production of a series of secondary metabolites and natural products [1,2]. Bioprocess scale-up is the critical step for the commercialization of biotech innovations. Nonetheless, a loss of production capacity in terms of either titer, yield or productivity, or combinations thereof, has often been observed during the process scale-up. Although the interplay between cell systems and their production conditions can be measured, the underlying mechanism is partially unknown, which is, however, seldom accounted for during lab-scale research and development [3,4]. Representatively, the non-ideal mixing and mass transfer limitations at the large scale in most cases are not rigorously considered in lab-scale designs, and thus the outcome of the environmental impacts cannot match the reality at the large scale [5,6]. In industrial settings, the environmental gradients, such as those of substrate, dissolved oxygen and pH, caused by insufficient mixing and mass transfer restrictions, and of the shear force caused by the impellers, often exert a negative impact on the resulting commercial indicators (i.e., titer, yield and productivity) and thus the economic benefits [7,8,9].
Although there are many metabolic models being developed to characterize, predict, and evaluate the growth and production dynamics of cell factories in the biological system, a huge gap between laboratory-scale research and industrial applications still exists because of the limited knowledge about the intracellular dynamics under large-scale production limitations [4]. Increasing evidence has shown that steady-state data at the laboratory scale do not suffice to extract transient dynamics and potential regulators in response to a change in conditions, which are, however, very likely actionable at the production scale [10]. To address this, scale-down studies that take into account the environmental conditions experienced by the cells at the large scale have been carried out to evaluate the process performance and elucidate the mechanisms regulating the cellular metabolic flux [8,9,11,12,13,14,15]. As an example, in large-scale penicillin production by Penicillium chrysogenum, the cells are often repeatedly forced to experience high/low substrate concentrations (feast-famine cycles), which may partly account for the productivity loss. In an attempt to explain the mechanism behind this, de Jonge et al. (2011) [16] and Wang et al. (2018) [8] have adopted block-wise feeding schemes to simulate the substrate heterogeneity experienced by a high-yielding Penicillium chrysogenum strain in glucose-limited chemostat cultures. The results revealed that under feast–famine cycles, the penicillin production capacity was halved, and the intracellular metabolite pools displayed fast dynamics. This efficient and robust control of intracellular metabolite concentration very likely indicated a potential key for the cell homeostasis. For instance, the turnover of intracellular carbohydrates, especially reduced sugars such as mannitol, arabitol, erythritol, as well as trehalose and glycogen, was drastically enhanced during rapid feast/famine conditions in Penicillium chrysogenum, which, according to metabolic flux analysis, accounts for about 52% of the gap in the ATP balance, and might partly explain the productivity loss in this scenario [17,18].
Among these ATP-consuming cycles, there has been a focus on the physiological role of transient trehalose futile cycling in the cellular phenotype because trehalose has been proven to harbor a multitude of functions, such as energy and carbon reserves, structural components, and dynamic regulators [19,20]. It has long been known that a functional trehalose pathway is vitally important for Saccharomyces cerevisiae grown on rapidly fermentable sugars [21], e.g., glucose, and a sudden shift from glucose-limiting to glucose-excess conditions would lead to growth arrest, which has been linked to the autocatalytic design of the pathway. Additionally, either the unregulated influx of glucose or insufficient phosphate availability have accounted for the appearance of this state [22]. Very recently, van Heerden et al. (2014) reported that trehalose metabolism constitutes a futile cycling that would facilitate metabolic balance via maintaining a proper inorganic phosphate level inside the model eukaryote Saccharomyces cerevisiae cell, in order to cope with a sudden glucose availability [23]. In our previous study, as shown in Figure 1, the trehalose synthetic pathway was (partly) blocked by knocking out either the gene tps1 (encoding trehalose-6-phosphate synthase) or the gene tps2 (encoding trehalose-6-phosphate phosphatase), and we have concluded that in steady-state glucose-limited chemostat cultures, the intact trehalose pathway plays an important role in metabolic regulation and is instrumental in maintaining a higher penicillin production capacity [24]. Nonetheless, as noted above, it is much more pertinent to evaluate the effect of an altered trehalose metabolism on process performance under industrially relevant conditions, e.g., feast/famine conditions in representative scale-down simulators.
In this study, a high-producing industrial strain of P. chrysogenum Wisconsin 54-1255, and the derived strains, P. chrysogenum Δtps1 (lacking trehalose-6-phosphate synthase) and P. chrysogenum Δtps2 (lacking trehalose-6-phosphate phosphatase), grown in glucose-limited chemostats at the average dilution rate of 0.05 hr−1, were assessed under two substrate availability conditions by performing either a continuous or a block-wise feeding scheme. A systems approach using fluxomics (stoichiometry) and metabolomics for both conditions was for the first time carried out. Overall, we aim at the systematic metabolic characterization and the identification of the potential metabolic role of the trehalose metabolism under industrially relevant conditions.

2. Materials and Methods

2.1. Strains

The Penicillium chrysogenum Wisconsin 54-1255 was purchased from ATCC, while the P. chrysogenum-Δtps1 and P. chrysogenum-Δtps2 were constructed using the Agrobacterium transformation method in our laboratory. For construction details, please refer to Wang et al. (2019) [24]. Fungal spores were prepared on potato dextrose agar (PDA) medium and a concentrated spore suspension was aliquoted and conserved in physiological salt solution (0.9% (w/v) NaCl in demineralized water) at −80 °C. A spore suspension inoculation method was used for all experiments and the spore suspension was prepared to ensure the final spore concentration in the bioreactor at about 1 × 10⁶/mL after the inoculation, as described previously [24].

2.2. Media

The medium for the batch phase and chemostat cultivation contained the same components (per kg of medium): 16.5 g C6H12O6·H2O, 5 g (NH4)2SO4, 1 g KH2PO4, 0.5 g MgSO4·7H2O, 2 mL trace elements, 1ml antifoaming agent. The trace element composition (per kg of deionized water) was 75 g Na2EDTA·2H2O, 10 g ZnSO4·7H2O,10 g MnSO4·1H2O, 20 g FeSO4·7H2O, 2.5 g CaCl2·2H2O, 2.5 g CuSO4·5H2O. The phenylacetic acid (PAA) concentrations in the batch and the chemostat media were supplied at 0.4085 g/kg and 0.68 g/kg, respectively, which were neither limiting nor toxic for cell growth throughout the cultivation process [25]. The preparation and sterilization of the cultivation medium have been described previously [26]. Briefly, the glucose solution and the PAA-containing salt solution were prepared separately and autoclaved at 110 °C and 121 °C for 40 min and 30 min, respectively. The PAA was dissolved in a KOH solution, with a PAA:KOH molar ratio of 1:1.2.

2.3. Chemostat Cultivation

The chemostat cultivation was performed the same as described previously [24]. Briefly, the chemostat system was based on a 5 L bioreactor (Shanghai Guoqiang Bioengineering Equipment Co., Ltd., Shanghai, China) with a 3 L working volume, followed by the depletion of the initial glucose in the batch phase. As shown in Figure 2, steady state conditions were ensured as the standard reference condition where the medium was continuously fed to the cultivation system; fast feast/famine cycles were initiated via an intermittent feeding regime, which was imposed on the culture through the cultivation. An on/off feeding was applied with a cycle time of 360 s, and the feed pump was precisely controlled by a timer with an algorithm, switching it on every first 36 s of the cycle. During the feeding interval, the pump speed was set 10 times higher than that under reference conditions to keep the average glucose feeding rate of the intermittently fed cultures the same as that of the control chemostats.
All aerobic chemostat cultivations were controlled at the average dilution rate of 0.05 h−1, 2 L/min, and 0.5 bar overpressure. Effluent was removed discontinuously into an effluent vessel if the broth weight exceeded 3 kg by means of a weight-controlled sensor controlling (on/off) a peristaltic pump. Dissolved oxygen tension (DOT) was monitored in situ with an oxygen probe (Mettler-Toledo, Greifensee, Switzerland). The pH of the culture system was monitored using a sterilizable pH probe (Mettler-Toledo, Greifensee, Switzerland) mounted in the bioreactor and was automatically maintained at 6.5 by adding 4M NaOH. The offgas oxygen and carbon dioxide levels were real-time monitored by offgas mass spectrometry (MAX300-LG, Extrel, Pittsburgh, PA, USA). Each experiment was carried out at least in duplicate for biological relevance.

2.4. Cell Dry Weight

The cell dry weight (CDW) was measured through the weight difference between empty and dried glass fiber filters (47 mm in diameter, 1 μm pore size, type A/E; Pall Corporation, East Hills, NY, USA) with biomass. An amount of 15 mL of broth was withdrawn and divided into three portions for the measurement of the CDW. For each CDW sample, 5 mL of the broth was filtered, and the cell cake was washed twice with 10 mL of demineralized water and dried at 70 °C for 24 h. The biomass-containing filters were cooled to room temperature in a desiccator before weighing.

2.5. Rapid Sampling, Quenching and Metabolite Extraction

Under the reference steady state conditions, samples were taken at each residence time. Under fast feast/famine conditions, the continuous rapid sampling of the broth for the measurement of intracellular metabolites was carried out after 100 h of intermittent feeding at 0, 8, 16, 26, 36, 50, 70, 90, 110, 145, 180, 200, 220, 240, 260, 280, 320 and 350 s within a complete 360 s feeding cycle.
For extracellular sampling, the cold steel-bead method combined with liquid nitrogen was used for the fast filtration and quenching of extracellular enzyme activities, as described previously [27]. For intracellular sampling, about 1 mL of broth was taken from the bioreactor into a tube containing the quenching solution (−27.5 °C, 40% V/V aqueous methanol). To ensure fast sampling and rapid quenching within a second to circumvent as much as possible the change of intracellular metabolites, a customized fast sampling device was developed. The sampling device consists of three normally closed electric pinch valves controlled by a programmed single-chip microcomputer (SCM). The sequential opening and closing of each valve and the combinations thereof can allow sampling with 1 mL of broth within half a second. For detailed sampling procedures, please refer to Li et al. (2018) [28]. Fast filtration and a modified cold washing method were used for the rapid and effective removal of all compounds present outside the cells. In this study, a previously well-established rapid sampling, quenching as well as the follow-up metabolite extraction protocol was followed, as described previously [10].

2.6. Analytical Procedures

Samples for intracellular amino acids, sugar phosphates, organic acids and sugar alcohols quantifications were analyzed using gas chromatography–mass spectrometry (GC–MS) (7890A GC coupled to 5975C MSD; Agilent Technologies, Santa Clara, CA, USA). The analytical procedure undertaken as per de Jonge et al. [16] with some minor modifications in the column and temperature gradients. For more specific settings, please refer to Liu et al. [29].
Concentrations of PAA, Penicillin G and other byproducts in the penicillin biosynthetic pathway were measured with an isocratic reversed-phase high performance liquid chromatography (HPLC) method, which was equipped with an Agilent Zorbax SB-C18 reversed-phase column (150 mm× 4.6 mm ID, 5 µm). The mobile phase consisted of 0.44 g KH2PO4 per liter in the acetonitrile/water solution (65/35, V/V). The sample injection volume, the detection wave length, the flow rate and the column temperature were 5 µL, 214 nm, 1.5 mL/min and 25 °C, respectively [27].

2.7. Calculation Methods and Data Reconciliation

The specific rates, such as q s , q C O 2 , q O 2 and µ, were calculated using respective mass balances [9], and then were reconciled using the approach of Verheijen based on elemental, charge and degree of reduction balances [30]. The elemental biomass composition and molar weight of 28.05 gDW·Cmol−1 were taken from de Jonge et al. [16]. They were assumed to be constant for all conditions.

3. Results and Discussion

3.1. General Observations

To investigate the effect of the altered trehalose metabolism on the physiological response of Penicillium chrysogenum under industrially relevant conditions, i.e., dynamic substrate availability in this study, the strains were cultivated in the glucose-limited chemostat mode where rapid feast/famine conditions were imposed via a block-wise feeding strategy. All chemostat cultivations were preceded by a batch phase wherein the strains grew exponentially until all glucose was depleted. The end of batch was determined when the online oxygen uptake rate (OUR) and carbon evolution rate (CER) went down while the dissolved oxygen (DO) level and pH went up. Due to the carbon catabolite repression, no penicillin was produced in the batch phase. After about five residence times (~100 h), all chemostat cultures reached a dynamic steady state (Figure 3). Additionally, the measured time series of the concentrations of biomass, PAA, penicillin-G (PenG) (Figure 3), the main byproducts (Figure 4) associated with penicillin biosynthesis, and the biomass specific rates (Figure 5) show that the chemostat cultivations were well reproducible.
In addition, Table 1 shows that the carbon and redox balances closed within 5% for all chemostat cultures, which suggests that marginal unknown compounds are formed during the cultivation.

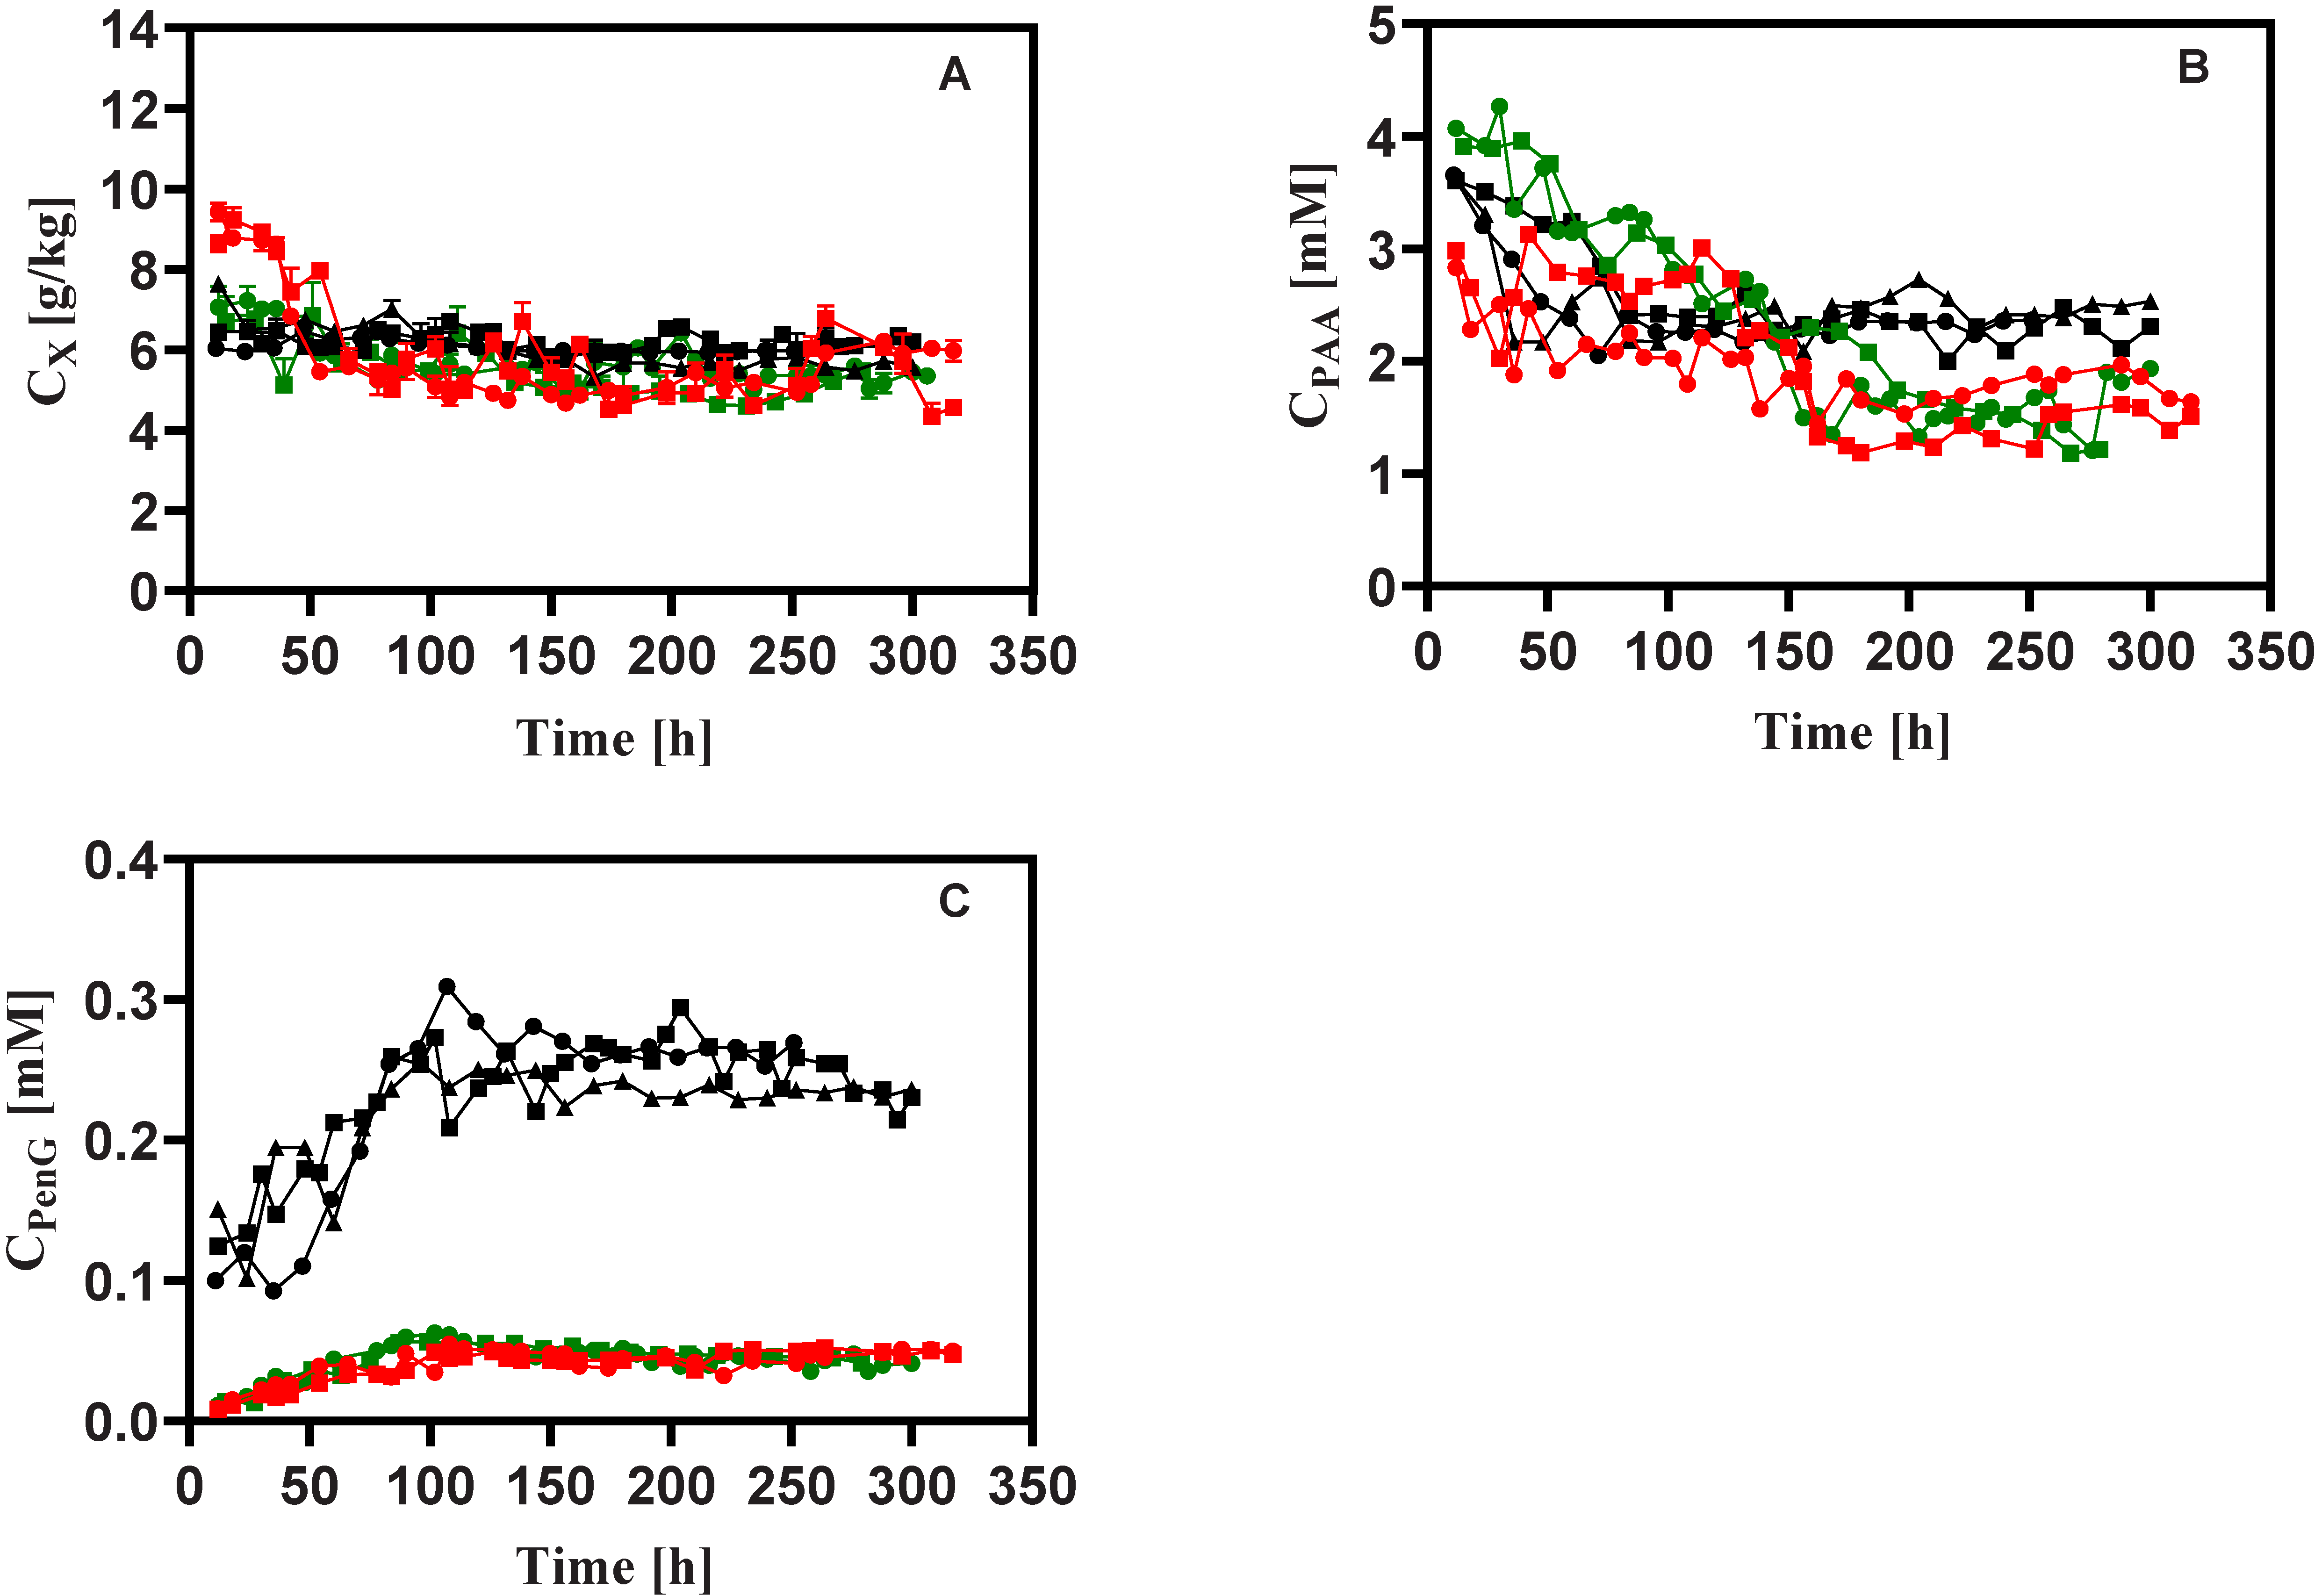
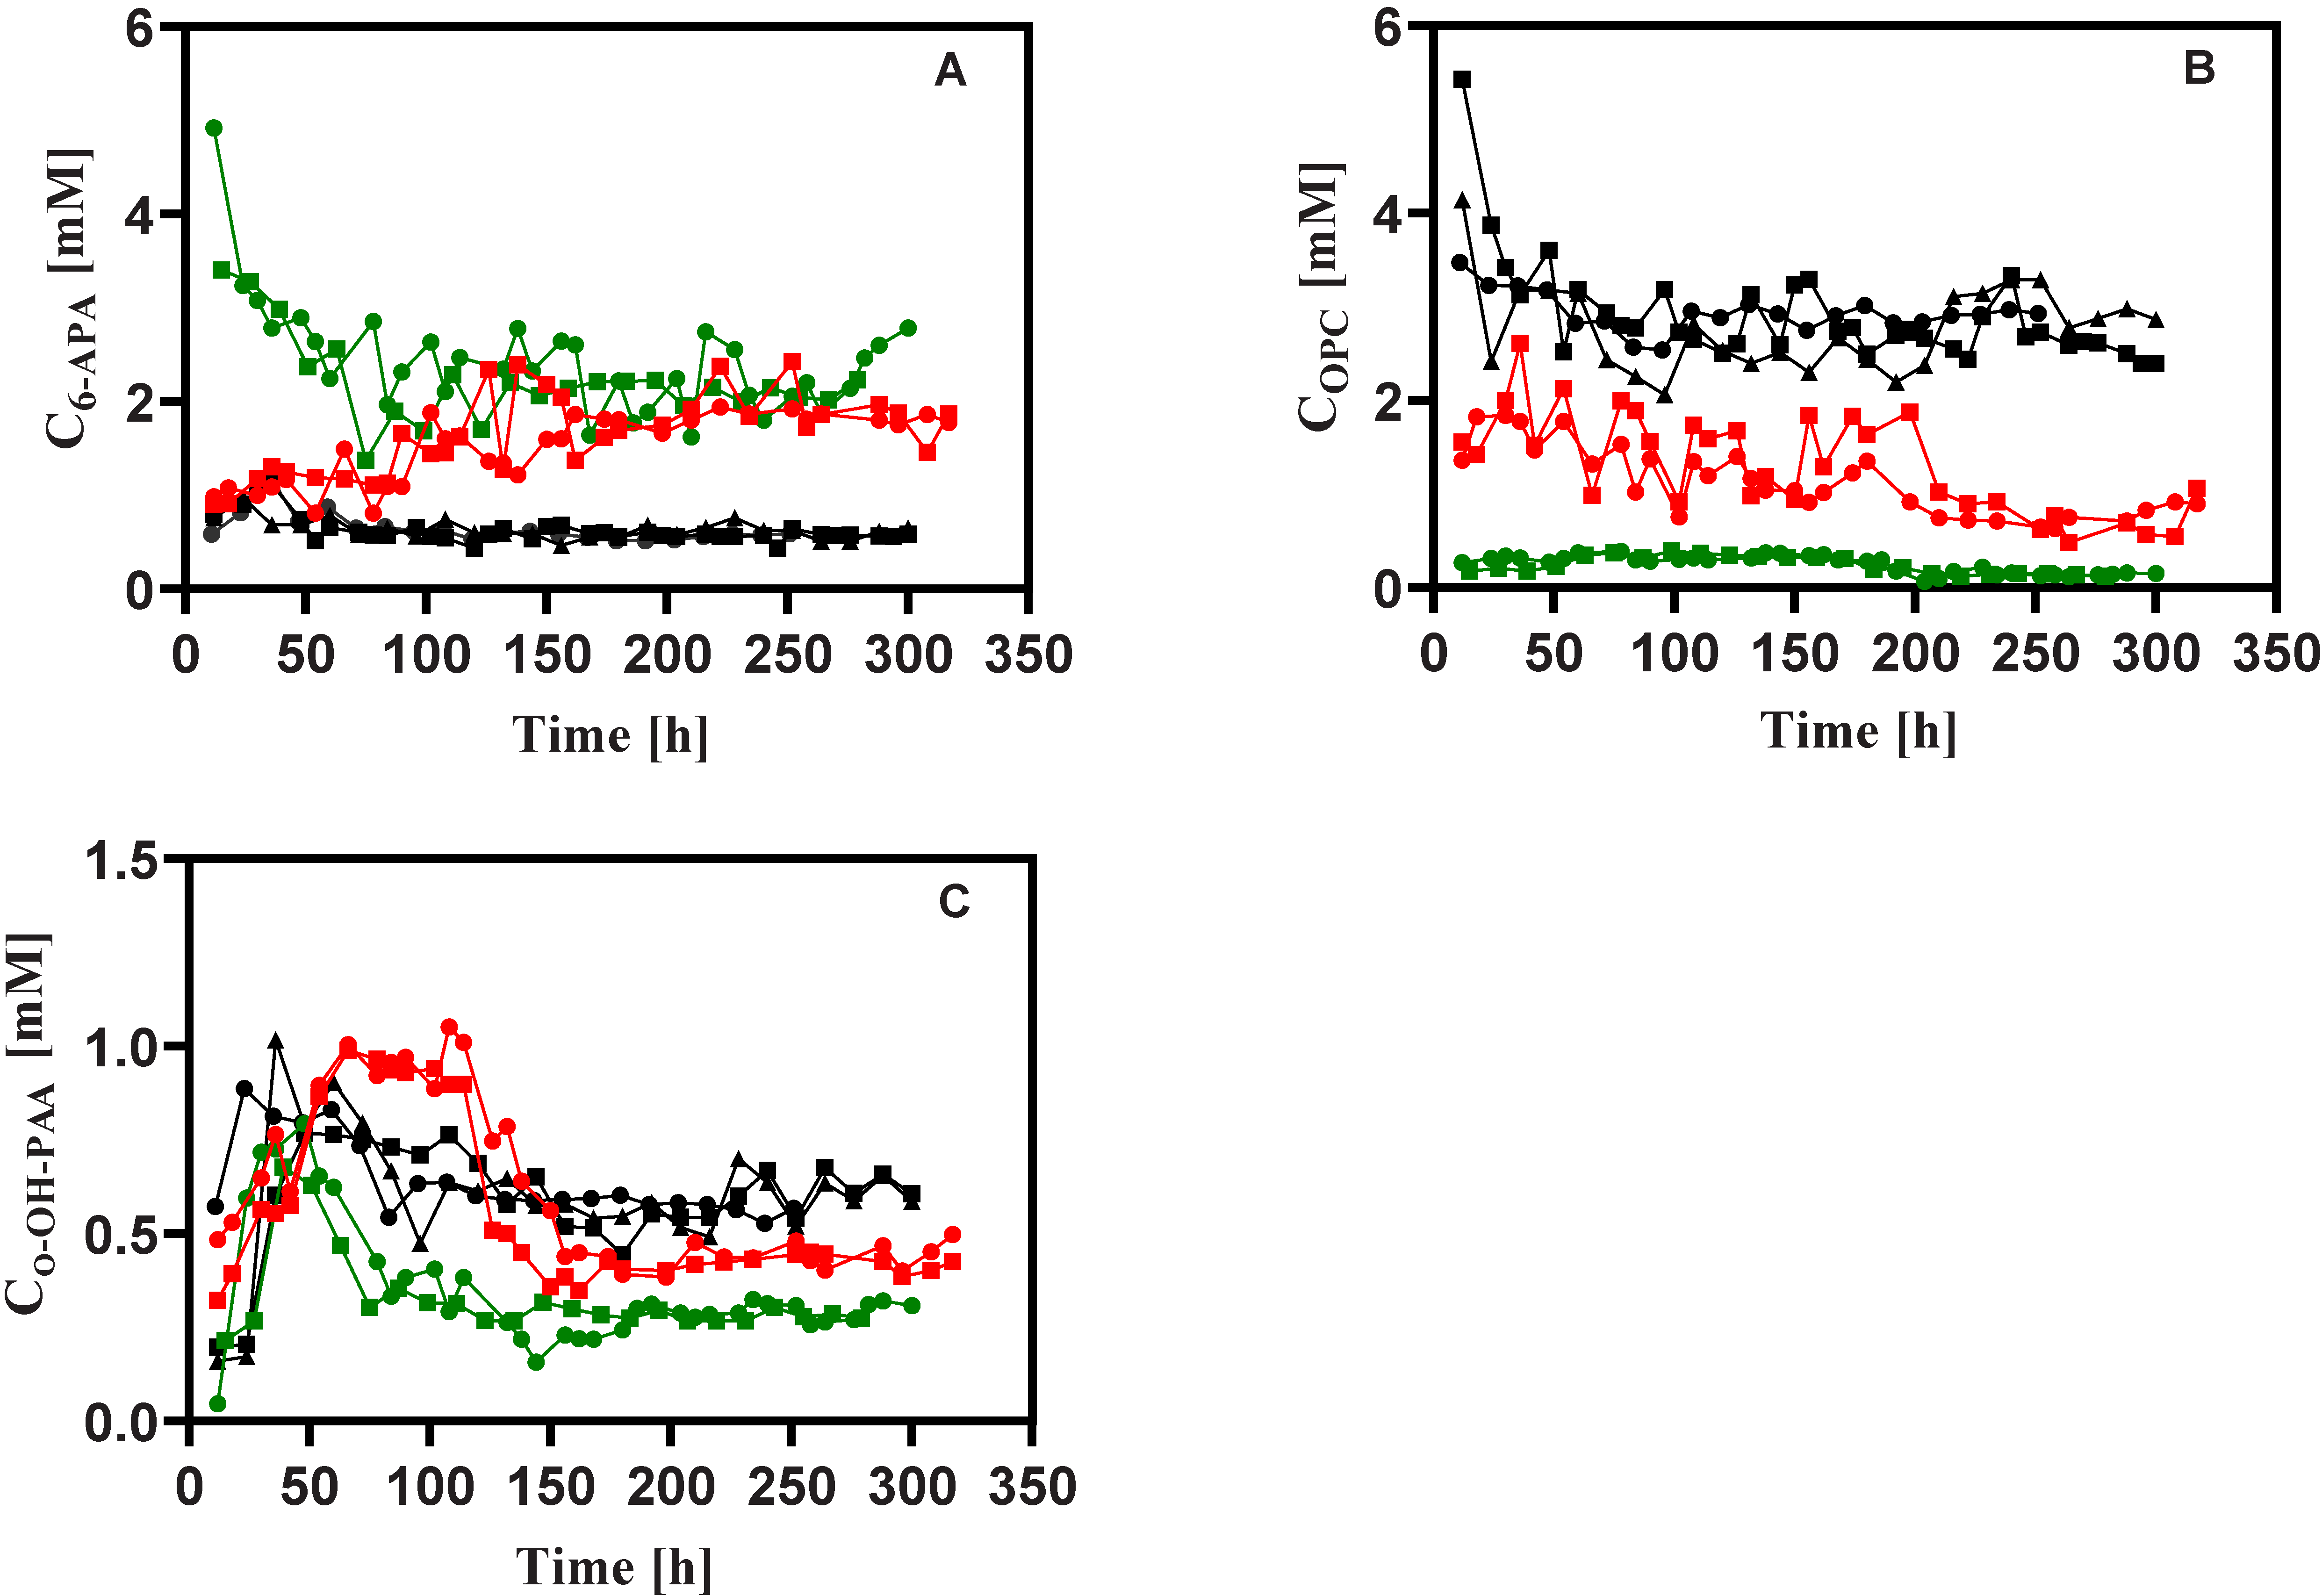
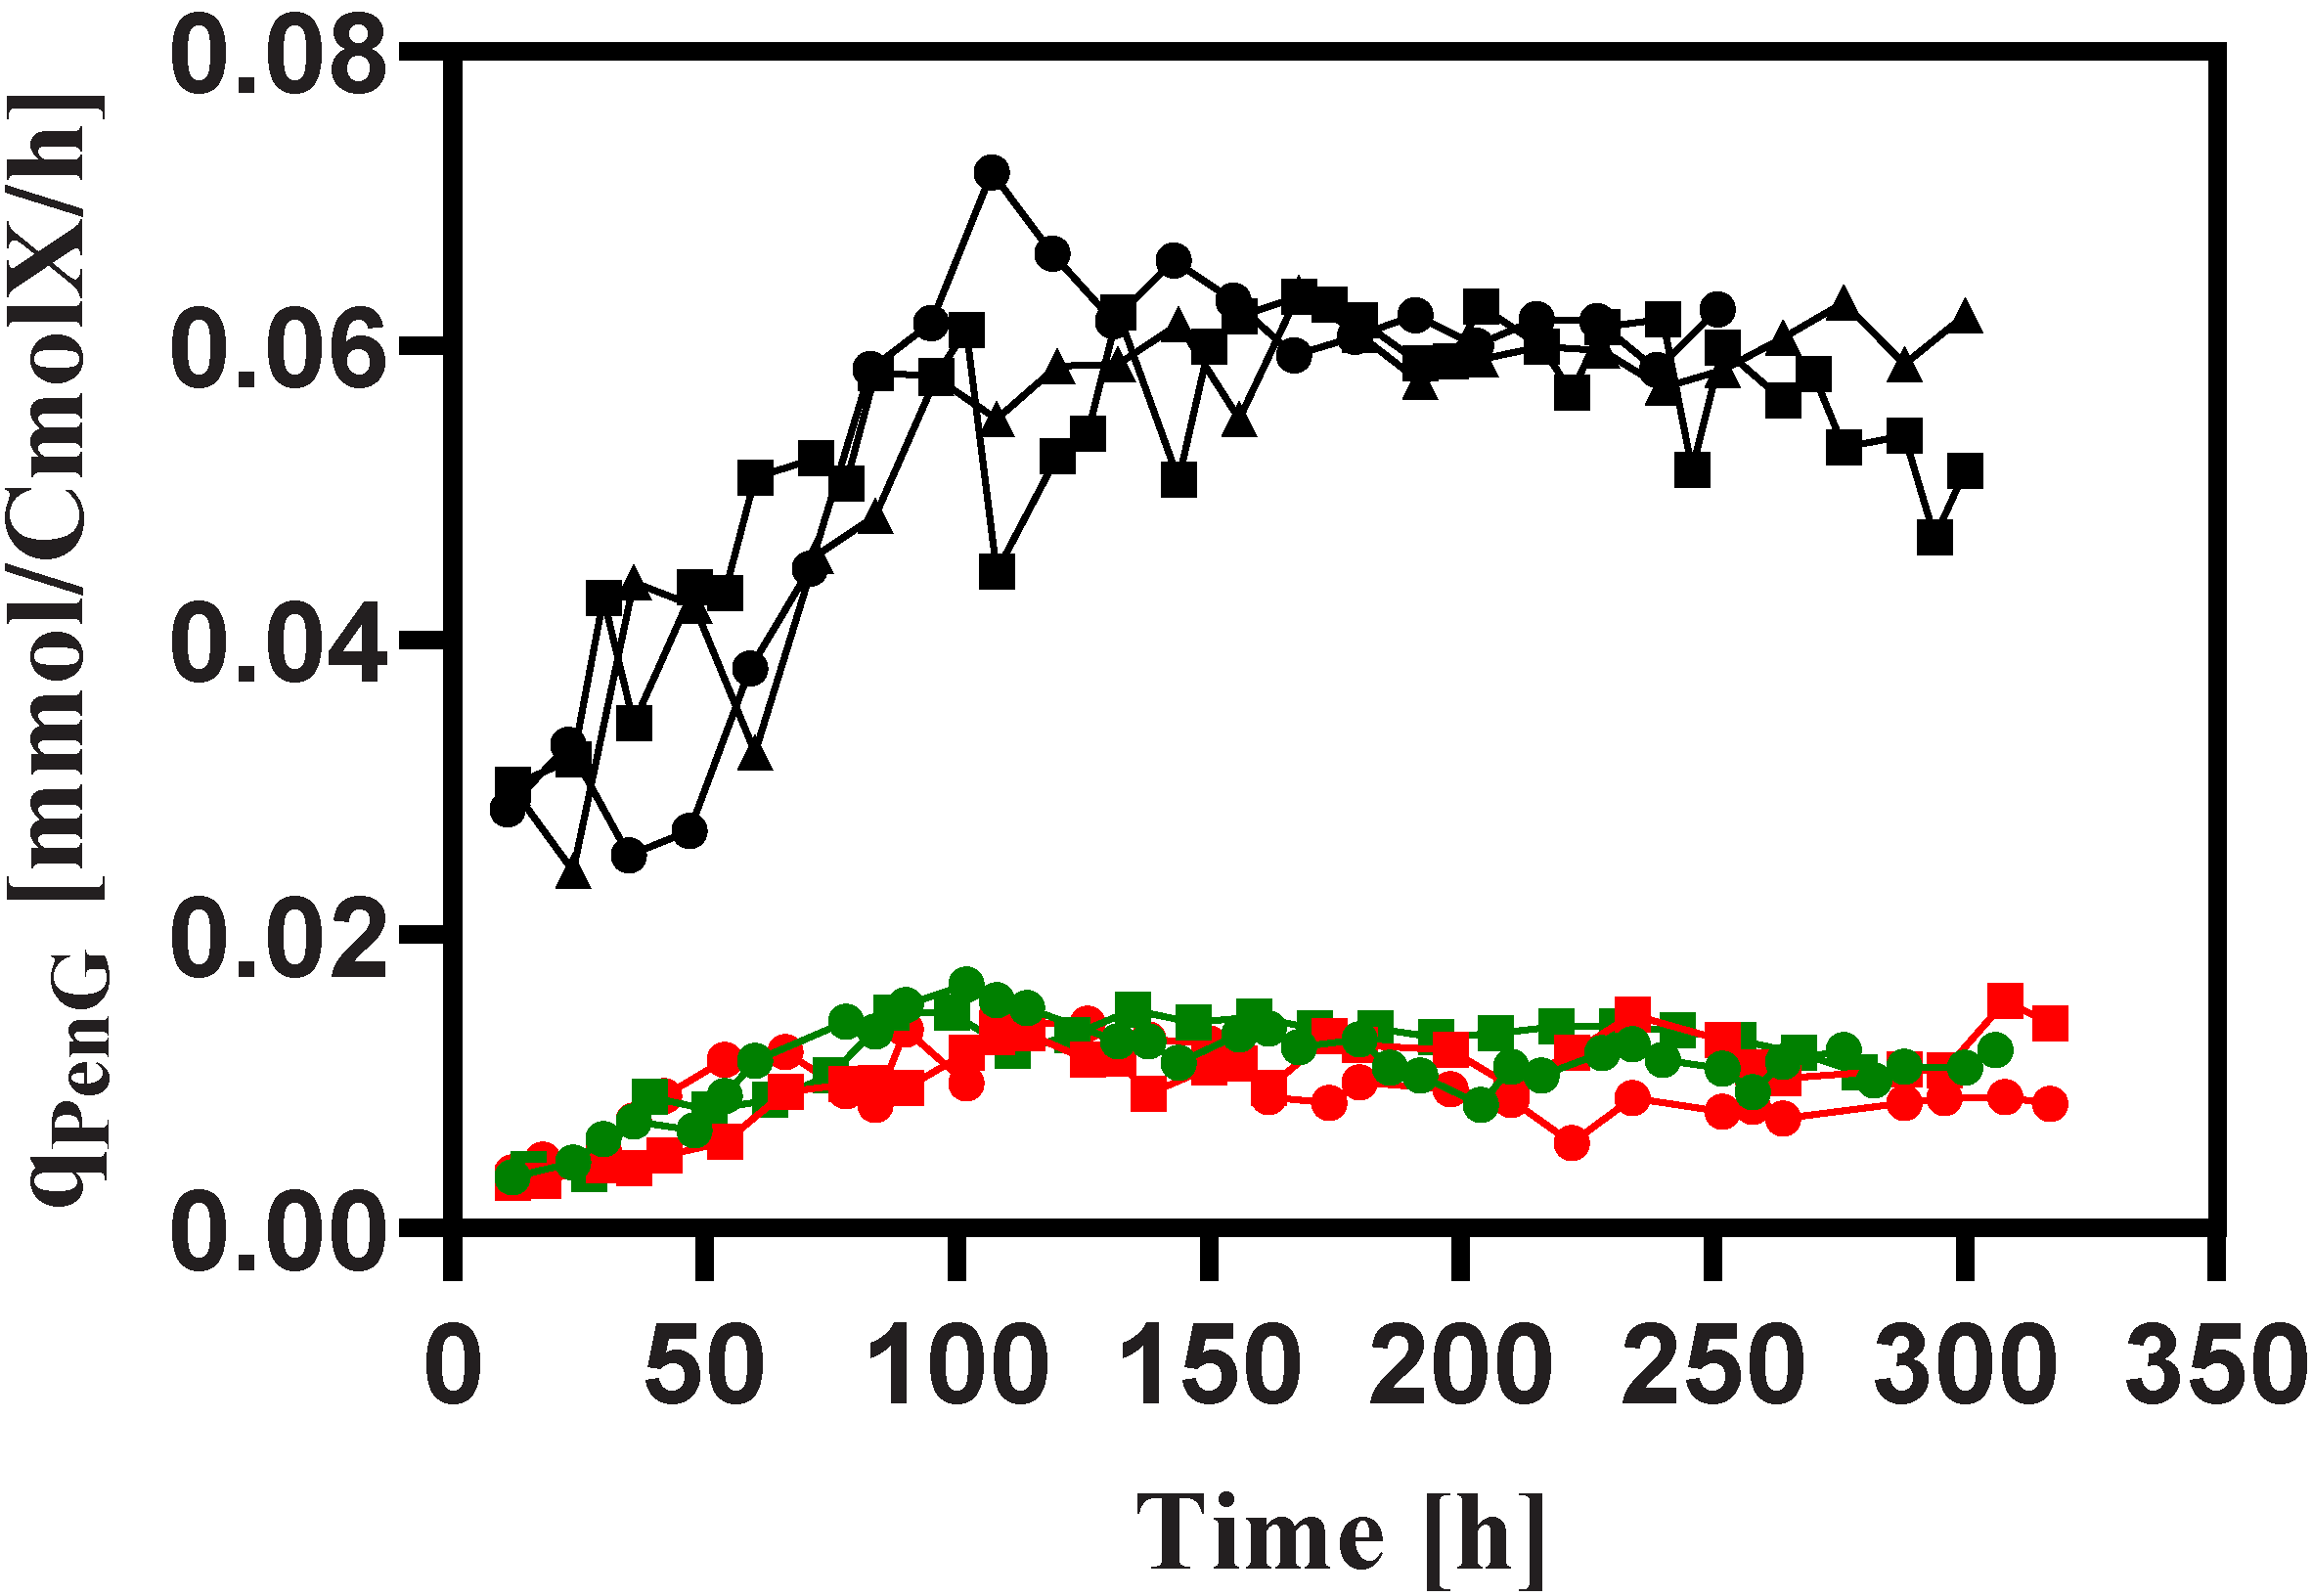
3.2. Penicillin Production

A schematic overview of the penicillin synthesis pathway, including the byproduct mentioned in this study, can be seen in Figure 6. It is apparent that the biomass-specific rates for penicillin production ( q P e n G ) obtained for all cultivations reached a maximum value at about 100 h after the start-up of the chemostat phase, which suggests the typical behavior of the induction of the penicillin pathway enzymes because of the repression of the genes encoding these enzymes at high glucose concentrations in the batch phase [26]. Strikingly, the penicillin production capacity in terms of q P e n G was reduced by about 30%, 74% and 78% for P. chrysogenum Wisconsin 54-1255, P. chrysogenum-Δtps1 and P. chrysogenum-Δtps2 strains under feast/famine conditions, respectively, relative to those under steady state conditions [24]. This can be anticipated because the cells under rapid feast/famine conditions will use multi-layered metabolic regulation mechanisms to maintain a balanced metabolic state at different omics levels (e.g., short-term stringent regulation, long-term repeatedly switched on/off of related genes, protein turnover, etc.), which is often at the expenditure of extra ATP and/or reducing equivalents [31,32,33,34]. Meanwhile, it was found that the absence of intact trehalose metabolism can aggravate the loss of the penicillin production capacity, which can be manifested by an almost 40% greater reduction in penicillin productivity for P. chrysogenum-Δtps1 and P. chrysogenum-Δtps2 strains under industrially relevant conditions as compared to the steady state conditions. Combining this with the findings from the steady state conditions as we reported elsewhere [24], it can therefore be concluded that trehalose plays an essential role in regulating penicillin production under both non-perturbed and perturbed conditions.
In spite of the reduced production performance under rapid feast/famine conditions, an interesting observation showed that the cells appeared to maintain their production capacity throughout the cultivation process (Figure 5), which was, however, not the case for the strains under steady state conditions, which unavoidably undergo strain degeneration (i.e., loss of production capacity) followed by the onset of the maximum q P e n G value [16,35]. This result is very consistent with previous reports by de Jonge et al. [16] and Wang et al. [8], and also suggests that there must be an unknown regulatory mechanism contributing to this non-declining phenomenon.

3.3. Stoichiometry

The biomass-specific rates and relevant yields are provided in Table 1, and the results shows that the absence of intact trehalose metabolism gives rise to significant changes in strain process performance. Notably, during the chemostat phase, the biomass-specific carbon dioxide evolution rates ( q C O 2 ) were increased by 55% and 48%, respectively, in P. chrysogenum-Δtps1 and P. chrysogenum-Δtps2 strains compared to the wild-type P. chrysogenum Wisconsin strain. This considerable increase in q C O 2 is mainly ascribed to the significant increase in specific glucose consumption rates (~90%) and the increase in PAA consumption rates (~6–7%). In the Wisconsin family strains, the reduced oxidative activity of a phenylacetate-oxidizing cytochrome P450 makes more PAA available for the production of PenG [36]. However, the PAA recoveries were not closed in the chemostat phase, leaving 90% or even more PAA catabolized towards the formation of ο-OH-PAA, and further, to acetoacetate and fumarate, through the homogentisate pathway. In the engineered strains, more PAA was consumed while much less PenG and ο-OH-PAA accumulated, which also pointed to the increased catabolism of PAA as the second carbon source (Table 1). In contrast with this, the PAA recoveries were very well closed during the early phase of the batch process before the initiation of the chemostat mode (Figure 7). In the batch phase, no penicillin was produced, and the summation of the residual PAA concentration and the formed ο-OH-PAA concentration was almost equal to the initial PAA concentration in the bioreactor. Nonetheless, the PAA concentration was gradually decreased during the late phase of the batch fermentation. Meanwhile, we observed that the glucose was rapidly consumed and reached a threshold value at the late stage, which then coincided with the PAA consumption. Combining this, the results indicated that the catabolism of PAA as the carbon source can only be activated under carbon-limited conditions rather than carbon-rich scenarios, which was proven to be controlled via carbon catabolite repression.
The other byproduct associated with penicillin production, such as 6APA and OPC, were also measured in this work. The results showed that as compared to the wild-type strain, the specific formation rates for 6APA and OPC were significantly increased and decreased, respectively. The formation of OPC was because of the spontaneous cyclization of one of the precursor amino acids, α-aminoadipic acid (αAAA), and thus the decreased excretion rate of OPC might be ascribed to the lower precursor demand for penicillin production, since the αAAA was not actually consumed during the PenG production. The five-fold lower q P e n G values in the engineered strains seem to corroborate this (Table 1). It has been reported that PenG can be formed via both isopenicillin acyltransferase (IAT) and acyl-CoA: 6APA acyltransferase (AAT), the two activities of the key enzyme, acyl-CoA: isopenicillin acyltransferase (AT), in the PenG biosynthesis. Besides this, the AT also has the activity of isopenicillin amidohydrolase (IAH), which converts isopenicillin N (IPN) into 6APA [37]. Recently, Deshmukh et al. estimated the enzyme capacity ratio of IAH:IAT:AAT, which was 250:1:6, and the results showed that the IAH-AAT route is a high-capacity but low-affinity route, while the IAT route is a low-capacity but high-affinity route [38]. In the present study, it was observed that the excretion of 6APA was about four-fold higher outside the cells in the engineered strains (Table 1), which makes it reasonable that IPN (not measured) and 6APA were the main end products when the productivity of PenG was reduced by 80%. In addition, this result also indicated that the IAH activity was less affected, while the IAT and the AAT activities become much more sensitive to rapid feast/famine conditions in the engineered strains than in the Wisconsin 54-1255 strain.
The relevant yields, i.e., Y X / S and Y O / S , were also calculated in Table 1. Consistent with previous studies [7], the biomass yields under feast/famine conditions were reduced by over 20% in the engineered strain as compared to the steady state values [24]. However, the biomass yield in the Wisconsin strain was not significantly varied between the conditions, which is consistent with the results of a high-yielding strain derived by de Jonge et al. [16]. This result showed that although trehalose takes up a small amount of the cell composition [24], it may be involved in maintaining the constant biomass yield under industrially relevant conditions. Meanwhile, the Y O / S value indicates the efficiency of glucose combustion by the cells. We have observed that as compared to the Wisconsin strain, the absence of trehalose metabolism in the Penicillium chrysogenum cells slightly increases the energy efficiency under the steady state conditions, which was reflected by the lower Y O / S values [24]. Contrary to the results under the steady state conditions, the Y O / S values for the P. chrysogenum-Δtps1 and P. chrysogenum-Δtps2 strains became 46% and 37% higher under dynamic conditions. However, the energy efficiency of the Wisconsin strain did not significantly change between the conditions. The substrate consumption by the P. chrysogenum strain can be described by the well-known Herbert–Pirt relation, i.e., q s = α µ + β q p + m s , where the parameters α and β are the inverse values of the maximum biomass yield and product yield, respectively [39]. Under rapid feast/famine conditions, the q s values for the P. chrysogenum-Δtps1 and P. chrysogenum-Δtps2 strains became 30% and 25% higher as compared to the Wisconsin strain, while the q p values were much lowered. This result clearly indicated that the maintenance requirements for the engineered strains became 25–30% higher when the substrate distributed towards penicillin production was neglected (less than 0.5%). This increased maintenance for the engineered strain is very likely to be associated with the loss of the physiological role of trehalose. It has well been documented that trehalose is a multifunctional molecule, which can act as a carbon/energy reserve, as a stabilizer and protectant against adverse substances/environments, as a sensing compound and/or growth regulator, and as a structural component of the cell envelope [19]. More importantly, the flux branching off towards trehalose lies at the glucose-6-phosphate node, which is very close to the gate of glucose uptake, and hence the formation/mobilization of this compound can react immediately to the environmental perturbations, e.g., feast/famine conditions. For example, in a high-producing P. chrysogenum strain, de Jonge et al. showed that storage turnover is increased under dynamic cultivation conditions, and upon one cycle of repetitive glucose pulses, about 18% of the carbon entering the cell was recycled in the trehalose node [17]. Although this periodic formation and degradation of trehalose will generate extra ATP costs, the functional role of trehalose cycling can buffer the extracellular nutrient dynamics, and thus contribute to maintaining a balanced cellular state [23]. Based on this, we can hypothesize that the absence of trehalose could expose the cell to more severe intracellular dynamics, which often leads to forming futile cycles at the expense of extra ATP, and also could result in an increased protein turnover rate because the loss-of-function proteins would become higher, which may lead to one of the highest maintenance costs in trehalose-null P. chrysogenum strains [33].

3.4. Intracellular Metabolites

In addition to the above-mentioned comparison of the altered trehalose metabolism upon the physiological response of Penicillium chrysogenum strains from a macroscopic view, we also carried out a quantitative metabolomics study to investigate the change in the intracellular metabolite pools under industrially relevant conditions, i.e., the feast/famine setup. Moreover, the results from dynamic conditions were compared with those obtained under steady state conditions. As shown in Figure 8 and Figure 9, sugar phosphates, organic acids, sugar alcohols as well as amino acids are measured. Obviously, the majority of the metabolites were significantly decreased under feast/famine conditions relative to steady state conditions. This phenomenon has already been observed in the high-yielding P. chrysogenum strain, DS 17690 [8,10], which is derived from the P. chrysogenum Wisconsin 54-1255 strain used in this study. This may be associated with metabolic adaptation, where the shrinkage of the metabolite pools can allow the cells to cope with rapid metabolite, flux and growth rate responses to changes in substrate availability. For instance, in prolonged aerobic, glucose-limited chemostat cultures of Saccharomyces cerevisiae, the reduced metabolite pools and a partial loss of capacity (e.g., ATP regeneration, glycolytic enzymes) have been reported [40,41]. Such a decrease in the overcapacities in cells can be accompanied by the faster turnover of the metabolite pools, which results in the optimized metabolic productivity at the cost of metabolic flexibility.
The above results indicated that under feast/famine conditions there might be a large increase in maintenance requirements in the engineered strains, which suggests the rearrangement of metabolism. Evidence for such a rearrangement can be derived by comparing the mass action ratios (MARs) of near equilibrium reactions in the central metabolism. In this study, the mass action ratios for F6P/G6P and malate/fumarate were calculated for P. chrysogenum Wisconsin 54-1255, P. chrysogenum-Δtps1 and P. chrysogenum-Δtps2 strains (Table 2), which were (0.25, 1.56), (0.25, 3.07) and (0.33,1.51) for steady state conditions, while they were (0.68, 5.18), (1.34, 4.95) and (1.02, 4.93) for feast/famine conditions, respectively.
The significant increase in these MARs indicated that the flux through these key nodes is reduced or even reversed under feast/famine conditions. This has also been reported in our previous work [8], which shows that the intracellular metabolite pool was first increased and then decreased during the feast/famine cycle. The MARs can be increased above their equilibrium values during the famine phase [8]. Nonetheless, under feast/famine conditions, the q s values did not decrease but increased in the engineered strains (Table 1). Combining the above results, this indicated that there might be triggered an increased ATP-consuming futile cycling under feast/famine conditions through forming a cycling flux between the pentose phosphate (PP) pathway and the reversed Embden–Meyerhof–Parnas (EMP) pathway [9]. To corroborate this, the intracellular amounts of 6PG were significantly increased under feast/famine conditions, as compared to the steady state scenario. Furthermore, this futile cycling might become much more enhanced for the engineered P. chrysogenum strains lacking an intact trehalose storage pool and possessing a reduced pool size of other stored carbohydrates (Figure 8), e.g., mannitol, arabitol and erythritol, because upon the repetitive glucose pulses given by block-wise feeding there is no extra stored carbon pool to alleviate the perturbation of the whole metabolic system. As a result, more carbon and thus energy can be wasted in this futile cycling, which would lead to increased maintenance requirements and thus reduced biomass yield and productivity. In the future, this metabolic rearrangement should be confirmed by 13C metabolic flux analysis.

4. Conclusions

In the present study, the physiological role of the trehalose metabolism has been explored by cultivating P. chrysogenum Wisconsin 54-1255 (wild type), P. chrysogenum-Δtps1 and P. chrysogenum-Δtps2 strains in the chemostat cultivation where the glucose feast/famine cycles were imposed. The results clearly showed that the absence of intact trehalose metabolism gave rise to a loss of penicillin production capacity under dynamic conditions, which might be caused by the enhanced maintenance requirement. Additionally, this increased maintenance cost may be caused by triggering a reversed EMP–PPP futile cycle. Meanwhile, the shrinkage of the metabolite pools and the partial loss of enzyme capacity under rapid feast/famine cycles might contribute as a generic mechanism to the metabolic productivity. Furthermore, we could thus conclude that trehalose is indispensable to maintaining the balanced metabolic state and thus high penicillin production capacity under both steady state and feast/famine conditions. However, one should be aware that the detailed physiological role of trehalose in this industrial-relevant P. chrysogenum strain should be further investigated via more cell physiology studies, e.g., in more sophisticated and representative scale-down simulators.

Author Contributions

Conceptualization, G.W.; methodology, G.W., J.X; formal analysis, G.W., and X.W.; investigation, X.W., J.Z., G.W.; writing—original draft preparation, G.W.; writing—review and editing, G.W.; visualization, G.W., X.W; supervision, G.W., J.C., Y.Z.; project administration, G.W., Y.Z., J.X.; funding acquisition, G.W., Y.Z. All authors have read and agreed to the published version of the manuscript.

Funding

This research was funded by the National Natural Science Foundation of China grant number [31900073, 21978085], the Science and Technology Commission of Shanghai Municipality grant number [19ZR1413600] and the 111 Project grant number [B18022].

Institutional Review Board Statement

Not applicable.

Informed Consent Statement

Not applicable.

Data Availability Statement

The data presented in this study are available on request from the corresponding author.

Conflicts of Interest

The authors declare no conflict of interest.

References

  1. Guzman-Chavez, F.; Zwahlen, R.D.; Bovenberg, R.A.L.; Driessen, A.J.M. Engineering of the Filamentous Fungus Penicillium chrysogenum as Cell Factory for Natural Products. Front. Microbiol. 2018, 9, 2768. [Google Scholar] [CrossRef]
  2. Nielsen, J.C.; Grijseels, S.; Prigent, S.; Ji, B.; Dainat, J.; Nielsen, K.F.; Frisvad, J.C.; Workman, M.; Nielsen, J. Global analysis of biosynthetic gene clusters reveals vast potential of secondary metabolite production in Penicillium species. Nat. Microbiol. 2017, 2, 17044. [Google Scholar] [CrossRef] [PubMed]
  3. Wehrs, M.; Tanjore, D.; Eng, T.; Lievense, J.; Pray, T.R.; Mukhopadhyay, A. Engineering Robust Production Microbes for Large-Scale Cultivation. Trends Microbiol. 2019, 27, 524–537. [Google Scholar] [CrossRef] [PubMed] [Green Version]
  4. Wang, G.; Haringa, C.; Tang, W.; Noorman, H.; Chu, J.; Zhuang, Y.; Zhang, S. Coupled metabolic-hydrodynamic modeling enabling rational scale-up of industrial bioprocesses. Biotechnol. Bioeng. 2020, 117, 844–867. [Google Scholar] [CrossRef] [PubMed]
  5. Wang, G.; Haringa, C.; Noorman, H.; Chu, J.; Zhuang, Y. Developing a Computational Framework To Advance Bioprocess Scale-Up. Trends Biotechnol. 2020, 38, 846–856. [Google Scholar] [CrossRef]
  6. Paul, K.; Herwig, C. Scale-down simulators for mammalian cell culture as tools to access the impact of inhomogeneities occurring in large-scale bioreactors. Eng. Life Sci. 2020, 20, 197–204. [Google Scholar] [CrossRef]
  7. Lara, A.R.; Galindo, E.; Ramirez, O.T.; Palomares, L.A. Living with heterogeneities in bioreactors: Understanding the effects of environmental gradients on cells. Mol. Biotechnol. 2006, 34, 355–381. [Google Scholar] [CrossRef]
  8. Wang, G.; Zhao, J.; Haringa, C.; Tang, W.; Xia, J.; Chu, J.; Zhuang, Y.; Zhang, S.; Deshmukh, A.T.; van Gulik, W.; et al. Comparative performance of different scale-down simulators of substrate gradients in Penicillium chrysogenum cultures: The need of a biological systems response analysis. Microb. Biotechnol. 2018, 11, 486–497. [Google Scholar] [CrossRef] [Green Version]
  9. Wang, G.; Wu, B.; Zhao, J.; Haringa, C.; Xia, J.; Chu, J.; Zhuang, Y.; Zhang, S.; Heijnen, J.J.; van Gulik, W.; et al. Power input effects on degeneration in prolonged penicillin chemostat cultures: A systems analysis at flux, residual glucose, metabolite, and transcript levels. Biotechnol. Bioeng. 2018, 115, 114–125. [Google Scholar] [CrossRef]
  10. Wang, G.; Chu, J.; Zhuang, Y.; van Gulik, W.; Noorman, H. A dynamic model-based preparation of uniformly-(13)C-labeled internal standards facilitates quantitative metabolomics analysis of Penicillium chrysogenum. J. Biotechnol. 2019, 299, 21–31. [Google Scholar] [CrossRef]
  11. Vasilakou, E.; van Loosdrecht, M.C.M.; Wahl, S.A. Escherichia coli metabolism under short-term repetitive substrate dynamics: Adaptation and trade-offs. Microb. Cell Fact. 2020, 19, 116. [Google Scholar] [CrossRef] [PubMed]
  12. Hakkaart, X.; Liu, Y.; Hulst, M.; El Masoudi, A.; Peuscher, E.; Pronk, J.; van Gulik, W.; Daran-Lapujade, P. Physiological responses of Saccharomyces cerevisiae to industrially relevant conditions: Slow growth, low pH, and high CO2 levels. Biotechnol. Bioeng. 2020, 117, 721–735. [Google Scholar] [CrossRef] [PubMed] [Green Version]
  13. Wright, N.R.; Wulff, T.; Palmqvist, E.A.; Jorgensen, T.R.; Workman, C.T.; Sonnenschein, N.; Ronnest, N.P.; Herrgard, M.J. Fluctuations in glucose availability prevent global proteome changes and physiological transition during prolonged chemostat cultivations of Saccharomyces cerevisiae. Biotechnol. Bioeng. 2020. [Google Scholar] [CrossRef] [PubMed]
  14. Kuschel, M.; Takors, R. Simulated oxygen and glucose gradients as a prerequisite for predicting industrial scale performance a priori. Biotechnol. Bioeng. 2020, 117, 2074–2088. [Google Scholar] [CrossRef] [PubMed]
  15. Ankenbauer, A.; Schafer, R.A.; Viegas, S.C.; Pobre, V.; Voss, B.; Arraiano, C.M.; Takors, R. Pseudomonas putida KT2440 is naturally endowed to withstand industrial-scale stress conditions. Microb. Biotechnol. 2020, 13, 1145–1161. [Google Scholar] [CrossRef] [PubMed] [Green Version]
  16. de Jonge, L.P.; Buijs, N.A.; ten Pierick, A.; Deshmukh, A.; Zhao, Z.; Kiel, J.A.; Heijnen, J.J.; van Gulik, W.M. Scale-down of penicillin production in Penicillium chrysogenum. Biotechnol. J. 2011, 6, 944–958. [Google Scholar] [CrossRef] [PubMed]
  17. De Jonge, L.P.; Buijs, N.A.; Heijnen, J.J.; van Gulik, W.M.; Abate, A.; Wahl, S.A. Flux response of glycolysis and storage metabolism during rapid feast/famine conditions in Penicillium chrysogenum using dynamic (13) C labeling. Biotechnol. J. 2014, 9, 372–385. [Google Scholar] [CrossRef]
  18. Zhao, Z.; Ten Pierick, A.; de Jonge, L.; Heijnen, J.J.; Wahl, S.A. Substrate cycles in Penicillium chrysogenum quantified by isotopic non-stationary flux analysis. Microb. Cell Fact. 2012, 11, 140. [Google Scholar] [CrossRef] [Green Version]
  19. Elbein, A.D.; Pan, Y.T.; Pastuszak, I.; Carroll, D. New insights on trehalose: A multifunctional molecule. Glycobiology 2003, 13, 17r–27r. [Google Scholar] [CrossRef]
  20. Wiemken, A. Trehalose in yeast, stress protectant rather than reserve carbohydrate. Antonie Leeuwenhoek 1990, 58, 209–217. [Google Scholar] [CrossRef]
  21. Thevelein, J.M.; Hohmann, S. Trehalose synthase: Guard to the gate of glycolysis in yeast? Trends Biochem Sci. 1995, 20, 3–10. [Google Scholar] [CrossRef]
  22. Teusink, B.; Walsh, M.C.; van Dam, K.; Westerhoff, H.V. The danger of metabolic pathways with turbo design. Trends Biochem. Sci. 1998, 23, 162–169. [Google Scholar] [CrossRef]
  23. Van Heerden, J.H.; Wortel, M.T.; Bruggeman, F.J.; Heijnen, J.J.; Bollen, Y.J.; Planque, R.; Hulshof, J.; O’Toole, T.G.; Wahl, S.A.; Teusink, B. Lost in transition: Start-up of glycolysis yields subpopulations of nongrowing cells. Science 2014, 343, 1245114. [Google Scholar] [CrossRef] [PubMed]
  24. Wang, G.; Zhao, J.F.; Wang, X.X.; Wang, T.; Zhuang, Y.P.; Chu, J.; Zhang, S.L.; Noorman, H.J. Quantitative metabolomics and metabolic flux analysis reveal impact of altered trehalose metabolism on metabolic phenotypes of Penicillium chrysogenum in aerobic glucose-limited chemostats. Biochem. Eng. J. 2019, 146, 41–51. [Google Scholar] [CrossRef]
  25. Douma, R.D.; Deshmukh, A.T.; de Jonge, L.P.; de Jong, B.W.; Seifar, R.M.; Heijnen, J.J.; van Gulik, W.M.J.B. Novel insights in transport mechanisms and kinetics of phenylacetic acid and penicillin-G in Penicillium chrysogenum. Biotechnol. Prog. 2012, 28, 337–348. [Google Scholar] [CrossRef] [PubMed]
  26. Douma, R.D.; Verheijen, P.J.; de Laat, W.T.; Heijnen, J.J.; van Gulik, W.M. Dynamic gene expression regulation model for growth and penicillin production in Penicillium chrysogenum. Biotechnol. Bioeng. 2010, 106, 608–618. [Google Scholar] [CrossRef]
  27. Wang, G.; Wang, X.; Wang, T.; van Gulik, W.; Noorman, H.J.; Zhuang, Y.; Chu, J.; Zhang, S. Comparative Fluxome and Metabolome Analysis of Formate as an Auxiliary Substrate for Penicillin Production in Glucose-Limited Cultivation of Penicillium chrysogenum. Biotechnol. J. 2019, 14, e1900009. [Google Scholar] [CrossRef]
  28. Li, C.; Shu, W.; Wang, S.; Liu, P.; Zhuang, Y.; Zhang, S.; Xia, J. Dynamic metabolic response of Aspergillus niger to glucose perturbation: Evidence of regulatory mechanism for reduced glucoamylase production. J. Biotechnol. 2018, 287, 28–40. [Google Scholar] [CrossRef]
  29. Liu, X.; Sun, X.; He, W.; Tian, X.; Zhuang, Y.; Chu, J. Dynamic changes of metabolomics and expression of candicidin biosynthesis gene cluster caused by the presence of a pleiotropic regulator AdpA in Streptomyces ZYJ-6. Bioproc. Biosyst. Eng. 2019, 42, 1353–1365. [Google Scholar] [CrossRef]
  30. Verheijen, P.J. Data reconciliation and error detection. In The Metabolic Pathway Engineering Handbook; CRC Press: Boca Raton, FL, USA, 2010; Volume 8, pp. 1–12. [Google Scholar]
  31. Loffler, M.; Simen, J.D.; Jager, G.; Schaferhoff, K.; Freund, A.; Takors, R. Engineering E. coli for large-scale production—Strategies considering ATP expenses and transcriptional responses. Metab. Eng. 2016, 38, 73–85. [Google Scholar] [CrossRef]
  32. Simen, J.D.; Loffler, M.; Jager, G.; Schaferhoff, K.; Freund, A.; Matthes, J.; Muller, J.; Takors, R.; RecogNice, T. Transcriptional response of Escherichia coli to ammonia and glucose fluctuations. Microb. Biotechnol. 2017, 10, 858–872. [Google Scholar] [CrossRef] [PubMed]
  33. Lahtvee, P.J.; Seiman, A.; Arike, L.; Adamberg, K.; Vilu, R. Protein turnover forms one of the highest maintenance costs in Lactococcus lactis. Microbiology 2014, 160, 1501–1512. [Google Scholar] [CrossRef] [PubMed] [Green Version]
  34. Chatterji, D.; Ojha, A.K. Revisiting the stringent response, ppGpp and starvation signaling. Curr. Opin. Microbiol. 2001, 4, 160–165. [Google Scholar] [CrossRef]
  35. Douma, R.D.; Batista, J.M.; Touw, K.M.; Kiel, J.A.; Krikken, A.M.; Zhao, Z.; Veiga, T.; Klaassen, P.; Bovenberg, R.A.; Daran, J.M.; et al. Degeneration of penicillin production in ethanol-limited chemostat cultivations of Penicillium chrysogenum: A systems biology approach. BMC Syst. Biol. 2011, 5, 132. [Google Scholar] [CrossRef] [PubMed] [Green Version]
  36. Rodriguez-Saiz, M.; Barredo, J.L.; Moreno, M.A.; Fernandez-Canon, J.M.; Penalva, M.A.; Diez, B. Reduced function of a phenylacetate-oxidizing cytochrome p450 caused strong genetic improvement in early phylogeny of penicillin-producing strains. J. Bacteriol. 2001, 183, 5465–5471. [Google Scholar] [CrossRef] [PubMed] [Green Version]
  37. Alvarez, E.; Meesschaert, B.; Montenegro, E.; Gutiérrez, S.; Díez, B.; Barredo, J.L.; Martín, J.F. The isopenicillin-N acyltransferase of Penicillium chrysogenum has isopenicillin-N amidohydrolase, 6-aminopenicillanic acid acyltransferase and penicillin amidase activities, all of which are encoded by the single penDE gene. Eur. J. Biochem. 1993, 215, 323–332. [Google Scholar] [CrossRef]
  38. Deshmukh, A.T.; Verheijen, P.J.; Seifar, R.M.; Heijnen, J.J.; van Gulik, W.M. In vivo kinetic analysis of the penicillin biosynthesis pathway using PAA stimulus response experiments. Metab. Eng. 2015, 32, 155–173. [Google Scholar] [CrossRef]
  39. Van Gulik, W.M.; Antoniewicz, M.R.; deLaat, W.T.A.M.; Vinke, J.L.; Heijnen, J.J. Energetics of growth and penicillin production in a high-producing strain of Penicillium chrysogenum. Biotechnol. Bioeng. 2001, 72, 185–193. [Google Scholar] [CrossRef]
  40. Jansen, M.L.; Diderich, J.A.; Mashego, M.; Hassane, A.; de Winde, J.H.; Daran-Lapujade, P.; Pronk, J.T. Prolonged selection in aerobic, glucose-limited chemostat cultures of Saccharomyces cerevisiae causes a partial loss of glycolytic capacity. Microbiology 2005, 151, 1657–1669. [Google Scholar] [CrossRef] [Green Version]
  41. Wu, L.; Mashego, M.; Proell, A.; Vinke, J.; Ras, C.; Vandam, J.; Vanwinden, W.; Vangulik, W.; Heijnen, J. In vivo kinetics of primary metabolism in Saccharomyces cerevisiae studied through prolonged chemostat cultivation. Metab. Eng. 2006, 8, 160–171. [Google Scholar] [CrossRef]
Figure 1. An overview of trehalose cycling in Penicillium chrysogenum. Tre6P is formed through the transfer of a glucosyl residue from uridine-diphospho-glucose (UDP-glucose) to G6P, which is catalyzed by Tre6P synthase (encoded by tps1). Trehalose is then produced through the dephosphorylation of Tre6P, which is catalyzed by Tre6P phosphatase (encoded by tps2). Trehalose can be exported outside the cell, and it can be degraded into glucose via extracellular trehalase. Tre: trehalose; Glc_ext: extracellular glucose; Tre_ext: extracellular trehalose; G6P: glucose-6-phosphate; Tre6P: trehalose-6-phosphate.
Processes 09 00118 g001
Figure 2. Scheme of the experimental setup. (A) Control chemostat cultures, where the culture is continuously fed and (B) Experimental chemostat culture, where an intermittent feeding regime (36 s feed, 324 s no feed) is applied.
Processes 09 00118 g002
Figure 3. Measured concentrations of (A) biomass, (B) PAA and (C) PenG during rapid feast/famine conditions throughout the chemostat phase. The symbols in black, red and green denote the results obtained from Penicillium chrysogenum Wisconsin 54-1255, Penicillium chrysogenum Δtps1 and Penicillium chrysogenum Δtps2, respectively. Time 0 represents the start-up of chemostat cultivation. Abbreviation: PAA, phenylacetic acid; PenG, penicillin-G.
Processes 09 00118 g003
Figure 4. Measured concentrations of (A) 6-APA, (B) OPC and (C) ο-OH-PAA during rapid feast/famine conditions throughout the chemostat phase. Penicillium chrysogenum Δtps1 and Penicillium chrysogenum Δtps2, respectively. Time 0 represents the start-up of chemostat cultivation. Abbreviation: 6-APA, 6-aminopenicillanic acid; OPC, 6-oxopipeidine-2-carboxylic acid; ο-OH-PAA, ortho-hydroxyphenyl acetic acid.
Processes 09 00118 g004
Figure 5. The biomass specific penicillin production rate during rapid feast/famine conditions throughout the chemostat phase. The symbols in black, red and green denote the results obtained from Penicillium chrysogenum Wisconsin 54-1255, Penicillium chrysogenum Δtps1 and Penicillium chrysogenum Δtps2, respectively. Time 0 represents the start-up of chemostat cultivation.
Processes 09 00118 g005
Figure 6. A schematic view of the penicillin biosynthesis pathway and the derived byproducts mentioned in this study. Precursors are L-α-amino adipic acid (αAAA), L-cysteine (Cys) and L-valine (Val). ACVS: L-α-(δ-aminoadipyl)-L-α-cysteinyl-D-α-valine synthase; IPNS: isopenicillin N synthase; AT: acyl-CoA:isopenicillin acyltransferase.
Processes 09 00118 g006
Figure 7. Measured concentrations of PAA, ο-OH-PAA and glucose during the batch process. The dash line represents the initial PAA concentration in the bioreactor. The symbols in black, red and green denote the results obtained from Penicillium chrysogenum Wisconsin 54-1255, Penicillium chrysogenum Δtps1 and Penicillium chrysogenum Δtps2, respectively. Time 0 represents the start-up of chemostat cultivation.
Processes 09 00118 g007
Figure 8. Intracellular amount of sugar phosphates, organic acids and sugar alcohols in Penicillium chrysogenum Wisconsin 54-1255, Penicillium chrysogenum Δtps1 and Penicillium chrysogenum Δtps2 strains under both steady state conditions and feast/famine conditions. Under steady state conditions, samples were taken at each residence time and datasets were collected from triplicate experiments, while under rapid feast/famine conditions, samples were rapidly taken within a feeding cycle time of 6 min twice for each experiment. The datasets are shown as average value ± standard deviation. The numbers of data points for the steady state conditions and feast/famine conditions are 30 and 32, respectively. A two-tail Student’s t-test was conducted * p < 0.05 (significant) and **** p < 0.01 (extremely significant) versus WT using GraphPad Prism 8. N.A., not available. WT steady state conditions; █ WT feast/famine conditions; Δtps1 steady state conditions; Δtps1 feast/famine conditions Δtps2 steady state conditions; Δtps2 feast/famine conditions. The results from steady state conditions were obtained from Wang et al. (2019) [24]. Abbreviations: G6P, glucose-6-phosphate; F6P, fructose-6-phosphate; 6PG, 6-phosphogluconate; S7P, sedoheptulose-7-phosphate; EMP, Embden–Meyerhof–Parnas; PPP, Pentose phosphate; TCA, tricarboxylic acid.
Processes 09 00118 g008
Figure 9. Intracellular amounts of amino acids in Penicillium chrysogenum Wisconsin 54-1255, Penicillium chrysogenum Δtps1 and Penicillium chrysogenum Δtps2 strains under both steady state conditions and feast/famine conditions. Amino acids were classified into six families, which are derived from the same precursors in the central carbon metabolism. Under steady state conditions, samples were taken at each residence time and datasets were collected from triplicate experiments, while under rapid feast/famine conditions, samples were rapidly taken within a feeding cycle time of 6 min twice for each experiment. The datasets are shown as average value ± standard deviation. The numbers of data points for steady state conditions and feast/famine conditions are 30 and 36, respectively. A two-tailed Student’s t-test was conducted * p < 0.05 (significant) and **** p < 0.01 (extremely significant) vs. WT using GraphPad Prism 8. N.S., not significant; N.A., not available. WT steady state conditions; █ WT feast/famine conditions; Δtps1 steady state conditions; Δtps1 feast/famine conditions Δtps2 steady state conditions; Δtps2 feast/famine conditions. The results from steady state conditions were obtained from Wang et al. (2019) [24].
Processes 09 00118 g009
Table 1. Comparison of the reconciled biomass-specific rates and relevant yields of different Penicillium chrysogenum strains on glucose obtained from feast/famine cultures at the average dilution rate of 0.05 h−1 in the time range of 100–200 h of cultivation. Measurements are given as average ± standard deviation of at least two individual experiments. Significant test was conducted * p < 0.05 vs. WT, by Student’s t-test. Numbers marked with superscript a and b means significantly increased and decreased, respectively.
Wisconsin 54-1255P. chrysogenum-Δtps1P. chrysogenum-Δtps2
µmCmolX/CmolX/h50.03 ± 1.6049.72 ± 1.6049.50 ± 1.60
- q s mmol/CmolX/h19.43 ± 0.4625.19 ± 1.20 a24.33 ± 1.20 a
- q O 2 mmol/CmolX/h67.42 ± 1.70105.40 ± 6.90 a100.86 ± 6.90 a
q C O 2 mmol/CmolX/h68.63 ± 1.70106.21 ± 6.90 a101.66 ± 6.90 a
- q P A A mmol/CmolX/h0.63 ± 0.120.90 ± 0.23 a0.91 ± 0.15 a
q P e n G mmol/CmolX/h0.063 ± 0.0040.013 ± 0.002 b0.011 ± 0.001 b
q O P C mmol/CmolX/h0.66 ± 0.020.27 ± 0.06 b0.055 ± 0.03 b
q 6 A P A mmol/CmolX/h0.136 ± 0.0050.484 ± 0.09 a0.562 ± 0.107 a
q ο O H P A A mmol/CmolX/h0.208 ± 0.010.121 ± 0.02 b0.153 ± 0.01 b
Y X / S CmolX/molS2.57 ± 0.061.97 ± 0.07 b2.03 ± 0.08 b
Y O / S molO2/molS3.47 ± 0.034.18 ± 0.19 a4.15 ± 0.20 a
C balance-98.4 ± 1.8898.61 ± 4.3998.74 ± 4.56
γ balance-96.11 ± 1.0395.56 ± 2.2996.02 ± 2.22
Table 2. Comparison of mass action ratios for phosphoglucose isomerase (PGI) and fumarase of different Penicillium chrysogenum strains obtained from both steady state conditions and feast/famine cultures at the average dilution rate of 0.05 h−1 in the time range of 100–200 h of cultivation. Measurements are given as average ± standard deviation of at least two individual experiments.
Wisconsin 54-1255P. chrysogenum-Δtps1P. chrysogenum-Δtps2
Steady state conditionsF6P/G6P0.25 ± 0.020.25 ± 0.020.33 ± 0.03
malate/fumarate1.56 ± 0.143.07 ± 0.551.51 ± 0.06
Feast/famine conditionsF6P/G6P0.68 ± 0.051.34 ± 0.161.02 ± 0.22
malate/fumarate5.18 ± 0.214.95 ± 0.334.93 ± 0.78
Publisher’s Note: MDPI stays neutral with regard to jurisdictional claims in published maps and institutional affiliations.

