Article

The Effect of Slurry Wet Mixing Time, Thermal Treatment, and Method of Electrode Preparation on Membrane Capacitive Deionisation Performance

by
Ebrahiem Botha
,
Nafeesah Smith
,
Bongibethu Hlabano-Moyo
and
Bernard Bladergroen
*
South African Institute for Advanced Materials Chemistry (SAIAMC), University of the Western Cape, Cape Town 7535, South Africa
*
Author to whom correspondence should be addressed.
Processes 2021, 9(1), 1; https://doi.org/10.3390/pr9010001
Submission received: 10 November 2020 / Revised: 1 December 2020 / Accepted: 6 December 2020 / Published: 22 December 2020

Abstract

:
Capacitive deionisation (CDI) electrodes with identical composition were prepared using three deposition methods: (1) slurry infiltration by calendering (SIC), (2) ink infiltration dropwise (IID), and (3) ink deposition by spray coating (IDSC). The SIC method clearly showed favourable establishment of an electrode with superior desalination capacity. Desalination results showed that electrodes produced from slurries mixed longer than 30 min displayed a significant reduction in the maximum salt adsorption capacity, due to the agglomeration of carbon black. The electrodes were then thermally treated at 130, 250, and 350 °C. Polyvinylidene difluoride (PVDF) decomposition was observed when the electrodes were treated at temperatures higher than 180 °C. The electrodes treated at 350 °C showed contact angles of θ = 0°. The optimised electrodes showed a salt adsorption capacity value of 24.8 mg/g (130 °C). All CDI electrodes were analysed using specific surface area by N2 adsorption, contact angle measurements, conductivity by the four-point probe method and salt adsorption/desorption experiments. Selected reagents and CDI electrodes were characterised using thermogravimetric analysis coupled with mass spectrometry (TGA-MS) and differential scanning calorimetry (DSC), as well as scanning electron microscopy energy dispersive X-ray spectroscopy (SEM-EDS). Electrode structure and the development of the critical balance between ion- and electron- conductive pathways were found to be a function of the electrode slurry mixing procedure, slurry deposition technique and thermal treatment of the electrodes.

1. Introduction

The scarcity of fresh drinking water is a growing concern. Desalination and wastewater recycling are becoming increasingly more important as the shortage of drinking water will continue to increase. Currently, electro-dialysis (ED), multi-stage flash (MSF) desalination, reverse osmosis (RO) membrane desalination, and multi-effect distillation (MED) desalination are thus far the dominating technologies that deliver drinkable water to millions of people around the globe. Alternative, less energy intensive technologies exist but have not progressed to industrial applications due to perceived high upfront capital installation cost. Capacitive deionisation (CDI), including membrane CDI (MCDI), is one of these technologies.
The term capacitive deionisation is derived from the words capacitive and deionisation. Deionisation refers to the removal of charged molecules or atoms in the form of ions (cations and anions) and capacitive refers to the capacitor used to facilitate the removal of ions. A capacitor is a device constructed of one or multiple pairs of electrodes that are oppositely charged. An electric potential is applied over the electrodes, resulting in positively and negatively charged poles. Salts dissolved in water exist as positively and negatively charged ions. Cations are attracted by electrostatic force to the negatively charged electrode while the anions are attracted to the positively charged electrode. Hence, the ions are separated from the water solution. Cycles of regeneration and purification are alternated to produce two streams of brine and desalinated water. Limitations of capacitive deionisation (CDI) manifest during polarity reversal/electrode regeneration. When the adsorbed ions are desorbed, the cations and anions are attracted to the opposite electrode. Therefore, the regeneration of the electrodes are compromised, limiting the electrode sorption capacity for the subsequent desalination run [1,2]. This limitation is resolved by a modified technique known as membrane capacitive deionisation (MCDI). An MCDI cell is created by placing ion exchange membranes between the cathode and anode. Regeneration/charge efficiency is improved by the selective transport of cations and anions by the ion-exchange membrane when the polarity is reversed [3]. Packing activated carbon or ion exchange resin in the flow channel increases bulk conductivity [4,5]. CDI has been coupled to other water treatment processes to enhance pollutant removal, such as reverse osmosis and reverse electrodialysis [6,7].
Reverse osmosis is utilised in more than 70% of the world desalination market, with energy consumption as low as 2 kW/m3, a salt rejection of >99%, and lastly an approximate feed recovery of 90% when desalinating water with a concentration of 30 g/L [8,9]. Despite the recent advances in CDI research, some authors do not recognise the potential and dismiss CDI as a competitor to reverse osmosis [10]. Capacitive deionisation seems less effective with limited feed salinity <1 g/L and salt rejection <95%, while challenges such as electrode decay and scaling/fouling have been mentioned [11]. However, since the technology is still in its infancy, there is plenty of room for improvements and cost reductions, allowing MCDI to compete specifically in areas where high energy efficiency is essential. This research highlights one area of these much-needed improvements: the electrode producing procedures. An effective CDI electrode possesses the following important characteristics associated with its performance:
  • A large total surface area with appropriate pore size distribution and porosity. Such large surface areas are created using materials with large specific surface area. Several commercially available activated carbons meet the requirements and are currently used as a cost-effective substance in commercial CDI systems [12,13].
  • Appropriately developed multi-dimensional electron conductive links between this large specific surface area material and an external power source. Carbon black is typically mixed with the active material and the mixture is deposited onto a current collector. These current collectors are eventually connected to an external power source [14,15].
  • Electrode stability. As long as CDI electrode structure provide continuous, low resistive pathways for both ions (from the entire surface area of the activated carbon to the feed water source) and electrons (from the entire surface area of the activated carbon to the external power source), the electrode is of value. The quantity and type of binders play an important role in maintaining the structural integrity of the electrode [16,17].
Several researchers over the years have prepared electrodes for CDI research and tested these electrodes for their salt adsorption performance [18,19]. Generally, the electrodes are prepared by mixing the active materials (activated carbon), electrically conductive material (carbon black), and binder, polytetrafluoroethylene (PTFE), in optimised ratios, typically 80, 10, and 10%, respectively. Subsequently, such a mixture is deposited onto a current collector using a variety of tools and techniques. The “doctors’ blade” technique seems most common.
Lu et al. described three methods for CDI electrode preparation, namely, evaporation casting, roller coating, and spray coating [20]. For all methods, a carbon mixture consisting of activated carbon, carbon black, ethanol, and PTFE solutions was prepared. During the evaporating casting method, the carbon mixture was added drop-wise onto carbon fiber paper placed on a heated plate to facilitate solvent evaporation. During the roller coating method, the carbon mixture was pressed into the carbon fiber paper with a spoon. For the spray coating method, a spray gun was filled with carbon mixture and sprayed onto the carbon fiber paper.
The available literature addresses neither mixing procedures of the activated carbon, carbon black, solvent, and binder for CDI electrodes, nor thermal studies of these electrodes. In Li-ion battery research, electrode slurry mixing procedures appear to be important and have been studied in detail [21,22,23]. The Li-ion positive electrode may have a different active material than CDI electrodes but they share the same binder, polyvinylidene difluoride (PVDF), to enhance the mechanical integrity and the same carbon black to enhance the electron conductivity. Both CDI and Li-ion electrodes consist of porous structures to be filled with electrolyte/feed solution to facilitate conduction of ions/electrons. The authors used the slurry mixing procedures developed for the Li-ion electrode process and studied its impact on the performance of CDI electrodes. The authors of this paper believe that the electrode structure and the development of the critical balance between ion and electron conductive pathways are both a function of the mixing procedure and the deposition technique. In addition, the optimal treatment process was established. A series of CDI electrodes were prepared with an identical composition of 80% activated carbon, 10% carbon black, and 10% PVDF on a common carbon fiber current collector (JNT45). Three different techniques were used in the production process to transfer the active material onto or into the current collector: (1) slurry infiltration by calendering (SIC); (2) ink infiltration dropwise (IID); (3) ink deposition by spray coating (IDSC). All CDI electrodes were analysed using specific surface area by N2 adsorption, conductivity by the four-point probe method, wettability by determination of the contact angle and, lastly, the maximum salt adsorption capacity (mSAC). Selected reagents and CDI electrodes were additionally characterised using thermal analysis TGA-MS and DSC, as well as SEM EDS. After the most effective electrode production technique was identified, the effect of the slurry mixing time on electrode performance was investigated too.

2. Materials and Methods

2.1. Chemicals

Activated carbon, YP80F, 2000–2500 m2/g, was purchased from Kuraray, Osaka, Japan. Polyvinylidene difluoride (PVDF) and N,N-dimethylacetamide (99.9%), was bought from Sigma Aldrich, Modderfontein, South Africa. Sodium chloride was obtained from KIMIX, Cape Town, South Africa. Carbon substrate (JNT45) was purchased from JNTG Co. LTD, Hwaseong, Korea. Nitrogen (99.999%) was bought from Afrox, Cape Town, South Africa. Carbon black (Super-p CB) was purchased from Alfa Aesar, Kandel, Germany. Ultra-pure water was used to prepare the feed solution for all desalination experiments and was supplied in-house by Milli-Q Integral water, resistivity (18.2 MΩ·cm) and TOC (≤5 ppb).

2.2. Electrode Preparation

The electrode preparation process starts by preparing a mixture of all the necessary ingredients, which is called a slurry or an ink, before it is deposited onto the substrate. In this paper, slurry refers to the composition prepared for the infiltration by calendering methods, while the word “ink” refers to the composition used for the infiltration drop-wise and spray coating method. The slurry preparation procedure is discussed below, followed by a description of the three different slurry/ink deposition techniques. All electrodes were prepared in pairs with JNT45 (JNTG Co. LTD, Hwaseong, Korea) as the current collector.

2.3. Slurry Preparation

Slurries were prepared by adding the dry ingredients, activated carbon (YP80F, 0.72 g) and carbon black (Super-p CB, 0.091 g), into a syringe (20 mL)). To this mixture, a zirconia ball (10 mm) was added and placed into an in-house prepared holder. The zirconia ball aids the thorough dry mixing of the activated carbon (YP80F) and carbon black (Super-p CB). The holder with the syringe was placed inside a devil shaker (Red Devil Equipment Co, Plymouth, MN, USA) and was mixed for 60 min to complete the dry mixing process. After dry mixing, a previously prepared binder solution was added (3 mL). This binder solution was prepared by adding PVDF (1.81 g) to N,N-dimethylacetamide (DMAC) (Sigma Aldrich, Modderfontein, South Africa, 23.50 g) heated to and kept at 110 °C while vigorously stirring until all the PVDF powder was dissolved. After addition of the binder solution, the syringe was placed back in the devil shaker and mixed for 30, 60, or 120 min to complete the wet mixing step.

2.4. Slurry/”Ink” Deposition

The following three modified methods were utilised to produce the electrodes in this study. All electrodes were prepared at 25 °C, unless otherwise stated.

2.4.1. Slurry Infiltration by Calendering

A slurry was squirted onto the substrate from the syringe. Using a metal blade, the slurry was spread to cover the entire surface of the substrate. Subsequently, the substrate with the slurry was passed through a rolling press (MSK-HRP-MR100A, MTI Corporation, Richmond, CA, USA) six times to ensure appropriate distribution of the slurry throughout the electrode. Three electrode pairs were produced applying this method but using a slurry, wet mixed for 30, 60, and 120 min, respectively.

2.4.2. Ink Infiltration Dropwise (Wet Mixing Time 60 min)

For this method, the ink was added drop-wise to the substrate placed in a glass petri dish. Two electrode pairs were produced applying this method, keeping the surface of the petri dish at 25 and 130 °C, respectively.

2.4.3. Ink Deposition by Spray Coating (Wet Mixing Time 60 min)

For the spray coating experiments, a SONO-TEK ExactaCoat Benchtop Coating System (Sono-Tek, Milton, NY, USA) was used. Additional solvent (15 mL) was mixed with the slurry to reach the desired flow properties associated with this method and will be called “ink”. The ink was sprayed onto the substrate using the following parameters: 0.86 psi, path speed 50 mm/s, area spectrum of 4 mm, and a spray head height of 48 mm. The temperature was at 150 °C to evaporate the solvent (DMAC). The ink was magnetically stirred for 60 min. Before spray-coating commenced, the ink was sonicated for 60 min. All the electrodes were dried at 130 °C overnight and cut to size (79 × 39 mm).

2.5. Electrode Characterisation

2.5.1. Scanning Electron Microscopy Energy Dispersive X-ray Spectroscopy (SEM EDS)

All samples were sputter coated with a carbon layer, using an EMITECH K950X Turbo Evaporator (Kent, United Kingdom), to enhance the conductivity of the electrodes and thus augment ultimate image visibility. Electrode characterisation was performed using a Zeiss Auriga field emission gun scanning electron microscope (FEG-SEM, Carl Zeiss Microscopy GmbH, Oberkochen, Germany) operated at an accelerating voltage of 5 kV using an in-lens high resolution detector.

2.5.2. Thermogravimetric Analysis Coupled with Mass Spectrometry (TGA-MS)

TGA experiments, were performed on a TGA/SDTA851e (Mettler Toledo, Zürich, Switzerland) coupled to a ThermoStarTM (Pfeifer, Hessen, Germany) vacuum mass spectrometer to identify m/z values of the liberated gasses. Instruments were initialised and purged with nitrogen gas 24 hours in advance of experimentation. Successive blank curves (no sample) were run on empty 60 µL aluminium oxide crucible until reproducible curves were obtained. Samples sizes for all tested compounds were 2–8 mg and were weighed on a five decimal Mettler XS205 dual range electrobalance (Mettler Toledo, Zürich, Switzerland). Samples were heated at a rate of 10 °C per minute in the temperature range 30 °C < T < 700 °C. A constant flow of nitrogen was maintained over all experiments, unless stated otherwise.

2.5.3. Differential Scanning Calorimetry (DSC)

DSC measurements, were performed on a METTLER DSC822e (Mettler Toledo, Zürich, Switzerland) differential scanning calorimeter with FRS5 detector and robotic auto-sampler. The maximum temperature range for the instrument is −50 °C < T < 500 °C. Samples sizes for all tested compounds were 2–8 mg and were weighed on a five decimal Mettler XS205 dual range elecrobalance (Mettler Toledo, Zürich, Switzerland), then sealed in standard 40 µL aluminium crucibles. The aluminium cap was perforated with a needle creating a hole of ~1 mm in diameter to allow any gasses liberated during potential decomposition to escape without deformation of the crucible. All experiments were performed under nitrogen. The scan rate in all cases was 10 °C per minute for both heating and cooling (unless specifically stated otherwise). Isothermal segments of one minute prior to and at the final temperature between dynamic heating and cooling segments were included to allow for instrumental overshot and setting. Curve analyses were performed using STARe SW 9.0® software (9.0, Mettler Toledo, Zürich, Switzerland, 2019).

2.5.4. Specific Surface Area Nitrogen Adsorption

The surface area of the electrodes was determined using a Micromeritics 3 Flex Surface Characterization Version 5.00 (Micromeritics, Norcross, GA, USA). All specific surface area (SSA) of the prepared electrodes were calculated from nitrogen adsorption isotherms at 77 K. All samples were weighed (0.05 g) and placed in separate Brunauer, Emmett and Teller (BET, Micromeritics, Norcross, GA, U.S.A) test tubes for analysis. These samples were degassed overnight at 130 °C using nitrogen gas and weighed again after degassing. See Table S1 for BET data.

2.5.5. Electrode Conductivity

An in-house-produced four-point probe setup was used to determine the electrical conductivity of the electrode samples, presented in Figure S1. A power supply (EA-PSI 8032-10T, RS components SA, Midrand, South Africa) was used to provide a current through the most outer electrode pair while a digital multimeter DT9205A was used to measure the electric potential between the inner electrode pair. The applied current was increased in set intervals from 0.1 to 0.3 A with increments of 0.05A to yield 5 measurements per sample. The distance between the inner electrodes was 25 mm. The electrode thickness was measured using a micrometre screw gauge (electronic digital caliper, RS components SA, Midrand, South Africa). The current, the potential, the distance between the inner electrodes and the sample thickness were used to calculate the electrode conductivity.

2.5.6. Contact Angle Measurements

All contact angle measurements were obtained with instruments designed and built in-house, as presented in Figure S2. For the contact angle testing, an electrode sample was placed on the base of the contact angle setup. A micropipette with a tip positioned at 10 mm above the electrode was used to dispense 50 µL of 1 g/L NaCl solution (KIMIX, Cape Town, South Africa) onto the electrode. A HUAWEI P20 cellular phone was attached to the setup, assuring the correct position of the camera. Lighting conditions were optimized to ensure a clear contrast between the droplet outline and the background. Using the “lite camera function”, an image was captured within 5 s after the droplet contacted the surface of the electrode. This process was repeated five times using the same electrode but different positions to obtain a more representative measurement. The same procedure was repeated for the back side of the electrode. ImageJ software was utilised to analyse the images and to measure the contact angle.

2.6. Salt Adsorption Capacity

A description of the setup and procedures used to establish the specific salt adsorption capacity of the electrodes follows.

2.6.1. Cell Assembly Procedure

Assembly of the in-house-designed MCDI cell, Figure 1, entailed placement of a gold-plated electrical contact disk (ECD) (Goldfinger Electroplating, Cape Town, South Africa) inside the high-density polyethylene (HDPE, Maizey plastics, South Africa, machined in-house) bottom and top plate. A graphite current collector (Mersen South Africa, machined in-house) was placed on the gold-plated ECD, followed by fixing of the silicone gasket (Cape Town Rubber, South Africa, machined in-house) on the HDPE bottom plate of the cell. Subsequently, the electrode was placed on top of the graphite with its active side facing upwards. Next, a cation exchange membrane (Fumasep E-620-PE, Fumatech, Bietigheim-Bissingen, Germany) was fixed onto the cell. The PVC/PET spacer (Fumatech, Bietigheim-Bissingen, Germany) was placed on the cation exchange membrane ensuring that the influent and effluent holes were not blocked. The anion exchange membrane (Fumasep FAA-3-PE-30 Fumatech, Bietigheim-Bissingen, Germany) was positioned next, followed by the electrode with the active side facing down towards the spacer. The graphite current collector was then placed on the electrode and the silicone gasket was positioned cautiously, without blocking the influent and effluent holes. The HDPE top plate was positioned onto the stack of components, ensuring that the flow paths are not obstructed. The top and bottom plates were then fastened using stainless steel bolts, washers, and nuts. A torque wrench (Wiha Werkzeuge GmbH, Schonach im Schwarzwald, Germany) was used to apply 0.2 Nm of torque to the gold coated ECD. The influent and effluent feed tubes were connected and the conductivity meter (Portavo 904 X Knick SE 204 4-electrode sensor measuring range: 0.05–500 mS/cm, Mecosa Pty Ltd., Randburg, South Africa) was inserted into the conductivity and temperature port of the cell. Lastly, the terminals of the power source were connected through the ECDs using Hirschmann crocodile clips (RS Components SA, Midrand, South Africa).

2.6.2. Experimental Desalination Setup

All desalination experiments conducted were done in single-pass mode using a flow-by cell configuration. Refer to Table S2 for experiments performed and standard deviation. To transfer the feed saline water with a concentration of 1000 ppm NaCl from the 3-litre feed reservoir to the MCDI cell, a Watson-Marlow Sci-Q 300 Series peristaltic pump was used. The feed water was introduced into the cell through a silicone tube (4.8 mm). Utilising the Nova 1.9 software package, the Autolab PGSTAT320N was programmed to supply a constant voltage with alternating polarity (1.2 and −1.2 V) to the MCDI cell for 90 minutes, while the resulting current was recorded. Simultaneously, the conductivity and temperature of the discharged water were measured utilising a Knick SE 204 4-electrode sensor and utilising Paraly SW112 software to collect the data. The water exiting the cell during desalination and regeneration mode was collected in a separate reservoir.

2.6.3. Determination of mSAC

The maximum salt adsorption capacity (mSAC) is a measure of the maximum amount of salt adsorbed on an electrode in mg per gram (mg/g) of electrode used in the cell. The mSAC was calculated by integrating the reduction of salt concentration, multiplied by the flow rate as a function of time, multiplied by the molecular weight of NaCl and divided by the mass of both electrodes (See Equation (1)).
m S A C   m g g =   M w × C i C o φ d t m e
where:
  • Mw is the molecular weight of NaCl (58.443 g/mol)
  • Ci and Co are the influent and effluent concentrations (mM), respectively
  • φ is the flowrate (mL/min)
  • t is the time during which charging occurred (min)
  • me is the mass of the active material in the electrode pair (g)

2.6.4. Pre-Conditioning and Test Procedure

Prepared electrodes were pre-treated by wetting (overnight in saline solution) before any adsorption-desorption measurements were executed. A feed solution of NaCl (1 g /L) was prepared at the start of each desalination test. Nitrogen gas was used to flush the feed solution for 15 min. The MCDI cell was assembled utilising the cell assembly procedure, as described in 2.6.1. A constant voltage of 1.2 V was utilised for the adsorption–desorption measurements using the Metrohm Autolab BV, the Netherlands. The flow rate was set to 13 mL/min, which corresponds to 9 rpm on the Watson–Marlow Sci-Q 300 peristaltic pump. All tests conducted were done in a single-pass method. To accurately evaluate each electrode pair, seven adsorption–desorption cycles were conducted to pre-condition the MCDI electrodes. Each pre-conditioning cycle ran for 360 s, with 180 s adsorption (1.2 V between anode and cathode) and 180 s desorption (−1.2 V between anode and cathode). The test to determine maximum salt adsorption capacity consisted of a 900 s desorption and a 900 s adsorption period to permit the electrodes to be fully regenerated at the start of the salt adsorption cycle, as illustrated in Figure S3. The conductivity and current data for the substrate JNT45, electrodes E4, E6 and E7 can be found in Tables S3–S6.

3. Results and Discussion

3.1. Scanning Electron Microscopy Energy Dispersive X-ray Spectroscopy (SEM EDS)

SEM coupled with EDS was used to probe the surface morphology of the reagents and prepared electrodes. Figure 2 shows the SEM images of the reagents: (A) activated carbon (AC), consists of irregular shaped microscale structures; (B) carbonblack (CB) will provide an electric pathway between particles; (C) PVDF, the binder, has a spherical microstructure; lastly, (D) JNT45, the carbon fiber substrate, consists of intertwined carbon microfibers. These carbon microfibers form a porous electrically conductive network that will host the active materials to form an effective CDI electrode.
The activated carbon and carbon black were dry mixed for 60 min. Figure 3A depicts a SEM image where the carbon black is spread evenly on the activated carbon. This dry mixing process has an impact on the micro-structure of the electrode and in particular the distribution of carbon black on the activated carbon [24]. It is important to note that the carbon black appears to be completely de-agglomerated into its primary spherical particles of roughly 100 nm and dispersed and attached to the surface of the active material. This dispersion of CB on the active material will provide a sufficient electric pathway between the AC particles. After dry mixing, a solution of PVDF and DMAC was added, and this suspension was wet mixed for 30 min. This wet mix was dried at 130 °C for 12 h and SEM images, presented in Figure 3B, were obtained of the dried powder. Notable differences are observed between the dry and wet mix SEM images. It appears that the dispersion of carbon black achieved during dry mixing is to a great extend undone during wet mixing. Figure 3B reveals that the primary particles regrouped into larger CB aggregates. This re-agglomeration of the carbon black resulted in undesirable large lumps of activated carbon, rendering the electrode inefficient for CDI application, due to lack of a conducting and binding network.
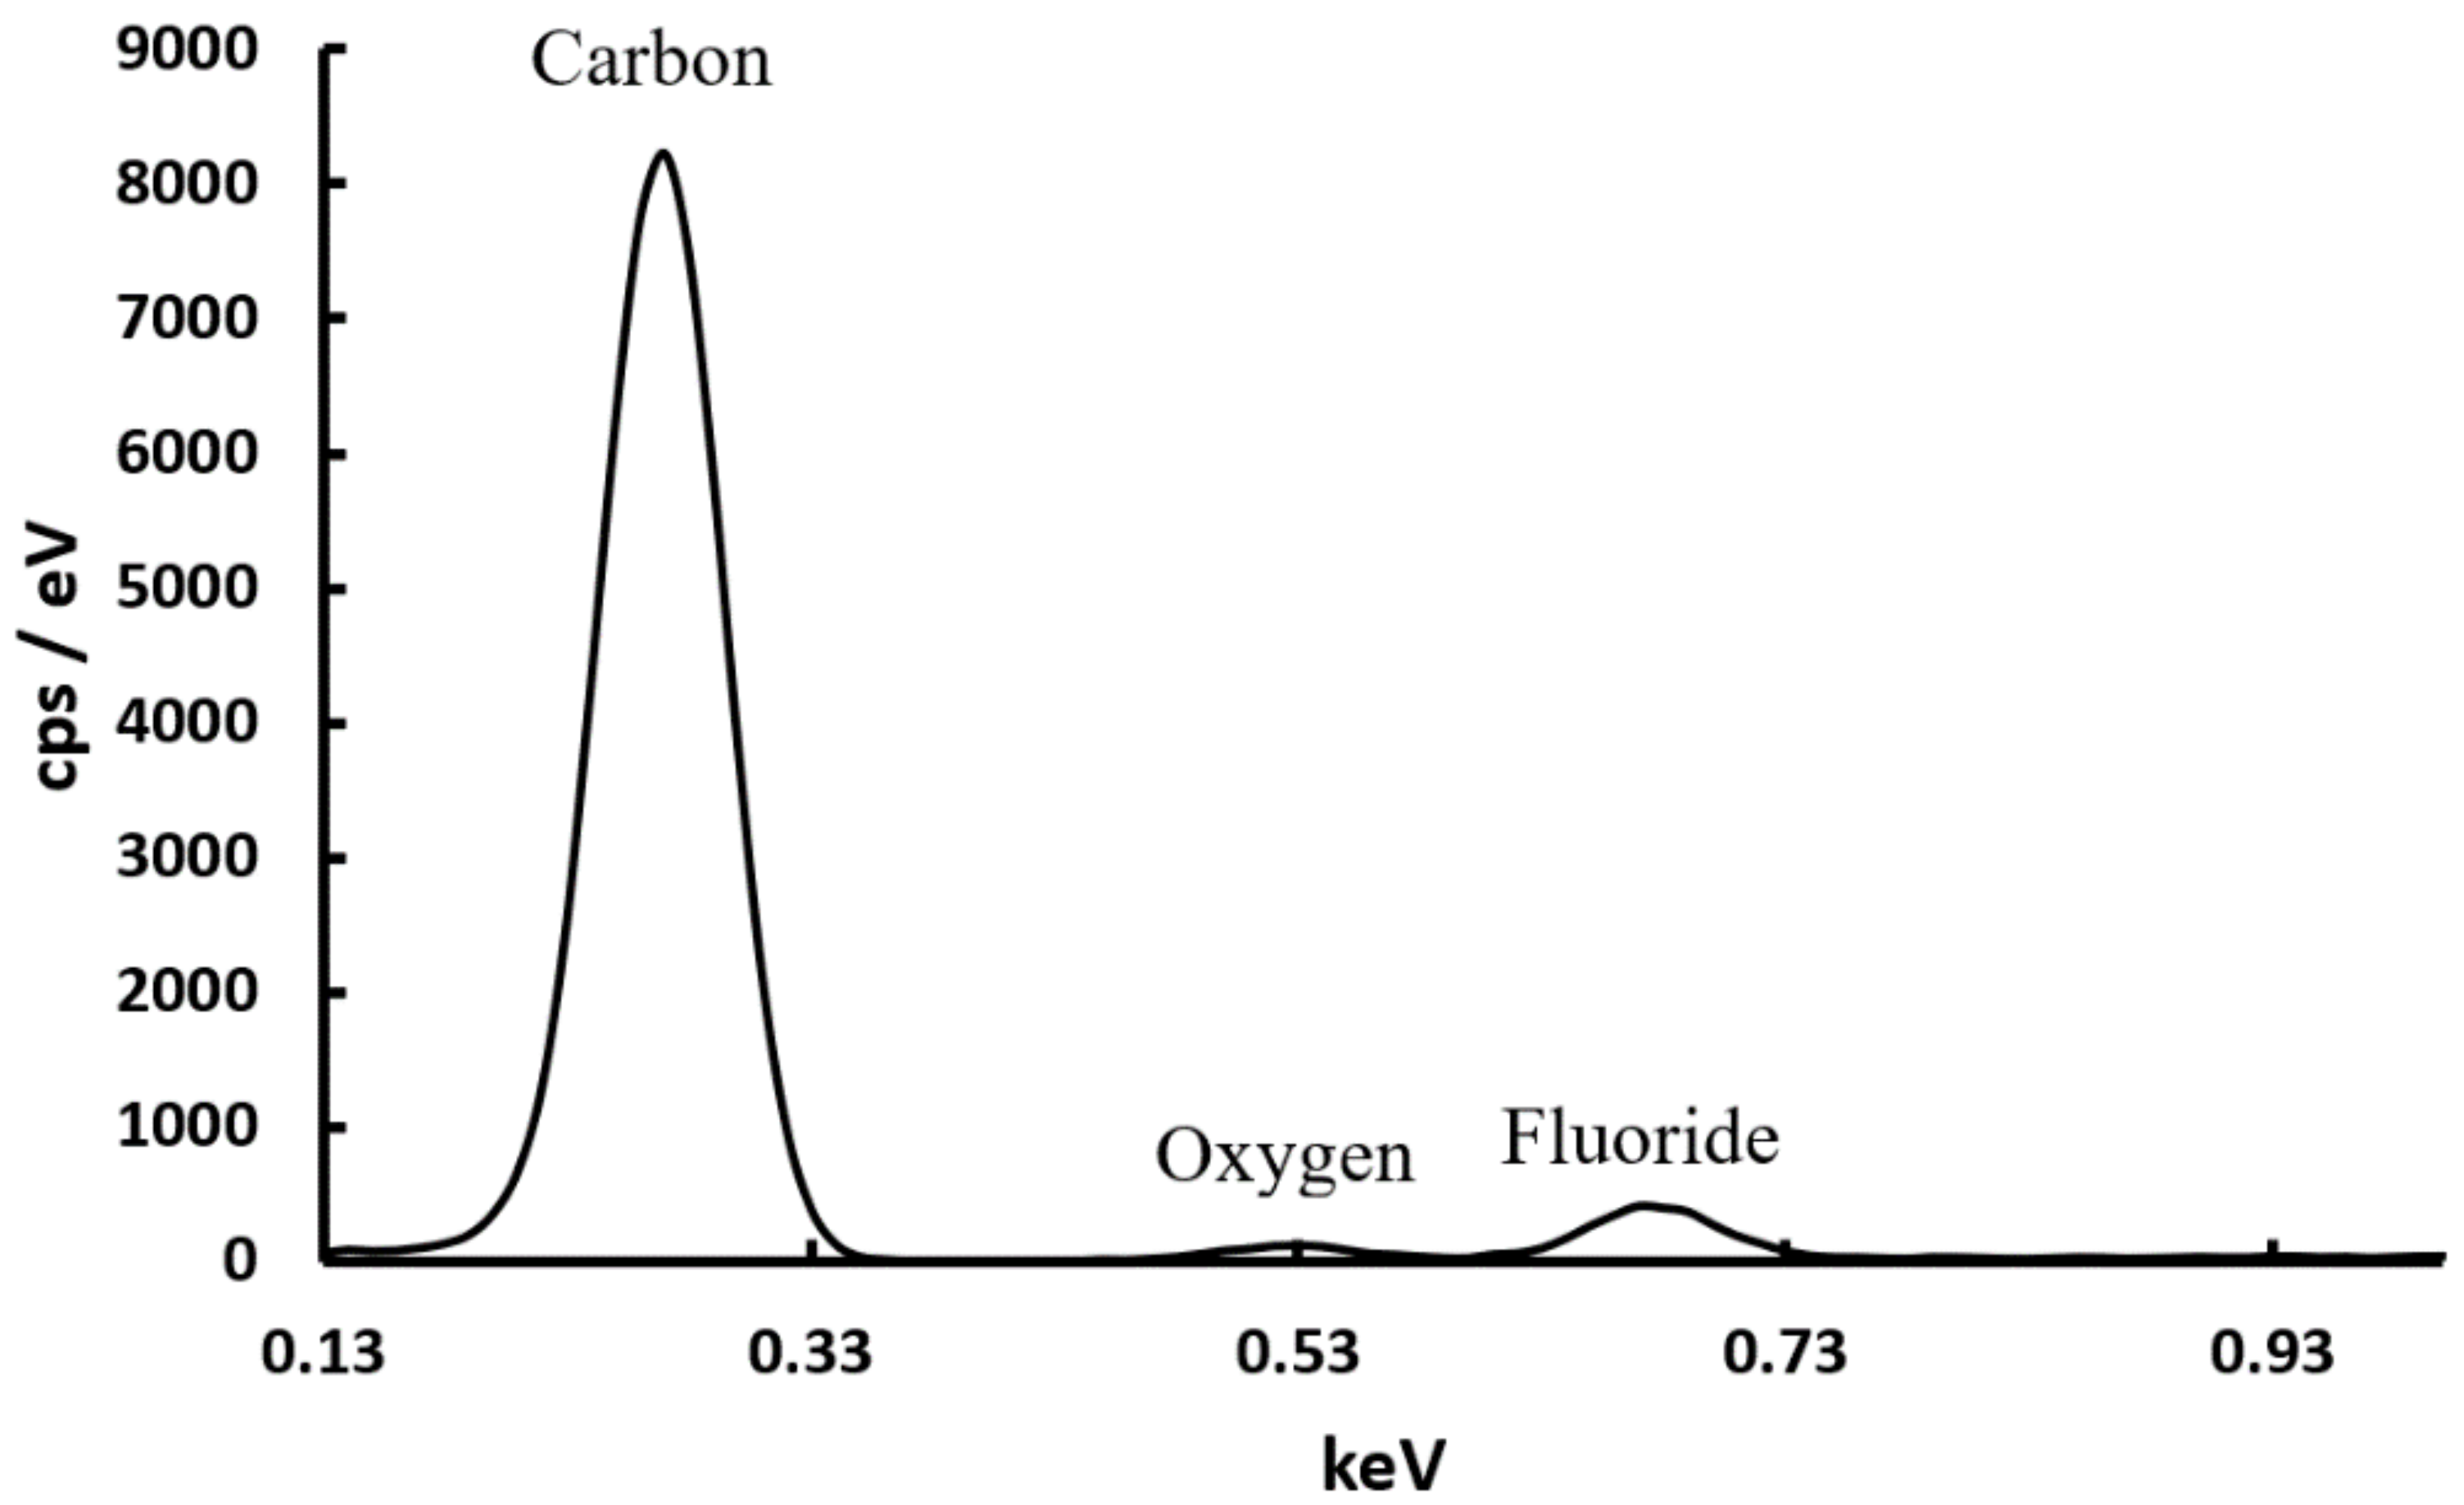
The activated carbon, depicted in Figure 3B, is covered with spherical and non-spherical structures. Differentiation between PVDF and carbon black with the aid of SEM images is impossible. For this reason, EDS analysis was performed on this sample, as presented in Figure 4. Carbon, oxygen, and fluoride are detected by the EDS analysis. As a reference, EDS was performed on the pure PVDF powder, presented in Figure S4. From the figures, a significant difference in the fluoride concentration is observed. The carbon/binder mixture has a lower fluoride concentration because the activated carbon and carbon black “dilutes” the PVDF concentration, which results in a smaller peak. The physical appearance of the CB and PVDF changes because of the wet mixing procedure that results in the adhesion of non-spherical structures to the activated carbon fiber and the presence of thin films of PVDF around the CB and activated carbon.
The slurries and “ink” were deposited into-onto the substrate using three methods: (1) slurry infiltration by calendering (SIC), (2) ink infiltration dropwise (IID), and (3) ink deposition by spray coating (IDSC). Figure 3C shows the SEM image of electrode E2b that was prepared by IID, with wet mixing time of 60 min and thermal treatment at 130 °C for 16 h. This image shows the adhesion of active material to the substrate. As expected, the concentration of fluoride decreases when the slurry is deposited into-onto the substrate, as illustrated in Figure S5, since the active material is distributed into and over the entire electrode. Lastly, Figure 3D depicts electrode E4 that was prepared by slurry infiltration by calendering (SIC), with a wet-mixing time of 30 min and heat treatment at 130 °C.
Figure 5A,B shows the difference between calendered and non-calendered electrodes E4 and E2b, respectively. The non-calendered electrode has large cavities between the substrate and active material, while the calendered electrode is denser with fewer cavities between the active material and substrate. Figure S6 illustrates the zoomed-out electrodes, showing the difference between calendered and non-calendered electrodes.

3.2. Maximum Salt Adsorption Capacity (mSAC)

The membrane capacitive deionisation (MCDI) performance of each electrode pair was evaluated as described in the experimental Section 2.6.2. The conductivity and electric current resulting from the change in potential during the pre-treatment and the mSAC cycles are shown in Figure 6. The dashed line (orange) indicates the conductivity of the feed solution, constant at 1766 µS/cm, and the solid lines (conductivity: blue and current: green) indicate the conductivity and current of the produced water. The salt adsorption and salt desorption half cycles are clearly visible and show the typical conductivity changes expected during an MCDI experiment. The mSAC value was determined by integration of the adsorption peak surface area during the 900 s adsorption half cycle.
Results for the electrodes produced via slurry infiltration by calendering (SIC), ink infiltration dropwise (IID), and ink deposition by spray coating (IDSC) are listed in Table 1. The results clearly indicate that electrode E1, produced using the SIC method, showed (1) a relatively high electrical conductivity, (2) the lowest thickness, and (3) the highest desalination capacity of the three deposition methods. All electrodes were heat treated at 130 °C.
The mSAC value of the JNT45 substrate, listed in Table 1, has a maximum salt adsorption capacity of 0.42 mg/g. This proves that the substrate has minimal contribution to the desalination performance of the electrode. Electrode E1, which was produced by the slurry infiltration by calendering method, outperformed E2a, E2b, and E3 in terms of mSAC value, despite possessing a lower specific surface area. Literature reports a direct relationship between the surface area of an electrode and its corresponding salt adsorption capacity, indicating that an electrode with a high BET surface area is predicted to have a higher salt adsorption capacity [25,26]. Some reports describe electrodes with a low BET surface area (~500 m2/g) exhibiting superior salt adsorption capacity (12.27 mg/g), in comparison to an electrode with a BET surface of ~1600 m2/g with a corresponding mSAC value of 7.0 mg/g [27]. E3, produced via the spray coating method, exhibited the lowest mSAC, with a value of 12.2 mg/g. Lu et al. produced a spray-coated electrode with an mSAC value of 5.6 mg/g [20]. Of the three electrodes they produced, electrodes produced by spray-coating resulted in the lowest desalination performance, a finding that accords with the results of this paper, as summarised in Table 1.
During the spray coating method, ink is sprayed onto the substrate as a fine mist. Due to the high substrate temperature of 150 °C, the solvent evaporates almost instantaneously, leaving the solid residue of activated carbon, carbon black, and binder immobilised on the surface of the substrate. Since these solids are not filling the pores in the substrate, the thickness increases and shows a lower conductivity, a lower surface area, and the lowest mSAC value.
Table 1 also shows the specific surface area of the electrode normalised to the weight of the active material, since 99% of the surface area of the electrode is provided by the activated carbon. According to the specific surface area measurements, electrodes E2a and E2b, both produced by applying the IID method, showed the highest specific surface area normalised to its AC content. Despite the higher values for the specific surface area, these electrodes did not show the highest desalination capacity, meaning that the surface area accessible for N2 may not necessarily contribute to the desalination capacity. This may occur if a portion of the activated carbon is not electrically linked to the current collectors. The compacting action of the calendering process assisted with formation of a denser electrode. Calendering of electrodes forces the active particles closer together resulting in improved electrical conductivity. While improved conductivity may assist in obtaining improved salt absorption rates, it may not necessarily improve mSAC values.

3.3. Influence of Wet Mixing Time on Electrode Performance

The slurry infiltration by calendering (SIC) method was applied to produce two additional electrodes, E4 and E5. Apart from a change in the slurry wet-mixing time, the electrodes were identical to E1. The electrodes were evaluated and the results are listed in Table 2. A comparison of electrode E1, E4, and E5 reveals a distinct reduction of mSAC as a function of the increase in wet mixing time. While the electrical conductivity and thickness of the electrodes E1, E4, and E5 are very similar, the electrode with the highest mSAC (E4: 24.8 mgNaCl/gAC) also shows the highest normalised specific surface area, which is close to the specific surface area of the virgin activated carbon YP80F material.
Based on the SEM images presented in Figure 3, the authors suggest that the carbon black particles re-agglomerate upon increasing wet mixing time. When the solvent evaporates, lumps of carbon black are left on the surface of the activated carbon, which results in less effective coverage of the activated carbon surface area and a subsequent a reduction of the mSAC value.

3.4. Influence of Thermal Treatment on Electrode Performance

After the remarkable improvement of the mSAC value for electrode E4, an attempt was made to further improve the performance of this electrode by optimising the thermal treatment procedure. Table 3 shows the results of four electrodes that were produced using the SIC method, whereby the slurry was wet mixed for 30 min. The electrodes were exposed to different temperatures prior to their routine analysis. Electrode JNT45 is an unmodified piece of substrate that was cut to size.
Comparison of the mSAC results of E4, E6, E7, and E8 shows that the optimal temperature to treat an electrode produced with the SIC method is 130 °C. Electrode E8, which was dried at 25 °C overnight, showed an mSAC value of 16.0 mgNaCl/gAC. A significant portion of the extended surface area is likely occupied by DMAC in electrode E8. Both the normalised specific surface area and the mSAC value are reduced for E6 and E7 when the electrode is heated to 250 and 350 °C, respectively, compared to E4. Thermal treatment of the electrodes above the melting point of PVDF (177 °C) could be the reason for the decline in the normalised specific surface area and the mSAC values. Heating PVDF above the melting temperature induces partial decomposition as evident from the EDS and DSC analysis, presented in Figures S7 and S9.
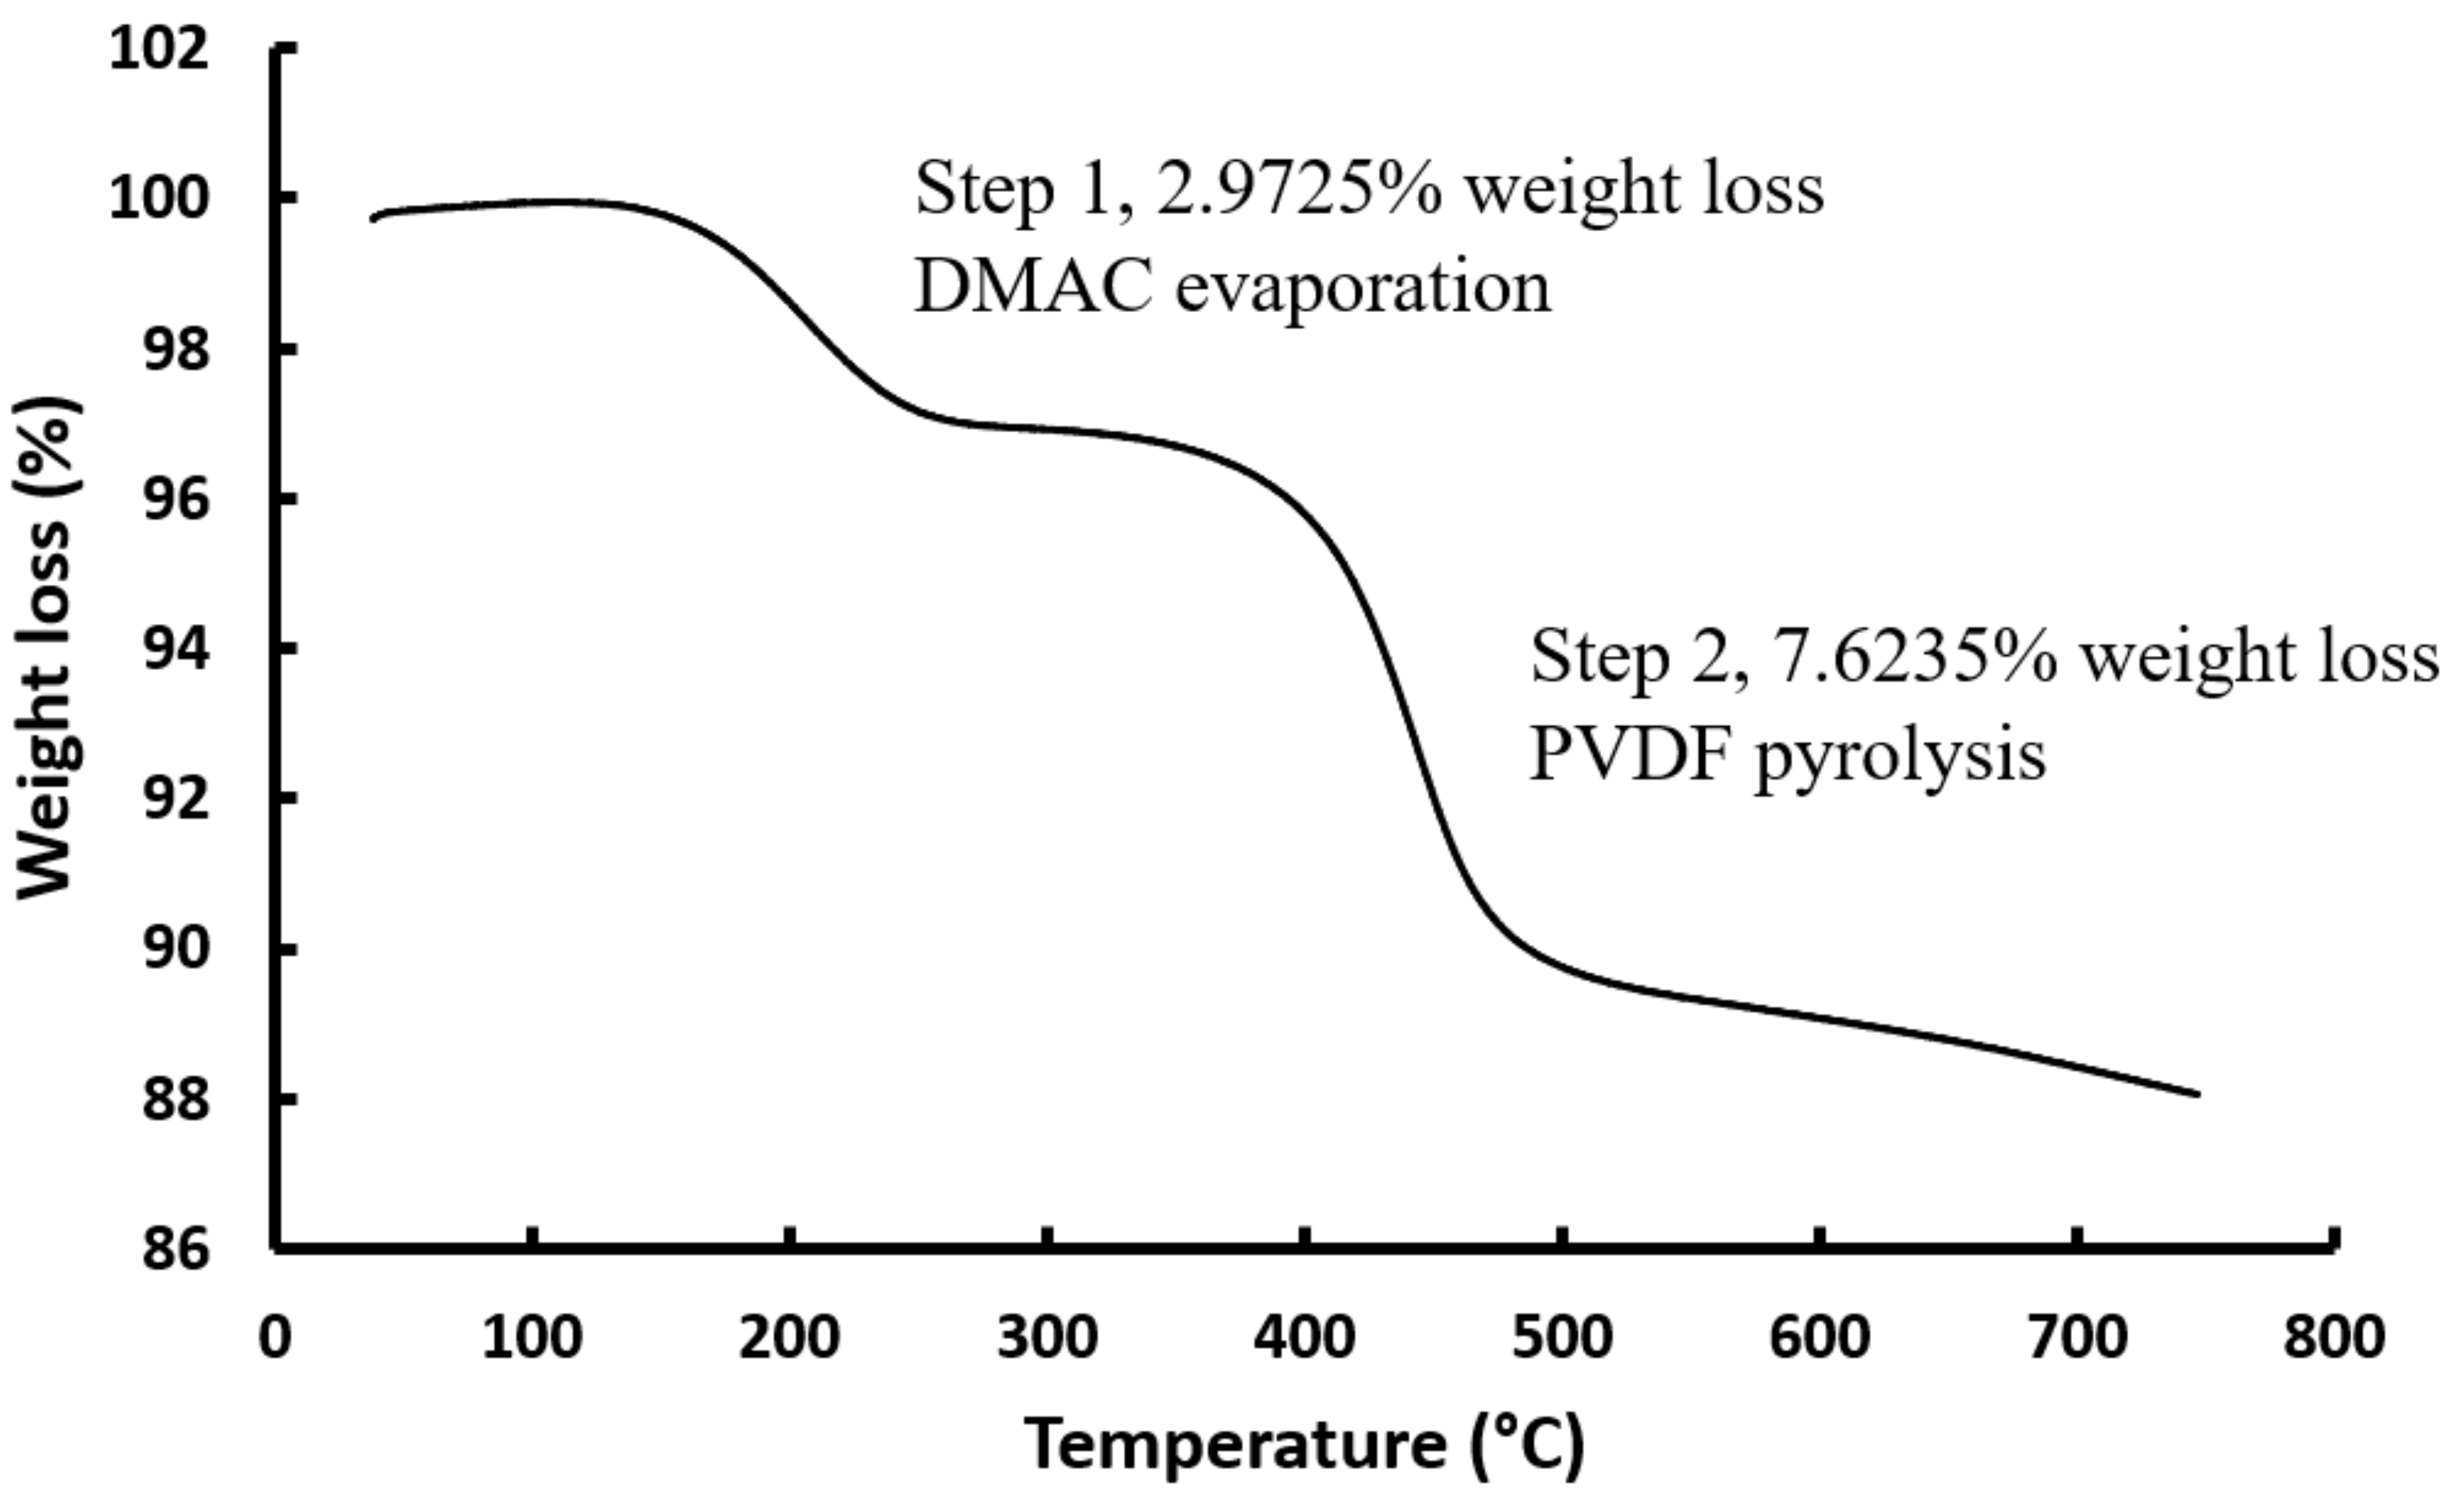
To accurately determine the optimal temperature for the thermal treatment of the electrodes that could improve the mSAC values, selected reagents were chosen and probed with thermogravimetric analysis coupled with mass spectrometry (TGA-MS). A pre-dried 30 min wet mix powder was subjected to thermal analysis using TGA-MS. Results are provided in Table 4 for MS and Figure 7 for TGA. Step 1 corresponds to the evaporation of DMAC (boiling point 165 °C) with a weight loss of 2.97% and a detected m/z ratio of 87 (molar mass of DMAC, 87.12 g/mol). The onset of the DMAC weight loss is approximately 129–131 °C. Slow solvent evaporation from the pores of the electrodes, below its boiling point, is preferred to minimise damage. This is proven by probing the electrodes using TGA-MS and DSC. Step 2 corresponds to the decomposition of PVDF (liberation of gaseous hydrogen fluoride, HF) with a weight loss of 7.62%, and a detected m/z ratio of 20 (molar mass of HF, 20.01 g/mol). The liberated gases clearly correspond to the evaporation of DMAC and liberated HF. Further evidence that step 2 corresponds to liberated HF is a comparison to the TGA of pure PVDF, which is shown in Figure S8, and the TGA of the 30 min wet mixture shown in Figure 7. In both figures, the HF mass loss is initiated at approximately 400 °C.
The highest mSAC value achieved by electrodes reported in literature, as summarised in Table 5, was 14,4 mg/g, while the values reported in this paper exceeds 20 mgNaCl/gAC, with a maximum of 24.8 mgNaCl/gAC. Slurry infiltration by calendering seems to be the best option for synthesising CDI electrodes, using activated carbon, carbon black, PVDF, and DMAC comprised slurries on the carbon substrate, JNT45 [18,20,28].

3.5. Contact Angle

The contact angle (θ) is a measure of the hydrophilicity or wettability of an electrode: If θ = 0° to 5°, it is considered perfect wetting. A contact angle of = 6°–90° is considered highly wettable, whereas if θ = 91°–150°, wettability is considered to be low. If θ = 151° or larger is observed, it is considered perfectly non-wettable [29]. The contact angles were established as described in the experimental Section 2.5.6 and the results are listed in Table 3. A hydrophilic electrode will allow salty feed water solution to enter the electrode, providing the desired access of ions to the extended surface area of the electrode [30,31]. Electrode JNT45 (unmodified substrate) shows the highest contact angle at 116° and is classified as low wettable. With such low wettability, access of ions in solution may be blocked by trapped gas bubbles. The front side of the electrodes is the side where the slurry is applied. It is evident from Table 3 that the application of slurry improves the hydrophilicity. It is also clear that an increase of the treatment temperature reduced the contact angle, even to the extent where the contact angle became θ = 0° on the front and back side when electrode E7 was exposed to a temperature of 350 °C.
The authors of this paper postulate that heat treatment of the electrodes with PVDF as binder increases the hydrophilicity. PVDF melts at 177 °C, allowing it to cover a greater portion of the active materials. The decomposition of PVDF then proceeds by liberating hydrogen fluoride gas, previously discussed in Table 4 and Figure 7, and explains why only a minute amount of fluoride is still present on the surface of electrode E7 (Figure S7) compared to electrodes treated at 130 °C (Figure 4). In accordance with research published by Nguyen [32], hydrocarbons with double bonds between the carbons of the newly formed products remain. As seen in Figure 8, the electrode treated at 350 °C has perfect wettability (θ = 0°) as the saline water droplet completely soaked into the surface of the CDI electrode, while electrodes E4 and E6 have contact angles of θ = 47° and θ = 23°, respectively. Lu et al. obtained contact angles of θ = 0°, θ = 60°, and θ = 127° for electrodes synthesized by the evaporation casting method, roller coating method and the spray coating method, respectively. The substrate JNT45 (θ = 116°) has a lower contact angle, and thus is more wettable, than the electrode prepared by spray coating, which proves that the spray coating method is not suitable for the synthesis of carbon-based CDI electrodes [20].

3.6. Application and Future Perspective of CDI Electrodes

For CDI technology to compete with well-established water purification technologies like reverse osmosis, the combination of capital expenses (CAPEX) and operational expenses (OPEX) of the selected technology needs to be competitive. Improved production processes, yielding optimised CDI electrodes, will both reduce CAPEX and OPEX cost, allowing wider application of CDI as water treatment technology. Furthermore, the optimised electrode production method presented in the current work can be combined with recent advances in CDI technology, such as the addition of metal additives as demonstrated by Byles et al. [33]. They obtained mSAC values as high as 44.4 mg/g with manganese (Mn) as additive for a KCl solution and an mSAC value of 40.8 mg/g was obtained for a NaCl solution with FeFe(CN)6 as additive.

4. Conclusions

Electrodes were prepared using three different electrode preparation techniques. The measured salt adsorption capacity showed that the method of electrode preparation had a significant impact on its performance, even though the composition of the dried electrodes was identical. Slurry infiltration by calendering (SIC), ink infiltration dropwise (IID), and ink deposition by spray coating (IDSC) produced electrodes with mSAC values of 17.0 mgNaCl/gAC, 14.1 mgNaCl/gAC, and 12.2 mgNaCl/gAC, respectively.
After the identification of the most effective electrode production technique, the electrode’s mSAC values was improved by optimising the ink processing procedure. The wet mixing time of the ink was specifically investigated. It was found that wet mixing for 30 min resulted in an electrode with an mSAC of 24.8 mgNaCl/gAC, which is significantly higher than other reported mSAC values for pure capacitive electrodes. Prolonged wet mixing lead to a decrease of the salt adsorption capacity, an observation that has not been described in any prior publications.
Finally, the mSAC values for electrodes exposed to different temperatures were studied together with the correlation between mSAC and surface area, as established by N2 adsorption. Nitrogen adsorption analysis enables measurement of the loss in available surface area during electrode production. A thermal treatment of 130 °C, deemed sufficient to remove the DMAC solvent, yielded an electrode in which 80% of the original surface area of the electrode material is still accessible. Drying temperatures of 250 and 350 °C resulted in both a loss of accessible surface area that correlated with a reduction of the maximum salt adsorption capacity (mSAC). An increase in temperature was accompanied by a decrease of the contact angle. The impact of the reduced contact angle on adsorption rate will be studied in a subsequent paper.
To conclude, this paper highlights important aspects of CDI electrode production not described before in available literature. The authors are convinced that implementation of their findings will assist in the creation of CDI systems showing a reduction of the overall cost of water treatment, which will reduce the cost and improve the availability of water worldwide.

Supplementary Materials

The following are available online at https://www.mdpi.com/2227-9717/9/1/1/s1, Figure S1: (A) Image of four-point probe setup, (1) multimeter, (2) four-point probe. (B) Close up illustrating (1) outer probes, (2) inner probes, and (3) the electrode, Figure S2: Image of in-house contact angle setup. (1) Micro pipette (20–200 µL), (2) HUAWEI P20 lite cellular phone (camera at the bottom), and (3) electrode was placed on the base of the contact angle setup, Table S1: Data on pore size distribution, Table S2: Experiments performed and standard deviation, Figure S3: (1) Autolab PGSTAT320N, (2) Computer recording conductivity and current, (3) MCDI cell, (4) Peristaltic pump, (5) Conductivity meter, (6) Feed water, (7) Effluent reservoir, Figure S4: EDS of PVDF, Figure S5: EDS of electrode E2b not calendered, thermally treated at 130 °C for 16 h, Figure S6: Zoomed out SEM images of A) Electrode E4 calendered and thermally treated at 130 °C for 16 h and B) Electrode E2b non-calendered and thermally treated at 130 °C for 16 h, shows the difference between calendered and non-calendered electrodes, Figure S7: EDS of electrode E7 thermally treated at 350 °C, Figure S8: Pyrolysis curve for PVDF, Figure S9: DSC of PVDF, indicating partial decomposition around 180 °C. Table S3: Conductivity and current data for JNT45 (substrate), Table S4: Conductivity and current data for E4, Table S5: Conductivity and current data for E6, Table S6 Conductivity and current data for E7.

Author Contributions

Conceptualisation, B.B.; Methodology, B.H.-M., N.S. and E.B.; Validation: N.S., B.H.-M., E.B., Writing—original draft preparation, E.B.; Writing—review and editing, B.B., B.H.-M. and E.B.; funding acquisition: B.H.-M. All authors have read and agreed to the published version of the manuscript.

Funding

This research was funded by the Water Research Commission of South Africa, project number WRC_KSA3: K5/2975.

Acknowledgments

The authors would like to thank Shonny Nkuna, Wake Engineering, John Zvimba, David Love, Jeeten Nathoo, Stephanus Victor, and Gerhard Gericke for their valued input during project meetings and the Water Research Commission of South Africa for their financial contribution.

Conflicts of Interest

The authors declare no conflict of interest.

References

  1. Wang, Z.; Dou, B.; Zheng, L.; Zhang, G.; Liu, Z.; Hao, Z. Effective desalination by capacitive deionization with functional graphene nanocomposite as novel electrode material. Desalination 2012, 299, 96–102. [Google Scholar] [CrossRef]
  2. Almarzooqi, F.A.; Al Ghaferi, A.A.; Saadat, I.; Hilal, N. Application of Capacitive Deionisation in water desalination: A review. Desalination 2014, 342, 3–15. [Google Scholar] [CrossRef]
  3. Porada, S.; Zhao, R.; van der Wal, A.; Presser, V.; Biesheuwel, P.M. Review on the science and technology of water desalination by capacitive deionization. Prog. Mater. Sci. 2013, 58, 1388–1442. [Google Scholar] [CrossRef] [Green Version]
  4. Bian, Y.H.; Yang, X.F.; Liang, P.; Jiang, Y.; Zhang, C.Y.; Huang, X. Enhanced desalination performance of membrane capacitive deionization cells by packing the flow chamber with granular activated carbon. Water Res. 2015, 85, 371–376. [Google Scholar] [CrossRef]
  5. Liang, P.; Yuan, L.L.; Yang, X.F.; Zhou, S.J.; Huang, X. Coupling ion-exchangers with inexpensive activated carbon fiber electrodes to enhance the performance of capacitive deionization cells for domestic wastewater desalination. Water Res. 2013, 47, 2523–2530. [Google Scholar] [CrossRef]
  6. Lee, L.Y.; Ng, H.Y.; Ong, S.L.; Tao, G.; Kekre, K.; Viswanath, B.; Lay, W.; Seah, H. Integrated pretreatment with capacitive deionization for reverse osmosis reject recovery from water reclamation plant. Water Res. 2009, 43, 4769–4777. [Google Scholar] [CrossRef]
  7. Jande, Y.A.C.; Kim, W.-S. Integrating reverse electrodialysis with constant current operating capacitive deionization. J. Environ. Manag. 2014, 146, 463–469. [Google Scholar] [CrossRef]
  8. Lee, K.P.; Arnot, T.C.; Mattia, D. A review of reverse osmosis membrane materials for desalination—Development to date and future potential. J. Membr. Sci. 2011, 370, 1–22. [Google Scholar] [CrossRef] [Green Version]
  9. Greenlee, L.F.; Lawler, D.F.; Freeman, B.D.; Marrot, B.; Moulin, P. Reverse osmosis desalination: Water sources, technology, and today’s challenges. Water Res. 2009, 43, 2317–2348. [Google Scholar] [CrossRef]
  10. Qin, M.H.; Deshmukh, A.; Epsztein, R.; Patel, S.K.; Owoseni, O.M.; Walker, W.S.; Elimelech, M. Comparison of energy consumption in desalination by capacitive deionization and reverse osmosis. Desalination 2019, 455, 100–114. [Google Scholar] [CrossRef]
  11. Wang, C.; Song, H.; Zhang, Q.; Wang, B.; Li, A. Parameter optimization based on capacitive deionization for highly efficient desalination of domestic wastewater biotreated effluent and the fouled electrode regeneration. Desalination 2015, 365, 407–415. [Google Scholar] [CrossRef]
  12. ACS Publications. Available online: https://pubs.acs.org/doi/10.1021/ba-1960-0027 (accessed on 8 December 2020).
  13. Arnold, B.B.; Murphy, G.W. Studies on the Electrochemistry of Carbon and Chemically-Modified Carbon Surfaces. J. Phys. Chem. 1961, 65, 135–138. [Google Scholar] [CrossRef]
  14. Marsh, H.; Rodriguez-Reinoso, F. Activated Carbon, 1st ed.; Elsevier: London, UK, 2006; pp. 13–77. [Google Scholar]
  15. Stoeckli, F.; Guillot, A.; Slasli, A.M.; Hugi-Cleary, D. Microporosity in carbon blacks. Carbon 2002, 40, 211–215. [Google Scholar] [CrossRef] [Green Version]
  16. Cohen, I.; Avraham, E.; Bouhadana, Y.; Soffer, A.; Aubach, D. Long term stability of capacitive de-ionization processes for water desalination: The challenge of positive electrodes corrosion. Electrochim. Acta 2013, 106, 91–100. [Google Scholar] [CrossRef]
  17. Jo, K.; Baek, Y.; Kim, S.; Hong, S.P.; Yoon, J. Evaluation of long-term stability in capacitive deionization using activated carbon electrodes coated with ion exchange polymers. Korean J. Chem. Eng. 2020, 37, 1199–1205. [Google Scholar] [CrossRef]
  18. Zhao, R.; Biesheuvel, P.M.; Miedema, H.; Bruning, H.; van der Wal, A. Charge Efficiency: A Functional Tool to Probe the Double-Layer Structure Inside of Porous Electrodes and Application in the Modeling of Capacitive Deionization. J. Phys. Chem. Lett. 2010, 1, 205–210. [Google Scholar] [CrossRef]
  19. Kim, Y.J.; Choi, J.H. Enhanced desalination efficiency in capacitive deionization with an ion-selective membrane. Sep. Purif. Technol. 2010, 71, 70–75. [Google Scholar] [CrossRef]
  20. Lu, G.; Wang, G.; Wang, P.H.; Yang, Z.; Yan, H.; Ni, W.; Zhang, L.; Yan, Y.-M. Enhanced capacitive deionization performance with carbon electrodes prepared with a modified evaporation casting method. Desalination 2016, 386, 32–38. [Google Scholar] [CrossRef]
  21. Bockholt, H.; Haselrieder, W.; Kwade, A. Intensive powder mixing for dry dispersing of carbon black and its relevance for lithium-ion battery cathodes. Powder Technol. 2016, 297, 266–274. [Google Scholar] [CrossRef]
  22. Bauer, W.; Nötzel, D.; Wenzel, V.; Nirschl, H. Influence of dry mixing and distribution of conductive additives in cathodes for lithium ion batteries. J. Power Sources 2015, 288, 359–367. [Google Scholar] [CrossRef]
  23. Bockholt, H.; Haselrieder, W.; Kwade, A. Intensive Dry and Wet Mixing Influencing the Structural and Electrochemical Properties of Secondary Lithium-Ion Battery Cathodes. ECS Trans. 2013, 50, 25–35. [Google Scholar] [CrossRef]
  24. Westphal, B.G.; Mainusch, N.; Meyer, C.; Haselrieder, W.; Indrikova, M.; Titscher, P.; Bockholt, H.; Viöl, W.; Kwade, A. Influence of high intensive dry mixing and calendering on relative electrode resistivity determined via an advanced two point approach. J. Energy Storage 2017, 11, 76–85. [Google Scholar] [CrossRef]
  25. Wang, G.; Qian, B.; Dong, Q.; Yang, J.; Zhao, Z.B.; Qiu, J. Highly mesoporous activated carbon electrode for capacitive deionization. Sep. Purif. Technol. 2013, 103, 216–221. [Google Scholar] [CrossRef]
  26. Liu, Y.; Pan, L.; Xu, X.; Lu, T.; Sun, Z.; Chua, D.H.C. Enhanced desalination efficiency in modified membrane capacitive deionization by introducing ion-exchange polymers in carbon nanotubes electrodes. Electrochimica Acta 2014, 130, 619–624. [Google Scholar] [CrossRef]
  27. Porada, S.; Weinstein, L.; Dash, R.; van der Wal, A.; Bryjak, M.; Gogotsi, Y.; Biesheuvel, P.M. Water Desalination Using Capacitive Deionization with Microporous Carbon Electrodes. ACS Appl. Mater. Interfaces 2012, 4, 1194–1199. [Google Scholar] [CrossRef] [PubMed] [Green Version]
  28. Biesheuvel, P.M.; Zhao, R.; Porada, S.; van der Wal, A. Theory of membrane capacitive deionization including the effect of the electrode pore space. J. Colloid Interface Sci. 2011, 360, 239–248. [Google Scholar] [CrossRef] [Green Version]
  29. Gao, W.; Li, Z. Nanostructured transition metal oxides and their applications in composites. In Physical Properties and Applications of Polymer Nanocomposites; Woodhead Publishing: Cambridge, UK, 2010; pp. 723–742. [Google Scholar]
  30. Alencherry, T.; Naveen, A.R.; Ghosh, A.; Daniel, J.; Venkataraghavan, R. Effect of increasing electrical conductivity and hydrophilicity on the electrosorption capacity of activated carbon electrodes for capacitive deionization. Desalination 2017, 415, 14–19. [Google Scholar] [CrossRef]
  31. Jia, B.; Zou, L. Wettability and its influence on graphene nansoheets as electrode material for capacitive deionization. Chem. Phys. Lett. 2012, 548, 23–28. [Google Scholar] [CrossRef]
  32. Nguyen, T. Degradation of poly (vinyl Fluoride) and poly (vinylidene Fluoride). J. Macromol. Sci. Part C 1985, 25, 227–275. [Google Scholar] [CrossRef]
  33. Byles, B.W.; Cullen, D.A.; More, K.L.; Pomerantseva, E. Tunnel structured manganese oxide nanowires as redox active electrodes for hybrid capacitive deionization. Nano Energy 2018, 44, 476–488. [Google Scholar] [CrossRef]
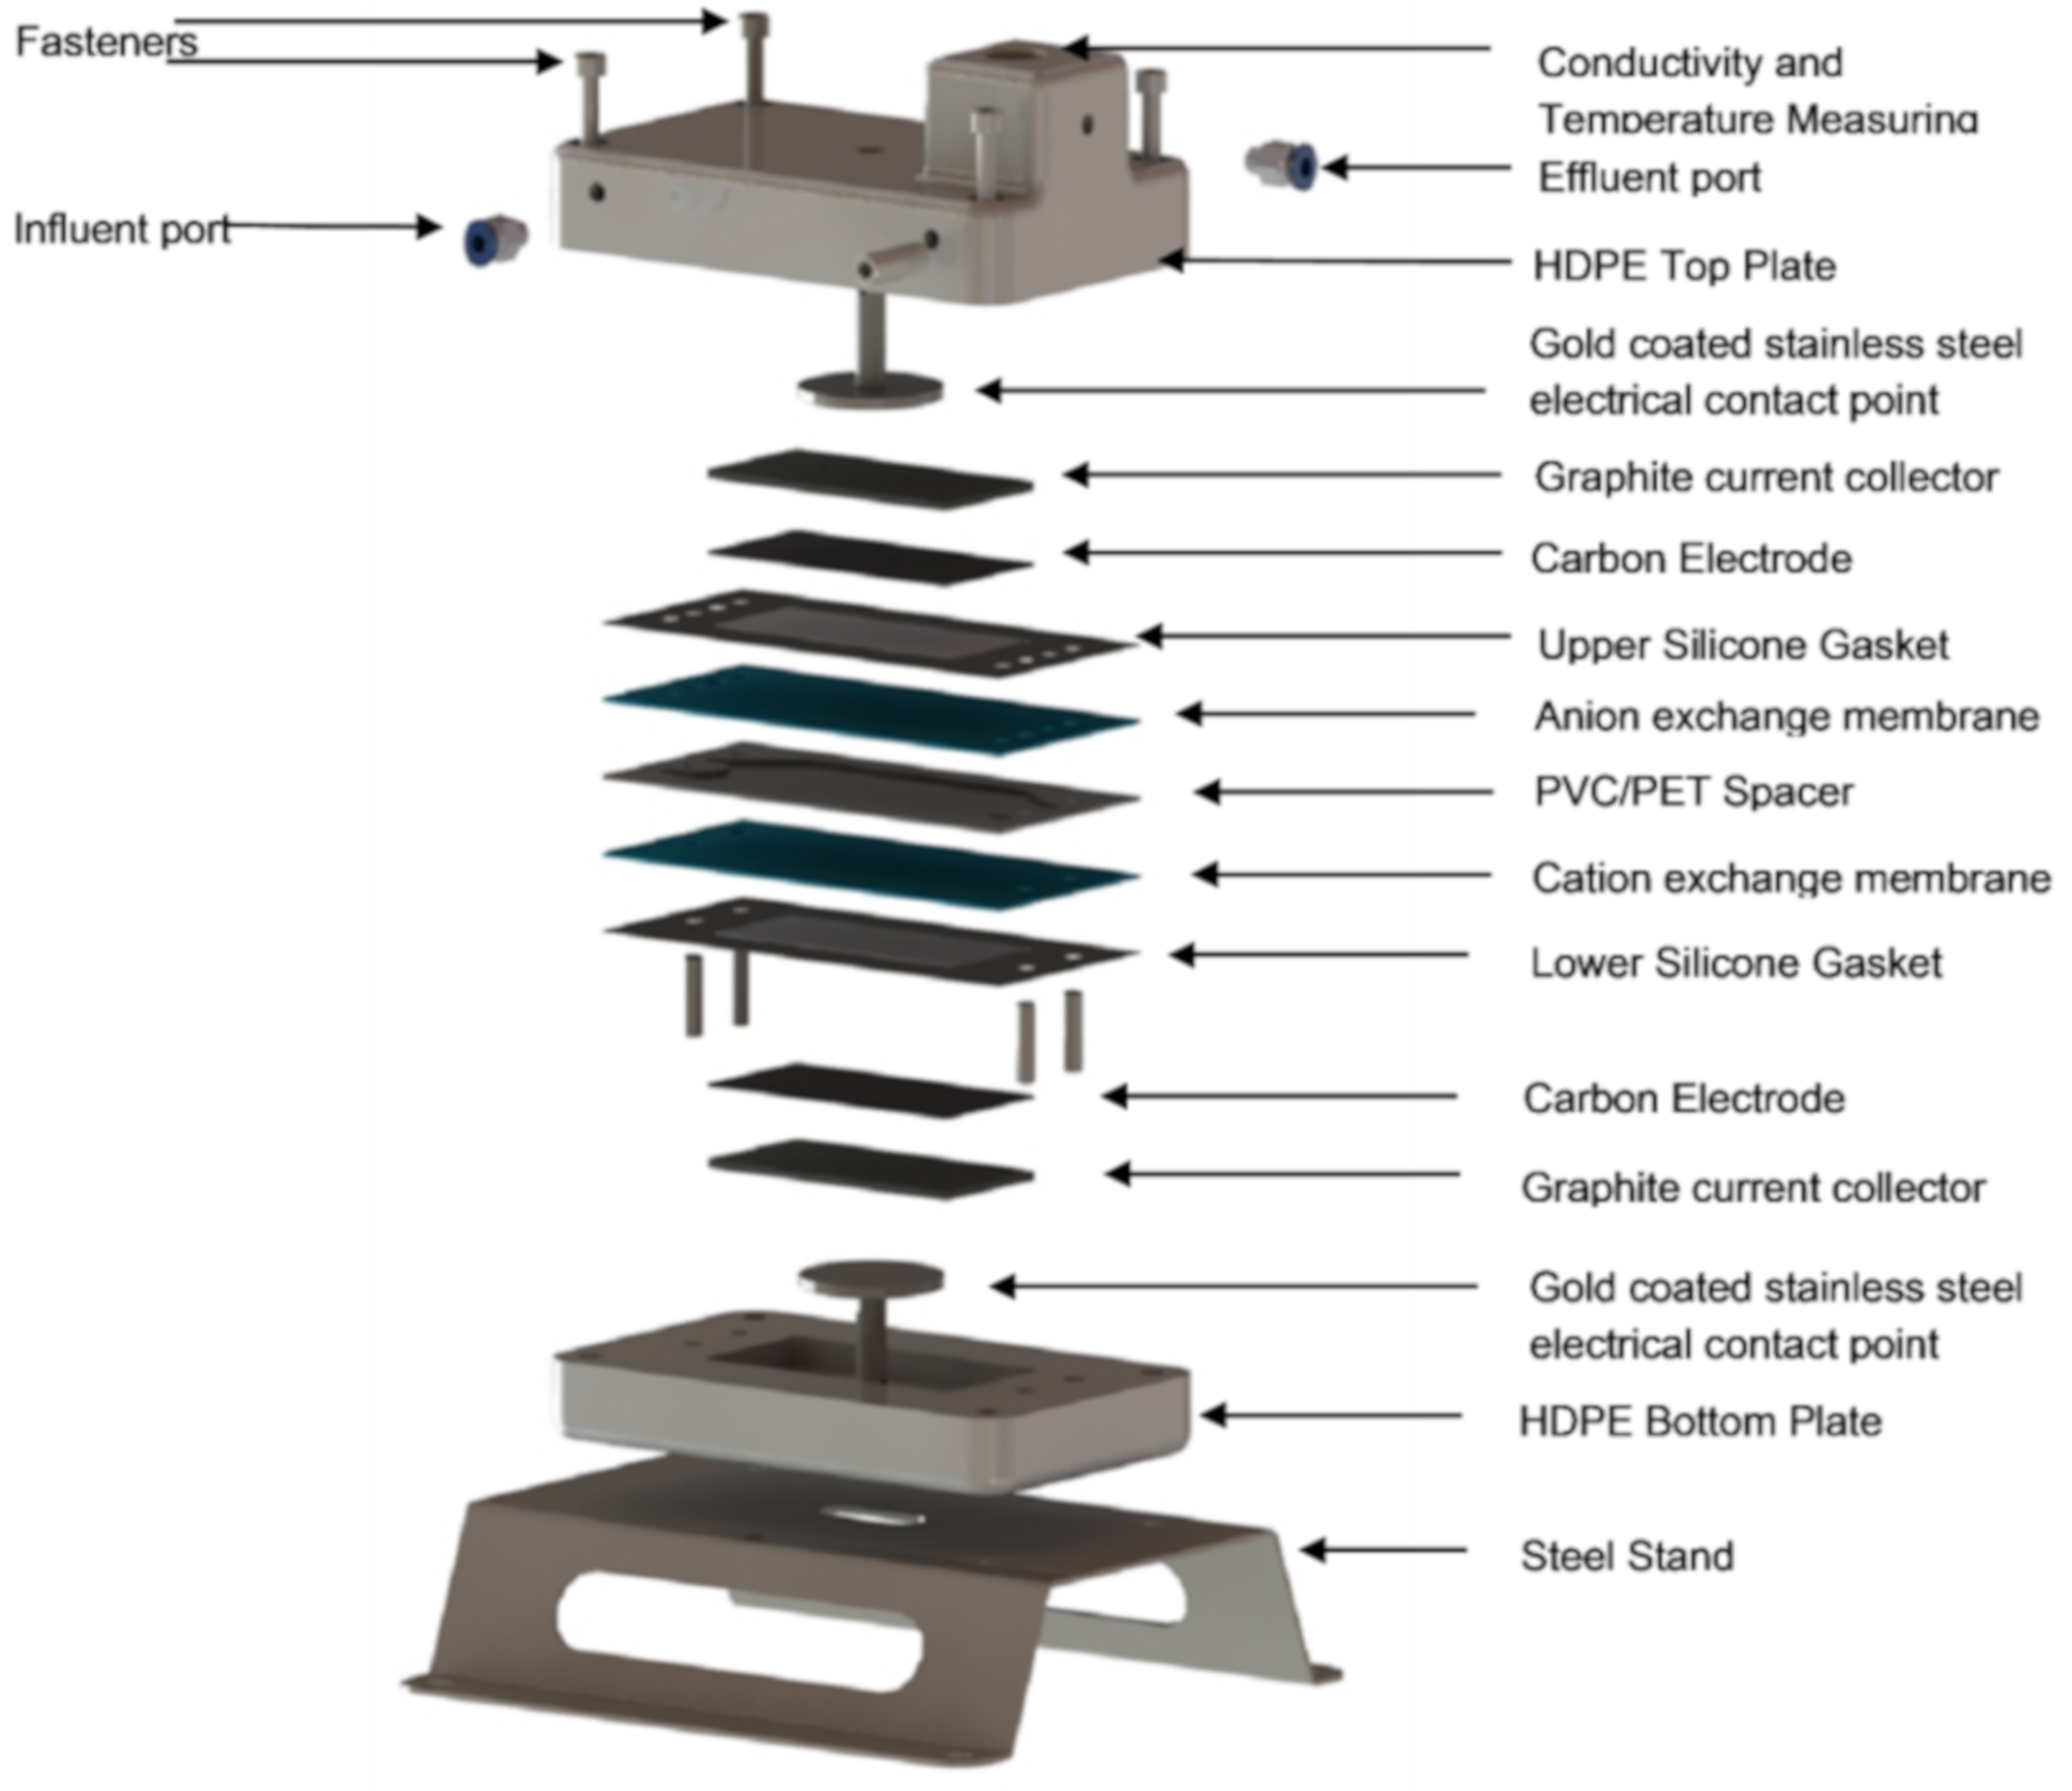
Figure 1. A detailed overview of the in-house built membrane capacitive deionisation cell (MCDI). Reproduced with permission from Nkuna, S.; Development of capacitive deionisation electrodes: optimisation of fabrication methods and composition; published by University of the Western Cape, 2018.
Processes 09 00001 g001
Figure 2. Scanning electron microscopy (SEM) images of (A) Activated Carbon (AC) (B) Carbon Black (CB) (C) Polyvinylidene Difluoride (PVDF) and (D) JNT45 (substrate).
Processes 09 00001 g002
Figure 3. (A) Activated Carbon (AC) + Carbon Black (CB) 60 min dry mix, (B) Activated Carbon (AC) + Carbon Black (CB) + Polyvinylidene Difluoride (PVDF) 30 min wet mix with N,N-dimethylacetamide (DMAC) as solvent and dried at 130 °C for 12 h, (C) Electrode E2b not-calendered, thermally treated at 130 °C for 16 h and (D) Electrode E4 calendered, thermally treated at 130 °C for 16 h.
Processes 09 00001 g003
Figure 4. Energy dispersive x-ray spectroscopy (EDS) of Activated Carbon (AC) + Carbon Black (CB) + Polyvinylidene Difluoride (PVDF) 30 min wet mixture with N,N-dimethylacetamide (DMAC) as solvent and dried at 130 °C for 12 h.
Processes 09 00001 g004
Figure 5. Scanning electron microscopy (SEM) images of (A) electrode E4 was calendered and thermally treated at 130 °C for 16 h, and (B) electrode E2b, non-calendered and thermally treated at 130 °C for 16 h, shows the difference between calendered and non-calendered electrodes.
Processes 09 00001 g005
Figure 6. Conductivity of solution entering and exiting the membrane capacitive deionisation (MCDI) cell (dashed line: orange and solid line: blue, respectively) and the current generated (solid line: green) as a function of the applied electrode potential over time for electrode E1. The maximum salt adsorption capacity (mSAC) is a measure of the maximum amount of salt adsorbed on an electrode in mg per gram (mg/g) of electrode used in the cell.
Processes 09 00001 g006
Figure 7. Thermogravimetric Analysis (TGA) of the 30 min wet mixture with N,N-dimethylacetamide (DMAC) as solvent and dried at 130 °C for 12 h.
Processes 09 00001 g007
Figure 8. Contact angle images: Electrode E4, treated at 130 °C, with θ = 47°, Electrode E6 treated at 250 °C, with θ = 23° and Electrode E7, treated at 350 °C, with θ = 0°.
Processes 09 00001 g008
Table 1. Electrodes produced using slurry infiltration by calendering (SIC), ink infiltration dropwise (IID) and ink deposition by spray coating (IDSC).
Electrode
Pair
Wet Mixing TimeDeposition
Method
Electrical ConductivityElectrode
Thickness
BET Specific Surface AreamSAC
(min)(°C)S/cmmmm2/gAC(mgNaCl/gAC)
JNT45N/AN/A560.3470.42
YP80N/AN/AN/AN/A2316N/A
E160SIC (25)410.37158917.0
E2a60IID (25)410.48170615.5
E2b60IID (130)330.44179514.1
E360IDSC (150)320.68131012.2
Table 2. Electrodes were produced using slurry infiltration by calendering (SIC) and were thermally treated at 130 °C. Wet mixing times were applied as follows: E1—30 min, E4—60 min, and E5—120 min.
Electrode
Pair
Wet Mixing TimeDeposition
Method
AC LoadingElectrical ConductivityElectrode
Thickness
BET Specific Surface AreamSAC
(min)(°C)mg/cm2S/cmmmm2/gAC(mgNaCl/gAC)
E430SIC (25)6.9440.38199324.8
E160SIC (25)6.9410.37158917.0
E5120SIC (25)6.9440.35150814.0
Table 3. Electrodes produced applying slurry infiltration by calendering (SIC), wet mixed for 30 min and thermally treated at various temperatures.
Electrode
Pair
Wet Mixing TimeDeposition
Method
Contact Angle (°)Thermal TreatmentBET Specific Surface AreamSAC
(min)(°C)FrontBack°Cm2/gAC(mgNaCl/gAC)
JNT45N/AUntreated1161162570.42
E430SIC (25)4768130199324.8
E630SIC (25)2348250180420.9
E730SIC (25)00350179720.1
E830SIC (25)505025*16.0
* The pre-treatment procedure for the N2 adsorption analysis required the samples to be degassed at 130 °C.
Table 4. Mass Spectrometry (MS) data of the 30-min wet mixture with N,N-dimethylacetamide (DMAC) as solvent and dried at 130 °C for 12 h.
Liberated Productm/zTGA Step
DMAC871
HF202
Table 5. A comparison of the maximum salt adsorption capacity (mSAC) values obtained in literature.
Electrode/ReferencemSAC (mg/g)
E424.8
E620.9
E720.1
2814.2
12.8
2014.4
8.5
1812.8
10.5
Publisher’s Note: MDPI stays neutral with regard to jurisdictional claims in published maps and institutional affiliations.