Abstract
SuperPro Designer® is a process simulator software used for analyzing the techno-economic feasibility of large-scale bioprocesses. Its predetermined built-in features allow for easy implementation by non-experts, but a lack of examples limits its appropriation. This study aims to validate the implementation of SuperPro Designer® by non-experts for the techno-economic analysis of anaerobic digestion in Colombia, using vinasse as feedstock. These results demonstrate the financial feasibility of such a process when a processing flow rate of 25 m3/h is ensured. Additionally, this study validates the manageability of the tool for assessing the economic feasibility of a technology, a key practice during technology development regardless of the area of expertise.
1. Introduction
The implementation of large-scale strategies for waste management, such as anaerobic digestion (AD), requires economic evaluation since the establishment of these approaches largely depends on the technical and geopolitical conditions of the specific location. Therefore, techno-economic analyses (TEA) are essential for determining the feasibility of a project, and they must be adapted to the location of interest. TEA commonly combine process modeling, engineering design, and economic evaluation, by assessing the economic viability of a process and identifying sensible and cost-risk points during the development and implementation stages [1,2,3,4].
Excel® and ASPEN Plus® are the most commonly used software products for TEA during the development stages associated with process operation and optimization. Excel® is widely used due to its availability and easy access. Process calculations are performed with spreadsheets, which limits the analysis to a small number of units. This is because the formulas to calculate thetotal cost categories for a TEA are commonly scattered across multiple sheets, which makes it difficult for the user to follow. Spreadsheet models are based on pre-existing templates for specific scenarios, which require a later adaptation of the models depending on the user settings, thus making them difficult for a non-expert to use and adapt. By contrast, ASPEN Plus® is modeling software that enables the optimization of throughput, product quality, and energy. It is used in processes with batch, continuous, and mixed batch and continuous operations [5]. This steady-state sequential modular simulation package has been employed as a tool to simulate and design chemical processes, and it offers the possibility of simulating various combinations of unit operations using the built-in process models [6]. However, it requires previous experimental data for simulation. The kinetic models must be introduced during the simulation, and in some cases, it is hard to converge the models. ASPEN Plus® can be difficult for non-experts to use because it requires a large amount of technical information for inputs, making it time-consuming. Additionally, it has limitations associated with the downstream and economic analyses of large-scale processes. For example, in downstream processes, conversion is assumed for the reactor; instead, a rigorous reactor model and phase separators are modeled as component splitters, which leads to inaccurate and incomplete results [7]. Additionally, the software does not have an integrated function to calculate the energy of the streams presented in a process, or a function to evaluate techno-economic costs. Therefore, additional software programs are required to perform the analysis [4]. Despite the abovementioned challenges, both tools have default values for many of the input data drawn from the literature that could be useful when experimental data are not readily available.
SuperPro Designer® is a process simulator that facilitates the modeling, evaluation, and optimization of integrated processes. It was specifically developed for the simulation of bioprocess unit operations; thus, it can handle batch and continuous processing schemes [8]. It can also be used at all stages of process development, from conceptual design through to process operation and optimization. Besides process modeling, the software has many advanced convenient features that may be used for the calculation of material and energy balances, and extensive databases for chemical component and mixtures, as well as equipment and resources, equipment sizing and costing, thorough process economics, and waste stream characterization [9]. It is a useful resource for large-scale processes due to its easy and user-friendly approach. This user-friendly approach facilitates its use by non-experts, especially during technology development stages, when TEA can help to identify cost-sensible factors [10,11]. Like Excel® and Aspen Plus®, SuperPro Designer® has default values for many of the input data required for simulation but has less-rigorous thermodynamic packages, and some of the streams during continuous processes must be known beforehand [12,13].
Software selection for TEA evaluations is usually based on the technical knowledge, time, and process data available for the researcher [2,14,15,16]. Therefore, if TEA evaluations are to be performed by non-experts during technology development and optimization, it is important to determine whether SuperPro Designer® simulations are comparable to those obtained with Excel® and Aspen Plus®.
Several economic assessments using Excel® and Aspen Plus® have been used to determine the economic feasibility of AD as a source of bioenergy using different feedstocks such as municipal and household wastes, agro-industrial liquid and solid wastes, lignocellulosic biomass, and sugarbeet vinasse [17,18,19,20,21]. Unfortunately, few assessments have been developed specifically for sugarcane vinasses, and all the reported studies are focused on Brazil [22,23]. Fuess and Zaiat (2018) [24] used Excel® to evaluate the main factors that govern the economic feasibility and profitability of using a vinasse-fed AD plant to generate bioenergy. Their results show that higher investment costs are needed for two-phase AD plants, despite the lower operating costs due to chemical inputs. Additionally, in terms of financial indices, annexed plants outperformed autonomous plants irrespective of the biogas application and AD layout.
Colombia is the second-largest producer of bioethanol in Latin America; it produces more than 1,200,000 L of bioethanol per year from sugarcane processing [25]. One of the main byproducts obtained from the bioethanol production process is vinasse, a liquid product generated after bioethanol distillation. The production of sugarcane vinasse in traditional autonomous and annexed distilleries ranges from 10 to 13 L per liter of ethanol [26,27]. In Colombia, annexed distilleries have reduced vinasse volume by a series of recirculation and energy-intensive evaporation steps to increase its solid content fivefold, from ~6% to ~30% total solids (TS) [28,29,30,31,32]. Due to its composition, vinasse has being used in composting processes and direct land application via fertigation, partially satisfying water needs. Depending on soil physicochemical characteristics, these practices can result in hydro-chemical changes altering soil and water dynamics, polluting these environments in the long term [28,33]. Alternative strategies to manage and even valorize this byproduct are currently under evaluation. The anaerobic treatment of biomass has been recognized as one of the most attractive strategies for the development of alternative energy sources since it converts more than 50% of the initial organic material into biogas, a renewable energy source, and digestate, a high-quality agricultural fertilizer [34,35,36]. Due to the potential of AD to valorize sugarcane-based vinasse and the number of TEA evaluations using Excel® and Aspen Plus® performed in other countries (e.g., Brazil), we aimed to validate the easy implementation of SuperPro Designer® using many of its built-in features to evaluate the techno-economic feasibility of an anaerobic digestion plant fed with sugarcane-based vinasse for electrical energy generation in Colombia.
2. Material and Methods
2.1. Physicochemical Characterization of Inoculum and Substrates
The starting inoculum was a digested sludge from the Cañaveralejo wastewater treatment plant (Cali, Colombia). Sugarcane-based vinasses were collected from six annexed distilleries located in the Cauca Valley region in Colombia, before and after evaporation steps when possible. Substrate sampling was carried out during different seasons, and the samples were stored at 4 °C until processing. The total solid (TS), volatile solids (VS), and humidity of all the vinasses and the starting sludge were measured by combustion and gravimetric methods according to the National Renewable Energy Laboratory (NREL) protocols (NREL/TP-510-42621). For each vinasse, a representative sample of 4 mL was used to measure the pH using a HI 2030 pH meter (Hanna Instruments, Italy). Carbon (C) and nitrogen (N) contents were determined via dry combustion for each substrate by an external service in the analytical laboratory at the International Center for Tropical Agriculture (CIAT).
2.2. Biomethane Potential (BMP) Analysis
The VDI 4630 technical guidelines were used to carry out the BMP analysis of the collected vinasses. The starting inoculum contained 8.33 g/L of TS and 3.25 g/L of VS. The experimental unit consisted of 30 batch bench-scale 1L reactors with a 60% working volume and constant agitation. Biogas generation was quantified using an inline flow meter, and the biogass composition was determined with a portable BIOGAS 5000 (Geotech, UK). A 1:6 VS-substrate % ratio/VS-inoculum % ratio and mesophilic conditions were used in the BMP analysis. The energy potential was estimated based on the resulting BMP using the following equation, assuming that 1 m3 of biogas generated 11.70 kW/h [37] (Equation (1)):
2.3. Statistical Analysis
The Mann–Whitney U test was used for statistical analysis using the SigmaPlot® 13.0 software (Systat Software, Inc., Chicago, IL, USA), to assess the correlation between the % VS and BMP values, with p < 0.05.
2.4. Model Generation for Biogas Production: Simulation Description
An AD-plant-processing sugarcane-based vinasse for electrical energy generation was simulated using the SuperPro Designer software v9.5 (Intelligen, Inc., Scotch Plains, NJ, USA). A 15-year lifetime was assumed, including a one-year construction and start-up phase. A continuous process was set up with a 312 days/year operation time with 85% working capacity. Microsoft Excel® 2010 was used to calculate the plant’s cumulative cash flow. The stoichiometric conversion of the biotransformation process was fixed according to the BMP analysis.
2.5. Process Description
Bioreactors with a maximum volume of 5000 m3 were defined with a 90% working vessel volume and 95 h residence time. The process model was assumed to be operated under continuous mode. The process was divided into three main steps: compression, burning, and expansion. First, the diluted vinasse was fed to a storage tank (P1/ST) to control a constant flow for the AD reactor (P2/AD). Then, the produced biogas was conducted to a gas compressor (P4/GC) to be burned (P5/GB), and the combustion gases were later used in gas expansion (P6/GE) to generate electricity. A flow splitter (P3/SP) returned 5% of the flow to a mixer (P0/MX) to be included in the diluted vinasse-fed stream. Some of the digestion product was recycled as inoculum. The non-recycled stream was fed to a centrifugal decanter (P7/CD) to obtain a sludge cake with 66% solid content, which yielded wastewater with a solid content of <0.5% (w/w). For the expansion step, an isentropic expansion was configured (Figure 1). The process was modeled using SuperPro Designer®, and the AD process parameters are summarized in Table 1. The combustion gas flow was defined as the revenue stream for the model, considering a selling price of 0.1 USD/kWh for the electric power produced, and the electrical energy generation was estimated using the built-in efficiency model in SuperPro Designer®.
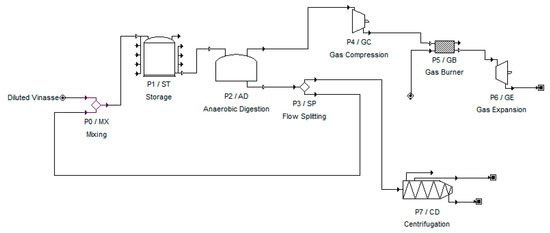
Figure 1.
Process flow for electrical energy generation from biogas generated by a sugarcane-based vinasse-fed anaerobic digestion (AD) plant.

Table 1.
Process parameters of anaerobic digestion.
2.6. Economic Analysis
The economic performance of the plant was measured by calculating the Fixed Capital Investment and Working Capital Costs (Table 2). The equipment size (Table 3) and purchase costs were estimated using the design mode with data provided by a local supplier and the SuperPro Designer® built-in cost model, respectively.
Table 2.
Parameters used for the economic evaluation of a sugarcane-based vinasse-fed AD plant.
Table 3.
Equipment cost parameters.
To extrapolate the equipment investment cost, the following cost rule was used:
CO is the investment cost for a piece of equipment with Qo process capacity. The “a” value was 0.6. The model predicts new equipment costs depending upon the modeled capacity according to mass and energy balance restrictions.
OPEX (operational expenditure) was estimated as the monthly cost of labor, raw materials, utilities, waste treatment, and disposal when the sludge and liquid from the centrifugation (decanter) were considered emissions. CAPEX (capital expenditure) was estimated in USD, and the annual OPEX breakdown was calculated as a function of the processed mass (kg) of sugarcane-based vinasse.
2.7. Sensibility Analysis
A sensibility analysis was carried out using SuperPro Designer®. The analysis considered vinasse processing flow rates ranging from 5.0 to 125.0 kg/h.
2.8. Profitability Analysis
The following variables were used to determine the economic profitability of the process: vinasse processing flow rates ranging from 5.0 to 125.0 kg/h and cost/revenue of byproducts (digestate) ranging from −0.001 to +0.009 USD/kg, considering negative values as the costs of disposal, while positive values corresponded to revenues from sales. The gross margin, net present value (NPV) (Equation (2)), internal rate of return (IRR), payback time, and return on investment (ROI) (Equation (3)) were estimated using the SuperPro Designer® software. The profit tax used for the Colombian scenario was 16.5%.
where t is the lifetime in years, Ct is the net cash flow during period t, Co is the initial investment, and d is the discount rate (3% in this case). The IRR is the discount rate at which the NPV value is zero. IRR is commonly used to indicate the efficiency or yield of an investment. The payback time is the time required to recoup the investment cost, while the ROI describes the rate of the cash return.
3. Results and Discussion
3.1. Vinasse Characterization and BMP Analysis
All the sugarcane-based vinasses produced in the geographical valley of the Cauca River were characterized based on their physicochemical characteristics (Table 4). All the samples had a low pH ranging from 4.01 to 5.04, while the % VS ranged from 1.95 ± 1 × 10⁻⁵% to 13.78 ± 1 × 10⁻⁴% for the diluted vinasses and 14.88 ± 4 × 10⁻⁴% to 32.20 ± 0.001% for the concentrated ones. The % VS and % C are directly related to the organic matter content of each substrate. According to the strategies and efficiencies of the evaporation systems present in each mill, these values tended to vary. The C/N ratios, which reflect the nutrient levels of substrates, of the diluted vinasses were within the ranges 4.61–8.24 and 9.49–18.12 for concentrated vinasses. Organic matter added to a digestion system promotes the growth of anaerobic bacteria and biogas production, making anaerobic digestion systems sensitive to this relationship. Some studies indicate that the optimal range of the C/N ratio for a fermentation process for methane production is between 25 and 30 [38].
Table 4.
Physiochemical characterization of vinasses.
The BMP is used to quantify the maximum amount of methane that can be produced during the AD of organic substrates [39,40,41]. It also provides information on degradation kinetics and potential inhibitors [42]. Techno-economic assessments of AD plants depend on different parameters including the rate of methane production from the organic materials to be digested [43,44,45,46]. The amount of methane produced also has a significant influence on the design of the downstream processing of the produced biogas. It influences the choice of cogeneration to produce electricity and heat, as well as the number and capacity required. It also influences the design and quantity of biogas storage and purification systems [45].
A test was performed to determine whether there was a difference between mills, to establish if the evaporation process affected the biomethane production yield, and to define the biomethane production yield value to use in the simulations to perform a global analysis rather than a Sugar Mill-specific analysis. The results shown in Figure 2 indicate that there was not a statistically significant difference (p = 0.437) between the biogas yields among mills when the % VS values were similar. By contrast, there was a statistically significant difference (p = 0.019) between the concentrations of solids and biogas production. Additionally, the results suggest that biogas production is inversely correlated with the % VS; the higher the concentration, the lower the biogas production. This relationship indicates that the concentration process not only increases the % VS but may also increase the quantity of inhibitory compounds or reduce the biodegradability of the organic matter due to the heating process. In 2013, Budiyono and collaborators [47] determined the effect of different vinasse/water ratios on biogas yield. They concluded that the 1:3 ratio (TS, 7.015 ± 0.007%) yielded the highest rate of biogas production; this study suggests that the presence of inhibitory compounds explains the obtained results, rather than an effect on biodegradability.
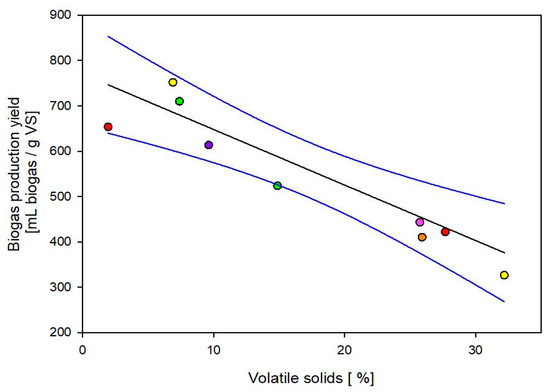
Figure 2.
Variation in the biogas production yield as a function of the % VS of the annexed distilleries in Colombia. Triplicates from the same sample are represented by circles. Circles with the same color indicate samples from the same plant. The blue line represents a confidence level of 95%.
This is the first analysis of the correlation between % VS and biomethane production yield carried out with raw sugarcane-based vinasses generated before (diluted) and after (concentrated) the evaporation steps in all annexed distilleries in Colombia. According to the data, the vinasse concentration, not the source, impacts biogas production. As such, larger feedstock volumes result in higher investment costs [48], which affects the economic feasibility of a project.
3.2. TEA Evaluation and Sensitivity Analysis
The TEA of a vinasse-fed AD plant used for the generation of electricity was performed, taking into account the reported correlation between the % VS and the biogas yield. As reported previously, lower concentrations of VS generate greater biogas potential. Therefore, diluted vinasse, with 6.9% of VS (w/w), was used to perform the simulations with SuperPro Designer®. In the model, the % VS was assumed as the reaction-limiting factor to propose the following stoichiometric equation for biogas production expressed in mass:
1 g VS + 0.19 g H2O → 0.64 g CO2 + 0.008 g H2S + 0.0009 g H2 + 0.46 g CH4 + 0.05 g N2 + 0.03 g sludge
The simulation was used to assess the main factors that influenced the economic performance of the process through a sensitivity analysis, and determine under which conditions this process was economically feasible.
Siddique and collaborators [49] indicated that an optimum flow rate during the AD process is a critical point for the design and management of an AD plant. The processing flow rate affected two important parameters: biogas and methane yield and energy assessment. Thus, the amount of produced biomethane has a strong impact on the energy balance and economic feasibility of an AD plant [50]. Other researchers have reported additional factors that affect the economic feasibility of implementing an AD plant, such as energy capacity and operating cost, which varies according to the country’s economic conditions [44,49,50,51].
The installed ethanol capacity in an annexed Colombian distillery ranges between 100,000 and 300,000 L/day, which corresponds to a vinasse production rate of 5–12.5 m3/h depending on the number of evaporation steps. Figure 3 shows the effect of the vinasse processing flow rate on the biogas generation flow and potential electric energy generation capacity of an annexed distillery in Colombia. The vinasse processing flow rate has a linear relationship with biogas flow and power generation, which indicates a direct association between biogas production and power generation. Higher vinasse processing flow rates allow for greater biogas production and, consequently, a higher power generation capacity. These findings support previously reported data [52,53]. Using the maximum vinasse generation capacity reported for each annexed distillery in Colombia, the largest can produce 12.5 m3/h, which, in turn, generates ~6000 m3 of biogas/h and 20.4 MW of electrical energy.
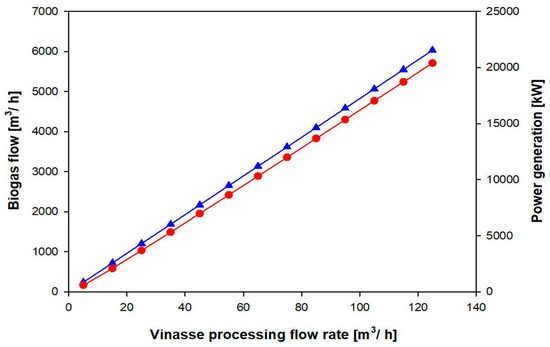
Figure 3.
Effect of the vinasse processing flow rate on biogas flow and electricity generation. Red circles: power generation; blue triangles: biogas flow.
To determine the energy-recovery capacity of a sugar mill depending on the vinasse processing flow rate, the energy yield of the process was plotted as a function of the inlet vinasse flow rate (Figure 4). At low vinasse processing flow rates, there is a sharp increase in energy yield that stabilizes at flow rates >20 m3/h. The results suggest that 3.4 kW/m3 of biogas will be the maximum electrical energy yield.
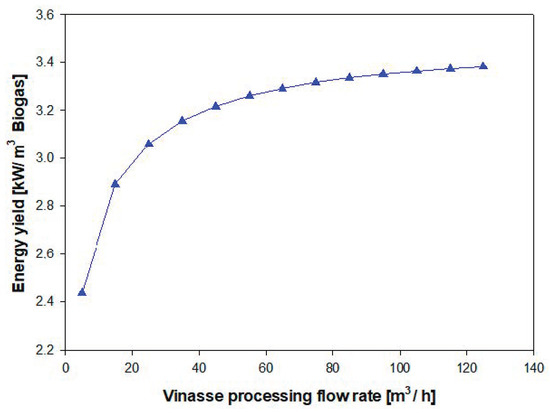
Figure 4.
Effect of the vinasse processing flow rate on the electrical energy yield of an AD plant.
Figure 5 demonstrates that CAPEX increased proportionally with the vinasse processing flow rate, while OPEX increased but not by the same proportion. According to the simulation, treating vinasse at a rate between 5 and 125 m3/h will generate between 0.59 and 20.4 MW of energy, which requires a CAPEX of 0.85–14.5 million USD and an annual OPEX of 1.47–5.66 million USD.
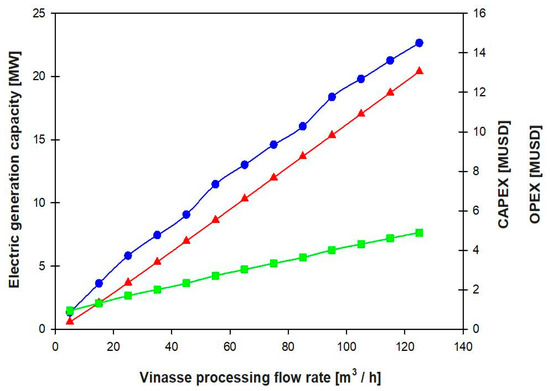
Figure 5.
Effect of vinasse processing flow rate on electrical generation capacity (capital expenditure (CAPEX) and operational expenditure (OPEX)). Blue circles: CAPEX; red triangles: electrical generation capacity; and green squares: OPEX.
The observed results align with previous studies carried out using Excel® and Aspen Plus®, where higher processing flow rates resulted in higher electrical generation capacity, with an equivalent increase in CAPEX but not in OPEX [24,52,54]. To understand the differential increases in OPEX and CAPEX, Labor and Laboratory/QC/QA expenses as functions of the vinasse processing flow rate are shown in Figure 6.
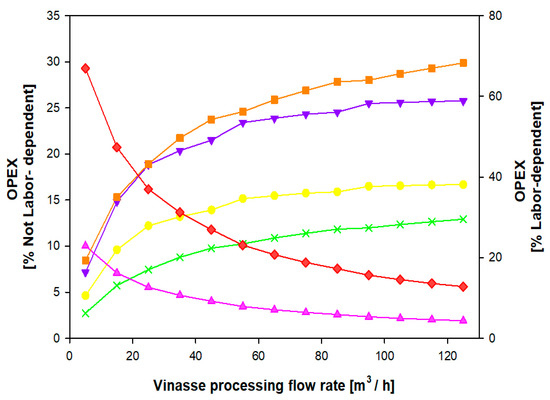
Figure 6.
OPEX breakdown as a function of the vinasse processing flow rate. Orange squares: utilities; purple inverted triangles: other facility-dependent; red diamonds: labor-dependent; yellow circles: depreciation; green crosses: raw materials; and pink triangles: laboratory/QC/QA.
Following previous studies carried out with Excel® and Aspen Plus®, the CAPEX and OPEX of an AD plant mainly depend on the technological approaches considered and the processing flow rate employed [24,55]. Our findings indicate that the vinasse processing flow rate is a critical factor that dictates the economic feasibility of a vinasse-fed AD plant for the generation of electrical energy from biogas. Additionally, they support the need to assess alternative uses for the biogas, as well as to incorporate additional unit operations associated with digestate utilization to improve the economics of vinasse-fed AD plants with low flow rates [56].
3.3. Economic Assessment
One advantage of SuperPro Designer® compared to Aspen Plus® and Excel® is its costing feature, which is useful for calculating equipment costs and plant-operating costs once the simulation is completed. This feature may be further adjusted to local prices if necessary. The estimation of equipment costs was performed based on the mass and energy balances generated by the simulation. According to the model, the total equipment costs for a vinasse-fed AD-plant (5000 m3) were 1,034,524.57 USD. It is worth highlighting that previous techno-economic analyses with Excel® and Aspen Plus® for sugarcane-based vinasse processing through AD did not report equipment cost estimations [54,57].
An additional advantage of SuperPro Designer® is its economic evaluator, which was specifically developed for bioprocesses. This tool is designed to determine the dynamic behavior of various economic parameters under different scenarios. This tool was employed to assess the impacts of the vinasse processing flow rate and the costs/revenues of the digestate on the feasibility of a vinasse-fed AD plant. The vinasse processing flow rate exerted a big impact on the CAPEX (Figure 5) and the fixed labor-dependent and laboratory/QA/QC-related costs (Figure 6), as previously shown. On the other hand, digestate, a mixture of microbial biomass and undigested material that is produced in large volumes after AD [58], considerably affects the economic feasibility of AD due to the potential costs of its disposal or treatment. However, it may be used for fertilization [59]. Thus, a range of values was used to represent the costs of disposal when negative and potential revenues when positive (Figure 7).
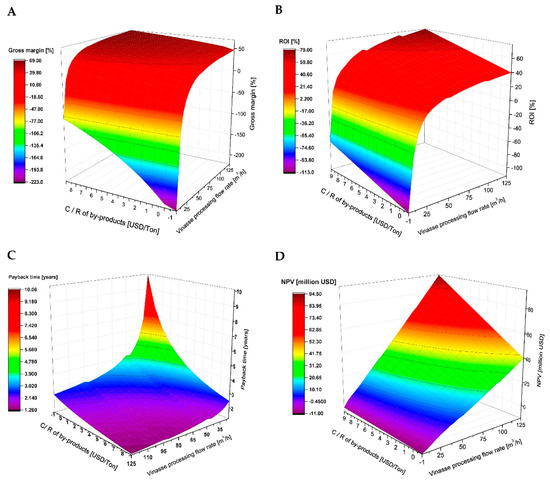
Figure 7.
Economic assessment for the implementation of a vinasse-fed AD plant. (A) Gross margin, (B) return on investment (ROI), (C) payback time, and (D) net present value (NPV).
The gross margin (Figure 7A), ROI (Figure 7B), payback time (Figure 7C), NPV (Figure 7D), and IRR (Figure 8) as functions of the vinasse processing flow rate and cost/revenue of the digestate were used to assess the feasibility of an AD plant fed with sugarcane-based vinasse for electrical energy generation. According to the gross margin indicator (Figure 7A), the process is feasible using a vinasse processing flow rate higher than 60 m3/h and a return of at least 2.2% for the digestate to achieve a margin between 50 and 85% (Figure 7A). High flow rates are also needed (80 to 125 m3/h) to achieve a reasonable payback time of 6–8 years (Figure 7C). By contrast, the ROI (Figure 7B), NPV (Figure 7D), and IRR (Figure 8) parameters suggest that feasibility is achieved at considerably lower flow rates (20, 17, and 25 m3/h, respectively) regardless of the cost of digestate disposal.
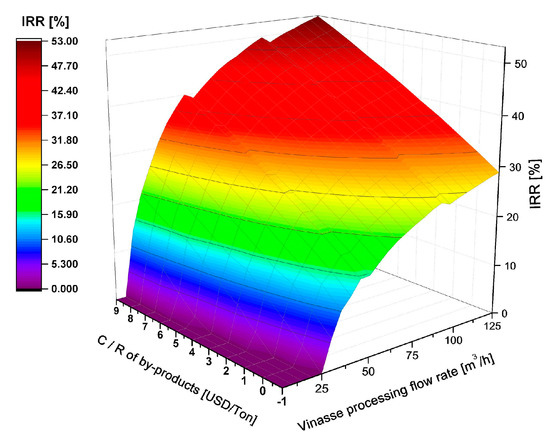
Figure 8.
Internal rate of return as a function of the vinasse processing flow rate and cost/return of the digestate for a vinasse-fed AD plant.
The economic assessment indicates that the financial feasibility of a vinasse-fed AD plant will largely depend on the vinasse processing capacity of the distillery. In countries such as Brazil, where the harvest period is ~8–10 months, the seasonal variability can have a large effect. In Colombia, the harvesting occurs throughout the year, which ensures a constant feedstock availability.
The geographic valley of the Cauca River has six annexed distilleries with installed ethanol capacities between 100,000 and 400,000 L/day, corresponding to vinasse production rates between 6 and 12.5 m3/h. Their corresponding vinasse flow rates are as follows: Mill I—6 m3/h; Mill II—12.5 m3/h; Mill III—10 m3/h; Mill IV—12.5 m3/h; Mill V—5 m3/h; and Mill VI—10 m3/h. According to these results, none of the distilleries generate enough vinasse to implement a feasible vinasse-fed AD plant for electrical energy generation. However, based on the distilleries’ geographical distribution (Figure 9), an alternative to increasing vinasse processing flow rates is to join vinasse streams between neighboring mills, such as Mills I–IV; this strategy could yield a processing flow rate of 41 m3/h. Improving the economic feasibility of a vinasse-fed AD plant while maintaining lower flow rates can also be achieved by the following strategies: increasing the C/N ratio of the substrate; increasing its biomethane potential by incorporating unit operations to valorize alternative waste streams, namely, the carbon dioxide present in the biogas, which reduces its calorific value (and through carbon-capture technologies, it is possible to exploit it or synthesize high-value compounds); or evaluating alternative uses for the biogas. However, geopolitical conditions must be taken into account, since the Pacific region of Colombia is not fully connected to the natural gas pipeline.
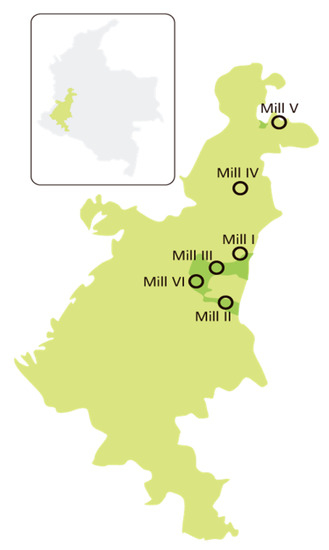
Figure 9.
Geographical distribution of annexed distilleries in the valley of the Cauca River.
In 2014, Moraes and collaborators [60] used Excel® to perform an economic assessment of autonomous and annexed plants in Brazil to evaluate the economic feasibility of electrical energy generation from sugarcane vinasse. They reported a NPV of 4,000,000 USD and an IRR of 12% for an annexed distillery with a vinasse-processing flow rate of 80 m3/h. By contrast, our results show that an annexed distillery with a vinasse-processing flow rate of 80 m3/h generating 3600 m3/h of biogas will have an NPV of ~10,000,000 USD and a 26.5% IRR. In terms of economic assessment, both studies indicate the profitability of a sugarcane-based AD-plant; however, a low IRR indicates higher investment cost. SuperPro Designer® projected a higher NPV and IRR, possibly due to the geographical differences between the countries, which directly affect the biochemical characteristics of the feedstock. Additionally, the robustness of the databases and the assumptions used for the analysis imbedded in SuperPro Designer®, for equipment sizing and costing selection, could explain the resulting differences.
The process simulation of sugarcane-based vinasse-fed AD plants using Aspen Plus® is still an open field. Lorenzo et al. (2019) [57] developed a process simulation considering an upflow anaerobic sludge blanket (UASB) model using sugarcane-based vinasse as feedstock. They employed stoichiometric reactions from previous reports using the MATLAB® software, and the reaction kinetics were calculated in FORTRAN. The above work is an example of the ASPEN Plus® requirements regarding prior established kinetic models and complementary analytical software, which limits its applications by non-experts.
In summary, SuperPro Designer® is a simple and easy-to-use software program used for large-scale feasibility evaluations of bioprocesses, and its built-in features make it an ideal tool for general use. The software decreases the computational time, because it does not require the integration of additional formulas, and enables the user to assess a larger number of scenarios.
4. Conclusions
SuperPro Designer® is a convenient tool for non-experts for evaluating the feasibility of bioprocesses such a vinasse-fed AD-plant. By using its built-in features to perform a TEA, it is possible to identify cost-sensible factors during the technological development and implementation stages. The above was supported by the results, showing that a vinasse-fed AD plant in Colombia is economically feasible when the processing flow rate is >25 m3/h, which corresponds with previous studies performed using ASPEN Plus® and Excel® [49,50,51,54,55,56,57]. Taking into account that the vinasse flow rates produced by Colombian distilleries are below the mentioned threshold, we proposed joining vinasse-waste streams to overcome the flow rate limitation. However, alternative biogas uses can be assessed—the incorporation of unit operations associated with the production of additional high-value products from non-valorized streams, such as carbon dioxide, or possibly increasing the biomethane potential via C/N balancing. Finally, we identified an inversely proportional relationship between the biomethane potential of sugarcane-based vinasse and its solid content. This effect may be due to the concentration of inhibitory compounds during the evaporation steps, which affects the economic feasibility of an AD plant. However, since there was no difference between the biomethane potential of vinasse at different distilleries, it is technically feasible to join vinasse streams in a single plant.
Author Contributions
Conceptualization, L.C., N.H.C.-O. and M.F.V.-T.; formal analysis, L.C., N.H.C.-O. and M.F.V.-T.; funding acquisition, N.H.C.-O. and M.F.V.-T.; methodology, L.C., F.R., C.A.P. and N.H.C.-O.; writing—original draft, L.C., N.H.C.-O. and M.F.V.-T.; writing—review and editing, L.C. and M.F.V.-T. All authors have read and agreed to the published version of the manuscript.
Funding
This work was funded by Universidad Icesi, grant number CA041360.
Conflicts of Interest
The authors declare no conflict of interest, and they are not in any way connected with SuperPro Designer® or Intelligen, Inc.
References
- Bausea, K.; Radimerskya, A.; Iwanickia, M.; Albersa, A. Feasibility Studies in the Product Development Process. Procedia CIRP 2014, 21, 473–478. [Google Scholar] [CrossRef]
- Tochampa, W.; Sirisansaneeyakul, A. A model of Xylitol Production by The Yeast Candida Mogii. Bioprocess Biosyst. Eng. 2005, 28, 175–183. [Google Scholar] [CrossRef] [PubMed]
- Viswanathan, M.B.; Raman, D.R.; Rosentrater, K.A.; Shanks, B.H. A Technoeconomic Platform for Early-Stage Process Design and Cost Estimation of Joint Fermentative‒Catalytic Bioprocessing. Processes 2020, 8, 229. [Google Scholar] [CrossRef]
- Alnur Auli, N.; Sakinah, M.; Mustafa Al Bakri, A.M.; Kamarudin, H.; Norazian, M.N. Simulation Of Xylitol Production: A Review. Aust. J. Basic Appl. Sci. 2013, 7, 366–372. [Google Scholar]
- Farid, S.S.; Washbrook, A. Modelling Biopharmaceutical Manufacture: Design and Implementation of SimBiopharma. Comput. Chem. Eng. 2007, 31, 1141–1158. [Google Scholar] [CrossRef]
- Verhoef, A.; Degreve, J. Simulation of a Hybrid Pervaporation–Distillation Process. Comput. Chem. Eng. 2008, 32, 1135–1146. [Google Scholar] [CrossRef]
- Pandu, G.; Kariwala, V. Plantwide Control: Recent Developments and Applications; Wiley: Hoboken, NJ, USA, 2012; pp. 1–494. [Google Scholar]
- Athimulam, A.; Kumaresan, S. Modelling and Optimization of Eurycoma Longifolia Water Extract Production. Food Bioprod. Process. 2006, 84, 139–149. [Google Scholar] [CrossRef]
- Ernst, S.; Garro, O.A. Process Simulation for Recombinant Protein Production: Cost Estimation and Sensitivity Analysis for Heparinase I Expressed in Escherichia coli. Biotechnol. Bioeng. 1997, 53, 575–582. [Google Scholar] [CrossRef]
- Humphrey, W. Systems of Systems: Scaling Up the Development Process (CMU/SEI-2006-TR-017) 2006. Retrieved June 10, 2020, from the Software Engineering Institute, Carnegie Mellon University Website. Available online: http://resources.sei.cmu.edu/library/asset-view.cfm?AssetID=8135 (accessed on 10 June 2020).
- Thien, Y.N. BioMASS v2.0: A New Tool For Bioprocess Simulation. Master’s Thesis, Biosystems Engineering, Clemson University, Clemson, SC, USA, 2011; pp. 1–19. [Google Scholar]
- Qureshi, N.; Saha, B.C. An Economic Evaluation of Biological Conversion of Wheat Straw to Butanol: A biofuel. Energy Convers. Manag. 2013, 65, 456–462. [Google Scholar] [CrossRef]
- Biwer, A.; Heinzel, E. Environmental assessment in early process development. J. Chem. Technol. Biotechnol. 2004, 79, 597–609. [Google Scholar] [CrossRef]
- Rouf, S.A.; Douglas, P.L.; Young, M.M. Computer Simulation for Large Scale Bioprocess Design. Biochem. Eng. J. 2001, 8, 229–234. [Google Scholar] [CrossRef]
- Samer, M. A software Program for Planning and Designing Biogas Plants. Trans. ASABE 2010, 53, 1277–1285. [Google Scholar] [CrossRef]
- De Clercq, D.; Jalota, D.; Shang, R.; Ni, K.; Zhang, Z.; Khan, A.; Wen, Z.; Caicedo, L.; Yuan, K. Machine learning powered software for accurate prediction of biogas production: A case study on industrial-scale Chinese production data. J. Clean. Prod. 2019, 218, 390–399. [Google Scholar] [CrossRef]
- Mabalane, P.N.; Oboirien, B.O.; Sadiku, E.R.; Masukume, M. A Techno-economic Analysis of Anaerobic Digestion and Gasifcation Hybrid System: Energy Recovery from Municipal Solid Waste in South Africa. Waste Biomass Valorization 2020. [Google Scholar] [CrossRef]
- Scotto di Perta, E.; Cervelli, E.; Pironti di Campagna, M.; Pindozzi, S. From biogas to biomethane: Techno-economic analysis of an anaerobic digestion power plant in a cattle/buffalo farm in central Italy. J. Agric. Eng. 2019, 50, 127–133. [Google Scholar] [CrossRef]
- Albrecht, F.G.; König, D.H.; Baucks, N.; Dietrich, R.U. A standardized methodology for the techno-economic evaluation of alternative fuels—A case study. Fuel 2017, 194, 511–526. [Google Scholar] [CrossRef]
- Akbulut, A. Techno-economic analysis of electricity and heat generation from farm-scale biogas plant: Çiçekdağı case study. Energy 2012, 44, 381–390. [Google Scholar] [CrossRef]
- Sanscartier, D.; MacLean, H.L.; Saville, B. Electricity Production from Anaerobic Digestion of Household Organic Waste in Ontario: Techno-Economic and GHG Emission Analyses. Environ. Sci. Technol. 2012, 46, 1233–1242. [Google Scholar] [CrossRef]
- Nogueira, C.E.C.; de Souza, S.N.M.; Micuanski, V.C.; Azevedo, R.L. Exploring possibilities of energy insertion from vinasse biogas in the energy matrix of Paraná State, Brazil. Renew. Sustain. Energy Rev. 2015, 48, 300–305. [Google Scholar] [CrossRef]
- Pazuch, F.A.; Nogueira, C.E.C.; Souza, S.N.M.; Micuanski, V.C.; Friedrich, L.; Lenz, A.M. Economic evaluation of the replacement of sugar cane bagasse by vinasse, as a source of energy in a power plant in the state of Paraná, Brazil. Renew. Sustain. Energy Rev. 2017, 76, 34–42. [Google Scholar] [CrossRef]
- Fuess, L.T.; Zaiat, M. Economics of anaerobic digestion for processing sugarcane vinasse: Applying sensitivity analysis to increase process profitability in diversified biogas applications. Process Saf. Environ. Prot. Biowaste Energy Recovery Environ. Remediat. 2018, 115, 27–37. [Google Scholar] [CrossRef]
- Asocaña, Fondo de Estabilización de Precios del Azúcar-FEPA. Balance Azucarero Colombiano Asocaña 2000–2019. Available online: https://www.asocana.org/modules/documentos/5528.aspx (accessed on 20 March 2020).
- Moraes, B.S.; Zaiat, M.; Bonomi, A. Anaerobic digestion of vinasse from sugarcane ethanol production in Brazil: Challenges and perspectives. Renew. Sustain. Energy Rev. 2015, 44, 888–903. [Google Scholar] [CrossRef]
- Rocha, M.H.; Lora, E.E.S.; Venturini, O.J. Life cycle analysis of different alternatives for the treatment and disposal of ethanol vinasse. Proc. Int. Soc. Sugar Cane Technol. 2007, 26, 1075–1084. [Google Scholar]
- Christofoletti, C.A.; Escher, J.P.; Correia, J.E.; Marinho, J.F.U.; Fontanetti, C.S. Sugarcane vinasse: Environmental implications of its use. Waste Manag. 2013, 33, 2752–2761. [Google Scholar] [CrossRef]
- Meyer, J.; Rein, P.; Turner, P.; Mathias, K.; Mc Gregor, C. Good Management Practices Manual for the Cane Sugar Industry (Final); PGBI Sugar and Bio Energy, PGBI House: Johannesburg, South Africa, 2011; pp. 1–696. [Google Scholar]
- Kowalska-wentel, M. Effect of enzymatic pretreatment on anaerobic co-digestion of sugar beet pulp silage and vinasse. Bioresour. Technol. 2015, 180, 274–280. [Google Scholar]
- Santos, R.F.; Borsoi, A.; Secco, D.; Melegari de Souza, S.N.; Constanzi, R.N. Brazil’s potential for generating electricity from biogas from stillage. In Proceedings of the World Renewable Energy Congress, Linköping, Sweden, 8–13 May 2011; pp. 425–432. [Google Scholar]
- Wilkie, A.C.; Riedesel, K.J.; Owens, J.M. Stillage characterization and anaerobic treatment of ethanol stillage from conventional and cellulosic feedstocks. Biomass Bioenergy 2000, 19, 63–102. [Google Scholar] [CrossRef]
- Ortegón, G.P.; Arboleda, F.M.; Candela, L.; Tamoh, K.; Valdes-Abellan, J. Vinasse Application to Sugar Cane Fields. Effect on the Unsaturated Zone and Groundwater at Valle Del Cauca (Colombia). Sci. Total Environ. 2016, 539, 410–419. [Google Scholar]
- Sowmeyan, R.; Swaminathan, G. Effluent treatment process in molasses-based distillery industries: A review. J. Hazard. Mater. 2008, 152, 453–462. [Google Scholar] [CrossRef]
- Parsaee, M.; Kiani Deh Kiani, M.; Karimi, K. A review of biogas production from sugarcane vinasse. Biomass Bioenergy 2019, 122, 117–125. [Google Scholar] [CrossRef]
- Đurđević, D.; Hulenić, I. Anaerobic Digestate Treatment Selection Model for Biogas Plant Costs and Emissions Reduction. Processes 2020, 8, 142. [Google Scholar] [CrossRef]
- Preciogas by Selectra. Price of kWh of Natural Gas in 2019. Available online: https://preciogas.com/faq/factor-conversion-gas-natural-kwh (accessed on 27 June 2020).
- Kayhanian, M.; Tchobanoglous, G. Computation of C/N ratios for various organic fractions. Biocycle 1992, 33, 58–60. [Google Scholar]
- Weinrich, S.; Schäfer, F.; Bochmann, G.; Liebetrau, J. Value of Batch Tests for Biogas Potential Analysis, Method Comparison and Challenges of Substrate and Efficiency Evaluation of Biogas Plants; Murphy, J.D., Ed.; IEA Bioenergy Task 37; IEA Bioenergy: Cork, Ireland, 2018; p. 10. ISBN 978-1-910154-49-6. [Google Scholar]
- Justesen, C.G.; Astals, S.; Mortensen, J.R.; Thorsen, R.; Koch, K.; Weinrich, S.; Triolo, J.M.; Hafner, S.D. Development and Validation of a Low-Cost Gas Density Method for Measuring Biochemical Methane Potential (BMP). Water 2019, 11, 2431. [Google Scholar] [CrossRef]
- Hafner, S.D.; Koch, K.; Carrere, H.; Astals, S.; Weinrich, S.; Renniut, C. Software for biogas research: Tools for measure and prediction of methane production. SoftwareX 2018, 7, 205–210. [Google Scholar] [CrossRef]
- Filer, J.; Ding, H.H.; Chang, S. Biochemical methane potential (BMP) Assay Method for Anaeronic Digestion Research. Water 2019, 11, 921. [Google Scholar] [CrossRef]
- Holliger, C.; Fruteau de Laclos, H.; Hack, G. Methane Production of Full-Scale Anaerobic Digestion Plants Calculated from Substrate’s Biomethane Potentials Compares Well with the One Measured On-Site. Front. Energy Res. 2017, 5, 12. [Google Scholar] [CrossRef]
- Roubík, H.; Mazancová, J.; Rydval, J.; Kvasnicka, R. Uncovering the dynamic complexity of the development of small-scale biogas technology through casual loops. Renew. Energy 2020, 149, 235–243. [Google Scholar] [CrossRef]
- Zamalloa, C.; Vulsteke, E.; Albrecht, J.; Verstraete, W. The techno-economic potential of renewable energy through the anaerobic digestion of microalgae. Bioresour. Technol. 2011, 102, 1149–1158. [Google Scholar] [CrossRef]
- Dave, A.; Huang, Y.; Rezvani, S.; Mcilveen-Wright, D.; Novaes, M.; Hewitt, N. Techno-economic assessment of biofuel development by anaerobic digestion of European marine cold-water seaweeds. Bioresour. Technol. 2013, 135, 120–127. [Google Scholar] [CrossRef]
- Budiyono; Syaichurrozi, I.; Sumardiono, S. Effect of Total Solid Content to Biogas Production Rate from Vinasse (RESEARCH NOTE). Int. J. Eng. 2014, 27, 177–184. [Google Scholar]
- Fuess, L.T.; Garcia, M.L. Anaerobic biodigestion for enhanced bioenergy generation in ethanol biorefineries: Understanding the potentials of vinasse as a biofuel. In Bioenergy Systems for the Future: Prospects for Biofuels and Biohydrogen; Woodhead Publishing: Sawston, Cambridge, UK, 2017; pp. 149–183. [Google Scholar]
- Siddique, M.N.I.; Sakinah, M.; Zularisam, A.W. Influence of flow rate variation on bio-energy generation during anaerobic co-digestion. J. Ind. Eng. Chem. 2015, 27, 44–49. [Google Scholar] [CrossRef][Green Version]
- Caposciutii, G.; Baccioli, A.; Ferrari, L.; Desideri, U. Biogas from anerobic digestion: Power generation or biomethane production? Energies 2020, 13, 743. [Google Scholar] [CrossRef]
- Bernal, A.P.; dos Santos, I.F.S.; Moni Silva, A.P.; Barros, R.M.; Ribeiro, E.M. Vinasse biogas for energy generation in Brazil: An assessment of economic feasibility, energy potential and avoided CO2 emissions. J. Clean. Prod. 2017, 151, 260–271. [Google Scholar] [CrossRef]
- Willeghems, G.; Buysse, J. Changing old habits: The case of feeding patterns in anaerobic digesters. Renew. Energy 2016, 92, 212–221. [Google Scholar] [CrossRef]
- Salomon, K.R.; Lora, E.E.S.; Rocha, M.H.; del Olmo, O.A. Cost Calculations for 751 biogas from vinasse biodigestion and its energy utilization. Sugar Ind. 2011, 136, 217–223. [Google Scholar] [CrossRef]
- Rajendran, K. Industrial Bioprocess Developments for Biogas and Ethanol Production. Ph.D. Thesis, University of Borås, Borås, Sweden, 2015. Available online: http://urn.kb.se/resolve?urn=urn:nbn:se:hb:diva-668 (accessed on 15 April 2020).
- Nadaleti, W.C.; Lourenco, V.A.; Filho, P.B.; Santos, G.B.; Przybyla, G. National potential production of methane and electrical energy from sugarcane vinasse in Brazil: A thermo-economic analysis. J. Environ. Chem. Eng. 2019, 8, 103422. [Google Scholar] [CrossRef]
- Junqueira, T.L.; Moraes, B.; Gouveia, V.L.R.; Chagas, M.F.; Morais, E.R.; Watanabe, M.D.B.; Zaiat, M.; Bonomi, A. Use of VSB to plan research programs and public policies. In Virtual Biorefinery: An Optimization Strategy for Renewable Carbon Valorization; Bonomi, A., Cavalett, O., Cunha, M.P., Lima, M.A.P., Eds.; Springer: Berlin, Germany, 2016; pp. 257–282. [Google Scholar]
- Lorenzo-Llanes, J.; Pagés-Díaz, J.; Kalogirou, E.; Contino, F. Development and application in Aspen Plus of a process simulation model for the anaerobic digestion of vinasses in UASB reactors: Hydrodynamics and biochemical reactions. J. Environ. Chem. Eng. 2019, 8, 103540. [Google Scholar] [CrossRef]
- Monlau, F.; Sambusiti, C.; Ficara, E.; Aboulkas, A.; Barakat, A.; Carrère, H. New opportunities for agricultural digestate valorization: Current situation and perspectives. Energy Environ. Sci. 2015, 8, 2600–2621. [Google Scholar] [CrossRef]
- Fuchs, W.; Drosg, B. Assessment of the state of the art of technologies for the processing of digestate residue from anaerobic digesters. Water Sci. Technol. 2013, 67, 1984–1993. [Google Scholar] [CrossRef] [PubMed]
- Moraes, B.S.; Junqueira, T.L.; Pavanello, L.G.; Cavalett, O.; Mantelatto, P.E.; Bonomi, A.; Zaiat, M. Anaerobic digestion of vinasse from sugarcane biorefineries in Brazil from energy, environment, and economic perspectives: Profit or expense? Appl. Energy 2014, 113, 825–835. [Google Scholar] [CrossRef]


© 2020 by the authors. Licensee MDPI, Basel, Switzerland. This article is an open access article distributed under the terms and conditions of the Creative Commons Attribution (CC BY) license (http://creativecommons.org/licenses/by/4.0/).