Article

High-Throughput Raman Spectroscopy Combined with Innovate Data Analysis Workflow to Enhance Biopharmaceutical Process Development

1
The Advanced Centre of Biochemical Engineering, Department of Biochemical Engineering, University College London, Gordon Street, London WC1E 6BT, UK
2
Cell Culture & Fermentation Science, Biopharmaceuticals Development, R&D, AstraZeneca, Cambridge CB21 6GH, UK
3
Purification Process Sciences, Biopharmaceuticals Development, R&D, AstraZeneca, Cambridge CB21 6GH, UK
*
Authors to whom correspondence should be addressed.
Both authors contributed equally to this work.
Processes 2020, 8(9), 1179; https://doi.org/10.3390/pr8091179
Submission received: 11 August 2020 / Revised: 7 September 2020 / Accepted: 10 September 2020 / Published: 17 September 2020
(This article belongs to the Special Issue Measurement Technologies for up- and Downstream Bioprocessing)

Abstract

:
Raman spectroscopy has the potential to revolutionise many aspects of biopharmaceutical process development. The widespread adoption of this promising technology has been hindered by the high cost associated with individual probes and the challenge of measuring low sample volumes. To address these issues, this paper investigates the potential of an emerging new high-throughput (HT) Raman spectroscopy microscope combined with a novel data analysis workflow to replace off-line analytics for upstream and downstream operations. On the upstream front, the case study involved the at-line monitoring of an HT micro-bioreactor system cultivating two mammalian cell cultures expressing two different therapeutic proteins. The spectra generated were analysed using a partial least squares (PLS) model. This enabled the successful prediction of the glucose, lactate, antibody, and viable cell density concentrations directly from the Raman spectra without reliance on multiple off-line analytical devices and using only a single low-volume sample (50–300 μL). However, upon the subsequent investigation of these models, only the glucose and lactate models appeared to be robust based upon their model coefficients containing the expected Raman vibrational signatures. On the downstream front, the HT Raman device was incorporated into the development of a cation exchange chromatography step for an Fc-fusion protein to compare different elution conditions. PLS models were derived from the spectra and were found to predict accurately monomer purity and concentration. The low molecular weight (LMW) and high molecular weight (HMW) species concentrations were found to be too low to be predicted accurately by the Raman device. However, the method enabled the classification of samples based on protein concentration and monomer purity, allowing a prioritisation and reduction in samples analysed using A280 UV absorbance and high-performance liquid chromatography (HPLC). The flexibility and highly configurable nature of this HT Raman spectroscopy microscope makes it an ideal tool for bioprocess research and development, and is a cost-effective solution based on its ability to support a large range of unit operations in both upstream and downstream process operations.

1. Introduction

Process analytical technology (PAT) has been a major talking point within the biopharmaceutical sector since the release of the FDA’s guidance for industry on PAT in 2004 [1]. The guidance encouraged a shift away from a fixed process that could result in product quality deviations towards an adaptive process ensuring a consistent product quality through sensors supporting advanced control strategies. Although there has been significant progress made towards achieving this goal, commercial manufacturing still heavily relies upon laborious off-line analytics and rudimentary control strategies. A major issue is the disconnect between early-stage research and development (R&D) activities and late-stage commercial manufacturing operations within the therapeutic drug lifecycle. These operations differ widely in terms of scale, where R&D operations utilise small volumes in the range of µL to L and commercial manufacturing processes operate with volumes in the range of 500 to 20,000 L. This large-scale difference can limit the universal application of a proposed PAT technology in the early stages of the drug development pipeline, therefore reducing the adoption of these core technologies within late-stage process development and commercialisation. To help bridge this gap, this paper focuses on the application of multivariate data analysis (MVDA) to better leverage at-line spectral measurements generated by a novel Raman spectroscopy microscope and utilise this information to support research and development (R&D) activities within the biopharmaceutical sector.

1.1. PAT for Upstream Processing

1.1.1. USP Monitoring and Analytics

Therapeutic proteins are highly complex and fragile molecules, and any upstream process deviations can lead to changes in the physiochemical, biological, and immunogenic properties of the molecule [2]. Therefore, controlling the bioreactor micro-environment is of paramount importance to ensure the product heterogeneity remains within a predefined specification defined by commercial good manufacturing practice (GMP) operations. To support this objective, the bioreactor is monitored and controlled through three classes of measurements, defined as on-line/in-line, at-line, or off-line [3]. The physical environment within the bioreactor, which includes the pH, temperature, and dissolved oxygen, utilises accurate and well-established on-line measurements with minimum time delays, enabling the real-time control of these variables. At-line and off-line monitoring involves removing a physical sample from the bioreactor for measurement in a separate analyser, enabling the monitoring of the chemical and biochemical environment. At-line measurements infer the close proximity of the analyser to the bioreactor, resulting in a shorter delay in the measurement availability, ranging from minutes to hours, whereas off-line measurements involve longer delay times of up to a day or even a week, depending on the analyser and delay before processing the sample. The traditional monitoring of upstream processing (USP) activities requires three different analysers: The first is an at-line biochemical analyser that measures the daily metabolite concentrations, including glucose and lactate, and typically takes between 5 and 10 min per sample. The second is an at-line cell counter that measures the cell densities and viabilities every 1 or 2 days with an analysis time of 5–10 min per sample. The third analyser is an off-line protein A HPLC column that measures the protein concentration and product quality; this is the slowest analytical device, as the sample needs to be purified before loading onto the column, and these measurements are typically only available after the experiment is complete. The manual sampling procedure and slow response time of these analysers limit the ability of these measurements to be used for control strategies. The additional drawback of these traditional methods is that they are destructive and therefore require separate samples for each analyser.
A recent report targeting the biopharmaceutical industry has identified and prioritised the top bioreactor variables requiring investment in at-line/in-line monitoring technologies to facilitate effective in-process control strategies [4]. This priority list includes the cell viability, viable cell density (VCD), glucose concentration, amino acids, and product concentration, defined as the bioreactor’s critical process parameters (CPPs), in addition to the glycosylation profile and charge profile, defined as the critical quality attributes (CQAs). These variables are all currently measured by slow and laborious off-line analytical analysers. PAT aims to change the reliance of biopharmaceutical companies on these slow off-line analytical measurements.

1.1.2. PAT within USP Mammalian Cell Cultures

PAT ultimately aims to integrate aspects of chemical, physical, microbiological, mathematical, and risk analyses to ensure robust biopharmaceutical operation [5]. There are various on-line and in-line PAT technologies suitable for USP mammalian cell culture monitoring. Capacitance sensors have gained popularity recently and provide robust measurements of viable cell density. These probes measure the radio frequency impedance in the cell broth and can distinguish between live and dead cells based on the assumption of living cells having intact spherical cell walls. Konakovsky et al. demonstrated the ability of capacitance probes to accurately predict VCD for mammalian cell cultures using a robust partial least squares (PLS) model that could be transferred between clones and across scales [6]. The majority of other PATs are spectroscopic, and are advantageous due to their ability to measure multiple components within the bioreactor. Examples include infrared spectroscopy, which measures reflectance, transflectance, and transmission events during near-infrared (NIR) or mid-infrared (MIR) irradiation. NIR was demonstrated by Hakemeyer et al. to predict numerous mammalian cell culture variables, including the cell viability, product concentration, glucose, and lactate, with the predictions validated across multiple scales, ranging from 2.5 to 1000 L [7]. Additionally, Sandor et al. compared the ability of NIR and MIR for mammalian cell monitoring and concluded that MIR has a higher accuracy for individual analyte concentrations, such as glucose and lactate, but recommended NIR as a better tool for the on-line monitoring of mammalian cell systems based on its ability to measure cell densities through light scattering effects, which is not possible with MIR excitation [8]. Ultraviolet and visible spectroscopy is another tool and one of the oldest forms of spectroscopy based upon the Beer–Lambert law. However, this technology has limited demonstrations within USP which have primarily focused on predicting the total cell density, as shown by Ude et al. [9]. Fluorescence spectroscopy is another valuable tool that takes advantage of the fluorescence nature of many biological components excited by visible or UV light. Typically, within mammalian cell cultures, 2D fluorescence spectroscopy is employed. Ohadi et al. demonstrated the ability of this technique to predict numerous variables, including the product concentration and glucose, and also to distinguish between living and dead cells, therefore making it an attractive tool for the in situ monitoring of mammalian cell cultures [10]. Another major advantage of this technology is the ability to exploit the auto-fluorescence nature of various variables, such as amino acids, vitamins, and proteins, including selected molecules or targets tagged using fluorescence markers. Calvet et al. used a type of fluorescence spectroscopy called Excitation Emission Matrix spectroscopy to generate a three-dimensional contour plot of the excitation wavelength vs. emission wavelength vs. fluorescence. The method generates accurate fingerprints for multicomponent systems and was demonstrated by Calvet et al. to identify the composition changes of tryptophan and tyrosine in a complex media applicable to industrial mammalian cell cultures [11]. The primary benefit of these spectroscopic tools is that they are non-destructive, non-invasive, and highly informative, making them highly suitable for mammalian cell culture monitoring.

1.1.3. Applications of Raman Spectroscopy in USP

In comparison to other spectroscopic methods, Raman spectroscopy has gained attention in recent years due to its suitability for the analysis of aqueous samples due to its low water interference and high specificity. Raman spectroscopy excites the sample using a monochromatic light source, causing small vibrational frequency shifts in the sample. The inelastic scattering of this light source generates Raman spectra containing quantitative and qualitative information, including the composition, chemical environment, and structural information related to the sample. The major challenge with Raman spectroscopy is the low signal to noise ratio due to the weak Raman scattering signals compared to the incident wavelength. These weak signals can be corrupted by strong fluorescence signals associated with the analysis of biological samples [12]. Alternative methods such as Surface Enhanced Raman Spectroscopy (SERS) have been developed to overcome these issues. Different types of Raman Spectroscopy, including Resonance Raman Spectroscopy, Raman Optical Activity, and surface-enhanced Raman spectroscopy (SERS), as well as their applications, are extensively described in a review by Buckley and Ryder [13].
Within USP, the biopharmaceutical industry has focused on Raman spectroscopy as one of the leading PAT technologies to monitor fermentation systems cultivating different expression systems, such as bacterial [14], fungal [12], and mammalian cell culture systems, including NS0 and HEK293 cell lines [15,16]. However, the majority of Raman spectroscopy monitoring operations focus on Chinese hamster ovary (CHO) mammalian cell lines, and have demonstrated the ability of this technology to predict the previously prioritised CPPs of glucose, lactate, VCD, and product concentration [15,17,18]. The proven ability to monitor these variables has led to the development of adaptive control strategies, as demonstrated by Craven et al., who applied a nonlinear model predictive controller to maintain the glucose concentration of a mammalian cell culture at a fixed set-point [19]. Additional control demonstrations include the application of a closed-loop control strategy using in-line Raman spectroscopy to minimise lactate accumulation through glucose feed rate additions, which resulted in the additional benefit of increasing the product concentration by approximately 85% [15]. More recently, Raman spectroscopy has shown promise as a replacement tool for the pH control of mammalian cell cultures [20]. However, the feasibility of this is questionable, given the relatively long acquisition time of each Raman spectra, which was between 16 and 20 min, in comparison to traditional pH probes with a response time of seconds. Raman spectroscopy has also been used to monitor the glycosylation patterns of a monoclonal antibody, which, as previously discussed, is a high-priority CQA. Li at al. utilised Raman spectroscopy for the real-time monitoring of a monoclonal antibody, and were able to distinguish between glycosylated and non-glycosylated molecules [21]. The ability to monitor product quality in real-time opens up significant opportunities for USP optimisation and advanced feedback control solutions.

1.2. PAT for Downstream Processing (DSP)

1.2.1. DSP Monitoring and Analytics of Mammalian Therapeutic Products

Typical PAT for downstream processing predominantly includes various sensors for the single-variable monitoring of CPPs. These include pH and conductivity probes, pressure and flow rate sensors, and UV spectroscopic measurements and other sensors, which are analysed through means of univariate analysis and/or operator knowledge. Additional information, especially regarding the CQAs of the product, is obtained through off-line analysis, which allows the determination of process and product-related quality attributes. Whereas univariate monitoring is suitable for the monitoring of process variables, it rarely carries enough information to be able to measure CQAs such as product multimers; product charge variants; host cell-related impurities, such as host cell proteins (HCPs), DNA, and lipids, in addition to impurities such as resin leachables. CQAs are monitored using univariate off-line/at-line analytical techniques, with efforts being made to enable online implementation.
Multiple-antibody CQAs, such as the high molecular weight (HMW) and low molecular weight (LMW) species content, charge, and glycosylation variants, are most commonly performed utilising at-line/off-line HPLC utilising various column chemistries, including size-exclusion (SE-HPLC) and ion-exchange (IEX-HPLC) liquid chromatography. In SE-HPLC, different-sized product species are separated based on their differential retention time, and content percentages are calculated as the area under curve (AUC) for peaks corresponding to the UV absorption signal of the elution product [22]. As standard SE-HPLC has long run times (commonly 20 min per sample), efforts have been made to increase the speed of analysis and implement SE-HPLC-based methods on-line [23]. Decreasing the time needed for sample analysis to less than 5 min was made possible by utilising ultra-high-performance liquid chromatography (UHPLC) with sub-2µm particles [24,25], and these approaches were further developed by coupling to mass spectroscopy [26]. Alternative approaches to UHPLC were also described, such as membrane chromatography, with an analysis time as low as 1.5 min [27]. The real-time analysis of aggregates and charge variants during cation exchange (CEX) chromatography using HPLC has been described by Tiwari et al. [28]. Patel et al. describes the use of on-line UHPLC for the detection of charge variants in continuous processes, which can be adapted for aggregate analysis [29]. Although the feasibility of these approaches has been demonstrated, on-line HPLC/UHPLC has not yet been widely adopted.
Another important set of antibody product CQAs are host-related impurities, such as host cell proteins (HCPs), DNA, and lipids; and process-related impurities, such as free protein A ligands. HCPs and protein A ligands are typically detected through various immunological assays, including traditional ELISA and high-throughput microfluidic assays. The processing time can be decreased by moving from a traditional ELISA to an automated ELISA using liquid-handling systems and automated microfluidic systems [30]; these still do not allow real-time analysis, as the time needed to run these assays is in the order of hours. Efforts have been made to develop immunological methods capable of on-line measurements utilising a flow cell, although the analysis time of above 30 min per sample would not suit the current downstream requirements [31]. As the system described in Kumar et al. was developed for upstream applications with lower requirements for time of analysis, additional changes to the systems, such as parallel flow cells, could potentially be made to enable Downstream Processing (DSP) application.
Although there has been progress in adapting traditional at-line methods to allow real-time control, most methods still suffer from long run times. In order to expand process control and enable the real-time monitoring of CQAs, multivariate approaches and PAT are necessary.

1.2.2. Applications of PAT in DSP

Various spectroscopic methods, including infra-red (IR), mid-IR (MIR), Raman, Fourier-transform IR, fluorescence, and UV spectroscopy, have been applied to downstream processing. As described extensively in a review by Rudt. et al. [32], and more recently in Rolinger et al. [33], each of these spectroscopic techniques has its own set of advantages and applications.
Examples of spectroscopic methods applied to DSP monitoring include the use of UV-spectroscopy with PLS modelling to automatically control the loading phase of protein A chromatography by monitoring the concentration of the monoclonal antibody (mAb) product in the load [34]. UV spectroscopy has been also shown to monitor mAb aggregate and monomer concentrations [35], although during the investigated runs the monomer and aggregate peaks showed a good separation, which might not always be the case and could decrease the otherwise high sensitivity of predictions. These studies benefited from the utilisation of variable pathlength spectroscopym enabling accurate in-line measurements even at high concentrations. The same device was recently applied to the on-line monitoring of ultrafiltration/diafiltration (UF/DF) as part of a multi-sensor PAT capable of monitoring concentration in addition to the apparent molecular weight using dynamic light scattering (DLS) to monitor changes in aggregation during the process [36].
Other spectroscopic methods have been described in relation to DSP, such as mid (MIR) and near (NIR) infrared spectroscopy. NIR was used to determine mAb concentration in real-time, enabling the dynamic loading of protein A chromatography [37]. Capito et al. used MIR to monitor product concentration, aggregate, and HCP content, although this was developed as an at-line method, as the samples were processed (dried) prior to measurements [38], limiting the use of the tool for on-line monitoring. Additionally, there have been attempts to overcome the limitations of individual spectral techniques by integrating multiple different inputs. In a study by Walch et al., standard detectors (UV, pH, conductivity) were implemented alongside additional techniques including fluorescence spectroscopy, MIR, light scattering, and refractive index measurement to monitor the protein A chromatography. These inputs were then analysed through PLS regression, producing predictive models for mAb concentration, monomer purity, aggregate content, and host related impurities (HCPs, DNA). This has resulted in accurate predictions for titre and monomer purity, but less so for HCPs, DNA, and % aggregate, especially when the sample matrix was changed [39].

1.2.3. Applications of Raman Spectroscopy in DSP

The applications of Raman spectroscopy in DSP include the measurement of product concentration, product aggregation, glycosylation, and membrane fouling. Predicting the product concentration of mAb was first shown by Andre et al. using an immersion probe [40], and further expanded by Feidl et al. through the development of a Raman flow cell [41,42]. Determining the titre is especially relevant for continuous perfusion processes, as it allows the dynamic loading of subsequent capture steps, as demonstrated in [43]. However, the titre determination from harvest can arguably be achieved by the use of delta UV spectroscopy comparing the A280 absorbance of the feed and eluate [44], which might be easier to implement as it does not require MVDA modelling. Therefore, if Raman spectroscopy is to be widely adopted in DSP, it must provide additional information.
There are studies demonstrating the ability of Raman spectroscopy to distinguish between samples with a high content of aggregate mAb species. Typically, these studies are performed at high mAb concentrations and/or high aggregate contents for the purpose of proof-of-concept studies, in addition to studies of aggregation in the formulated drug products. Zhou et al. monitored the thermally induced aggregation of intravenous IgG (IVIG) at high concentrations (51 mg/mL), describing the various spectral features present upon aggregation, in particular shift in the tyrosine peak at 830 and 850 cm−1 and the tryptophan peak at 1550 cm−1 for the IVIG, using Raman spectroscopy coupled with DLS [45]. Thermally induced aggregation was described in another study, where five antibodies with various propensities to aggregate were analysed using the perturbation-correlation moving windows method, visualising changes in the spectra during heating. By studying multiple different mAbs, differences were observed in the aggregation mechanism and associated spectral features [46], which might potentially make it difficult to develop models that could be utilised across multiple antibody formats. The presence of subtle differences in the sequence and structure of mAbs resulting in significantly different spectra is further supported by a study using SERS for the label-free identification of different antibody products by PLS-DA [47]. Although not explicitly described in the study, the described spectral differences might not only stem from the varying structural features, but also from the composition of the formulation buffer, product concentration, etc., for which the study did not adjust. In order to utilise Raman spectroscopy for aggregate analysis, quantitative predictive models are needed. Initial steps towards such models are described by Zhan et al., where mixtures of HMW and monomer were used to generate a model, which was then validated with independent samples generated through incubation at 40 °C. The model was able to predict the validation samples with a root mean square error of prediction (RMSEP) of 1.8% [48]. To monitor HMW and LMW species during chromatography runs, the methods need to be sensitive enough to allow detection at relevant concentrations (<10 mg/mL) and low aggregate contents (<10%). In all the above-mentioned studies, the samples typically had either high concentrations and/or high aggregate contents, which might not make these models suitable for the monitoring of standard preparative chromatography. Furthermore, the models need to be robust enough to deal with the changing background of co-eluting impurities and changes in buffer composition, which is common in gradient elution and is yet to be described.
Other CQAs might also have a potential to be monitored by Raman spectroscopy. Spectral differences in antibody glycosylation have been described in simple systems (glycosylated vs. non glycosylated proteins) [49,50,51], suggesting potential for elucidating more subtle differences in glycosylation that are relevant to bioprocessing. Another interesting area that could be investigated using Raman spectroscopy is the detection of HCPs, for which there are currently no published studies. Early efforts have been made using FT-IR by Capito et al. with limited sensitivity [52], which does not allow for widespread use. Overall, detecting HCPs might require more complex approaches, such as Raman labels, since HCPs are a structurally diverse group of proteins and therefore lack a distinct Raman signature.
Raman spectroscopy can also be utilised in process monitoring. Virtanen et al. describes using Raman spectroscopy in membrane fouling monitoring, where an immersion probe was placed into a cross-flow filtration unit, and fouling over time by vanillin, a model organic foulant, was monitored using PCA [53]. The applicability of this approach to DSP needs to be evaluated separately using relevant molecules, as potential issues might include the weaker signal of proteins compared to small organic molecules, as well as the more complex background matrix.
Overall, the application of Raman spectroscopy to DSP is a relatively young field and is expected to be further advanced in the future, as innovations in instrumentation as well as advanced techniques such as SERS become available and widely implemented.

1.3. High-Throughput Raman Spectroscopy and Its Advantages for Bioprocess Development

The acquisition set-up and type of system utilised in Raman spectroscopy typically depends on the application and on whether it requires at-line or in-line/on-line measurement. Common set-ups include immersion probes, flow cells, single cuvette systems, microscope slides, and high-throughput systems. Here, we present a high-throughput Raman spectroscopy microscope based on standard 96-well plates, which allows combined use for both upstream and downstream development.
Raman spectroscopy in USP is commonly based on an optic fibre immersion probe for each bioreactor, although multiple probes can be connected to a single Raman spectrometer. Alternatively, HT scale-down models such as ambrTM 15 (Sartorius Stedim, Göttingen, Germany) with at-line (Rowland-Jones and Jaques 2019) or integrated Raman measurement can be utilised for model building, although the latter has only been introduced recently. These systems work well for upstream applications, but might lack versatility to allow their use in other areas of bioprocess development.
An alternative approach is the use of a high-throughput Raman device which is suitable for model generation for both upstream and downstream applications. The HT Raman devices described in the literature include commercial devices such as the RamanRxn1™ High Throughput Screener (HTS) (Kaiser Optical Systems, Ann Arbor, MI, USA) [54], the InVia confocal microscope (Renishaw, Wotton-under-Edge, UK) presented in this work, the Lab Ram HR Evolution confocal microscope (Horiba Jobin Yvon, Kyoto, Japan) [55], and custom-built devices assembled using parts from various manufacturers [56,57]. Data acquisition is performed using well plates, typically 96-well plates, however settings can be adjusted to allow acquisition for other high-throughput labware or bespoke applications. Automatic plate mapping allows autonomous operation, allowing the screening of a large number of samples.
Whereas using HT Raman is more laborious when coupled with standard bioreactors requiring manual sampling, it is highly suitable for experiments using scale-down micro-bioreactors, where sampling is typically automated. A major advantage of these systems is the small sample requirement equal to 50–100 μL that is necessary for a measurement enabling the primary CPPs and CQAs to be predicted. This reduces the reliance on multiple analysers, thus reducing the capital and operational costs while providing near real-time information on difficult-to-monitor variables such as product concentration. Similarly, HT Raman is also suitable for model building in DSP. Samples can be generated through elution fractionation during preparative chromatography, where fractionating into a standardised labware minimises the number of manual steps.
The research outlined in this paper investigates the predictive capabilities of an HT Raman microscope combined with advanced data analytics to support both USP and DSP research and development operations. The paper demonstrates the ability of this technology to monitor the CPPs within an HT microbioreactor system in addition to monitoring monomer and product concentration within the development of a CEX chromatography step. At the core of these activities is the application of MVDA models to convert these multiple-dimensional spectral data sets into quantitative information necessary for monitoring. This involved negating the influence of corrupting fluorescence through baseline and scattering correction algorithms, in addition to the evaluation of the models’ coefficients, enabling more robustness in predictive models. In summary, this technology was found to be highly versatile and applicable across a wide range of unit operations in bioprocess development, provided the correct MVDA models are implemented.

2. Materials and Methods

2.1. Product Materials

Three different molecules were used in this study; in the USP experiments, cell line A produced an antibody-peptide fusion protein, and cell line B produced a modified IgG1 molecule. In the DSP study, an Fc-fusion protein was investigated. All the molecules utilised in this work were developed internally and provided by AstraZeneca, Cambridge, UK.

2.2. Cell Line and Cell Culture Propagation

Cell line A and cell line B in the USP work, and the cell line utilised in the DSP work, used a Chinese hamster ovary (CHO) host expressing high levels of therapeutic protein. These cell lines were provided by AstraZeneca and are proprietary and commercial products. No human cells were involved in this work. The cell lines were cultivated in chemically defined CHO media, maintained at 37 °C under 5% carbon dioxide, shaken at a constant rpm, and passaged 2–3 times per week for propagation and scale-up for inoculation.

2.3. Bioreactor Systems and Cell Culture Process

Two cell lines were cultivated in an advanced micro-bioreactor (ambrTM 15) system (Sartorius Stedim) with 24 single vessels split into two separate culture stations, where each vessel was operated with a 11–15 mL working volume. Cell line A was cultivated in vessels 1–12, and cell line B was cultivated in vessels 13–24. The experimental set-up investigated the impact of both different dissolved oxygen (DO2) set-points in addition to DO2 fluctuations on both cellular growth and protein production. The DO2 set-point was controlled to 40% and was fluctuated every 15 min to either 10% or 20% by purging with nitrogen. For cell line A, vessels 1 and 2 were maintained at a DO2 set-point of 40%, vessels 3 and 9 were controlled to 10%, and vessels 3 and 10 were controlled to 20%. Vessels 5 and 11 were fluctuated between 40–10%, and vessels 6, 7, 11, and 12 were fluctuated between 40% and 20%. Cell line B followed the same experimental set-up as cell line A for vessels 13–24. The temperature and pH of all the vessels was controlled to 35.5 °C and 7, respectively, and the agitation rate was adjusted to ensure that the DO2 concentration set-points were maintained. The feeding strategy involved five equally spaced additions of the feed after the initial feed day indicated. The initial seeding density was <10 × 105 cells mL−1. The culture pH was controlled to 7 through the addition of sodium carbonate and sparging with CO2 gas, with its control strategy implementing a pH dead-band equal to 0.1. Antifoam volumes of 20 μL were added as required. Daily at-line samples were analysed for the glucose and lactate concentrations using the 2950D Biochemistry Analyser (YSI, Yellow Springs, OH, USA) and every second day for the viable cell density (VCD) and viability using the Vi-Cell Automated cell viability analyser (Beckman Coulter, Brea, CA, USA).

2.4. Titre Analysis

Volumetric antibody-peptide fusion titres in cell culture supernatants were quantified by protein A affinity chromatography using a protein A ImmunoDetection sensor cartridge (Applied Biosystems, Warrington, UK) coupled with an Agilent 1200 series HPLC (Agilent, Berkshire, UK). Peak areas relative to a reference standard calibration curve were used to calculate the titres. These samples were measured on days 2, 4, 6, 8, and 10 for the ambrTM 15 system.

2.5. CEX Sample Generation

The Fc-fusion protein used in the DSP part of this study was generated using a CHO host provided by AstraZeneca, UK, Cambridge. Chromatographic experiments were carried out using an ÄKTA Avant controlled with Unicorn Software version 7.1 (Cytiva, Marlborough, MA, USA). The protein feed was purified using MabSelect Sure Protein A chromatography resin (Cytiva, Marlborough, MA, USA), subjected to a low-pH treatment, and purified further using CaptoAdhere resins (Cytiva, Marlborough, MA, USA) in flow-through mode. Screening experiments were conducted to determine the optimal conditions to purify fusion proteins on Poros 50 HS resin (Thermo Fisher Scientific, Bedford, MA) using varying conditions of the elution buffer. The elution was performed either in gradient mode from 0–0.5 M of NaCl in 20 mM of sodium citrate or step mode using 20 mM of sodium citrate (for calibration set (T1) and validation set 1 (P1)) and 50 mM of sodium citrate (for validation set 2 (P2)) with NaCl in the range 133–210 mM, at a pH range of 5.8–6.2 and a loading concentration of 10–20 g/L. The elution was fractionated into 1 mL fractions, where each fraction constituted a separate sample for spectral measurements.

2.6. Protein Concentration and Analytical Size Exclusion Chromatography

Sample concentration was determined off-line by A280 UV spectrometry using Trinean (Unchained Labs, Pleasanton, CA, USA) with the corresponding extinction coefficient. Only samples with a product concentration above 0.5 mg/mL were used for the Raman measurements. The monomer purity was monitored with high-performance size exclusion chromatography (HP-SEC) using a TSK-GEL G3000SWXL column (7.8 mm × 30 cm) from Tosoh Bioscience (King of Prussia, PA, USA) with an Agilent 1200 HPLC system (Agilent Technologies, Santa Clara, CA, USA). The column was operated at a flow rate of 1 mL/min with a mobile phase consisting of 0.1 M of sodium phosphate and 0.1 M of sodium sulphate, pH 6.8. Protein was monitored by the absorbance at 280 nm, and the sample purity was estimated by integrating the chromatograms.

2.7. Spectral Data Acquisition

All the spectral measurements were performed using the InVia confocal Raman microscope (Renishaw, Wotton-under-Edge, UK) equipped with a 785 nm laser. Prior to spectral measurements, the acquisition settings were optimised in respect to the focal point, sample volume, laser output, and duration of measurements. Measurements of the cell culture were performed in the range of 381 to 1534 cm−1 using a 10% laser power (30 mW), 30 s acquisition time, 5 accumulations, and line-focus using a 5X objective (Leica Microsystems, Wetzlar, Germany). For each sample, 350 µL of culture was spun down to remove cells, and 300 µL of supernatant was used for the acquisition. The data acquisition was performed using polypropylene (PP) 96-well plates (Greiner Bio-one, Stonehouse, UK) using the Microplate mapping option of the WiRe 5.2 software (Renishaw, Wotton-under-Edge, UK). Data acquisition for the CEX samples was performed similarly to the cell culture samples, with a difference in acquisition range (605–1741 cm−1). Additional experiments were performed comparing the signal from the PP 96-well plates with the signal from stainless steel plates, which were custom-made. The acquisition was further optimised using a long-distance 50X objective (Leica Microsystems, Wetzlar, Germany), increasing the laser power to 100%, and decreasing the acquisition time to 10 s and 3 accumulations.

2.8. Spectral Data Pre-Processing and Model Set-Up

The Raman data recorded by the HT InVia Raman microscope for both the USP and DSP applications were pre-processed and modelled in Python 3.7.1. PLS was used to develop the predictions of the variables in both the USP and DSP case studies. In the analysis of the USP variables and the product concentration in the DSP case study, the background fluorescence was removed by fitting and subtracting a 1st order polynomial to each individual spectrum using the open-source Rampy library [58] (Le Losq 2018). The baseline corrected spectra were subsequently normalised by applying a standard normal variate (SNV) algorithm, which corrects for scattering effects due to slight changes in the path length of the Raman device in addition to correcting for changes in the cell culture composite such as viscosity. Prior to the SNV, the data were smoothed using a Savitzky–Golay smoothing filter. For the monomer concentration in the DSP case study, the PLS model was developed using the raw spectra. In the USP application, the calibration data set consisted of cell cultures: 1–5 and 7–11 (cell line A), 13–17 and 19–23 (cell line B), and the validation runs equal to cell cultures 6 and 12 (cell line A) and 8 and 24 (cell line B). In the DSP application, the individual CEX runs differed in the elution buffer conditions, where the calibration set consisted of elution fractions from runs using 20 mM of sodium citrate, with varying levels of sodium chloride (0–0.5 M). There were two district validation sets—the first (P1) was in an identical buffer range to that of the calibration set and consisted of 40 samples, whereas the second (P2) consisted of elution fractions using elution buffer containing 50 mM of sodium citrate as well as a wider salt range (133–210 mM), and consisted of 22 samples. The optimum number of latent variables for each of the PLS models was identified by minimising both the root mean square error (RMSE) based on the calibration data set and the root mean square error of prediction (RMSEP) based on the validation data set.

2.9. Partial Least Squares Model Generation

The PLS model implemented the nonlinear iterative partial least squares (NIPALS) algorithm, as outlined in detail by Wold et al. [59]. The preprocessed spectral data (XSpectra) were first decomposed into N latent variables, generating a matrix of scores, T, and loadings, P, with E as the residuals. The off-line concentration of the glucose concentration (YVariable) was decomposed in a similar fashion, generating a matrix of scores, U, and loadings, Q, with F as the residuals:
X S p e c t r a = T P T + E ,
Y V a r i a b l e = U Q T + F .
The inner-relationship B vector is generated by relating the scores of the X S p e c t r a to the scores of the Y V a r i a b l e , calculated as:
B =   X S p e c t r a T ( T ) ( X S p e c t r a T X S p e c t r a ) 1 .
The PLS model works iteratively through each latent variable and, upon convergence, generates a matrix of regression coefficients β equal to:
β = W ( P T W ) 1 d i a g ( B ) .
The predicted Y variable ( Y V a r i a b l e ˙ ) is calculated with the cumulative sum of the regression coefficients, taking N latent variables, defined by Goldrick et al. 2018 as [12]:
Y V a r i a b l e ˙ = X S p e c t r a n = 1 N β .

3. Results and Discussion

This paper evaluates the performance of a novel HT-Raman spectroscopy device applied to two critical USP and DSP operations within biopharmaceutical manufacturing. This evaluation includes the development of a Raman spectroscopy model generation workflow shown in Figure 1, outlining the necessary steps to ensure that a robust MVDA model is generated. The novelty of the presented workflow is that, in addition to quantifying the performance of the MVDA model using traditional RMSE and RMSEP metrics, it suggests interpreting the model’s coefficients and comparing them to the expected Raman vibrational signatures of the variable investigated to ensure that the accuracy of the predictions are independent of the metabolism-induced concentration correlations. This novel Raman spectroscopy model generation workflow is demonstrated on two case studies, the first involves the at-line monitoring of an HT micro-bioreactor system cultivating two mammalian cells expressing two different therapeutic proteins. The second application of this device involves the development of a cation exchange chromatography step for an Fc-fusion protein to compare different elution conditions.

3.1. Demonstration of HT Raman Spectroscopy Microscope to USP

In this work, the HT InVia Raman microscope was applied to two essential R&D unit operations within biopharmaceutical manufacturing. The first investigated the application of MVDA to transform the Raman spectra from a USP operation to predict the primary metabolite concentrations, cellular growth characteristics, and therapeutic protein concentrations of a mammalian cell culture performed on a micro-bioreactor system. The off-line variables investigated in this work were recorded every 48 h and are shown in Figure 2. In total, there were 12 cell culture runs from cell line A and 12 cell culture runs from cell line B, with the majority of these harvested early on day 10 due to the high accumulation of lactate, as shown in Figure 2C. The high lactate production was due to controlled fluctuations in the DO2 set-point that involved manipulating the DO2 to between 10–40% and studying the influence of these fluctuations on the growth and productivity. The adjustments to the DO2 set-points resulted in the majority of the cells maintaining their lactate production state from day 4 to 10. The influence of these DO2 concentration fluctuations on lactate production is outside the scope of this paper. Apart from the lactate concentration, the glucose, VCD, and antibody concentrations shown in Figure 2 represent the typical ranges expected for mammalian cell cultures, providing an ideal data set to investigate the performance of this HT-Raman spectroscopy device. The analysis of the experimental Raman spectra followed the workflow shown in Figure 1, and the MVDA model chosen was a PLS model defined by Section 2.9. The data split used to build this PLS model is shown in Figure 2, with runs 1–5 and 7–11 (cell line A) and 13–17 and 19–23 (cell line B) used for calibration, and runs 6 and 12 (cell line A) and 18 and 24 (cell line B) used for validation.
The spectral analysis was carried out using the remaining off-line analytic sample, equivalent to 300 μL. This material was split up into three separate wells on a 96-well plate, providing triplicate 100 μL samples for the HT InVia Raman microscope device. The selected sample volume of 100 μL was found to produce the most consistent spectra, although smaller volumes can be accommodated. The raw spectral data is shown in Figure 3A and highlights the significant baseline increase as the culture progresses from day 0 (inoculation) to day 10. An approximate 15-fold increase is observed in the average baseline of the Raman spectra recorded on day 0 compared to day 10. Corrupting fluorescence still remains a major problem for Raman spectroscopy, particularly during upstream processing operations, where broad fluorescence background signals have been shown to mask out important Raman peaks and thus prevent the extraction of useful correlations [12]. To minimise the influence of fluorescence in this work, a baseline removal algorithm was implemented, followed by the application of a scattering correction algorithm referred to as standard normal variate (SNV). The application of SNV is highly recommended when using a HT Raman spectroscopy microscope, as it corrects for minor path length differences between the laser source and the sample due to small volume changes, resulting in the baseline displacement of the spectrum along the vertical axis. These pre-processed spectral data are shown in Figure 3B and were used to develop the PLS models of glucose, VCD, lactate, and antibody concentrations. Alternative methods to remove strong fluorescence signals include taking the 1st derivate of the spectra, followed by SNV. This was demonstrated by Berry et al., who observed a significant baseline shift during the on-line monitoring of a CHO cell culture system and generated highly accurate models of multiple process parameters including glucose, lactate, and VCD (Berry et al. 2015).
Four separate PLS models were developed to correlate the pre-processed spectra shown in Figure 3B to the concentrations of glucose and lactate, VCD, and the antibody concentration. The model was calibrated using cell culture runs 1–5 and 7–11 (cell line A) and 13–17 and 19–23 (cell line B), and validated with runs 6 and 12 (cell line A) and 18 and 24 (cell line B). The prediction performances of the optimum PLS models for each variable are summarised in Table 1. The choice of latent variables was based on minimising the root mean square error (RMSE) for the calibration data sets and the root mean square error of the prediction (RMSEP) values for the validation data sets, which ensured an accurate model with a good prediction performance. However, a low RMSE and RMSEP does not always equate to a robust model.
A comparison of the experimental recorded off-line variables to those predicted by the PLS models is shown in Figure 4. The PLS model for glucose concentration is shown to accurately predict the off-line measurements between the range of 1 and 5 g L−1, as shown in Figure 4A. The RMSE and RMSEP of glucose concentration are equal to 0.19 and 0.38 g L−1, respectively, which is equivalent to ±4.75% and ±9.5% of the glucose range investigated. Additionally, these values are below the typical measurement error of offline analysers of ~ 0.5 g L−1. These predictions are comparable to the glucose predictions demonstrated by Rowland-Jones and Jaques [60], who observed an RMSE of 0.24 g L−1 and an RMSE of cross validation equal to 0.32 g L−1 using a similar type of Raman microscope during the at-line monitoring of a mammalian cell culture system in a miniature bioreactor system. The lactate predictions were slightly higher than those reported by Rowland-Jones and Jacques [60], who reported an RMSE of approximately 0.25 g L−1 and an RMSE cross validation of 0.30 g L−1. However, the lactate predictions considered in this work were across a much wider concentration range, and demonstrate the ability of this tool to accurately predict lactate in excess of 12 g L−1. The prediction accuracy of this HT-Raman microscope for both glucose and lactate is highly comparable to the on-line Raman spectroscopy sensors for mammalian cell culture systems reported in the approximate RMSEP range of 0.2–0.9 g L−1 for glucose concentration and 0.1–04 g L−1 for lactate [17,18,61]. The accuracy of these at-line predictions is comparable with the accuracy of the off-line nutrient analyser, and therefore has the potential to replace these analysers and help facilitate the development of an at-line glucose control strategy.
Conventionally, the RMSE and RMSEP are the gold standard for model comparison and, provided the validation data set is independent, these metrics typically provide a good measure of the model’s robustness. However, to further validate these model predictions the model coefficients should be scrutinised to ensure the model robustness, as outlined by the Raman spectroscopy model generation workflow defined in Figure 1. Within this work, the generated model was a PLS model, and the regression coefficients of the PLS model are shown in Figure 5. To assess whether the dominant wavenumbers highlighted by the PLS regression weights shown in Figure 5 are related to the variable of interest, a table containing the majority of the Raman vibrational peak assignments associated with each variable is shown in Table 2. This table highlights the associated Raman vibrational shifts expected after excitation from each variable due to changes in the molecular bond length such as stretching, which can be symmetric or asymmetric, or the bending of the molecular bond angles due to a wagging or a rocking motion. By comparing the expected Raman signature profile of these variables to the dominant peaks calculated by the PLS regression coefficients, the model’s robustness can be evaluated. This ensures that the generated PLS model is specifically built to predict the variable investigated and not due to the metabolism-induced concentration correlations of other variables.
For glucose, the dominant regression coefficients were characterised by peaks that had a regression coefficient equal to or above 0.2 (i.e., β > 0.02 ). Wide peaks were characterised by the start, max, and end wavenumber of these peaks and by the max wavenumber value for narrow peaks. The majority of these peaks are shown to correctly align with the peaks associated with glucose, based on previously published literature defining the wavenumbers associated with glucose [62,63,64,65,66,67,68]. This includes the three distinct peaks in the 871–988 cm−1 range, which are indicated in Figure 5A as a single peak at wavenumber 928 cm−1, which aligns with multiple literature references for the specific Raman scattering bands associated with glucose. The other dominant peaks at 1373, 1061, and 517 cm−1 all align with the expected peaks for glucose and further strengthen the predictions of the generated PLS model. Another interesting observation was outlined by Söderholm et al. [64], who demonstrated a small peak shift of approximate 2–5 wavenumbers depending on the glucose concentration in an aqueous solution with varying water contents; this demonstrates why, in Table 2, some of the regression peaks do not align precisely with those quoted in the literature. An additional evaluation of specific Raman bands for individual metabolites was defined by Singh et al. 2015 [65], who investigated the supernatants of a CHO cell culture grown in shake flasks using a Raman spectroscopy device. They used a classical least squares algorithm to determine, with a high degree of accuracy, the specific bands associated with both glucose and lactate. For glucose, they determined that there are seven characteristic peaks related to glucose, which are located at the wavelengths 435, 516, 990, 1076, 1121, 1374, and 1460 cm−1, which all align with the dominant PLS regression coefficients features shown in Figure 5A. The alignment of these PLS regression coefficients with the expected Raman peaks of glucose provides additional confidence in this generated MVDA model. Similar observations were observed for the main regression peaks of lactate shown in Figure 5C that were highlighted for all the PLS regression coefficients above 0.05 (i.e., β > 0.05 ). The majority of these bands correspond to the Raman vibrational bands characterising lactate in the literature, as demonstrated in Table 2. Furthermore, Singh et al. characterised the main lactate-associated Raman peaks by wavenumbers 855, 922, 1045, 1085, and 1456 cm−1, which align almost perfectly with those shown in Figure 5C. Similar to the glucose model, the correct alignment of the PLS regression coefficients with the expected lactate vibration bands provides the necessary confidence in the PLS model to enable subsequent predictions and deploy the MVDA model.
Figure 3B demonstrates the ability of this HT Raman spectroscopy to accurately predict the VCD across the expected range of mammalian cell cultures. The RMSEP for the VCD was 3.49 × 10⁶ cells per mL−1, which is equivalent to the ±9% measurement range investigated, and was found to accurately predict both high and low VCD concentrations for both cell lines, as shown in Figure 3B. The prediction accuracy is similar to that reported by Rowland-Jones et al., which was equal to 4.49 × 10⁶ cells per mL−1. These VCD predictions are also comparable to on-line Raman spectroscopy systems monitoring mammalian cell culture systems reporting predictions in the range of 1–5 × 10⁶ cells per mL−1 [18,61]. The accuracy of these VCD measurements demonstrates the potential of this technology to replace the traditional off-line cell counter based on the accuracy of these predictions between the two cell lines investigated. However, as outlined in the Raman spectroscopy model generation workflow, it is necessary to evaluate the regression coefficients of the model.
The PLS regression coefficients of VCD are shown in Figure 5B, with the main peaks identified as those above 0.02 (i.e., β > 0.02 ), which are also indicated in Table 2. It is interesting to note that the primary peaks identified are also closely associated with the expected Raman vibrational bands of lactate. These highly correlated metabolite concentrations are problematic, as, although the RMSE and RMSEP of this PLS model are low, it is difficult to deconvolute this strong association with lactate. The correlation coefficient between the off-line lactate and off-line VCD concentrations was equal to 0.88, and therefore would help explain the location of these dominant lactate peaks corresponding to the calculated VCD regression coefficients. This is particularly evident when comparing the dominant lactate PLS regression peak shown at wavenumber 855 cm−1 in Figure 5C, which corresponds to the strong peak shown in the VCD at this precise wavenumber shown in Figure 5B. This high correlation is most likely due to the high accumulated lactate on days 6, 8, and 10, shown in Figure 2C, which resulted in a significant drop in the corresponding VCD values shown in Figure 2B. Based on a subsequent analysis of the PLS regression coefficients, it would be recommended to not deploy this PLS model for VCD and to generate additional experiment runs that do not result in a strong correlation between the off-line analytics of VCD and lactate.
The most promising application of this HT-Raman spectroscopy device is the ability to accurately predict the at-line product concentration, as shown in Figure 4D. The PLS model generated had an RMSE equal to 0.09 g L−1, and the RMSEP was equal to 0.17 g L−1, which is equivalent to ±4.5% and ±8.5% of the glucose range investigated. The accuracies of these predictions were similar to the RMSEP reported by Rowland-Jones et al. equal to 0.57 g L−1 [60], and slightly better than the RMSEP reported by on-line systems equal to 0.75–1.21 g L−1 [18]. The majority of previous research on Raman spectroscopy focuses on the nutrient concentration and cell concentrations, however the ability to measure product concentration opens up significant opportunities for the development of advanced control strategies. One demonstration was shown by Rowland-Jones and Jaques [60], who adapted nutrient and glucose feed additions through at-line predictions of glucose and VCD using a similar type of HT Raman spectroscopy microscope. This is one of the first demonstrations of PAT applied to control a miniature bioreactor system. The subsequent evaluation of the regression coefficients for the generated PLS model shown in Figure 5D highlights some issues with the robustness of this model. The dominant PLS regression coefficients for antibody were taken as those above 0.015 (i.e., β > 0.015 ). These peaks are shown to be primarily associated with either glucose or lactate. The strong lactate peak shown at wavenumber 855 cm−1 is evident from Figure 5D, and in addition to the strong glucose peak shown in Figure 5A at wavenumber 1373 cm−1 which can be observed at a similar location in the antibody wavenumber of 1368 cm−1. Furthermore, the wavenumbers of 535, 1041, and 1456 cm−1 associated with lactate are also dominant for the PLS regression coefficients of the antibody. The strong association of antibody with both glucose and lactate can be partially explained by the high correlation coefficient (R2) between the antibody and lactate equal to 0.77 and the antibody and glucose equal to −0.47. The issues with these metabolite-induced concentration correlations have been previously outlined by Rhiel et al. [69], who demonstrated that, due to the complex nature of the majority of bioprocesses, some analyte predictions using spectroscopic methods are based upon correlations between other variables. This was observed by Rheil et al. [69] during the analysis of the main metabolites of a CHO cell culture using a MIR probe. They demonstrated a similar strong independence between the majority of metabolite concentrations, which negatively affected their predictions. The strong correlation between the variables investigated in this research poses a major risk in subsequent predictions, where deviations in either glucose or lactate concentrations outside of the concentrations investigated in this work would drastically influence the antibody and VCD predictions. Subsequent experimental work is therefore needed to build more robust models that should include the spiking of these variables to build an independent data set to calibrate and validate these MVDA models.
Table 2. The dominant PLS regression peaks of glucose, lactate, VCD, and antibody and their corresponding Raman spectroscopy vibrational signatures based on previous literature values detailing reference wavenumbers for variables of interest.
VariablePLS Regression Peak (β) Wavenumber [cm−1]
[USP Model]
Reference Wavenumber of Analyte [cm−1]AssignmentReference
startmaxend
Glucose * 442446450443-[62]
450δ (C-C-O)[63]
451-[64]
510517521514-[62]
516-[65]
518δ (C-CO)[63]
559562567---
583588590585δ (C-C-O)[63]
716718721---
871928988893ν (C-C)[63]
895δ (C-H), δ (C-OH)[66]
898-[62]
910δ (C-H)[63]
913-[62]
914-[67]
990-[65]
10061002-[67]
1010101910241018δ (COH)[68]
1032 ---
1059106210661060ν (CO)[63,66,68]
11281120δ (COH)[63]
1121-[65]
1122-[67]
1124ν (CO)[68]
1125ν (C-C)[66]
1130-[62]
1358137313951360w (CH2)[63]
1370δ (C-H)[66]
1372w (CH2)[68]
1373-[62]
1374-[65]
1490---
Lactate **381402417---
535540w (CO2-)[70,71]
840855866855-[65]
860ν (C-CO2-)[70,71]
926930r(CH3)[70,71]
10401045ν (C-CH3)[65,70,71]
10841085ν (C-O)[65,70,71]
14191420ν (CO2-)[70,71]
14561455δ (CH3)[70,71]
1456-[65]
VCD ***538540lactate (w (CO2-))[70,71]
840855866855-[65]
860lactate ν (C-CO2-)[70,71]
924930lactate (r (CH3))[70,71]
10401045lactate (ν (C-CH3))[65,70,71]
10841085lactate (ν (C-O))[65,70,71]
14201420lactate (ν (CO2-))[70,71]
14561455lactate (δ (CH3))[70,71]
1456-[65]
Antibody **** 538 540lactate (w (CO2-))[70,71]
843855864855-[65]
860lactate ν (C-CO2-)[70,71]
1041 1045lactate (ν (C-CH3))[65,70,71]
1362136813841360glucose (w (CH2))[63]
1370glucose (δ (C-H))[66]
1372glucose (w (CH2))[68]
1373-[62]
1374-[65]
1453145614661455lactate (δ (CH3))[70,71]
1456-[65]
Note: w = wagging, δ = bending, ν = stretching, r = rocking. Cut-off points for PLS regression coefficient are glucose: * β > 0.02; lactate: ** β > 0.05; VCD *** β > 0.2; antibody **** β > 0.15.
This ability to monitor these CPPs through at-line measurements opens up additional opportunities for the development of advanced control strategies for miniature bioreactor systems. The reduction in the necessary sample volume could enable more frequent at-line sampling, such as every 6 or 12 h, enhancing the monitoring and control of these miniature bioreactor systems. The application of advanced control strategies earlier in the process development cycle encourages the integration of PAT within future scale-up and commercial operations.

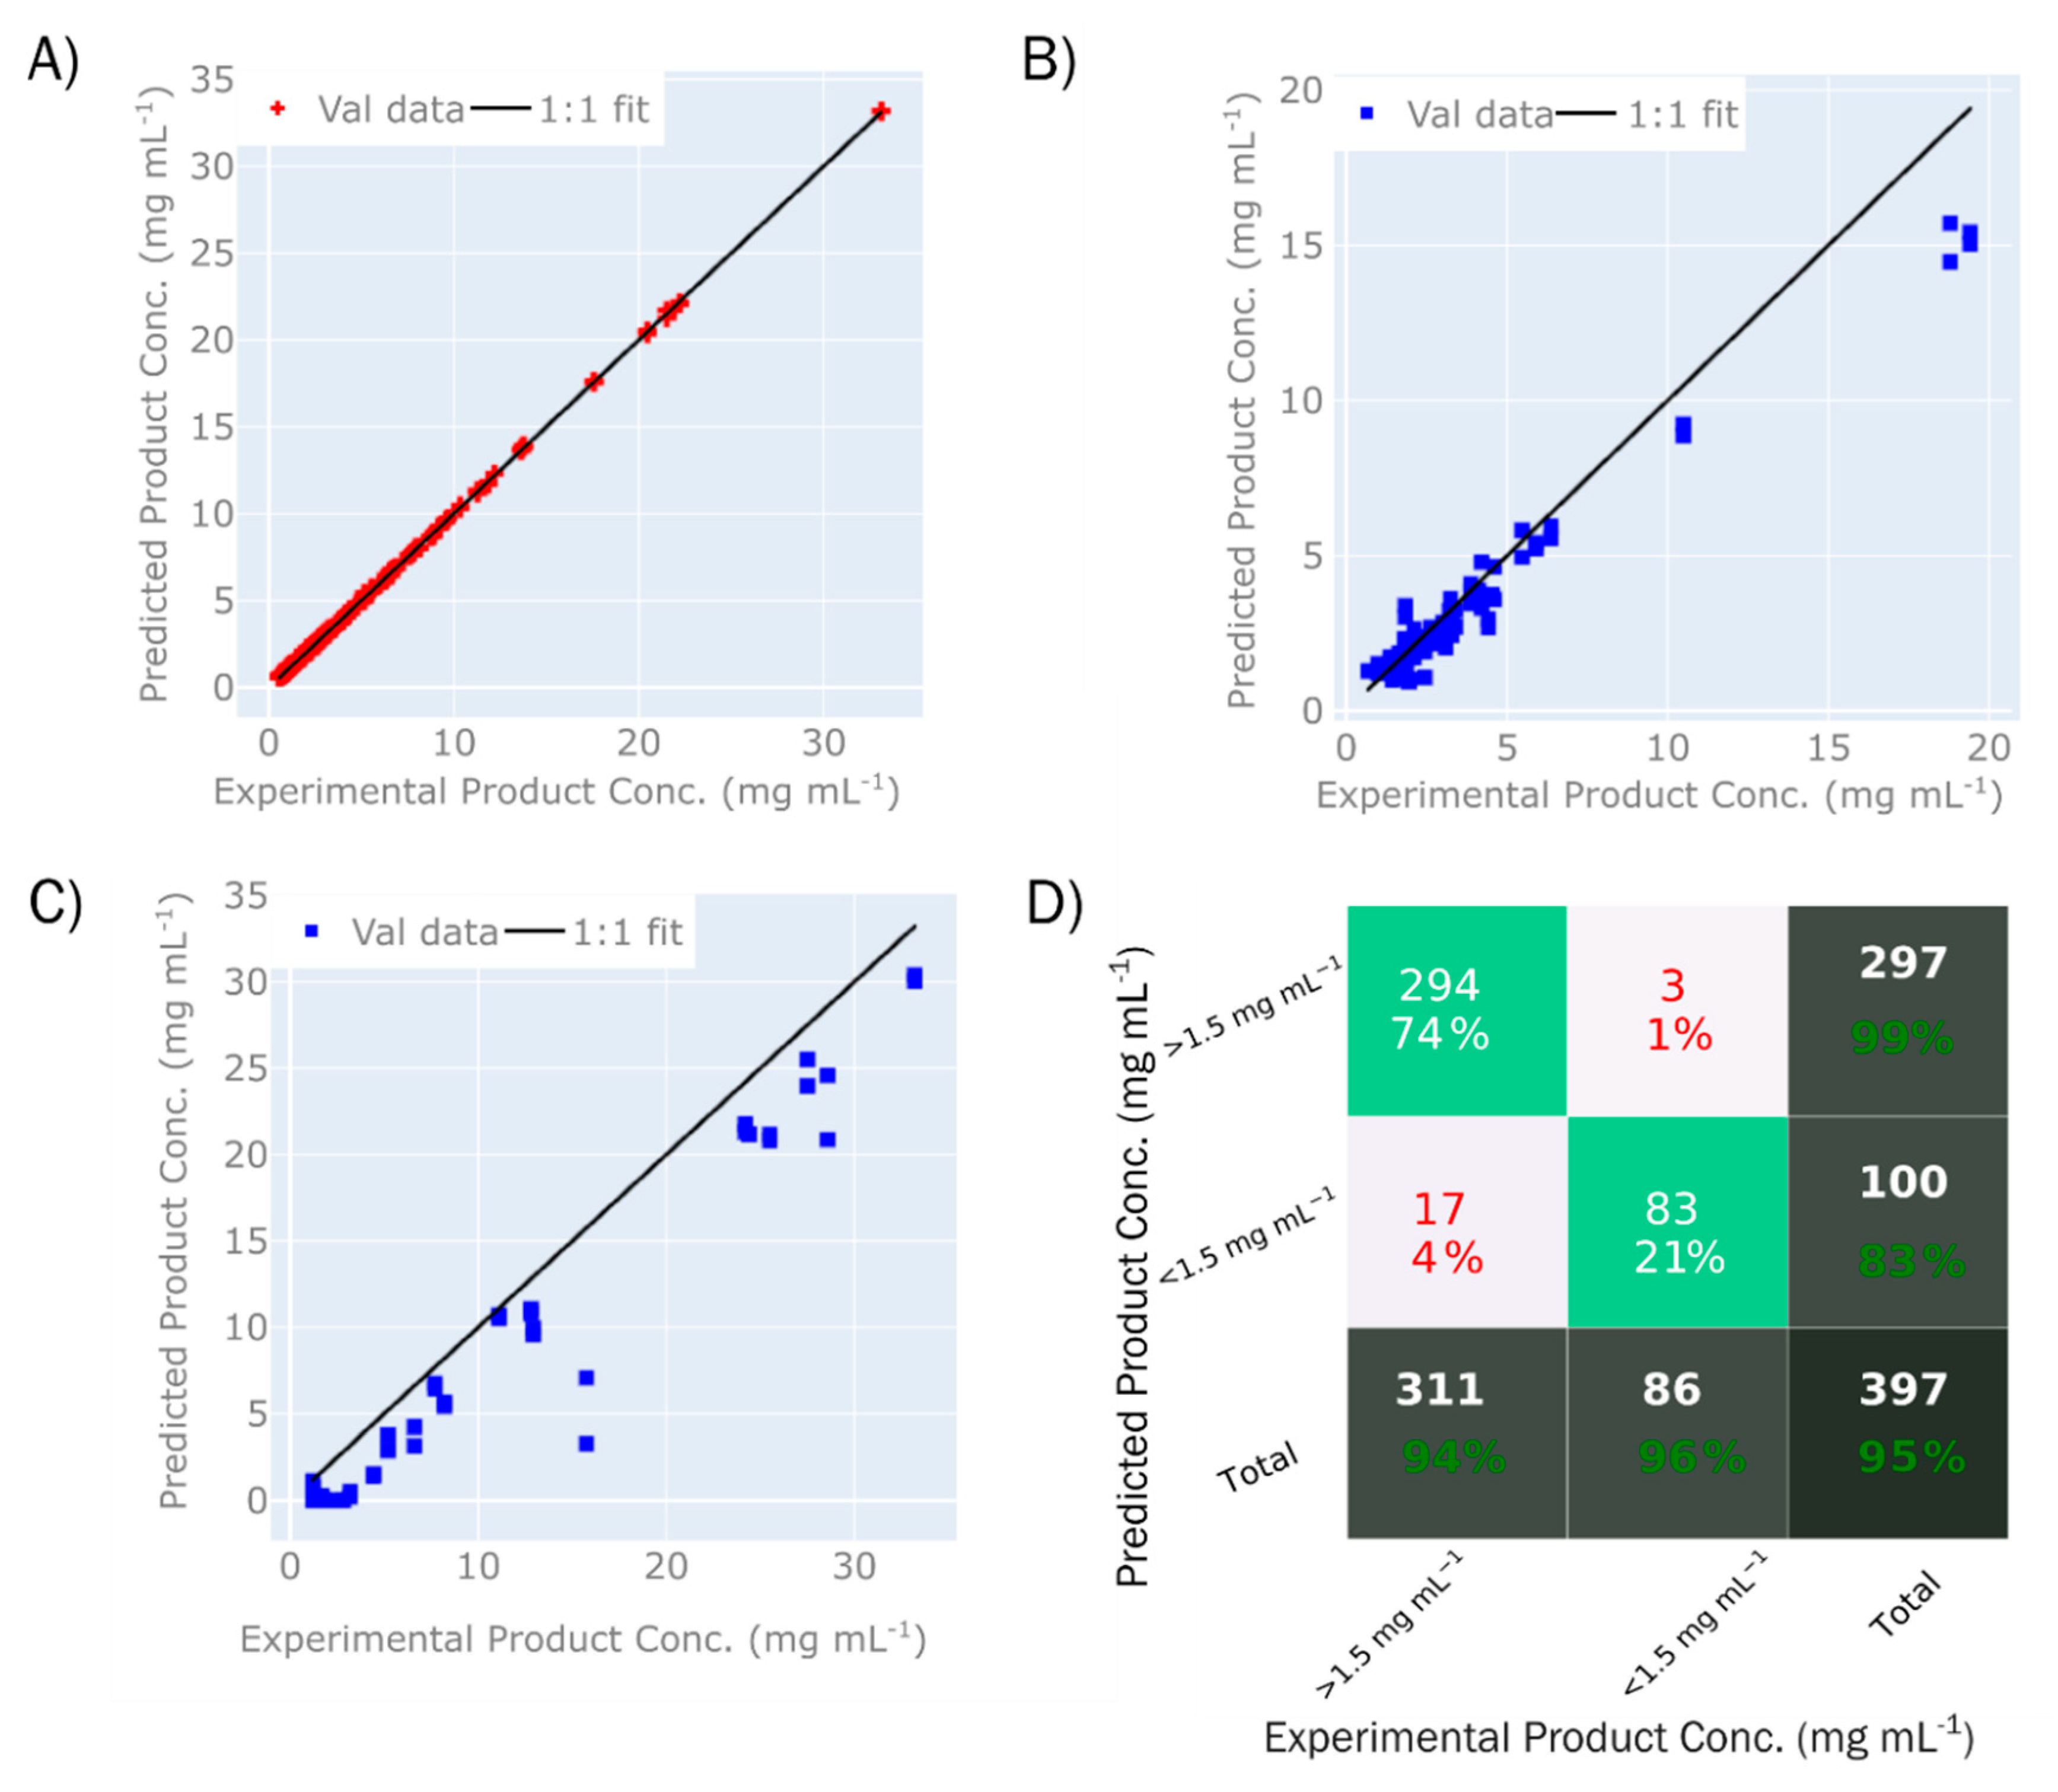
3.2. Application of Raman Spectroscopy to DSP

In this study, an HT InVia Raman Microscope was used to determine the total concentration and monomer purity of Fc-fusion protein during CEX chromatography purification in order to guide sample prioritisation for further analytical methods, such as the HPLC-SEC-based determination of monomer purity and UV absorbance at 280 nm for the total protein concentration.
The data set was based on a total of 18 individual CEX runs, including both step and gradient elution, resulting in total of 201 individual elution fraction samples, each of which were measured in duplicate, producing a total of 402 spectra. Only elution fractions above 0.5 mg/mL were included in the data set (as measured off-line by A280), as that was the previously estimated sensitivity of the device.
The PLS models were built as described in Section 2.9, and followed the Raman spectroscopy model generation workflow defined in Figure 1. The number of latent variables for the PLS model were based on minimising the RMSE and RMSEP. The validation and calibration sets showed a range of elution buffer conditions, where the PLS calibration set consisted of elution fractions from runs using 20 mM of sodium citrate, with varying levels of sodium chloride (0–0.5 M). There were two district validation sets—the first (P1) was in the identical buffer range as the calibration set and consisted of 40 samples, whereas the second (P2) consisted of elution fractions using elution buffer containing 50 mM of sodium citrate, as well as wider salt range (133–210 mM), and consisted of 22 samples. The product concentrations in the data sets ranged from 0.5 to 33.1 mg/mL for T1, 0.7 to 19.41 mg/mL for P1, and 1.7 to 33.2 mg/mL for P2. The monomer purity ranged from to 70% to 100% for all three data sets, with up to 20% HMW species and up to 20% LMW species. These two data sets were chosen in order to test the robustness of the model to changes in salt concentrations and sample matrices typically seen in purification processes.
The PLS model describing product concentration is shown in Figure 6. Using seven LVs, the model has resulted in an excellent degree of fit (Table 3), with an R2 (T1) = 0.99 for the calibration sample set (4A) and R2 (P1) = 0.99 and R2 (P2) = 0.98 for the validation sets P1 (4B) and P2 (4C), respectively. The RMSEP of 1.09 mg/mL for P1 and 3.54 for P2 corresponds to 6.1% and 11.2% of the range. A higher error for validation set P2 is expected, due to wider range of buffer conditions relative to the calibration set.
Furthermore, the model was used to classify samples based on whether or not the concentrations were higher than 1.5 mg/mL (Figure 6D). This value of 1.5 mg/mL was selected as the cut-off point to determine low-concentration samples; any samples below this concentration limit would not be further analysed by high-performance liquid chromatography (HPLC). Since only samples above 0.5 mg/mL were included in the spectral measurements, the classification was working within a narrow range of 0.5 and 1.5 mg/mL. Within this range, 95% of samples were classified correctly, of which 74% were true positives (concentration above 1.5 mg/mL) and 21% were true negatives (concentration below 1.5 mg/mL). The classification model classified both samples that were not part of the training set (P1 and P2), as well as samples that were used to build the model (T1), which leads to the accuracy of prediction being higher than what would be seen if only previously unknown samples were used. Nevertheless, this shows that the model can be used to determine which samples should be considered for further analysis and pooling, and which can be discarded at this stage due to no or low levels of protein.
The second variable of interest was monomer purity, as it is desirable to achieve maximal monomer purity whilst minimising the presence of aggregated (HMW) or fragmented (LMW) species, or both. In this experiment, a model was built that predicted monomer purity (Figure 5), although with a relatively large RMSE, which would not allow for quantitative detection, but could serve to distinguish between samples with high purity versus samples with low purity, and therefore save time for more laborious methods such as HPLC.
The model predicting monomer purity was based on the same data set as the total concentration model, with the exception that only samples with concentrations above 1.5 mg/mL were used. The model uses eight LVs. The summary of model statistics is shown in Table 3. The PLS calibration model for monomer purity resulted in an R2 (T1) = 0.98 (5A), R2 (P1) = 0.86 (5B), and R2 (P2) = 0.34 (7C), as shown in Figure 7. The RMSEP for monomer purity for P1 and P2 corresponds to 4.27% and 13.68%, respectively. The model was further used to classify samples according to a monomer purity of 90% or higher, where a total of 92% of the samples were classified correctly as either true positives (80%) or true negatives (13%), as is shown in Figure 7D.
When validated using the two prediction sets, a relatively low RMSEP was achieved for data set P1, and no useful predictions were achieved for set P2. This led us to believe that the model was based on features that are absent from the P2 data set, which might be caused by changes in the elution profile and the content of co-eluting impurities. Alternatively, the type of HMW/LMW species might differ between data sets P1 and P2 due to changes in the elution buffer. Despite that, the model is capable of classifying samples with an acceptable degree of accuracy.
The PLS model developed for product concentration was found to have a significantly lower RMSEP, and was less susceptible to changes in the sample matrix conditions than the PLS for monomer purity. Examining the PLS regression plots for the concentration model (described in Table 4 and Figure 8A), multiple IgG spectral features can be identified, such as the Amide I and Amide III bands at wavelengths 1673 cm−1, and 1236 and 1337 cm−1, respectively. Bands resulting from the vibrations of amino acid groups can be further found at 757 and 1553 cm−1 for tryptophan, 1003 and 1208 cm−1 for phenylalanine, and 1208 cm−1 for tyrosine [72,73,74]. Regression coefficients corresponding to the IgG peaks as annotated in the literature suggest that the model is valid and is based directly on the protein spectra rather than on the spectral features of other correlated components.
The PLS regression plot for monomer purity in Figure 8A relies on the above-mentioned general protein peaks, as can be seen based on the similarities between the two plots, but also has additional features, especially in the area between wavelengths 831–901 cm−1 and 1437–1446 cm−1. Neither of the two regions correspond to the spectrum of the citrate buffer (data not shown). Although difficult to determine without further experimental data, this might correspond to aggregation, as the wavelength region has previously been suggested to correspond to a shift in the tyrosine Fermi doublet at 830/850, which is seem upon aggregation [45].
The results show that HT-Raman spectroscopy has the potential to support downstream development through the rapid determination of product concentration and monomer purity, which enables the prioritisation of samples for further analysis and therefore saves operator and instrument time. We have shown that robust product predictions can be achieved, in line with the previously published literature, but predictions of monomer concentrations had a relatively large RMSEP and lower robustness. In order to make the Raman spectroscopy truly attractive to DSP, improvements in terms of sensitivity need to be made.
Studies have described various spectral changes upon protein aggregation [45,46], although the spectral features do not seem to be very consistent and might differ from product to product. As a consequence, the PLS model described here might be relying on a combination of background signal peaks and concentration peaks, rather than the specific spectral signal for aggregation and/or fragmentation. This would also explain why the model predictions are significantly worse for the P2 data set, where the elution buffer was changed, which likely results in changes to the background spectra due to the changed sample matrix.
A specific spectral signature for aggregation/fragmentation might potentially be present, but the sensitivity of the set-up could be insufficient to detect it. The majority of samples had a relatively low aggregate content (below 5%), which would result in aggregate concentrations of about 0.025 to 1.655 mg/mL. Based on previous experiments, we have estimated the LOD at around 1 mg/mL; hence, a large portion of the aggregate content in the samples might be below the limit. We have shown ways to increase the sensitivity, including a change in the 96-well plate material, laser output, and objective magnification, which would likely increase the sensitivity of the model.
Although a reduction in number of samples for HPLC analysis might be welcomed by the operators of such instruments, it might not necessarily justify the acquisition of such equipment. The major simplification of large screening experiments could be enabled by the ability to predict robustly monomer purity, especially in situations where LMW/HMW species elute throughout the main monomer peak without clear separation. The ultimate application of the technology would be the real-time detection of multiple CQAs based on the Raman spectra, potentially integrated with currently monitored variables such as UV, pH, osmolarity, etc. This would allow real-time control, leading to a higher product quality and ultimately supporting initiatives such as continuous manufacturing. This work is the first step towards such applications, as it highlights the current limitations as well as the potential improvements that can be implemented.

3.2.1. Strategies for Improving Predictions

Considering the high RMSEP of the monomer purity model, efforts were made to increase the sensitivity of the instrument by the optimisation of the acquisition settings. Adjustments to the acquisition settings were made to improve the signal intensity, including a change in the sample holder, microscope objective, and laser power. The data presented in this study were acquired using polypropylene 96-well plates, which were switched to stainless steel in order to improve the signal. As shown in Figure 9, there is a significant reduction in background between the PP plates and the steel plates. Furthermore, when the acquisition was performed using a 50X long-working distance objective, the background signal was further decreased, especially in the spectral range of the water peak (1300–1500 cm−1). Additional improvement in the spectral quality came from using the higher laser power (300 mW vs. 30 mW), which was enabled through the switch to steel plates, as using a high laser power in the polypropylene plates caused the scorching of the plate and heating of the sample.

3.2.2. Raman Spectroscopy Future Perspective

Raman spectroscopy has positioned itself as the leading on-line and at-line process analyser for biopharmaceutical processes. This technology is non-invasive, non-destructive, and has little interference with water, making it an ideal tool for both USP and DSP operations. One of the primary challenges of Raman spectroscopy is the weak Raman signal that reduces the sensitivity of the instrument and can be further hindered by background fluorescence, which, as demonstrated in this work, is highly problematic during the analysis of biological samples. Pre-processing the spectra can alleviate the majority of this fluorescence and ensure that accurate MVDA models can be generated to predict the variable of interest. However, ensuring the developed MVDA model predictions have a low RMSE and low RMSEP does not always guarantee a robust accurate model. To ensure the developed MVDA model is sufficient, an in-depth evaluation of the regression weights is required. In order to build a robust MVDA model, the regression coefficients should correspond to the correct wavenumbers associated with the specific molecular vibration bonds associated with the Raman scattering of the variable. This work provides two useful tables (Table 2 and Table 4) outlining some of the primary vibrational modes related to Raman scattering associated with glucose, lactate, and protein based upon the previously published literature. This work demonstrated that, although the PLS model generated for the antibody and VCD concentrations resulted in a low RMSE and RMSEP, the regression weights of these models did not correspond to the antibody and VCD molecular vibrations; instead, they corresponded to only those wavenumbers associated with lactate and glucose molecular vibrations. Therefore, these metabolism-induced concentration correlations could lead to poor VCD and antibody predictions when either the glucose or lactate concentrations differed from the current glucose and lactate concentrations in this experiment. Therefore, the Raman spectroscopy model generation workflow outlined in Figure 1 highlights the importance of analysing the MVDA regression coefficients to ensure they align with the expected vibrational bonds associated with the variable, in addition to presenting the traditional RMSE and RMSEP metrics. This paper also demonstrates the value of an HT Raman spectroscopy device and its potential to revolutionise the monitoring and control of automated microbioreactor systems. Although improvements to the prediction accuracy of the models are needed, HT Raman spectroscopy has the potential to replace the need for additional analytic equipment, which can reduce operating costs. The additional benefit of the HT-Raman spectroscopy device is its ability to analyse samples across both USP and DSP operations.

4. Conclusions

This paper demonstrates the value of implementing MVDA to complex spectral data sets generated by an HT-Raman spectroscopy microscope to support the at-line monitoring and subsequent optimisation of USP and DSP operations, particularly those activities in early-stage development with limited sample volume availability. The USP case study investigated the ability of this device to predict the key process parameters typically measured off-line during cell culture for two different cell lines grown in a micro-bioreactor system cultivating 24 cell culture runs. The Raman spectra recorded throughout this mammalian cell culture was analysed using the Raman spectroscopy model generation workflow outlined in this paper and enabled the development of an optimised PLS model resulting in accurate predictions of the glucose, lactate, viable cell density, and product concentration. The RMSE and RMSEP were comparable to previously reported in-line Raman spectroscopy probes. However, upon the investigation of the regression coefficients of these variables, the VCD and antibody PLS models were shown to be primarily correlated with the Raman vibrational signatures of lactate and glucose. Therefore, subsequent experimentation is required to validate the robustness of these models. However, these results demonstrate the potential of this technology to predict these off-line variables using a single analytic device in comparison to three separate off-line analysers, which could greatly simplify the monitoring of these micro-bioreactor systems. Additionally, these at-line measurements require less volume than traditional analytic methods. This opens up opportunities for advanced control strategies and helps promote the inclusion of PAT in early-stage process development, thus simplifying the adoption of PAT within commercial-scale manufacturing.
The second case study involved a commercial DSP unit operation and further demonstrates the versatility and flexibility of this instrument. This case study focused on streamlining the sample collection of the CEX chromatography step, investigating different elution conditions during the purification of a fusion protein. The HT Raman microscope collected spectral data on 18 CEX runs operated in both step and gradient elution modes; these runs were operated using different buffer conditions. The potential of the Raman spectra to predict the total protein concentration and monomer purity was investigated. Both variables were modelled by an optimised PLS model leveraging the data from the Raman spectra. To demonstrate the robustness of the developed PLS model, two distinct validation data sets were considered. The first calibration data set (P1) included identical buffers that were in the same range as those used to calibrate the model. The second calibration data (P2) contained elution fractions that used a buffer containing 50 mM of sodium citrate and a wider salt range that was outside of the ranges of the validation data set. It was shown that the use of HT-Raman enables relatively accurate predictions of the protein concentration and monomer purity, however when the model was validated using a sample set with a different buffer background (P2), a significant decrease in prediction accuracy was observed, suggesting separate models might have to be built for specific conditions.
In summary, the HT-Raman spectroscopy microscope demonstrated significant potential as a novel cross-functional PAT applicable to both USP and DSP operations. The device was shown to accurately predict the primary CPPs in USP and the CQAs relevant to DSP through the application of MVDA. Furthermore, this technology has the potential to reduce the reliance on multiple separate analytic devices, thus reducing the capital and operating costs. Additionally, the near real-time information generated can be further exploited to develop and implement advanced control strategies and process optimisation earlier in the process development lifecycle.

Author Contributions

A.U. and S.G. contributed equally to this work. Conceptualisation, S.G., A.U., A.T., M.C., R.T., A.C., M.H., C.S., and S.S.F.; methodology, S.G., A.U., A.T., A.C., K.L., R.Z., M.H., and C.S.; software, A.U., S.G., and C.S.; validation, S.G., A.U., and C.S.; formal analysis, A.U., A.T., R.Z., A.C., K.L., S.G., and C.S.; investigation, S.G., A.U., A.T., A.C., R.Z., K.L., M.H., and C.S.; resources, M.C., R.T., A.C., M.H., and S.S.F.; data curation, A.U., K.L., R.Z., S.G., and C.P.; writing—original draft preparation, S.G., A.U., and C.S.; writing—review and editing, A.U., S.G., A.T., M.C., C.S., and S.S.F.; visualisation, S.G. and A.U.; supervision, M.C., R.T., A.C., C.S., M.H., and S.S.F.; funding acquisition, R.T., M.C., A.C., M.H., and S.S.F. All authors have read and agreed to the published version of the manuscript.

Funding

This research is associated with the joint UCL-AstraZeneca Centre of Excellence for predictive multivariate decision support tools in the bioprocessing sector, and financial support for S.G. and R.Z is gratefully acknowledged. Furthermore, support from EPSRC for S.G. is also greatly appreciated (EP/I033270/1). UCL Biochemical Engineering hosts the Future Targeted Healthcare Manufacturing Hub (Grant Reference: EP/P006485/1) in collaboration with UK universities and with funding from the UK Engineering and Physical Sciences Research Council (EPSRC) and a consortium of industrial users and sector organisations.

Conflicts of Interest

The authors declare no conflict of interest.

Abbreviations

AUCArea under curve
CEXCation exchange chromatography
CHOChinese hamster ovary
CPPCritical process parameters
CQACritical quality attribute
DLSDynamic light scattering
DSPDownstream processing
FDAFood and drug administration
GMPGood manufacturing practice
HCPHost cell proteins
HMWHigh molecular weight
HPLCHigh performance liquid chromatography
HTHigh throughput
IEXIon exchange
LMWLow molecular Weight
MIRMid-infrared
MVDAMultivariate data analysis
NIRNear-infrared
PATProcess analytical technology
PLSPartial least squares
PLS-DAPartial least squares discrimination analysis
RMSERoot mean square error
RMSEPRoot mean square error of prediction
R2Correlation coefficient
R&DResearch and development
SESize exclusion
SERSSurface-enhanced Raman Spectroscopy
SNVStandard normal variate
SSStainless steel
UHPLCUltra high-performance liquid chromatography
USPUpstream processing
UVUltraviolet
VCDViable cell density

References

  1. PAT—A Framework for Innovative Pharmaceutical, Manufacturing and Quality Assurance. Available online: https://www.fda.gov/media/71012/download (accessed on 1 September 2020).
  2. Brunner, M.; Fricke, J.; Kroll, P.; Herwig, C. Investigation of the interactions of critical scale-up parameters (pH, pO2 and pCO2) on CHO batch performance and critical quality attributes. Bioprocess Biosyst. Eng. 2017, 40, 251–263. [Google Scholar] [CrossRef] [PubMed] [Green Version]
  3. Rathore, A.S.; Kapoor, G. Process analytical technology: Strategies for biopharmaceuticals. In Encyclopedia of Industrial Biotechnology: Bioprocess, Bioseparation, and Cell Technology; Flickinger, M., Ed.; John Wiley & Sons: Hoboken, NJ, USA, 2010; pp. 1543–1565. [Google Scholar]
  4. Biophorum. In-Line Monitoring/Real-Time Release Testing in Biopharmaceutical Processes—Prioritization and Cost Benefit Analysis. Available online: https://www.biophorum.com/download/in-line-monitoring-real-time-release-testing-in-biopharmaceutical-processes-prioritization-and-cost-benefit-analysis (accessed on 1 September 2020).
  5. Challa, S.; Potumarthi, R. Chemometrics-based process analytical technology (PAT) tools: Applications and adaptation in pharmaceutical and biopharmaceutical industries. Appl. Biochem. Biotechnol. 2013, 169, 66–76. [Google Scholar] [CrossRef] [PubMed]
  6. Konakovsky, V.; Yagtu, A.C.; Clemens, C.; Müller, M.M.; Berger, M.; Schlatter, S.; Herwig, C. Universal capacitance model for real-time biomass in cell culture. Sensors 2015, 15, 22128–22150. [Google Scholar] [CrossRef] [PubMed] [Green Version]
  7. Hakemeyer, C.; Strauss, U.; Werz, S.; Jose, G.E.; Folque, F.; Menezes, J.C. At-line NIR spectroscopy as effective PAT monitoring technique in Mab cultivations during process development and manufacturing. Talanta 2012, 90, 12–21. [Google Scholar] [CrossRef] [PubMed]
  8. Sandor, M.; Rüdinger, F.; Bienert, R.; Grimm, C.; Solle, D.; Scheper, T. Comparative study of non-invasive monitoring via infrared spectroscopy for mammalian cell cultivations. J. Biotechnol. 2013, 168, 636–645. [Google Scholar] [CrossRef] [PubMed]
  9. Ude, C.; Schmidt-Hager, J.; Findeis, M.; John, G.T.; Scheper, T.; Beutel, S. Application of an online-biomass sensor in an optical multisensory platform prototype for growth monitoring of biotechnical relevant microorganism and cell lines in single-use shake flasks. Sensors 2014, 14, 17390–17405. [Google Scholar] [CrossRef] [Green Version]
  10. Ude, C.; Schmidt-Hager, J.; Findeis, M.; John, G.T.; Scheper, T.; Beutel, S. Fluorescence-based soft sensor for at situ monitoring of chinese hamster ovary cell cultures. Biotechnol. Bioeng. 2014, 111, 1577–1586. [Google Scholar]
  11. Calvet, A.; Li, B.; Ryder, A.G. Rapid quantification of tryptophan and tyrosine in chemically defined cell culture media using fluorescence spectroscopy. J. Pharm. Biomed. Anal. 2012, 71, 89–98. [Google Scholar] [CrossRef] [Green Version]
  12. Goldrick, S.; Lovett, D.; Montague, G.; Lennox, B. Influence of Incident Wavelength and Detector Material Selection on Fluorescence in the Application of Raman Spectroscopy to a Fungal Fermentation Process. Bioengineering 2018, 5, 79. [Google Scholar] [CrossRef] [Green Version]
  13. Buckley, K.; Ryder, A.G. Applications of Raman Spectroscopy in Biopharmaceutical Manufacturing: A Short Review. Appl. Spectrosc. 2017, 71, 1085–1116. [Google Scholar] [CrossRef]
  14. Wu, Q.; Hamilton, T.; Nelson, W.H.; Elliott, S.; Sperry, J.F.; Wu, M. UV Raman Spectral Intensities of E. Coli and Other Bacteria Excited at 228.9, 244.0, and 248.2 nm. Anal. Chem. 2001, 73, 3432–3440. [Google Scholar] [CrossRef] [PubMed]
  15. Matthews, T.E.; Berry, B.N.; Smelko, J.; Moretto, J.; Moore, B.; Wiltberger, K. Closed loop control of lactate concentration in mammalian cell culture by Raman spectroscopy leads to improved cell density, viability, and biopharmaceutical protein production. Biotechnol. Bioeng. 2016, 113, 2416–2424. [Google Scholar] [CrossRef] [PubMed]
  16. Matthews, T.E.; Smelko, J.P.; Berry, B.; Romero-Torres, S.; Hill, D.; Kshirsagar, R.; Wiltberger, K. Glucose monitoring and adaptive feeding of mammalian cell culture in the presence of strong autofluorescence by near infrared Raman spectroscopy. Biotechnol. Prog. 2018, 34, 1574–1580. [Google Scholar] [CrossRef] [PubMed]
  17. Abu-Absi, N.R.; Kenty, B.M.; Cuellar, M.E.; Borys, M.C.; Sakhamuri, S.; Strachan, D.J.; Hausladen, M.C.; Li, Z.J. Real time monitoring of multiple parameters in mammalian cell culture bioreactors using an in-line Raman spectroscopy probe. Biotechnol. Bioeng. 2011, 108, 1215–1221. [Google Scholar] [CrossRef]
  18. Webster, T.A.; Hadley, B.C.; Hilliard, W.; Jaques, C.; Mason, C. Development of generic raman models for a GS-KOTM CHO platform process. Biotechnol. Prog. 2018, 34, 730–737. [Google Scholar] [CrossRef]
  19. Craven, S.J.; Whelan, J.; Glennon, B. Glucose concentration control of a fed-batch mammalian cell bioprocess using a nonlinear model predictive controller. J. Process Control 2014, 24, 344–357. [Google Scholar] [CrossRef]
  20. Rafferty, C.; O’Mahony, J.; Burgoyne, B.; Rea, R.; Balss, K.M.; Latshaw, D.C. Raman spectroscopy as a method to replace off-line pH during mammalian cell culture processes. Biotechnol. Bioeng. 2020, 117, 146–156. [Google Scholar] [CrossRef]
  21. Li, M.Y.; Ebel, B.; Blanchard, F.; Paris, C.; Guedon, E.; Marc, A. Control of IgG glycosylation by in situ and real-time estimation of specific growth rate of CHO cells cultured in bioreactor. Biotechnol. Bioeng. 2019, 116, 985–993. [Google Scholar] [CrossRef]
  22. Hong, P.; Koza, S.; Bouvier, E.S.P. A review size exclusion chromatography for the analysis of protein biotherapeutics and their aggregates. J. Liq. Chromatogr. Relat. Technol. 2012, 35, 2923–2950. [Google Scholar] [CrossRef] [Green Version]
  23. Fekete, S.; Beck, A.; Veuthey, J.L.; Guillarme, D. Theory and practice of size exclusion chromatography for the analysis of protein aggregates. J. Pharm. Biomed. Anal. 2014, 101, 161–173. [Google Scholar] [CrossRef]
  24. Swartz, M.E. UPLC™: An Introduction and Review. J. Liq. Chromatogr. Relat. Technol. 2005, 28, 1253–1263. [Google Scholar] [CrossRef]
  25. Bouvier, E.S.P.; Koza, S.M. Advances in size-exclusion separations of proteins and polymers by UHPLC. TrAC Trends Anal. Chem. 2014, 63, 85–94. [Google Scholar] [CrossRef] [Green Version]
  26. Haberger, M.; Leiss, M.; Heidenreich, A.K.; Pester, O.; Hafenmair, G.; Hook, M.; Bonnington, L.; Wegele, H.; Haindl, M.; Reusch, D.; et al. Rapid characterization of biotherapeutic proteins by size-exclusion chromatography coupled to native mass spectrometry. mAbs 2016, 8, 331–339. [Google Scholar] [CrossRef] [PubMed]
  27. Madadkar, P.; Umatheva, U.; Hale, G.; Durocher, Y.; Ghosh, R. Ultrafast Separation and Analysis of Monoclonal Antibody Aggregates Using Membrane Chromatography. Anal. Chem. 2017, 89, 4716–4720. [Google Scholar] [CrossRef] [Green Version]
  28. Tiwari, A.; Kateja, N.; Chanana, S.; Rathore, A.S. Use of HPLC as an Enabler of Process Analytical Technology in Process Chromatography. Anal. Chem. 2018, 90, 7824–7829. [Google Scholar] [CrossRef]
  29. Patel, B.A.; Pinto, N.D.; Gospodarek, A.; Kilgore, B.; Goswami, K.; Napoli, W.N.; Desai, J.; Heo, J.H.; Panzera, D.; Pollard, D.; et al. On-Line Ion Exchange Liquid Chromatography as a Process Analytical Technology for Monoclonal Antibody Characterization in Continuous Bioprocessing. Anal. Chem. 2017, 89, 11357–11365. [Google Scholar] [CrossRef]
  30. Heo, J.H.; Heo, J.H.; Mou, X.; Wang, F.; Troisi, J.M.; Christopher, W.S.; Kirby, S.; Driscoll, D.; Mercorelli, S.; Pollard, D.J. A microfluidic approach to high throughput quantification of host cell protein impurities for bioprocess development. Pharm. Bioprocess. 2014, 2, 129–139. [Google Scholar] [CrossRef]
  31. Kumar, M.A.; Mazlomi, M.A.; Hedström, M.; Mattiasson, B. Versatile automated continuous flow system (VersAFlo) for bioanalysis and bioprocess control. Sens. Actuators B Chem. 2012, 161, 855–861. [Google Scholar] [CrossRef]
  32. Rüdt, M.; Briskot, T.; Hubbuch, J. Advances in downstream processing of biologics—Spectroscopy: An emerging process analytical technology. J. Chromatogr. A 2017, 1490, 2–9. [Google Scholar] [CrossRef] [Green Version]
  33. Rolinger, L.; Rüdt, M.; Hubbuch, J. A critical review of recent trends, and a future perspective of optical spectroscopy as PAT in biopharmaceutical downstream processing. Anal. Bioanal. Chem. 2020, 412, 2047–2064. [Google Scholar] [CrossRef] [Green Version]
  34. Rüdt, M.; Brestrich, N.; Rolinger, L.; Hubbuch, J. Real-time monitoring and control of the load phase of a protein a capture step. Biotechno. Bioeng. 2017, 114, 368–373. [Google Scholar] [CrossRef] [PubMed]
  35. Brestrich, N.; Ruedt, M.; Buechler, D.; Hubbuch, J. Selective protein quantification for preparative chromatography using variable pathlength UV/Vis spectroscopy and partial least squares regression. Chem. Eng. Sci. 2018, 176, 157–164. [Google Scholar] [CrossRef]
  36. Rolinger, L.; Ruedt, M.; Diehm, J.; Chow-Hubbertz, J.; Heitmann, M.; Schleper, S.; Hubbuch, J. Multi-attribute PAT for UF/DF of Proteins—Monitoring Concentration, particle sizes, and Buffer Exchange. Anal. Bioanal. Chem. 2020, 412, 2123–2136. [Google Scholar] [CrossRef]
  37. Thakur, G.; Hebbi, V.; Rathore, A.S. An NIR-based PAT approach for real-time control of loading in Protein a chromatography in continuous manufacturing of monoclonal antibodies. Biotechnol. Bioeng. 2020, 117, 673–686. [Google Scholar] [CrossRef]
  38. Capito, F.; Skudas, R.; Kolmar, H.; Hunzinger, C. At-line mid infrared spectroscopy for monitoring downstream processing unit operations. Process Biochem. 2015, 50, 997–1005. [Google Scholar] [CrossRef]
  39. Walch, N.; Scharl, T.; Felföldi, E.; Sauer, D.G.; Melcher, M.; Leisch, F.; Dürauer, A.; Jungbauer, A. Prediction of the Quantity and Purity of an Antibody Capture Process in Real Time. Biotechnol. J. 2019, 14, 1800521. [Google Scholar] [CrossRef]
  40. André, S.; Cristau, L.S.; Gaillard, S.; Devos, O.; Calvosa, É.; Duponchel, L. In-line and real-time prediction of recombinant antibody titer by in situ Raman spectroscopy. Anal. Chim. Acta 2015, 892, 148–152. [Google Scholar] [CrossRef]
  41. Feidl, F.; Garbellini, S.; Vogg, S.; Sokolov, M.; Souquet, J.; Broly, H.; Butté, A.; Morbidelli, M. A new flow cell and chemometric protocol for implementing in-line Raman spectroscopy in chromatography. Biotechnol. Prog. 2019, 35, e2847. [Google Scholar] [CrossRef] [PubMed]
  42. Feidl, F.; Garbellini, S.; Luna, M.F.; Vogg, S.; Souquet, J.; Broly, H.; Morbidelli, M.; Butté, A. Combining Mechanistic Modeling and Raman Spectroscopy for Monitoring Antibody Chromatographic Purification. Processes 2019, 7, 683. [Google Scholar] [CrossRef] [Green Version]
  43. Yilmaz, D.; Mehdizadeh, H.; Navarro, D.; Shehzad, A.; O’Connor, M.; McCormick, P. Application of Raman spectroscopy in monoclonal antibody producing continuous systems for downstream process intensification. Biotechnol. Prog. 2019, 36, e2947. [Google Scholar] [CrossRef]
  44. Chmielowski, R.A.; Mathiasson, L.; Blom, H.; Go, D.; Ehring, H.; Khan, H.; Li, H.; Cutler, C.; Lacki, K.; Tugcu, N.; et al. Definition and dynamic control of a continuous chromatography process independent of cell culture titer and impurities. J. Chromatogr. A 2017, 1526, 58–69. [Google Scholar] [CrossRef] [PubMed]
  45. Zhou, C.; Qi, W.; Lewis, E.N.; Carpenter, J.F. Concomitant Raman spectroscopy and dynamic light scattering for characterization of therapeutic proteins at high concentrations. Anal. Biochem. 2015, 472, 7–20. [Google Scholar] [CrossRef] [PubMed] [Green Version]
  46. Gómez de la Cuesta, R.; Goodacre, R.; Ashton, L. Monitoring Antibody Aggregation in Early Drug Development Using Raman Spectroscopy and Perturbation-Correlation Moving Windows. Anal. Chem. 2014, 86, 11133–11140. [Google Scholar] [CrossRef] [PubMed]
  47. Paidi, S.K.; Siddhanta, S.; Strouse, R.; McGivney, J.B.; Larkin, C.; Barman, I. Rapid Identification of Biotherapeutics with Label-Free Raman Spectroscopy. Anal. Chem. 2016, 88, 4361–4368. [Google Scholar] [CrossRef]
  48. Zhang, C.; Springall, J.S.; Wang, X.; Barman, I. Rapid, quantitative determination of aggregation and particle formation for antibody drug conjugate therapeutics with label-free Raman spectroscopy. Anal. Chim. Acta 2019, 1081, 138–145. [Google Scholar] [CrossRef] [PubMed]
  49. Ashton, L.; Brewster, V.L.; Correa, E.; Goodacre, R. Detection of glycosylation and iron-binding protein modifications using Raman spectroscopy. Analyst 2017, 142, 808–814. [Google Scholar] [CrossRef] [Green Version]
  50. Brewster, V.L.; Ashton, L.; Goodacre, R. Monitoring the glycosylation status of proteins using Raman spectroscopy. Anal. Chem. 2011, 83, 6074–6081. [Google Scholar] [CrossRef]
  51. Cowcher, D.P.; Deckert-Gaudig, T.; Brewster, V.L.; Ashton, L.; Deckert, V.; Goodacre, R. Detection of protein glycosylation using tip-enhanced Raman scattering. Anal. Chem. 2016, 88, 2105–2112. [Google Scholar] [CrossRef] [Green Version]
  52. Capito, F.; Skudas, R.; Kolmar, H.; Stanislawski, B. Host cell protein quantification by fourier transform mid infrared spectroscopy (FT-MIR). Biotechnol. Bioeng. 2013, 110, 252–259. [Google Scholar] [CrossRef]
  53. Virtanen, T.; Reinikainen, S.P.; Kögler, M.; Mänttäri, M.; Viitala, T.; Kallioinen, M. Real-time fouling monitoring with Raman spectroscopy. J. Membr. Sci. 2017, 525, 312–319. [Google Scholar] [CrossRef]
  54. Kojima, T.; Tsutsumi, S.; Yamamoto, K.; Ikeda, Y.; Moriwaki, T. High-throughput cocrystal slurry screening by use of in situ Raman microscopy and multi-well plate. Int. J. Pharm. 2010, 399, 52–59. [Google Scholar] [CrossRef] [PubMed]
  55. Medipally, D.K.; Maguire, A.; Bryant, J.; Armstrong, J.; Dunne, M.; Finn, M.; Lyng, F.M.; Meade, A.D. Development of a high throughput (HT) Raman spectroscopy method for rapid screening of liquid blood plasma from prostate cancer patients. Analyst 2017, 142, 1216–1226. [Google Scholar] [CrossRef] [PubMed] [Green Version]
  56. Qi, J.; Shih, W.C. Performance of line-scan Raman microscopy for high-throughput chemical imaging of cell population. Appl. Opt. 2014, 53, 2881–2885. [Google Scholar] [CrossRef] [PubMed]
  57. Schie, I.W.; Rüger, J.; Mondol, A.S.; Ramoji, A.; Neugebauer, U.; Krafft, C.; Popp, J. High-Throughput Screening Raman Spectroscopy Platform for Label-Free Cellomics. Anal. Chem. 2018, 90, 2023–2030. [Google Scholar] [CrossRef] [PubMed]
  58. Le Losq, C. Rampy: A Python Library for Processing Spectroscopic (IR, Raman, XAS) Data; Zenodo: Geneva, Switzerland, 2018. [Google Scholar]
  59. Wold, S.; Geladi, P.; Esbensen, K.; Öhman, J. Multi-way principal components-and PLS-analysis. J. Chemom. 1987, 1, 41–56. [Google Scholar] [CrossRef]
  60. Rowland-Jones, R.C.; Jaques, C. At-line raman spectroscopy and design of experiments for robust monitoring and control of miniature bioreactor cultures. Biotechnol. Prog. 2019, 35, e2740. [Google Scholar] [CrossRef]
  61. Berry, B.; Moretto, J.; Matthews, T.; Smelko, J.; Wiltberger, K. Cross-scale predictive modeling of CHO cell culture growth and metabolites using Raman spectroscopy and multivariate analysis. Biotechnol. Prog. 2015, 31, 566–577. [Google Scholar] [CrossRef]
  62. Vasko, P.D.; Blackwell, J.; Koenig, J.L. Infrared and raman spectroscopy of carbohydrates: Part I: Identification of OH and CH-related vibrational modes for D-glucose, maltose, cellobiose, and dextran by deuterium-substitution methods. Carbohydr. Res. 1971, 19, 297–310. [Google Scholar] [CrossRef]
  63. Mathlouthi, M.; Vinh Luu, D. Laser-raman spectra of d-glucose and sucrose in aqueous solution. Carbohydr. Res. 1980, 81, 203–212. [Google Scholar] [CrossRef]
  64. Söderholm, S.; Roos, Y.H.; Meinander, N.; Hotokka, M. Raman spectra of fructose and glucose in the amorphous and crystalline states. J. Raman Spectrosc. 1999, 30, 1009–1018. [Google Scholar] [CrossRef]
  65. Singh, G.P.; Goh, S.; Canzoneri, M.; Ram, R.J. Raman spectroscopy of complex defined media: Biopharmaceutical applications. J. Raman Spectrosc. 2015, 46, 545–550. [Google Scholar] [CrossRef]
  66. Barrett, T.W. Laser Raman spectra of mono-, oligo- and polysaccharides in solution. Spectrochim. Acta Part A Mol. Spectrosc. 1981, 37, 233–239. [Google Scholar] [CrossRef]
  67. De Gelder, J.; De Gussem, K.; Vandenabeele, P.; Moens, L. Reference database of Raman spectra of biological molecules. J. Raman Spectrosc. 2007, 38, 1133–1147. [Google Scholar] [CrossRef]
  68. Kačuráková, M.; Mathlouthi, M. FTIR and laser-Raman spectra of oligosaccharides in water: Characterization of the glycosidic bond. Carbohydr. Res. 1996, 284, 145–157. [Google Scholar] [CrossRef]
  69. Rhiel, M.H.; Amrhein, M.I.; Marison, I.W.; Stockar, U. The Influence of Correlated Calibration Samples on the Prediction Performance of Multivariate Models Based on Mid-Infrared Spectra of Animal Cell Cultures. Anal. Chem. 2002, 74, 5227–5236. [Google Scholar] [CrossRef]
  70. Cassanas, G.; Morssli, M.; Fabregue, E.; Bardet, L. Vibrational spectra of lactic acid and lactates. J. Raman Spectrosc. 1991, 22, 409–413. [Google Scholar] [CrossRef]
  71. Pecul, M.; Rizzo, A.; Leszczynski, J. Vibrational Raman and Raman Optical Activity Spectra of d-Lactic Acid, d-Lactate, and d-Glyceraldehyde:  Ab Initio Calculations. J. Phys. Chem. A 2002, 106, 11008–11016. [Google Scholar] [CrossRef]
  72. Kengne-Momo, R.P.; Daniel, P.; Lagarde, F.; Jeyachandran, Y.L.; Pilard, J.F.; Durand-Thouand, M.J.; Thouand, G. Protein interactions investigated by the Raman spectroscopy for biosensor applications. Int. J. Spectrosc. 2012, 2012, 462901. [Google Scholar] [CrossRef]
  73. Painter, P.C.; Koenig, J.L. Raman spectroscopic study of the structure of antibodies. Biopolymers 1975, 14, 457–468. [Google Scholar] [CrossRef]
  74. Carey, P.R. CHAPTER 4—Protein Conformation from Raman and Resonance Raman Spectra. In Biochemical Applications of Raman and Resonance Raman Spectroscopes; Carey, P.R., Ed.; Academic Press: Cambridge, MA, USA, 1982; pp. 71–98. [Google Scholar]
Figure 1. Raman spectroscopy model generation workflow defining the primary steps to ensure that a robust MVDA model is generated. SNV = standard normal variate, RMSE = root mean square, and RMSEP = root mean square error of prediction, MVDA = multivariate data analysis.
Processes 08 01179 g001
Figure 2. Time series plots of off-line analytics recorded on a micro-bioreactor system for (A) glucose concentration, (B) viable cell density (VCD) concentration, (C) lactate concentration, and (D) antibody concentration. Cell line A is indicated by the solid lines with the red lines and squares representing the calibration cell cultures: 1–5 and 7–11. The validation runs are indicated by the blue lines with diamonds, and represent cell cultures 6 and 12. Cell line B is indicated by the dashed lines with the green lines and squares representing the calibration cell cultures: 13–17 and 19–23. The validation runs are indicated by the yellow lines with diamonds and represent cell cultures 18 and 24. The micro-bioreactor system had 24 parallel bioreactors with an initial working volume of 13.5 mL, operated using a pH set-point of 7, DO2 concentrations of between 10–40%, and a temperature maintained at 35.5 °C.
Processes 08 01179 g002
Figure 3. Raman spectra recorded by the high-throughput Raman spectroscopy microscope for each of the 24 micro-bioreactor cell culture runs on day 0–10 shown in the form of (A) the raw spectral data and (B) the baseline-corrected spectra, using a 1st order polynomial function followed by the application of a standard normal variate (SNV) scattering scatter algorithm and a Savitzky–Golay smoothing filter. Each spectrum was generated using 5 accumulations each with a 30 s acquisition time, recorded using 10% laser power (30 mW).
Processes 08 01179 g003
Figure 4. Parity plots demonstrating the prediction performance of four separate PLS models, highlighting the calibration and validation data sets of cell line A and B for (A) glucose concentration, (B) viable cell density (VCD), (C) lactate concentration, and (D) antibody concentration. Four separate PLS models were built utilising 7 latent variables for each variable investigated, and calibrated using cell culture runs 1–5 and 7–11 from cell line A (indicated by the red squares) and runs 13–17 and 19–23 from cell line B (indicated by the green squares). The model was validated using cell culture runs 6 and 12 from cell line A (indicated by the blue diamonds) and runs 18 and 24 from cell line B (indicated by the yellow diamonds). The spectral data utilised in each PLS model were baseline-corrected spectra using a 1st order polynomial function, followed by the application of an SNV scattering scatter algorithm and a Savitzky–Golay smoothing filter.
Processes 08 01179 g004
Figure 5. PLS regression coefficients (β) of each PLS model generated for (A) glucose, (B) viable cell density, (C) lactate, and (D) antibodies, with the wavenumbers corresponding to the Raman molecular signature of each variable highlighted by the shaded areas. The cut-off points for these PLS regression coefficients are glucose: β > 0.02; VCD: β > 0.2; lactate: β > 0.05; and antibody: β > 0.015. The spectral data utilised in each PLS model were baseline-corrected spectra using a 1st order polynomial function, followed by the application of an SNV scattering scatter algorithm and a Savitzky–Golay smoothing filter.
Processes 08 01179 g005
Figure 6. Prediction performance of the PLS model predicting product concentration with (A) displaying a parity plot for validation set T1, (B) parity plot for calibration set P1, (C) parity plot for calibration set P2, and (D) confusion matrix that classifies the product concentration predictions above or below 1.5 g L−1 in comparison to the experimental product concentrations. In the confusion matrix (D), the top left cell indicates true positives, the top middle cell indicates false positives, the middle left cell indicates false negatives, and the middle cell indicates true negatives. In each of these matrix cells, the value indicates the number and percentage of samples in each category. In the total matrix cell columns and rows, the total number of samples is given, with the percentage indicating the number of true positives or true negatives.
Processes 08 01179 g006
Figure 7. Prediction performance of the PLS model predicting the monomer purity of the fusion protein with (A) displaying a parity plot for validation set T1, (B) parity plot for calibration set P1, (C) parity plot for calibration set P2, and (D) confusion matrix that classifies the monomer purity predictions above or below 90% in comparison to the experimental monomer purity. In the confusion matrix (D), the top left cell indicates true positives, the top middle cell indicates false positives, the middle left cell indicates false negatives, and the middle cell indicates true negatives. In each of these matrix cells, the value indicates the number and percentage of samples in each category. In the total matrix cell columns and rows, the total number of samples is given, with the percentage indicating the number of true positives or true negatives.
Processes 08 01179 g007
Figure 8. PLS regression coefficient ( β ) plots for each PLS model generated for (A) the monomer purity model and (B) product concentration, with the wavenumbers corresponding to the Raman molecular signature of each variable highlighted by the shaded areas. The cut-off points for these PLS regression coefficients are product: β > 0.005; monomer β > 0.075. The PLS model for monomer purity was developed using the raw spectra. The PLS model for the product concentration was developed using spectra that was baseline-corrected using a 1st order polynomial function, followed by the application of an SNV scattering scatter algorithm and a Savitzky–Golay smoothing filter. The PLS model for product concentration utilised 7 latent variables and the model for monomer purity utilised 8 latent variables.
Processes 08 01179 g008
Figure 9. Comparison of acquisition settings of the spectra recorded by HT Raman spectroscopy microscope using polypropylene plates (in black) compared to the improved acquisition settings using stainless steel (SS) plates, a higher laser power, and higher magnification objective (in red).
Processes 08 01179 g009
Table 1. Summary of the partial least squares (PLS) latent variable selection and model statistics for the off-line variables of glucose, VCD, lactate, and antibody concentration.
Off-Line VariableLatent Variable SelectionCalibration (RMSE)Validation (RMSEP)Calibration (R2)Validation (R2)
Glucose
(g L−1)
70.190.380.970.88
VCD
(1 × 10⁶ cells mL−1)
71.783.490.990.96
Lactate
(g L−1)
70.591.160.960.94
Antibody
(g L−1)
70.170.090.990.94
Note: RMSE = root mean square error, RMSEP = root mean square error of prediction.
Table 3. Summary of monomer purity and product concentration model fit (R2), RMSE of calibration set, and RMSEP of two validation sets.
Statistical Measure of FitCalibration (T1)Validation (P1)Validation (P2)
Product concentration (mg mL−1)
R20.990.990.98
RMSE/RMSEP0.161.093.62
Monomer concentration (%)
R20.980.860.34
RMSE/RMSEP1.094.2713.68
Note: RMSE = root mean square error (used for calibration), RMSEP = root mean square error of prediction (used for validation).
Table 4. PLS dominant regression peaks of protein and IgG aggregates associated with monomer and product concentrations and their corresponding Raman spectroscopy vibrational signatures, based on previous literature values detailing reference wavenumbers for the variables of interest.
VariablePLS Regression Peak (β) Wavenumber [cm−1]
[DSP Model]
Reference Wavenumber of Analyte [cm−1]AssignmentReference
Protein ****
(Fc-fusion *****)
startmaxend
757758Trp[72]
759[73]
10031002Phe[74]
1004[72]
1005[73]
1029---
12081210Tyr; Phe
12361239Amide III[74]
1243[72]
13371340Amide III[73]
14471450CH2 def[73]
1451[72]
15531552Trp[72]
1554[73]
16731673Amide I[74]
Protein aggregate831863901830; 850Tyr[45]
878Tyr[73]
143714481446-Tyr[45]
Tyr[73]
Note: Trp = Tryptophan, Tyr = Tyrosine, Phe = Phenylalanine. **** Cut-off points for PLS regression coefficients product β > 0.0025; monomer β > 0.05. ***** Approximate assignment, as reference peaks correspond to human IgG, whereas the investigated protein is an Fc-fusion protein.

