Article

Implementation of Common Rail Direct Injection System and Optimization of Fuel Injector Parameters in an Experimental Single-Cylinder Diesel Engine

1
School of Mechanical Engineering, Universiti Sains Malaysia, Engineering Campus, Nibong Tebal 14300, Penang, Malaysia
2
Department of Engineering, School of Engineering, Computing and Built Environment, UOW Malaysia KDU Penang University College, 32 Jalan Anson, Georgetown 10400, Penang, Malaysia
3
NI Malaysia Sdn. Bhd., No. 8, Lebuh Batu Maung 1, Bayan Lepas 11960, Penang, Malaysia
4
Division of Computational Mechatronics, Institute for Computational Science, Ton Duc Thang University, Ho Chi Minh City 760310, Vietnam
5
Faculty of Electrical & Electronics Engineering, Ton Duc Thang University, Ho Chi Minh City 760310, Vietnam
6
Department of Mechatronics Engineering Technology, Ho Chi Minh City University of Food Industry, 140 Le Trong Tan Street, Tan Phu District, Ho Chi Minh City 760310, Vietnam
*
Authors to whom correspondence should be addressed.
Processes 2020, 8(9), 1122; https://doi.org/10.3390/pr8091122
Submission received: 6 August 2020 / Revised: 3 September 2020 / Accepted: 7 September 2020 / Published: 9 September 2020
(This article belongs to the Special Issue Applications of Process Control in Energy Systems)

Abstract

:
The diesel engine is one of the solutions to slow down fossil fuel depletion due to its high efficiency. However, its high pollutant emission limits its usage in many fields. To improve its efficiency and emissions, a conventional mechanical fuel injection system (MFI) was be replaced with common rail direct injection (CRDI) system for the purpose of this study. In this way, injection parameters such as injection timing, injection pressure and multiple injection schemes can be tuned to enhance the engine performance. The rail pressure and engine speed response of the modified diesel engine was tested. It was found that by advancing the start of injection timing (SOI) timing or increasing the rail pressure, the brake torque generated can be increased. Multiple injection schemes can be implemented to reduce the peak heat release rate (HRR). Post injection was observed to increase the late combustion HRR. The maximum pressure rise rate (PRR) can be reduced by applying pilot injection. Further research was conducted on optimizing fuel injector parameters to improve the indicated mean effective pressure (IMEP) consistency and reduce injector power consumption. The consistency of IMEP was indicated by coefficient of variation (CoV) of IMEP. The injector parameters included open time, low time and duty cycle of injector signals. These parameters were optimized by carrying out response surface methodology. The optimized parameters were observed to be 230 µs for open time, 53µs for low time and 27.5% for duty cycle. The percentage of error of CoV of IMEP and injector power were found to be lower than 5% when the predicted results are compared with experimental results.

1. Introduction

Energy is now an essential to our life nowadays. The demand of energy worldwide has increased rapidly due to the growth in population, technology development and industrialization. The world population is estimated to reach 9.2 billion in 2040, which will further increase to 11.2 billion in 2100 [1]. The additional number of people will require more energy. The global energy demand is estimated to increase by about 25% from 2016 to 2040 [2]. The demand growth will come from non- Organisation for Economic Co-operation and Development (OECD) country and lead by China and India, where the energy demand is expected to increase by roughly 40%. It is forecasted that, in ASEAN, the contribution of fossil fuel to the total energy demand will increase from 643 Million tons of oil equivalent (Mtoe) in 2016 to 1133 Mtoe in 2040, with an average annual growth rate of 2.1%. With the increase in energy consumption, the usage of fossil fuels will rise. Coal and oil demand will increase by 40% while natural gas demand will increase by 60% over the same period [3].
Indonesia is predicted to be the fifth largest energy consumer in the world as it will exceed Japan’s energy consumption in 2035 [4]. In general, crude oil, coal and natural gas are the primary source of energy. ASEAN countries are heavily dependent on fossil fuel. Energy demand by sector in ASEAN for 2011 and 2035, the transportation sector is the major consumer of oil with energy demand growth of nearly doubles and the industrial sector is the highest energy consumer. According to the IEA, the energy-related CO2 emission of ASEAN will increase from 1.2 Gt (Giga ton) in 2011 to 2.3 Gt in 2035, which is equivalent to 6.1% of global emission [5]. As in Europe, recently the European Union (EU) energy sector witnessed a fall in energy demand and supply, and lower levels of CO2 emissions and air pollution, amid the sharp reduction of air and road transport and industrial activity as a result of the COVID-19 health crisis [6]. Based on current fossil fuel reserves, coal will be depleted in 115 years, oil and natural gas will be depleted in around 50 years [7]. Solutions have to be taken to prevent the natural resources depletion from occurring. Besides this problem, air pollution is caused by the combustion of fossil fuel. CO2 is the primary greenhouse gas (GHG) contributor and the emission is rapidly increasing in developing and transition countries especially China, India and ASEAN. The total CO2 emission from these countries is responsible for more than 50% of global emissions [8]. However, the EU has been experiencing a steady decline in GHG by 23.45% when compared to GHG values before three decades. Better energy efficiency, higher use of share of renewable energy sources and lower carbon-intensive fuels are said to have aided in the degradation of emissions [9].
Besides the depletion problem, the burning of fossil fuels will cause air pollution. Combustion of fossil fuels produces carbon dioxide (CO2), NOx, unburned HC and volatile organic compounds (VOC) that cause air pollution. The global CO2 emission by source [10] had revealed that the transport CO2 emissions are projected to double between 2010 and 2050 because of a strong increase in demand for cars in developing countries and growth in air transport. If the effect of CO2 emissions on global warming is overlooked, a 2 °C rise in global temperature can cause the loss of up to hundreds of millions of lives [11]. Global warming and climate change are taken seriously by European Union (EU) countries. As a response to the environmental effects due to the transport section, two pathways have been introduced by the EU independently. The first way is to promote the use of biofuels and other renewable fuels for transport to reduce the GHG emissions and the second way is through emission regulations of diesel-powered vehicles [12]. Besides, the modern technology on fast sensing of diesel fuel quality and stability can also open a way to an emission reduction of combustion pollution. This technology is essential as diesel fuels of different quality may require different adjustment in fuel injection parameters. This sensor was proposed by Borecki et al. [13] who claimed that the sensor allows the quality classification of different unknown diesel fuel samples in less than a few minutes with the measurement costs of a single disposable capillary probe and two plugs. Moreover, diesel fuel pollutant emissions can be related to diesel fuel stability and aged diesel fuel use [14].
CI direct injection diesel engine is favorable prime movers due to its high thermal efficiency. The superior thermal efficiency of the CI engine is because of its higher compression ratio. With higher efficiency, the engine can be more fuel saving. Diesel engines have been used widely not only in heavy-duty vehicle and marine transportation, but also in light-duty vehicles, especially in Europe and Japan. However, the CI diesel engine emits high NOx and particular matter (PM) emissions [15]. These emissions cause undesired human health problems [16] and environmental degradation; hence, they are subjected to federal government regulations. It is obvious that the world is facing fossil fuel depletion and climate change crises. A diesel engine incorporated with an advance control system is required to increase the engine efficiency and meet the emissions standards.

1.1. Common Rail Direct Injection (CRDI) System

A diesel engine is one of the internal combustion engines besides petrol engine. Its benefit over the petrol engine is that it is more efficient and has a better fuel economy. It is a suitable candidate to reduce the fossil fuel consumption in transportation fuel. However, diesel engines emits more air pollutants compared to petrol engine. The pollutants include CO2, CO, NOx, HC and soot. To enable the usage of diesel engine in more fields, the pollution problem caused by diesel engine has to be mitigated. The performance of diesel engines is heavily affected by their fuel injection system design. Fuel must be injected in the correct timing and amount into the cylinders. Due to progressively tightened emissions standard, automakers have to come out with new technology to reduce the emissions. Conventional mechanical-type pump–line–nozzle injection system is cam driven. The fuel pressure and injection timing are dependent on engine speed. Therefore, it has some limitations, including injection pressure being dependent on engine speed, low maximum fuel pressure and difficult to achieve multiple injection. The common rail fuel injection system has eliminated cam-driven fuel injection systems and dominated as the primary fuel system. The term “common rail” is used because high pressure fuel is supplied to multiple fuel injectors by a single rail. It offers high degrees of freedom for combustion optimization and has significant advantages. The fuel pressure and injection event are controlled electronically and independently of the engine speed. Besides, the common rail fuel injection system also able to increase the injection pressure to a very high extent (up to 2700 bar for Robert Bosch CRS 3-27 common rail fuel injection system) and helps to improve the engine performance and reduce the harmful emissions [17]. A finer atomization of fuel can be achieved, thus improving air–fuel mixture formation. Multiple injections per cylinders are possible by controlling the signal to injector via ECU. The amount and timing of the injection can be varied, too. These parameters can be adjusted to improve the engine performance and efficiency and reduce the overall exhaust, particulate and noise emissions.

1.2. Prior Studies

With common rail fuel injection system, injection parameters such as injection timing, injection pressure and injection duration can be manipulated to improve the efficiency and emissions of the diesel engine. Various studies have indicated that injection timing retardation reduces NOx emissions [18,19,20,21]. This is because retarding the injection timing reduces the maximum combustion temperature and pressure in the cylinder and hence decreases the formation of NOx. On the other hand, the emission of HC and CO decrease in advanced injection timing. A study performed by Agarwal et al. [22] on the effect of fuel injection timing on a single-cylinder diesel engine using diesel. The results showed that both HC and CO emission decreases, but NOx emission increase significantly with advanced injection timing. Park et al. [23] also reported with advancement in injection timing, both HC and CO emissions reduced significantly. Another important injection parameter is the injection pressure. In general, increasing the injection pressure will improve fuel atomization results in better air–fuel mixing, shorten the ignition delay and give a more complete combustion [24,25,26]. With the increase in injection pressure, the fuel droplet diameter and the variation became smaller [25]. This improves the air fuel mixing and rapid evaporation of fuel that lead to complete combustion and reduces the HC, CO and soot emissions [27,28]. However, the NOx emission increases with the increase of injection pressure [17,29,30]. This is due to a reduction in ignition delay, leading to higher heat released in premixed phase and an increase in the in-cylinder temperature [26,31].
Multiple fuel injection strategies have been proven to reduce the CI engine emission [32,33]. Essentially, introduction of pilot injection can help to reduce the engine noise and NOx emissions [34]. Main injection with fully open needle (rectangular shape) or boost-type shape will also reduce NOx emissions and post injection reduce the soot emissions [35,36]. Zhuang et al. [37] studied the effect of multiple injection strategies in four-cylinder diesel engine. The effects of main injection timing, pilot injection quantity and timing as well as post injection quantity and timing have been investigated. They reported early pilot injection with retarded main injection reduces NOx emissions and combustion noise while retarded main injection with post injection reduce NOx and soot emissions. However, injection quality and timing have to be controlled precisely.
Goldwine [38] has performed conversion of a single-cylinder air-cooled diesel engine with a mechanical injection system into common rail injection system controlled by LabVIEW program. The main modification done was to replace the mechanical injection with common rail injection, but most of the parts were adapted from regular diesel engine parts. The converted system was equipped with a piezoelectric type injector and implemented multiple injection strategy. Ergenç and Koca [39] also modified and converted a single-cylinder diesel engine that injection system was originally mechanically controlled to common rail injection system. They used programmable logic controllers (PLC) as ECU to collect data from sensors and generate signals to injector. A similar but higher cost conversion was done by Andrew L. Carpenter et al. [40]. This converted system was equipped with a production engine control module (ECM) that was programmed using MotoHawk development environment and a standalone injector driver box produced by National Instruments. MotoHawk was a platform that convert Matlab Simulink block diagram into C code language that driven the ECM. This close-loop module was used to monitor and control the engine operation such as injection timing and duration under varying load conditions. A much simpler and low-cost conversion by Avinash Kumar Agarwal et al. [41] has the ability to control the injection timing under constant engine speed of 1500 rpm. The custom-made driver circuit or controller was based on a 555 timer IC that generated signals for fuel injection. The injection timing could be varied from 25–40°CA BTDC (degree crank angle before top dead center) under no load to part load condition. From the literature, it is noticed that conversion to a common rail injection system was normally performed on a single-cylinder engine to the gain ability to control the injection parameters.
Common rail fuel injection system allows the adjustment of injection parameters to be done to improve the efficiency and emissions of diesel engines. These injection parameters include injection timing, injection pressure and split injection scheme. Injection timing is an important parameter to be tuned. Injection can be carried out earlier or later, for a long time or a short time. The difference in SOI and injection duration will produce different combustion and performance characteristics. Various studies have indicated that injection timing retardation reduces NOx emissions [18,19,20,21]. This was because retarding the injection timing reduced the maximum combustion temperature and pressure in the cylinder and hence decreased the formation of NOx. On the other hand, the emission of HC and CO decreased in advanced injection timing. A study was performed by Agarwal et al. [22] on the effect of fuel injection timing on a single-cylinder diesel engine using diesel. The results showed that both HC and CO emission decreased, but NOx emission increased significantly with advanced injection timing. Park et al. [23] also reported that, with advancement in injection timing, both HC and CO emissions reduced significantly. To optimize the performance of injection and engine combustion, the parameters such as open time, low time and duty cycle can be tuned. The optimization is implemented with response surface methodology approach. Traditionally, optimization is carried out by varying a single factor and monitors its effect on the response. The major drawback of this method is that the interactive effects among the variables studied are not included. Therefore, multivariate statistic techniques are preferred. Response surface methodology (RSM) is the most relevant multivariate technique used in optimization. This technique is applied in many engineering fields such as energy applications [42], analytic chemistry [43], the food industry [44] as well as process and product optimization [45]. RSM was developed by Box and his fellow workers in 1950s [46]. RSM comprises of a group of statistical and mathematical technique such as linear or square polynomial functions to model and optimize the response of interest that depends on several significant variables [47].
RSM has been carried out by Yashvir Singh et al. in optimizing the performance and emission parameters of direct injection diesel engine fuelled with pongamia methyl esters [48]. The brake thermal efficiency (BTE), unburnt HC and NOx emissions were optimized by taking rail pressure, injection timing, biodiesel blends percentage and load withstood by engine as input parameters. Abhishek Sharma et al. [49] have applied RSM in optimizing the efficiency of diesel engine which operates using polanga biodiesel blends. Himanshu Patel et al. [50] optimized the BTE, brake-specific fuel consumption (BSFC), unburnt HC, CO and CO2 emission of a variable compression ratio diesel engine with the input parameters of compression ratio, engine load and Jatropha curcas shell biodiesel blends through RSM. Golmohammad Khoobbakht et al. [51] have maximized ethanol biodiesel blended diesel engine’s BTE and minimized BSFC using RSM. Kaliyaperumal Gopal et al. [52] created models of NOx, smoke emission, BTE and BSFC of diesel engine operating with n-octanol diesel blends by employing RSM.

1.3. Motivation of Work

A common rail fuel injection system is widely used in passenger cars and trucks. However, due to the cost issue, a single-cylinder engine equipped with electronically controlled fuel injection system is rarely found. The available single-cylinder diesel engine is equipped with mechanical fuel injection system. This conventional single-injection mechanical fuel injection system is cam driven by predetermined injection parameters. The conversion of fuel injection system and development of engine controller unit (ECU) has to be done to provide flexibility in controlling engine’s injection parameters such as injection timing, injection pressure and number of injections per cycle of operation to enable a more advanced combustion study. In this research, a common rail fuel injection system is developed for a single-cylinder diesel engine equipped with a conventional mechanical fuel injection system. An engine controller unit (ECU) is developed based on Arduino (made in Italy) microcontroller to control the injection timing, injection pressure and number of injections per cycle. The performance of the diesel engine equipped with common rail fuel injection system is evaluated by observing its rail pressure and engine speed response. The combustion characteristics of the diesel engine is investigated by altering the injection SOI timing, rail pressure and multiple injection scheme. The fuel injector parameters of a diesel engine with its conventional mechanical injection system converted into common rail fuel injection system are tuned using RSM. The fuel injector parameters include the open time, low time and duty cycle of the voltage signals. The consistency of IMEP and injector power consumption will be optimized in this study.

2. Experimental Apparatus and Procedure

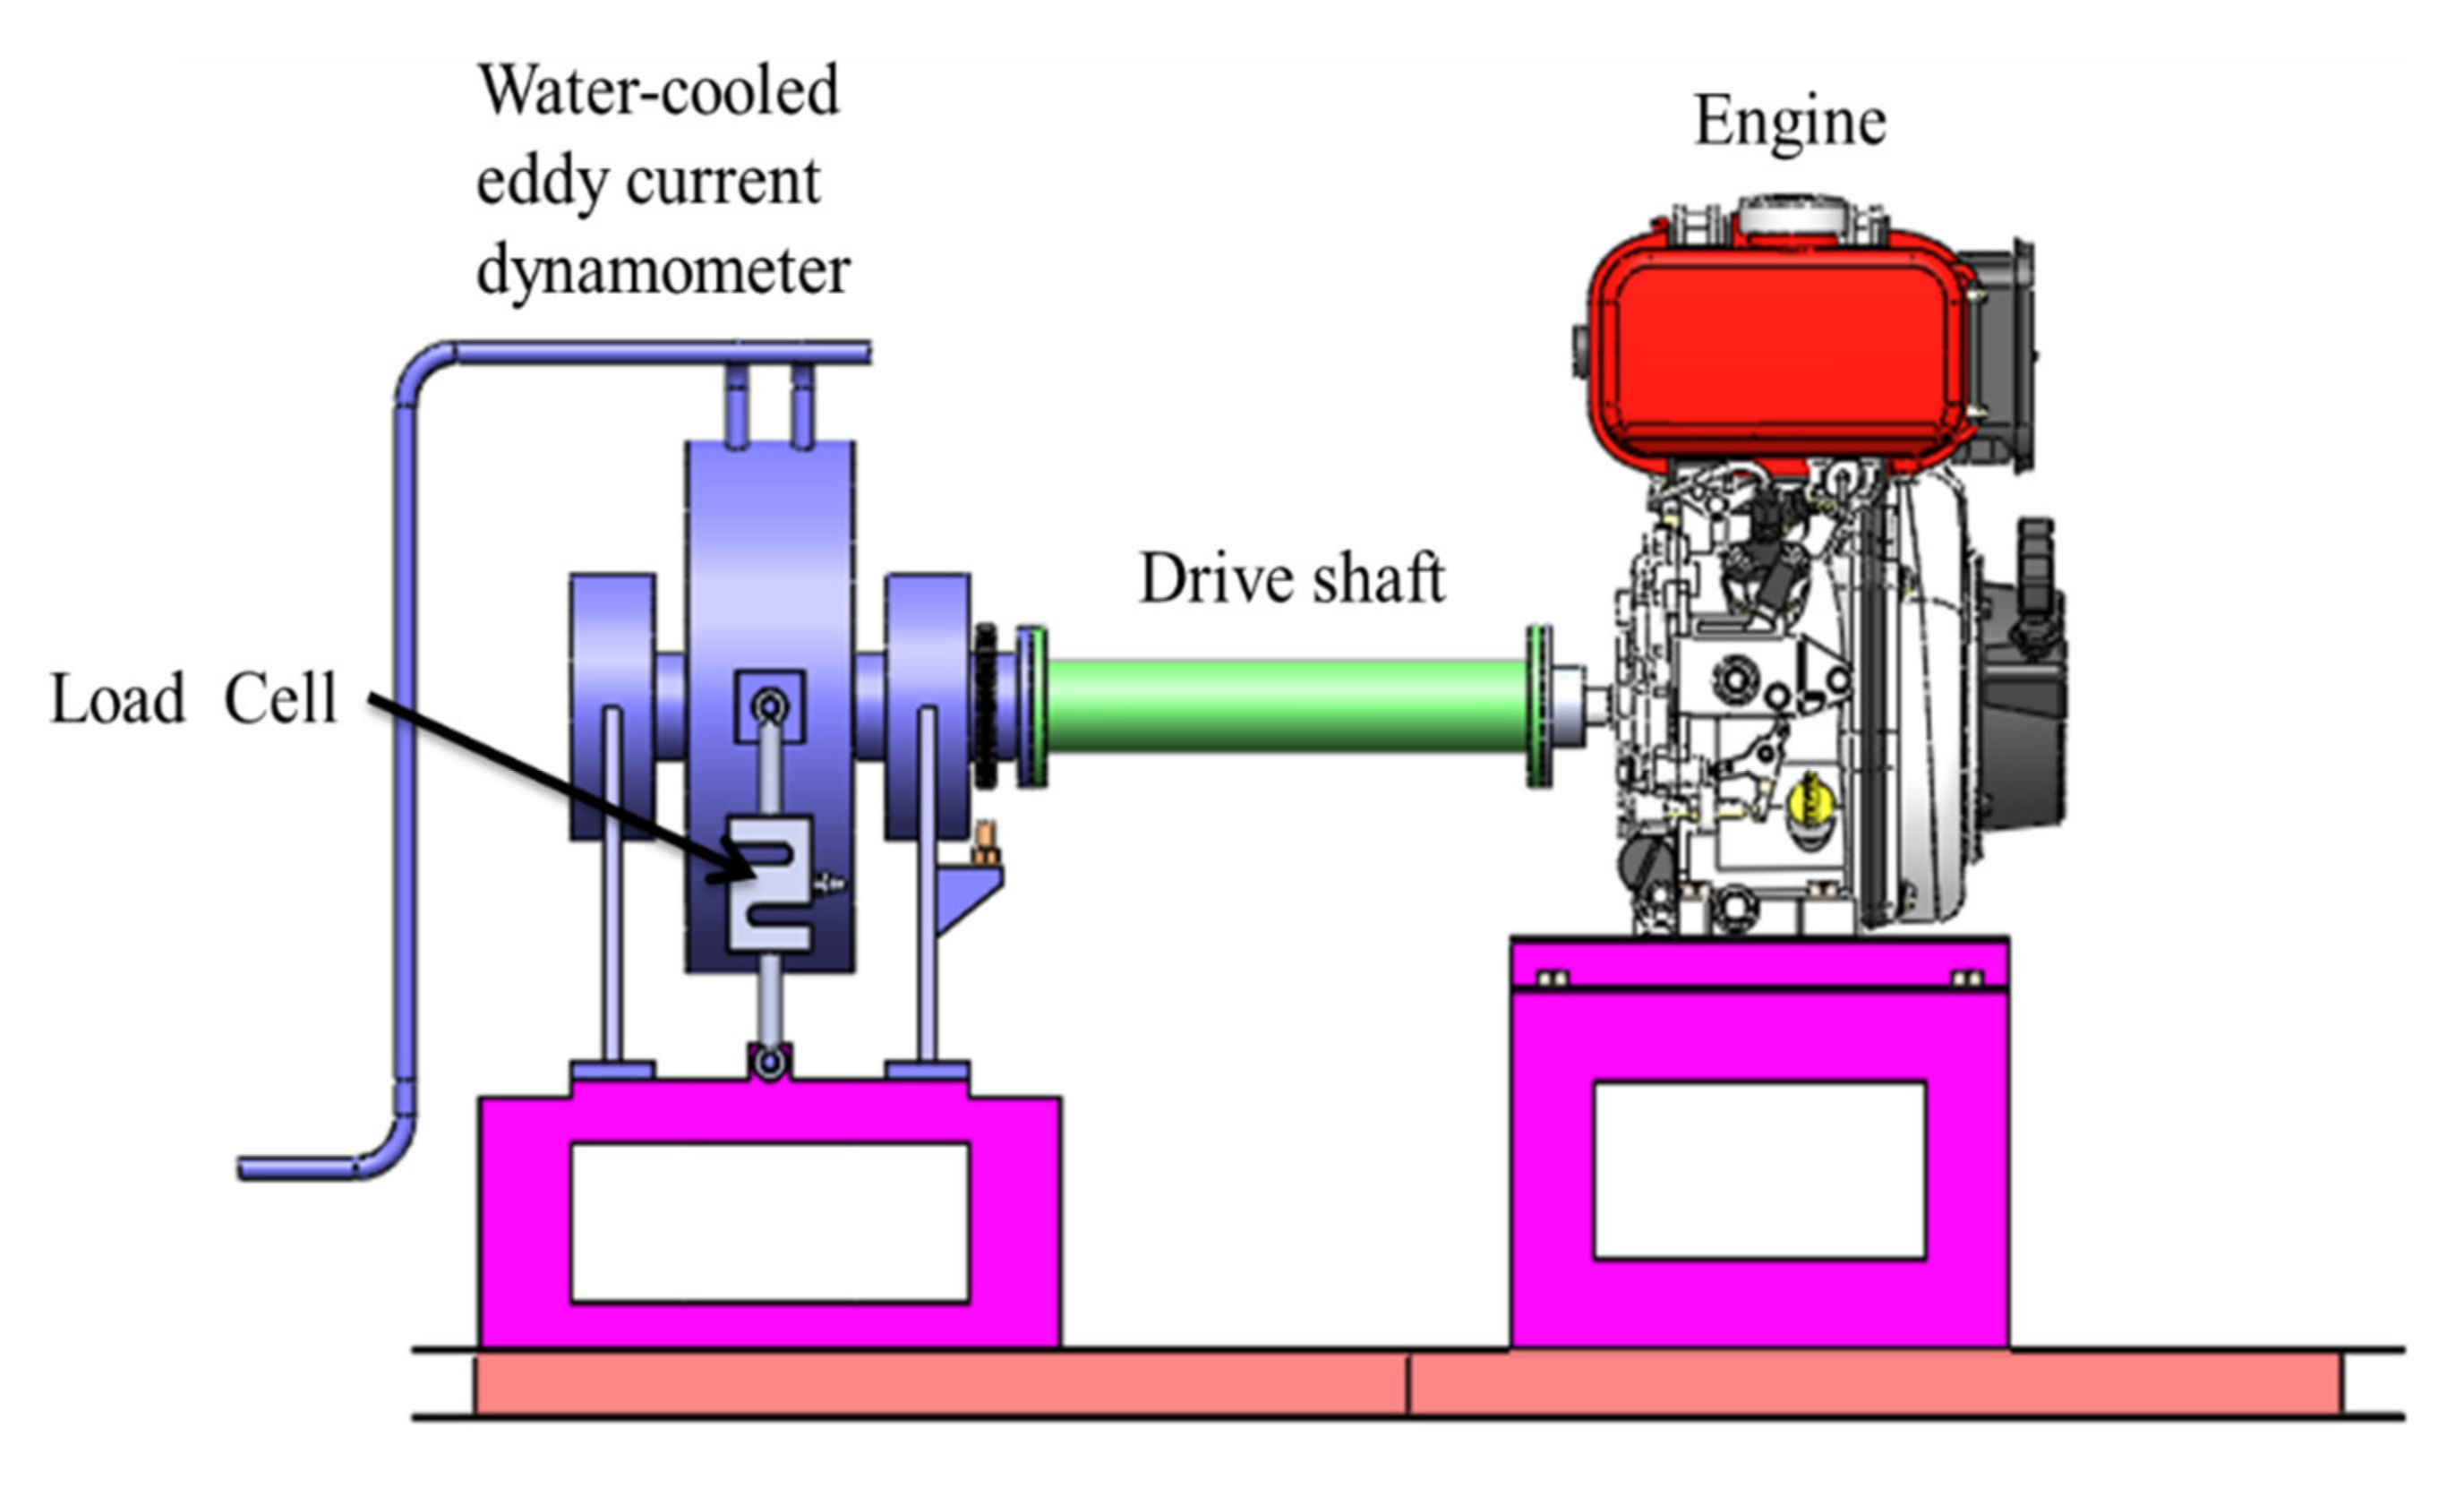
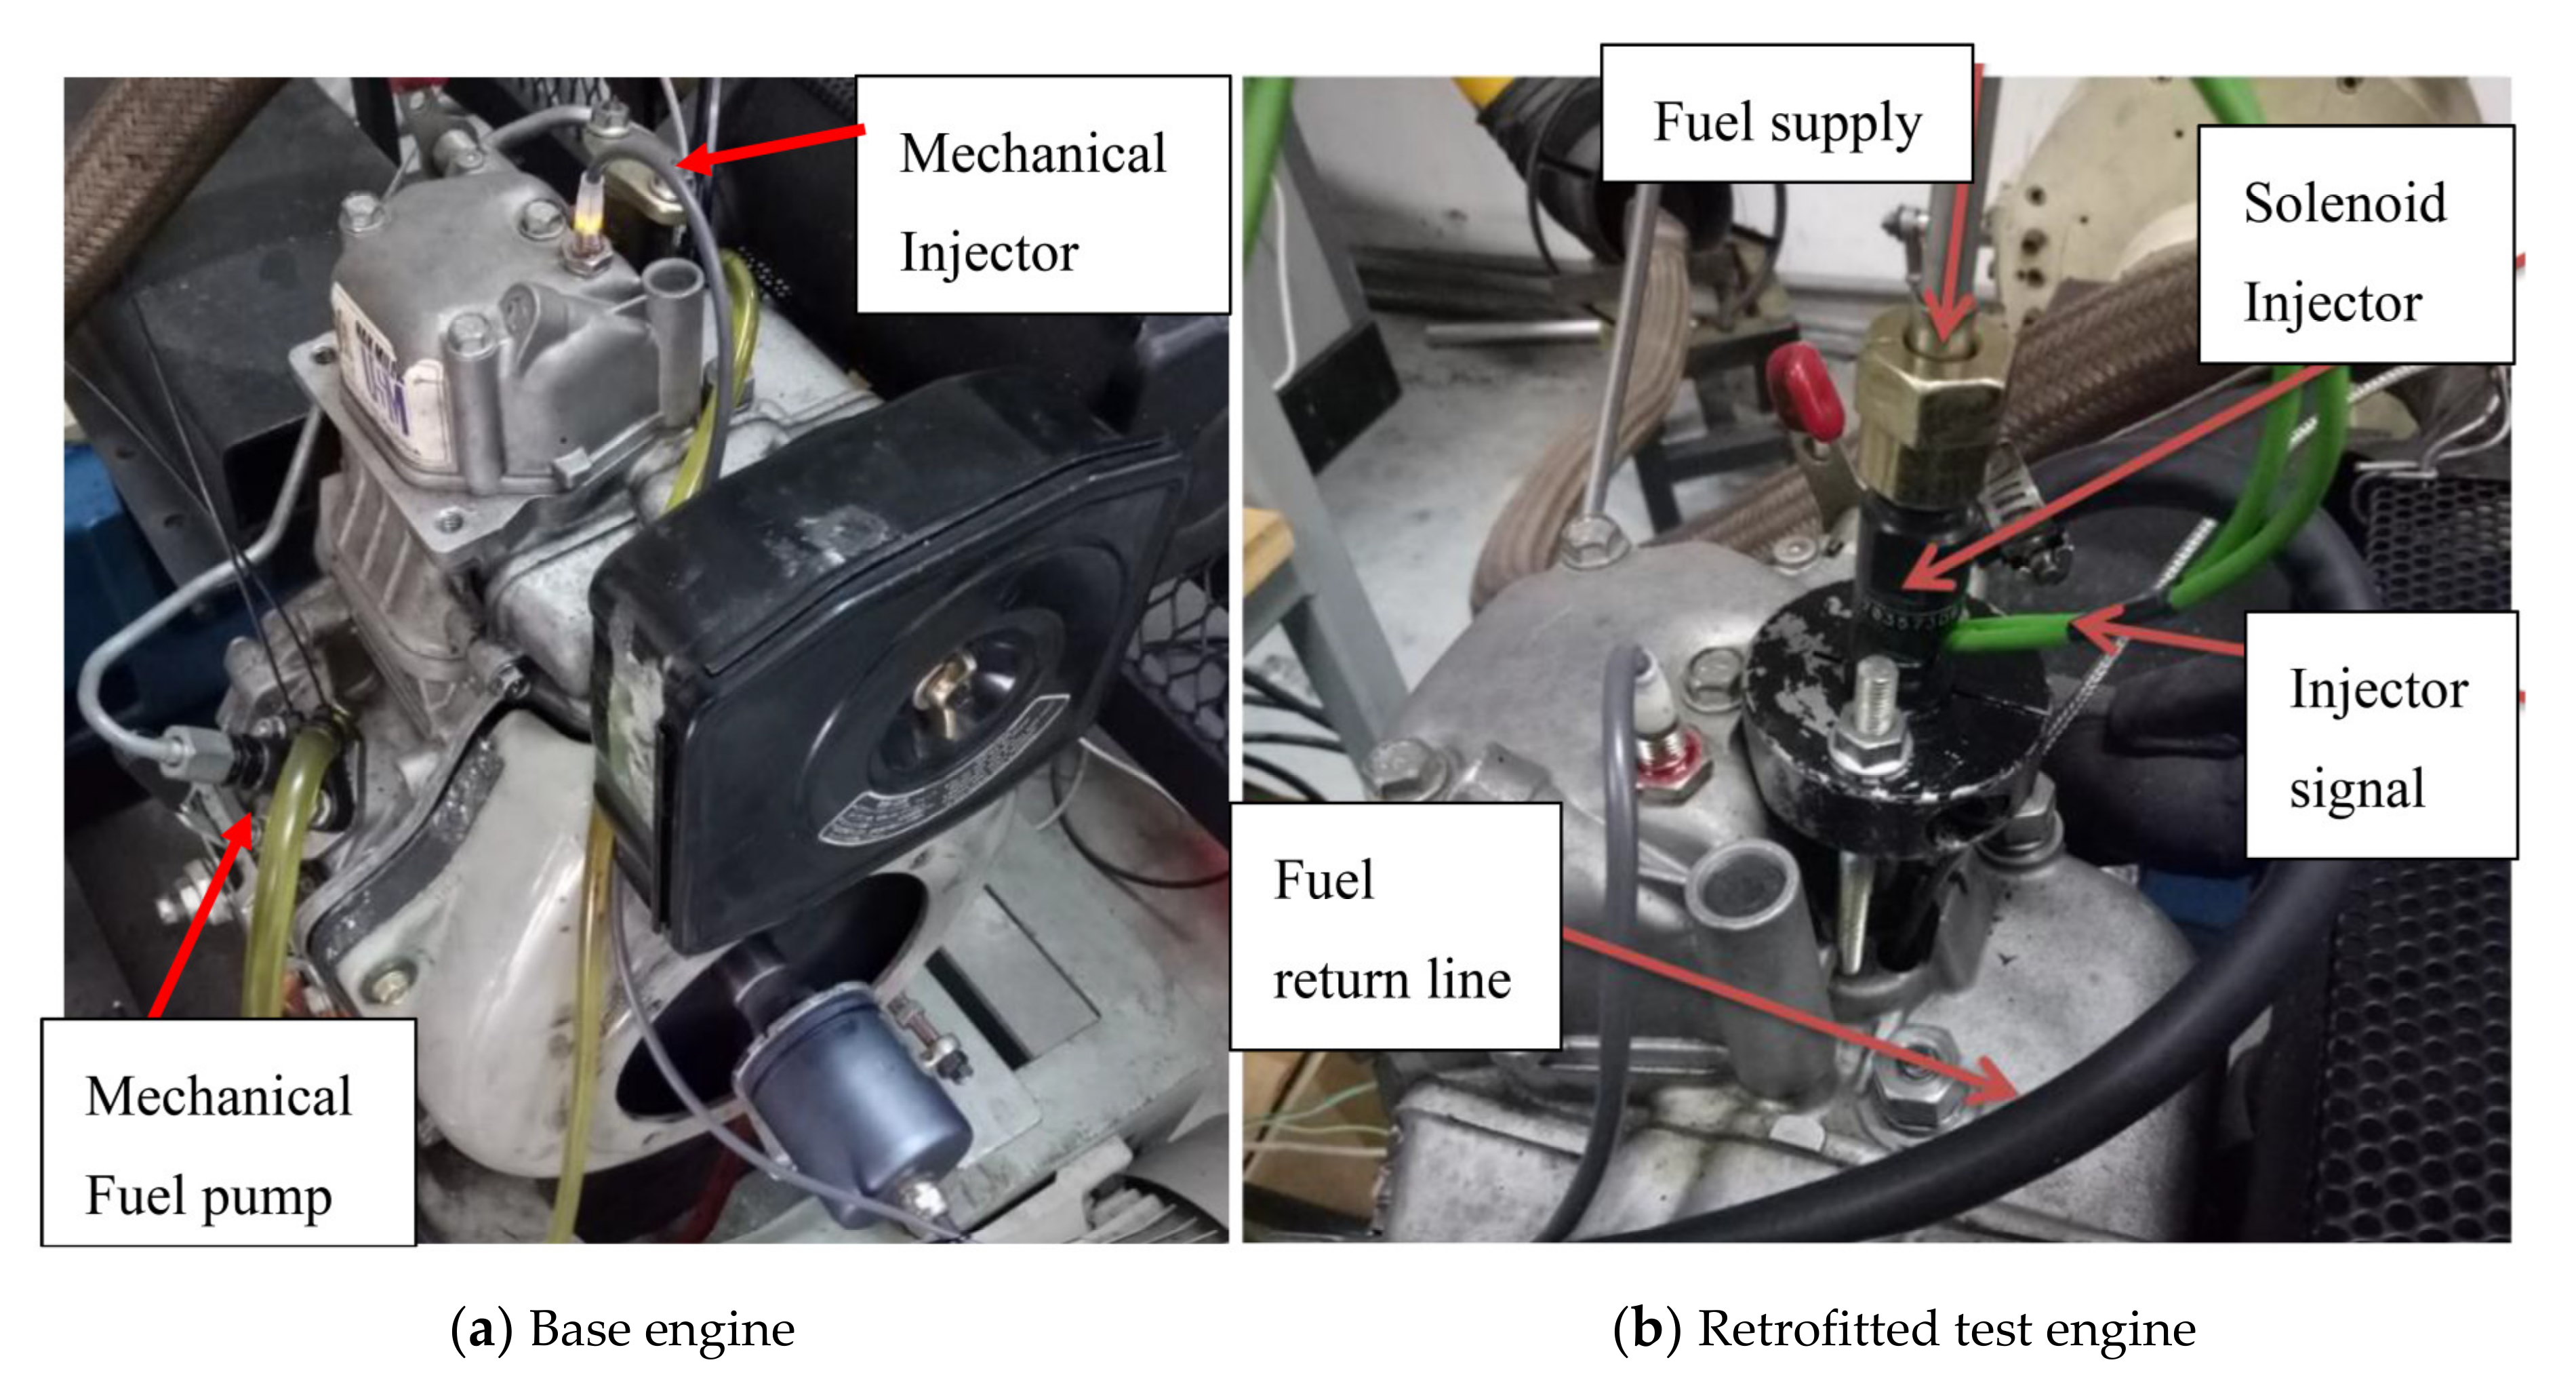
2.1. Apparatus Setup

A single-cylinder diesel engine equipped with conventional mechanical-type pump–line–nozzle injection system is modified into common rail fuel injection system in this research. The test engine used is an air-cooled single-cylinder YANMAR L48N6 (made in Japan) diesel engine with compression ignition (CI). The engine used as a construction base for the test engine was equipped with conventional mechanical fuel injection system. The system consists of a mechanical pressure fuel pump (196 bar) and a mechanical fuel injector with constant injection timing of 16.5°BTDC timed by camshaft. This naturally aspirated engine has a maximum output of 3.1 kW. The engine test bed is modelled by using computer-aided design software, SolidWorks 2019, and the front view of the test bed is shown in Figure 1.
The original mechanical-type fuel injection system of the test engine was replaced with new common rail fuel injection system. The new system was based on commercially available common rail direct injection fuel system for diesel engine. The specifications of converted test engine are listed in Table 1. The major components of the common rail fuel injection system consist of fuel rail and supply pump, engine controller unit (ECU) and fuel injector. The key specification of fuel injector and fuel pump are tabulated in Table 2.
A programmable ECU was developed based on low-cost open-source Arduino Mega 2560 and Arduino Uno microcontroller to control common rail fuel injection system and engine operating parameters. This ECU is built with a total of three microcontrollers (two Arduino Mega 2560 and one Arduino Uno). One of the Arduino Mega 2560 microcontrollers was programmed to control the injection timing and the other one was programmed to control the injection pulse width for DI while the Arduino Uno was programmed to control the rail pressure and temperature. The Arduino Mega controllers are named as start-of-injection control unit (SOICU) and DI pulse-width control unit (DI-PWCU) while the Arduino Uno is named as common rail control unit (CRCU). The programming codes were written with the open-source Arduino Software (IDE).
The SOICU receives timing signals from incremental encoder and intake rocket arm proximity sensor. The 720 pulses per revolution encoder is mounted to the crankshaft to measure the angular position of the crankshaft. Three signals that generate by the encoder is known as Channel A, Channel B and Channel Z or index. Signals A and B are the crank angle pulse and they are offset to determine direction of rotation. This phasing between the two signals is called quadrature. An index or ‘Z’ channel produces one signal per revolution for homing and pulse count verification on the A and/or B channels. A proximity sensor was installed just above the intake rocker arm. When the intake valve is open, a signal is produced, indicating the engine intake stroke which is very useful in timing the fuel injection for the test engine.
The time taken for the microcontroller to process the signals is very important. If the time taken is too long, it might miss the incoming signals. Therefore, the SOICU uses three interrupt service routines (ISRs) to pick up two signals from incremental encoder (one for Channel A and one for Channel Z) and one signal from proximity sensor. ISR makes sure that the processor responds quickly to important events whenever a signal is detected. The SOICU instantaneously processing and calculating the timing signals received and generates signals to DI–PWCU through digital I/O pins. However, the 12-V signals produced by both encoder and proximity sensor cannot be wired directly to Arduino Mega 2560 which the operating voltage is only 5 V. A potential divider circuit is required to reduce the signals’ voltage to 4 V (enough to trigger input pin) before the signals are input into the microcontroller. Three pieces of 1-kΩ resistor are connected in series and the signal input to the Arduino Mega is taken after second resistor. A total of three signals is generated by SOICU correspond to the SOI timing of pilot, main and post injection. The DI–PWCU triggers the injector upon receiving these signals via an injector driver circuit (same as MOSFET circuit used for suction control valve). The DI–PWCU is programmed to control the quantity of fuel injected by varying the pulse-width duration. Besides, the DI-PWCU also programed for engine speed calculation and closed-loop engine speed control. When the Proportional–Integral–Derivative (PID) is activated, the DI-PWCU adjusts the main injection opening pulse-width duration to control the engine speed. The timing diagram of encoder and proximity sensor signals together with SOICU, DI-PWCU is shown in Figure 2.
A high-sensitivity (20.35 pC/bar) Kistler 6052C (made in Switzerland) piezoelectric pressure sensor was employed to measure the in-cylinder pressure for combustion characteristics analysis in this study. The pressure sensor was mounted into the combustion chamber to provide pressure data. The instantaneous signal from the pressure sensor was transmitted to a charge amplifier (PCB model 422E53, made in USA) before a high-speed Dewe-43A (made in Slovenia) data acquisition system (DAQ) to enable data processing for heat release rate and combustion duration. The Dewe-43A DAQ has 24 bits resolution, 200 kS/s sampling rate, and eight analog input channels. An incremental encoder with 720 pulses per revolution was used to monitor the engine crankshaft rotational displacement. The data from the encoder was also fed into the DAQ for synchronized with cylinder pressure data. In each test, cylinder pressure was continuously measured for 100 cycles; the data obtained were then recorded and averaged.

2.2. Experimental Procedure

The injection system of the base engine was disassembled, and a new common rail injection system was retrofitted, as illustrated in Figure 3. After the conversion to common rail fuel injection system has been done, tests were carried out to investigate the capability of the system. The first test was to study the response of pressure and engine speed. The pressure and engine speed variables were controlled based on the closed-loop PID gain control scheme. In this test, the engine was run at a constant speed of 1600 rpm and an initial rail pressure of 200 bar at a steady state. After a specific timestep (i.e., 55 s), the rail pressure was set to be 100 bar higher than its previous value. The closed-loop PID control system would detect the change and adjust the rail pressure to the value set. Rail pressure versus time graph was plotted to observe the response of rail pressure to the change in value set in controller. On the other hand, the response of engine speed was studied by setting rail pressure as constant at a pressure of 300 bar and varying engine speed from 1600 to 2000 rpm with an increment of 100 rpm at specific timesteps (i.e., 40 s). Graph of engine speed versus time was plotted to observe the response of engine speed immediately after the change in its value in controller.
The performance of diesel engine when fuel injection timing was changed was investigated. The diesel engine was run with different SOI timings under engine speed of 1600rpm and load of 5 Nm. A graph which contains in-cylinder pressure versus time and HRR versus time data was plotted for different SOI timing. The effect of rail pressure to the diesel engine performance was studied too. The diesel engine was operated at different rail pressure with engine speed fixed at 1600 rpm, load fixed at 5 Nm and SOI timing fixed at 4°BTDC. The results could be observed by plotting the graph of in-cylinder pressure versus time and HRR versus time for different rail pressure. The common rail fuel injection system allows the implementation of multiple injection. The diesel engine was run at different multiple injection scheme and the performance is observed. The engine speed was set at 1600 rpm while the load was fixed at 5 Nm. SOI timing used in this test was 4°BTDC. A graph of in-cylinder pressure versus time and HRR versus time was plotted under different multiple injection schemes. A maximum PRR versus types of multiple injection scheme bar chart was drawn too. Table 3 summarizes the injection tests which have been conducted.

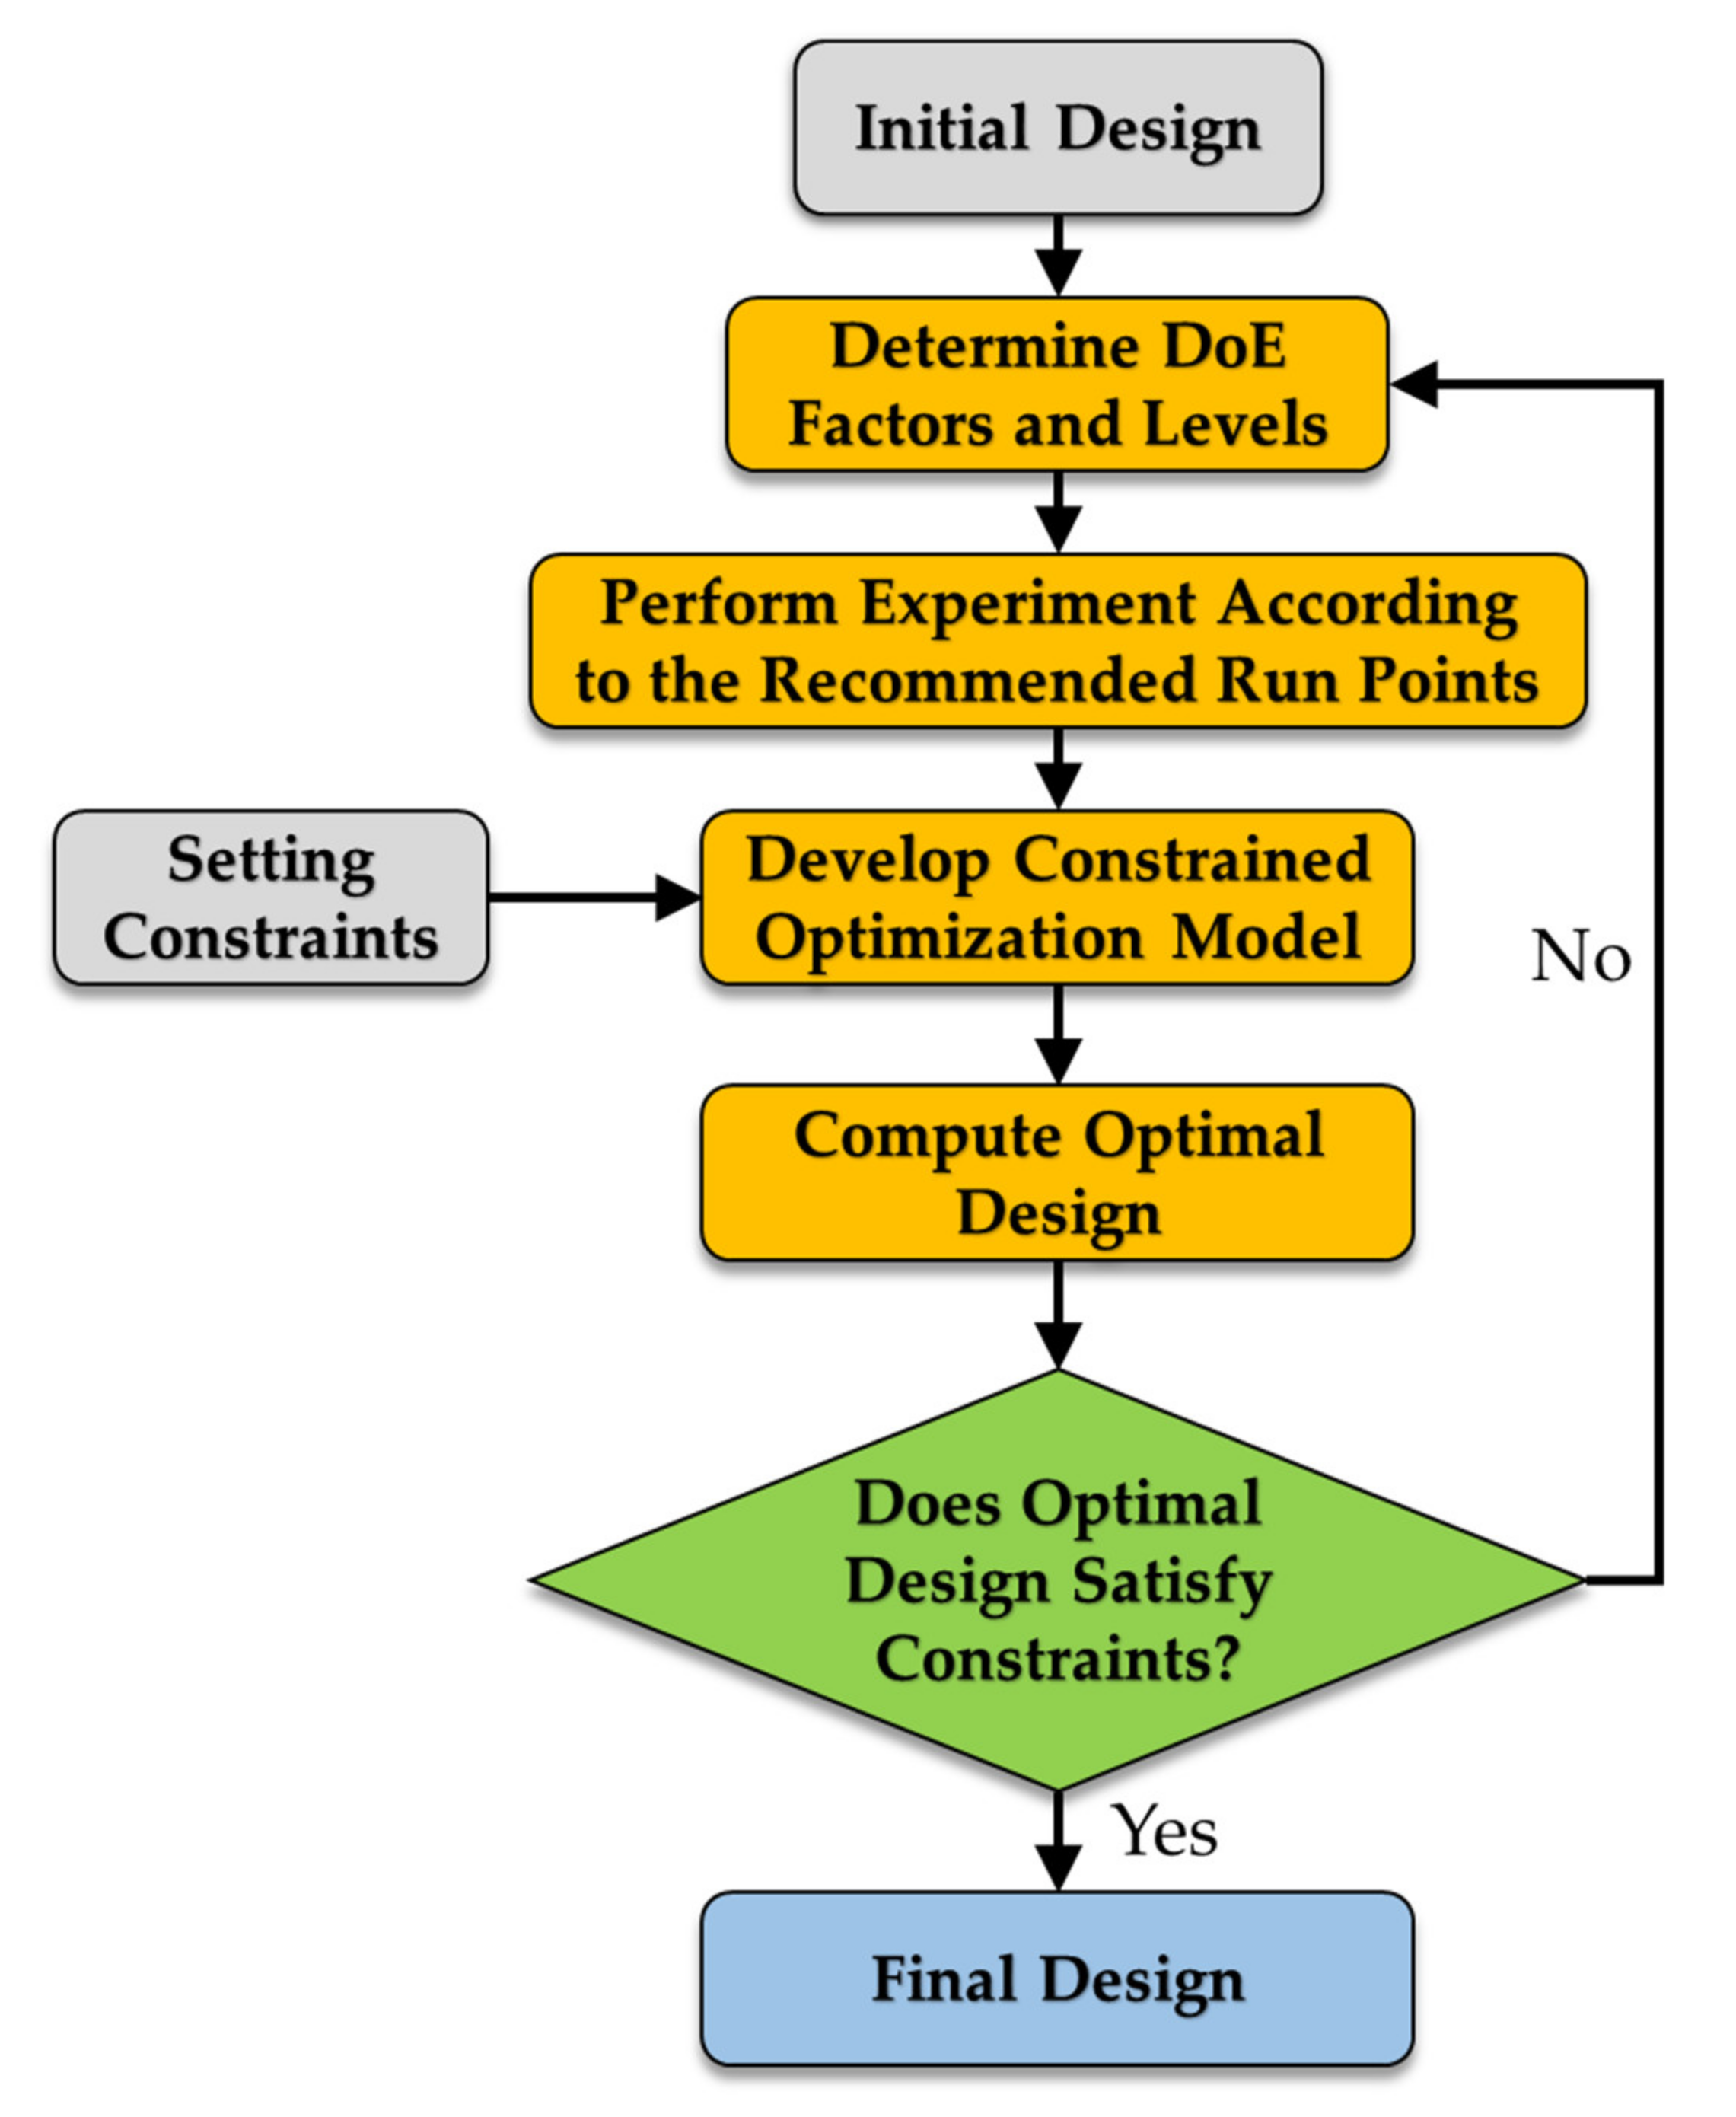
2.3. Optimization of Injector Parameters

As discussed in the previous section, the Open Time, Low Time and duty cycle percentage of the signal output to injector will affect the cycle-to-cycle combustion as well as current flows through the injector. As a response to cycle-to-cycle combustion variation, the indicated mean effective pressure (IMEP) for 100 cycles of combustion is acquired and the coefficient of variation (CoV) is calculated. Also, the area under the graph of current versus crank angle is calculated to determine the power used by the injector in term of Watt (W). All combustion data are taken using DEWESoft® 7.04 version data acquisition software. Optimization of injector parameters is carried out by using Design-Expert® trail version software and the flowchart of optimization algorithm as shown in Figure 4. Design-Expert® is delicately designed to perform design of experiment and help to analyze the multi-factor experiment [53]. Three parameters, Open Time, Low Time and duty cycle percentage, are inserted as factor into the software and the responses are CoV of IMEP (indicated mean effective pressure) and the power of injector in term of Ampere CA°. The range of Open Time is set from 50 µs to 350 µs, Low Time from 20 µs to 80 µs and duty cycle is set from 20% to 40%. A total of 20 experiment run points is recommended by the software to carry out the optimization process as shown in Table 4. Note that all the experiments are carried out with engine speed of 1600 rpm with 5-Nm torque and injection pressure of 300 bar. A LabVIEW 2011 program was developed to simultaneously change the parameters and switch the run point of experiment. After all the experiments are performed, the values of CoV of IMEP and power obtained were inserted into the response column, respectively. The data entered will be analyzed by the software and provide solution for optimization. Both CoV of IMEP and power should be minimized to ensure more stable combustion and less injector power usage. After obtaining the optimum injector’s parameters, validation is carried out by running the experiment with stated parameters and compares the error.

3. Results and Discussion

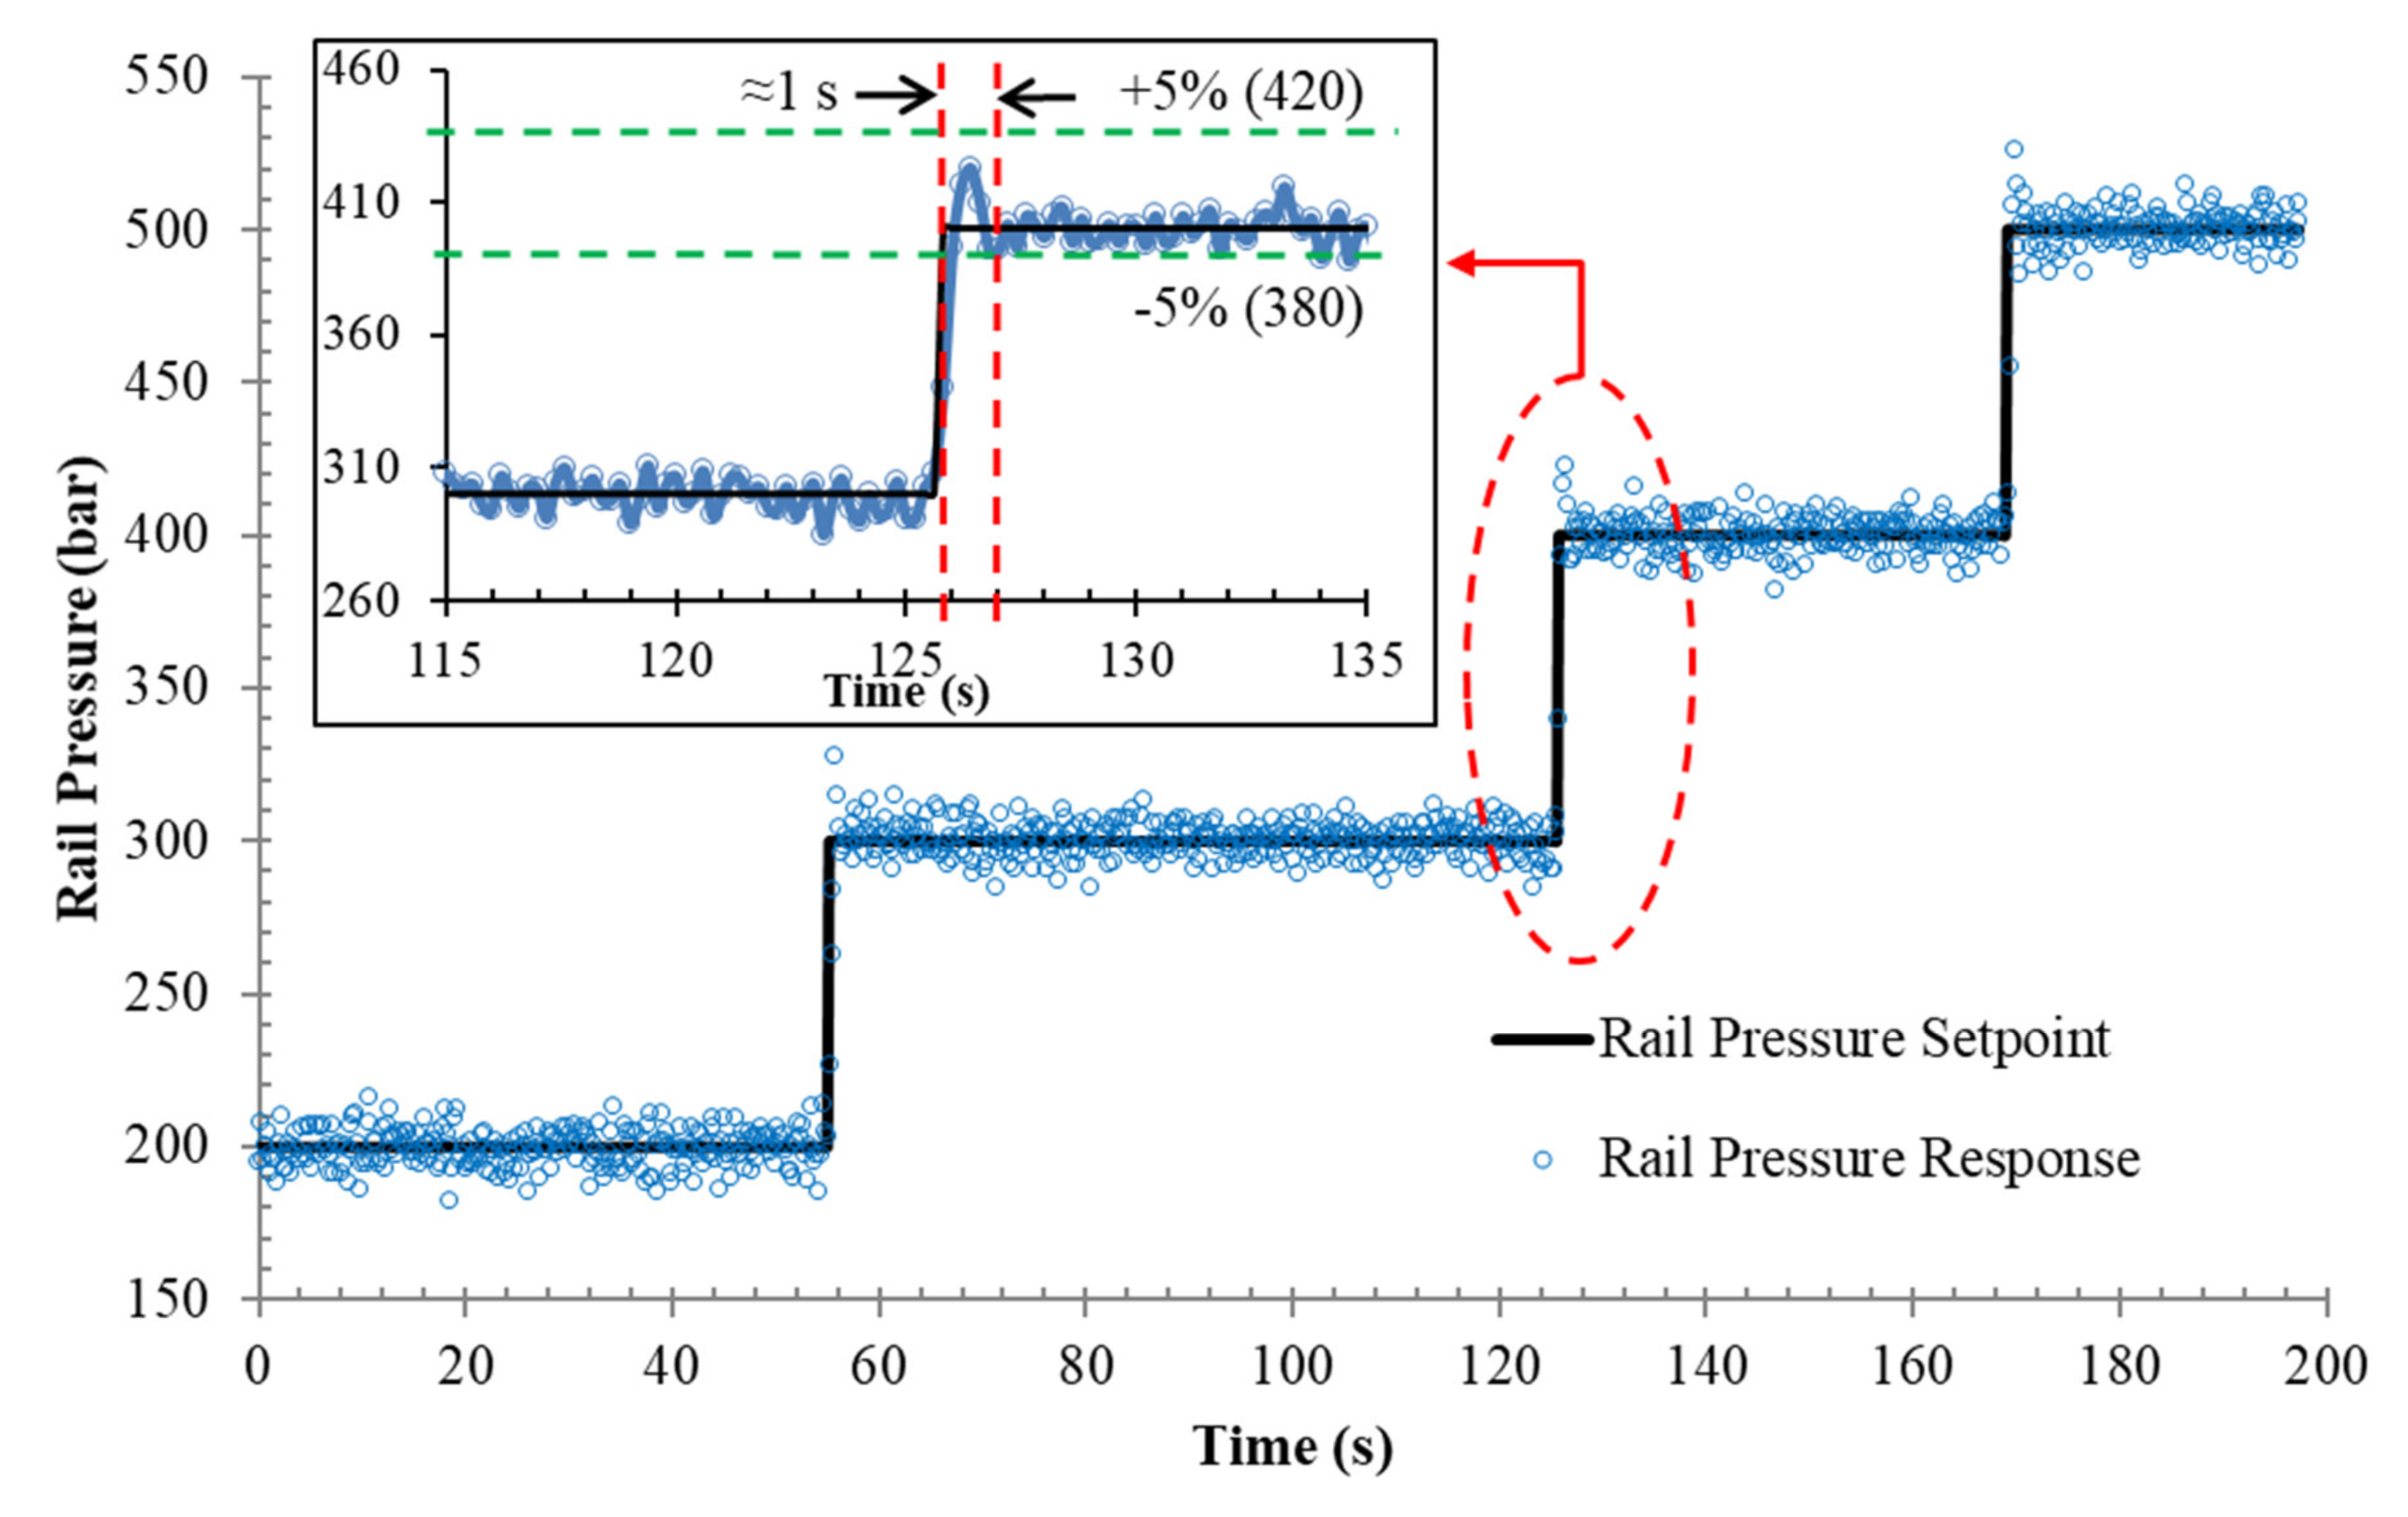
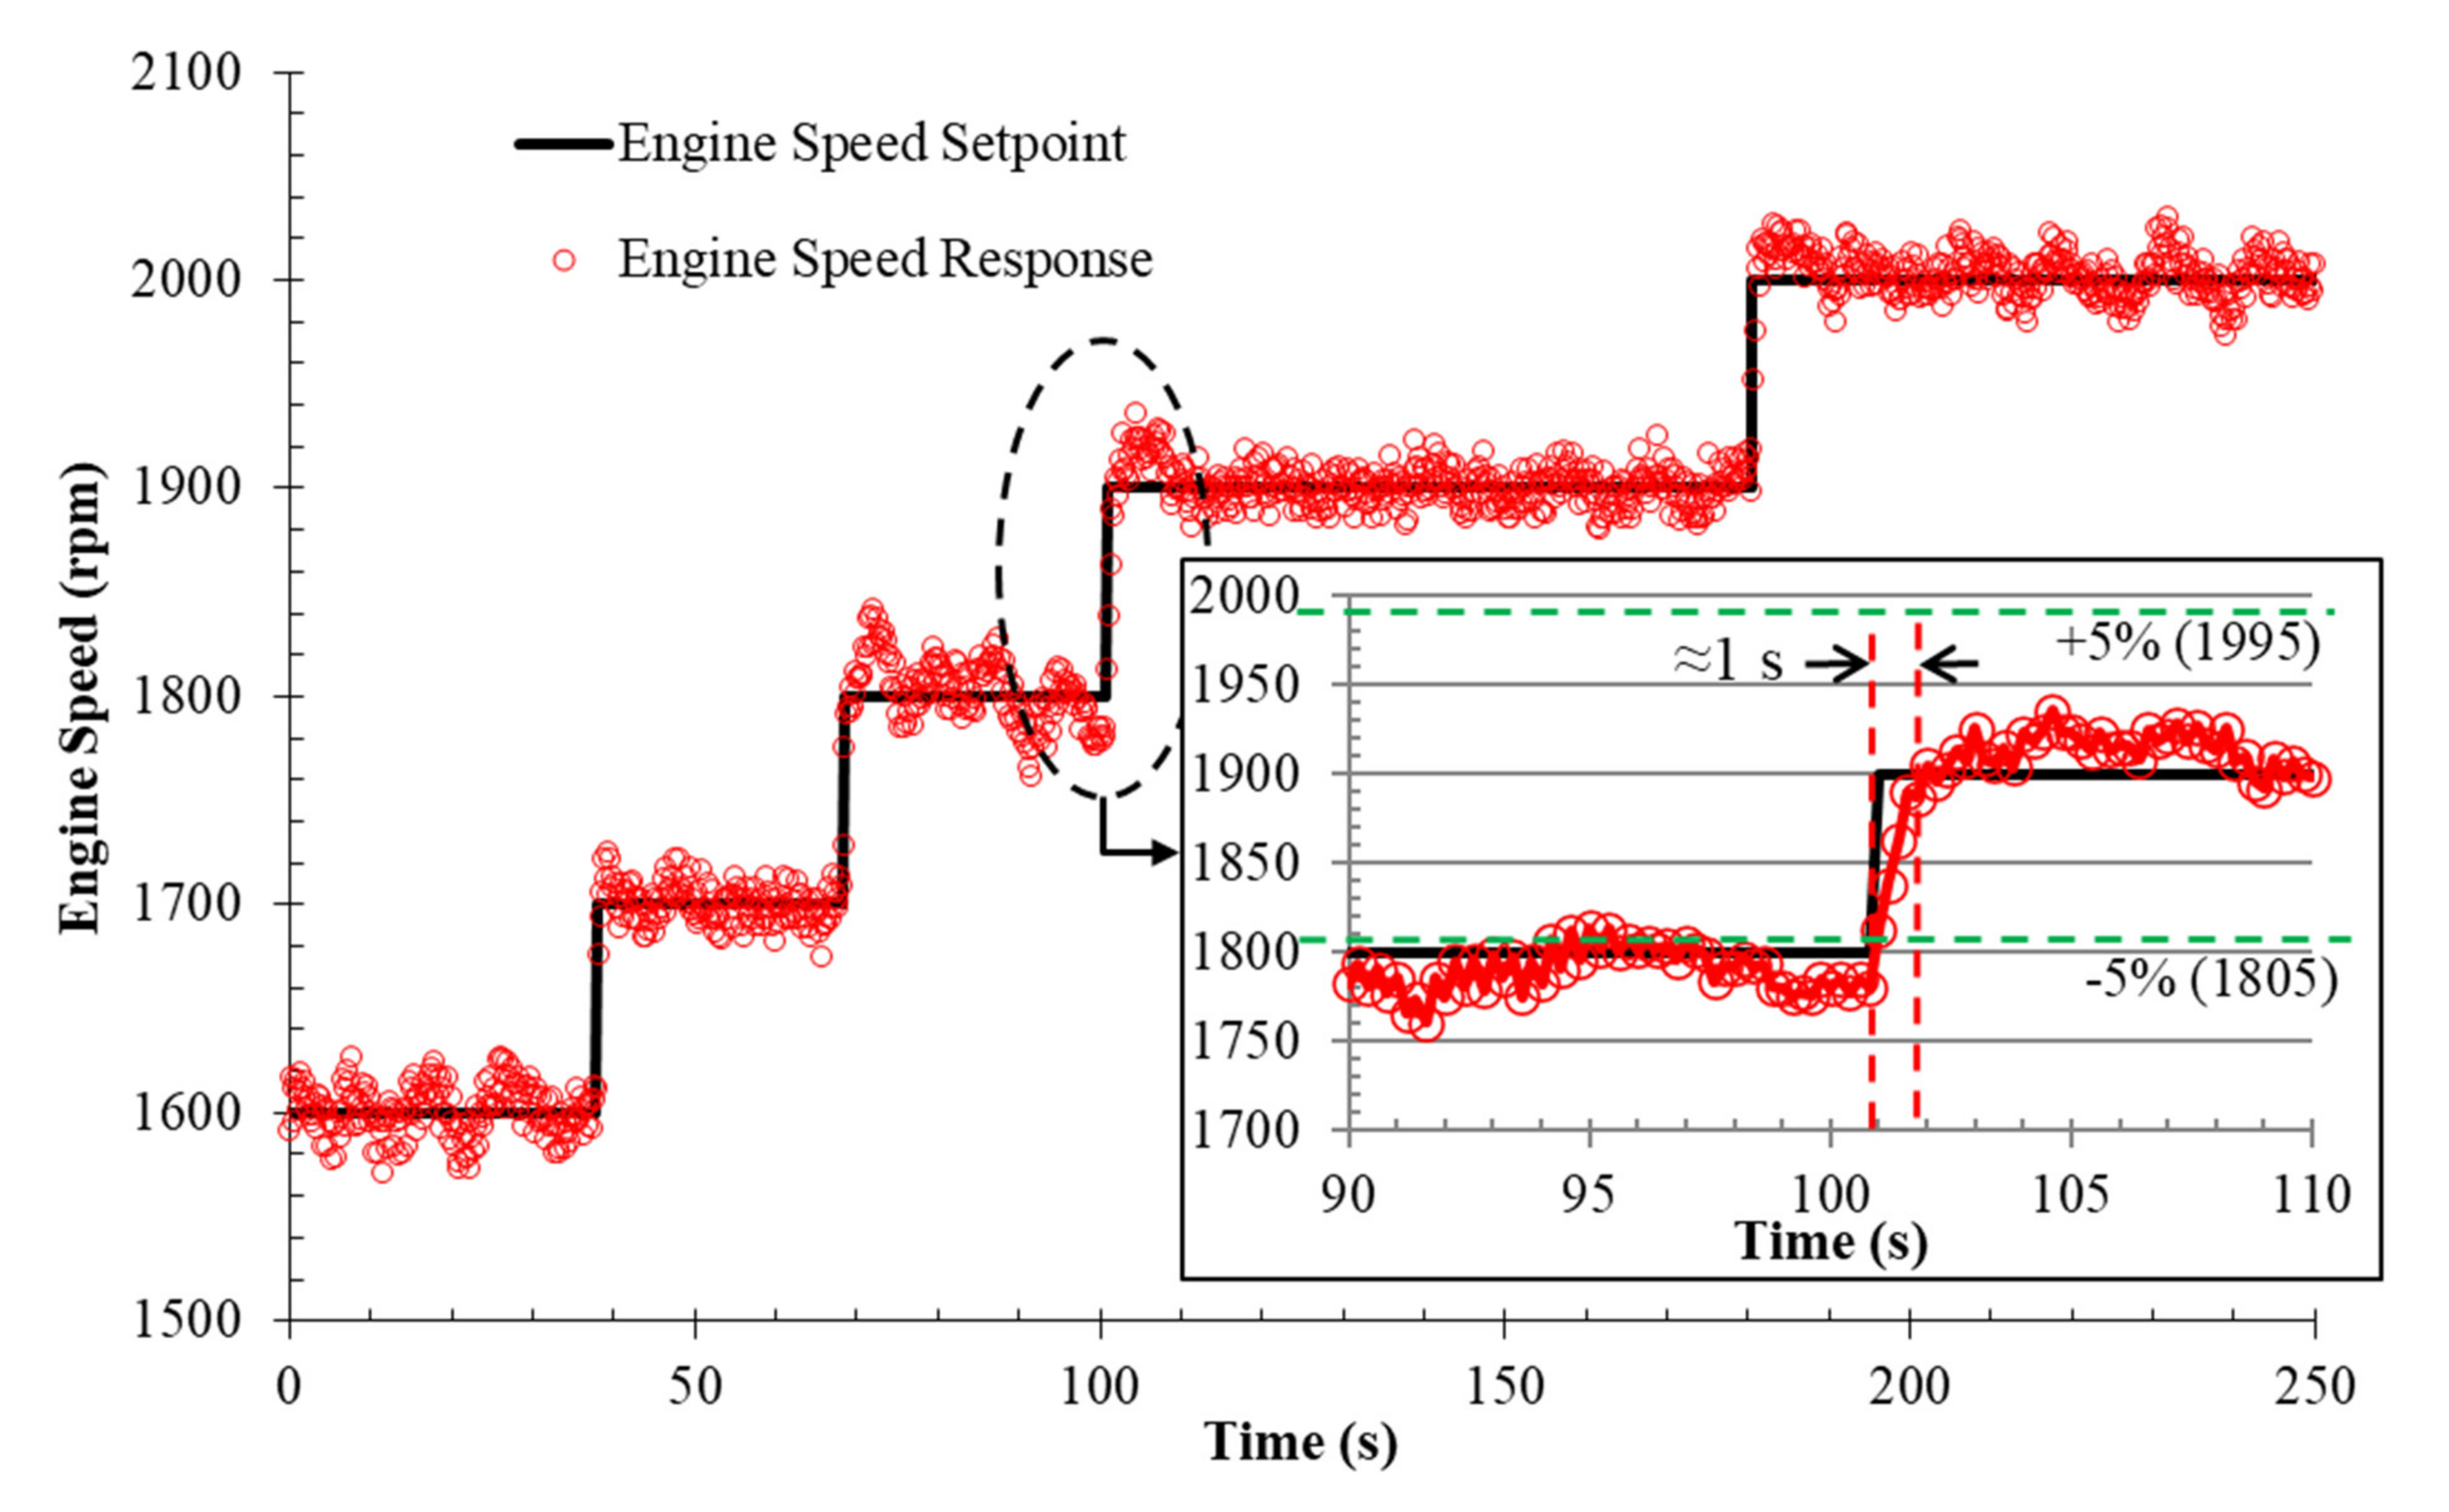
3.1. Response Characteristics

The rail pressure response during a step change in engine speed of 1600 rpm is shown in Figure 5 and engine speed response during a step change in rail pressure of 300 bar is illustrated in Figure 6. Based on the figures, we can notice that the steady state error for both responses is less than 5% as compared to their setpoints. The rising time for rail pressure is less than one second while the rising time for engine speed is around one second. It can be inferred that the rail pressure and engine speed responses of common rail fuel injection system are accurate and sufficiently quick.

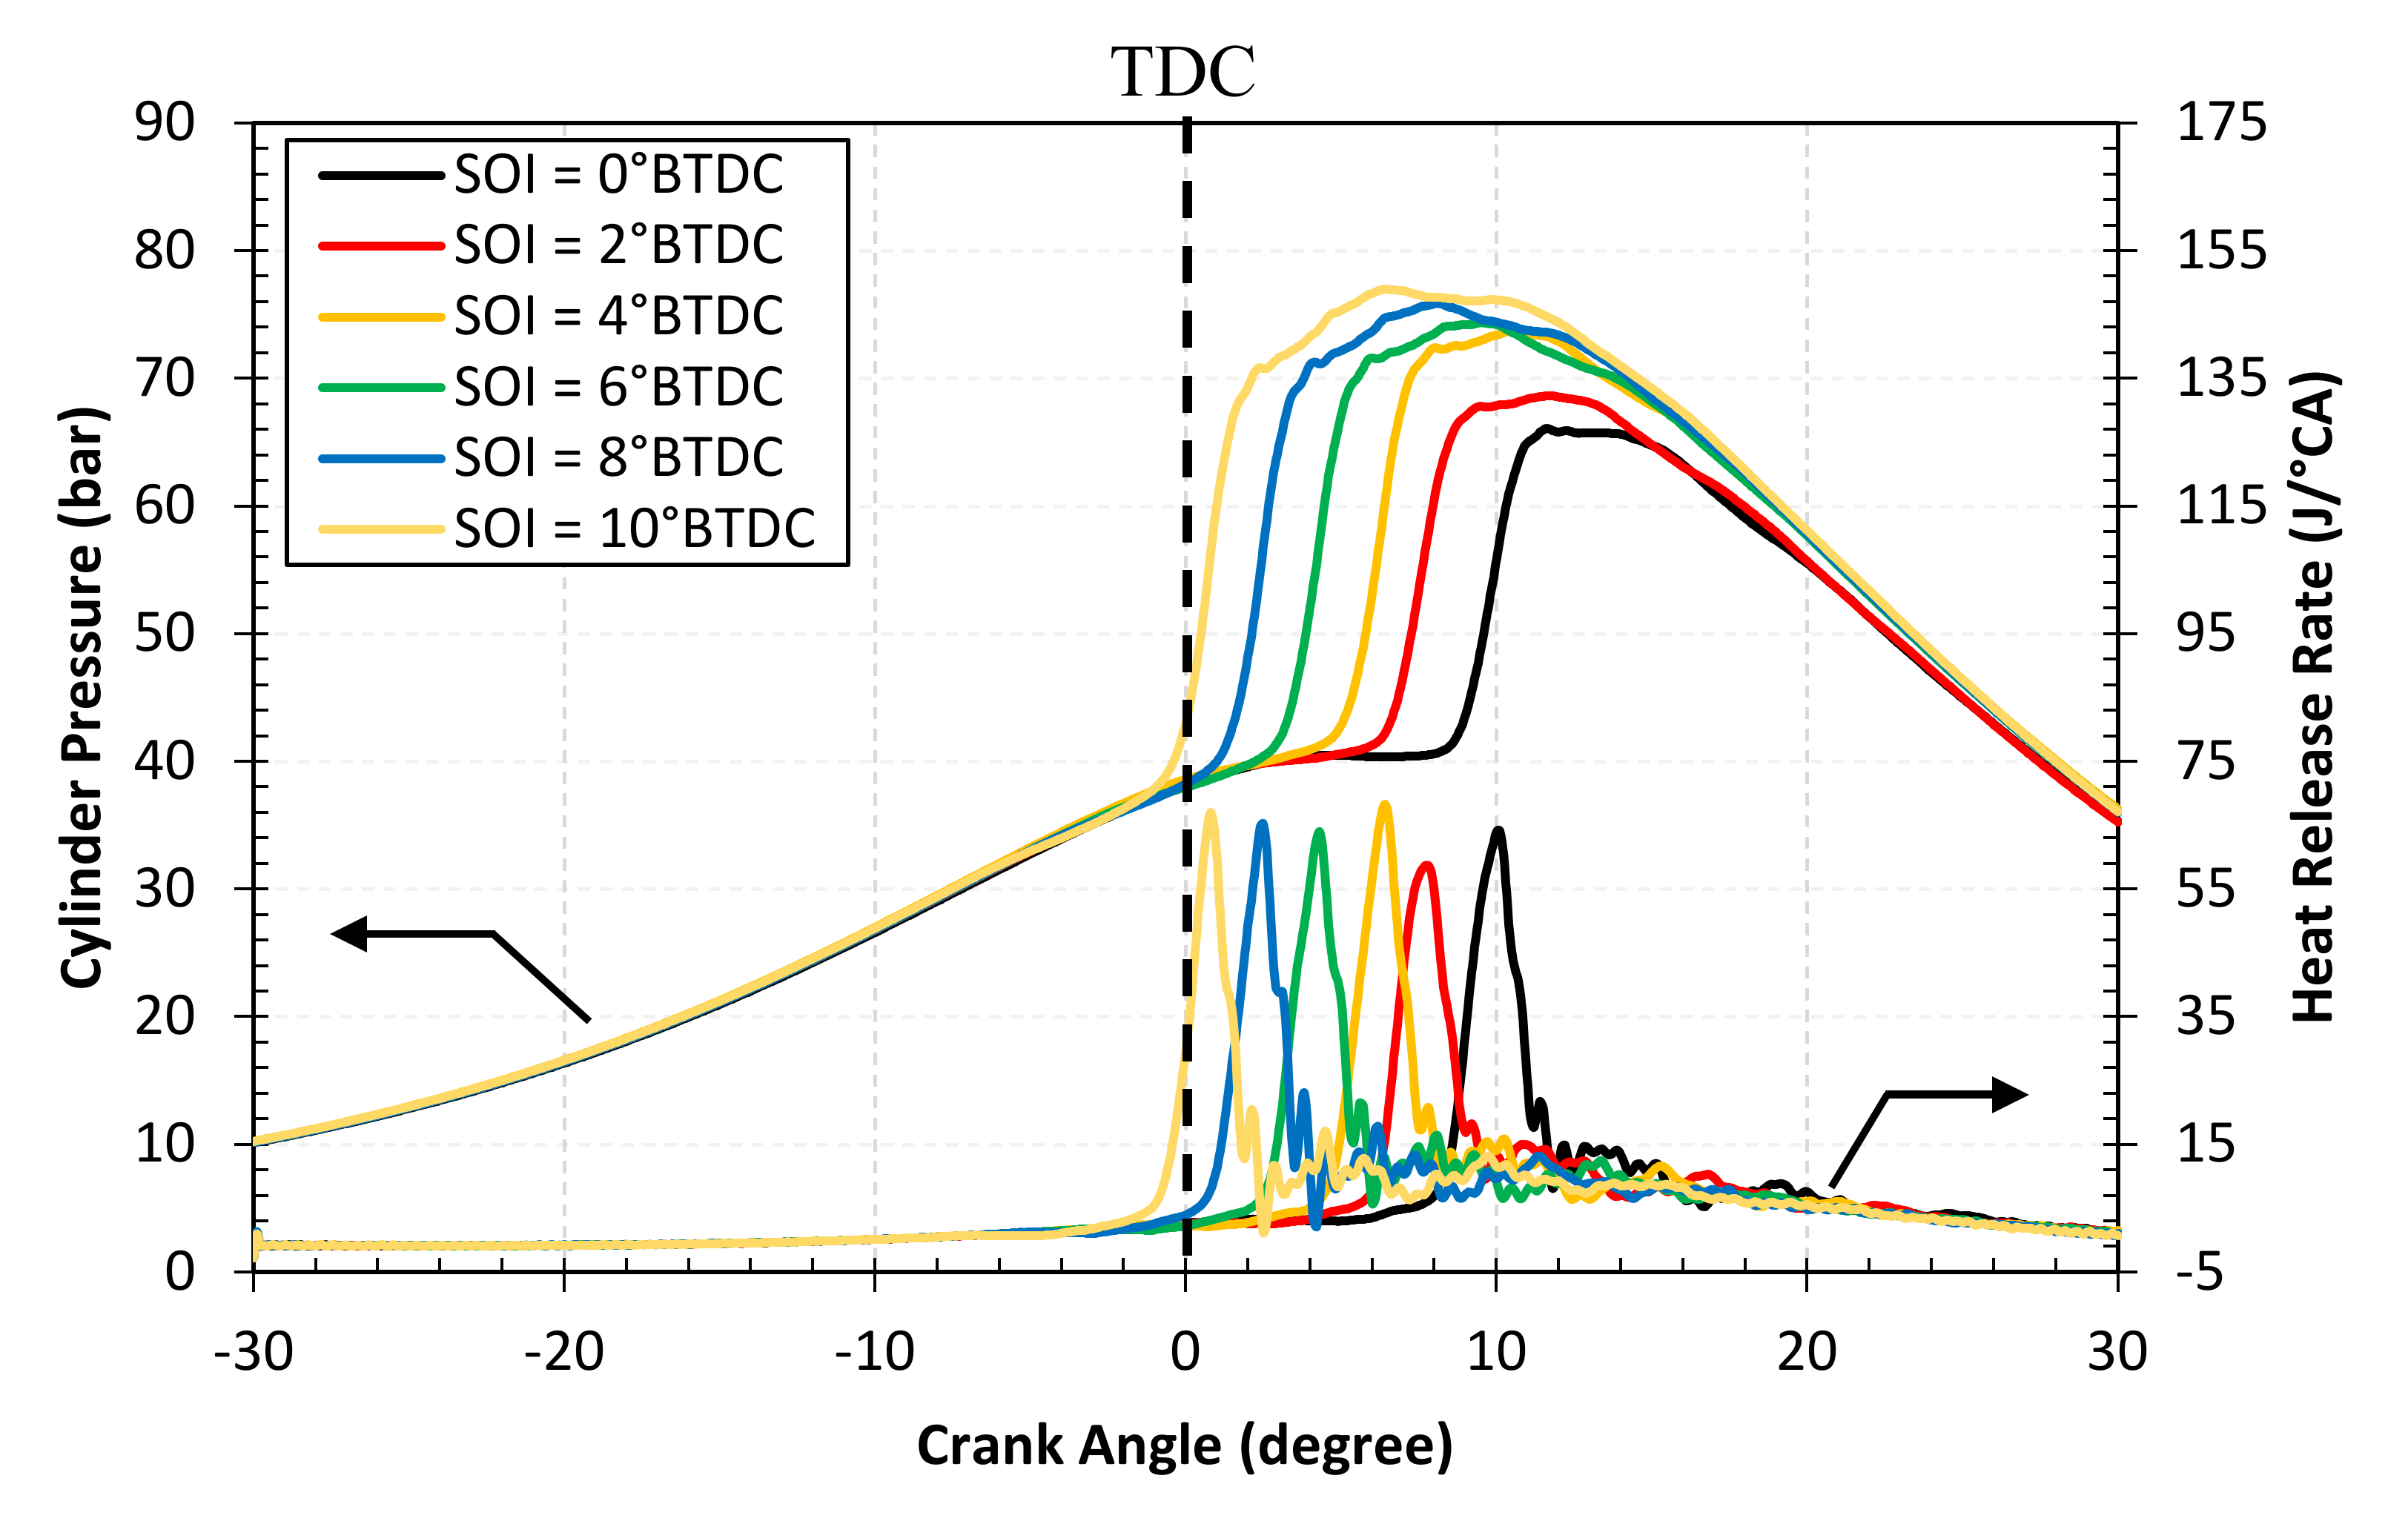
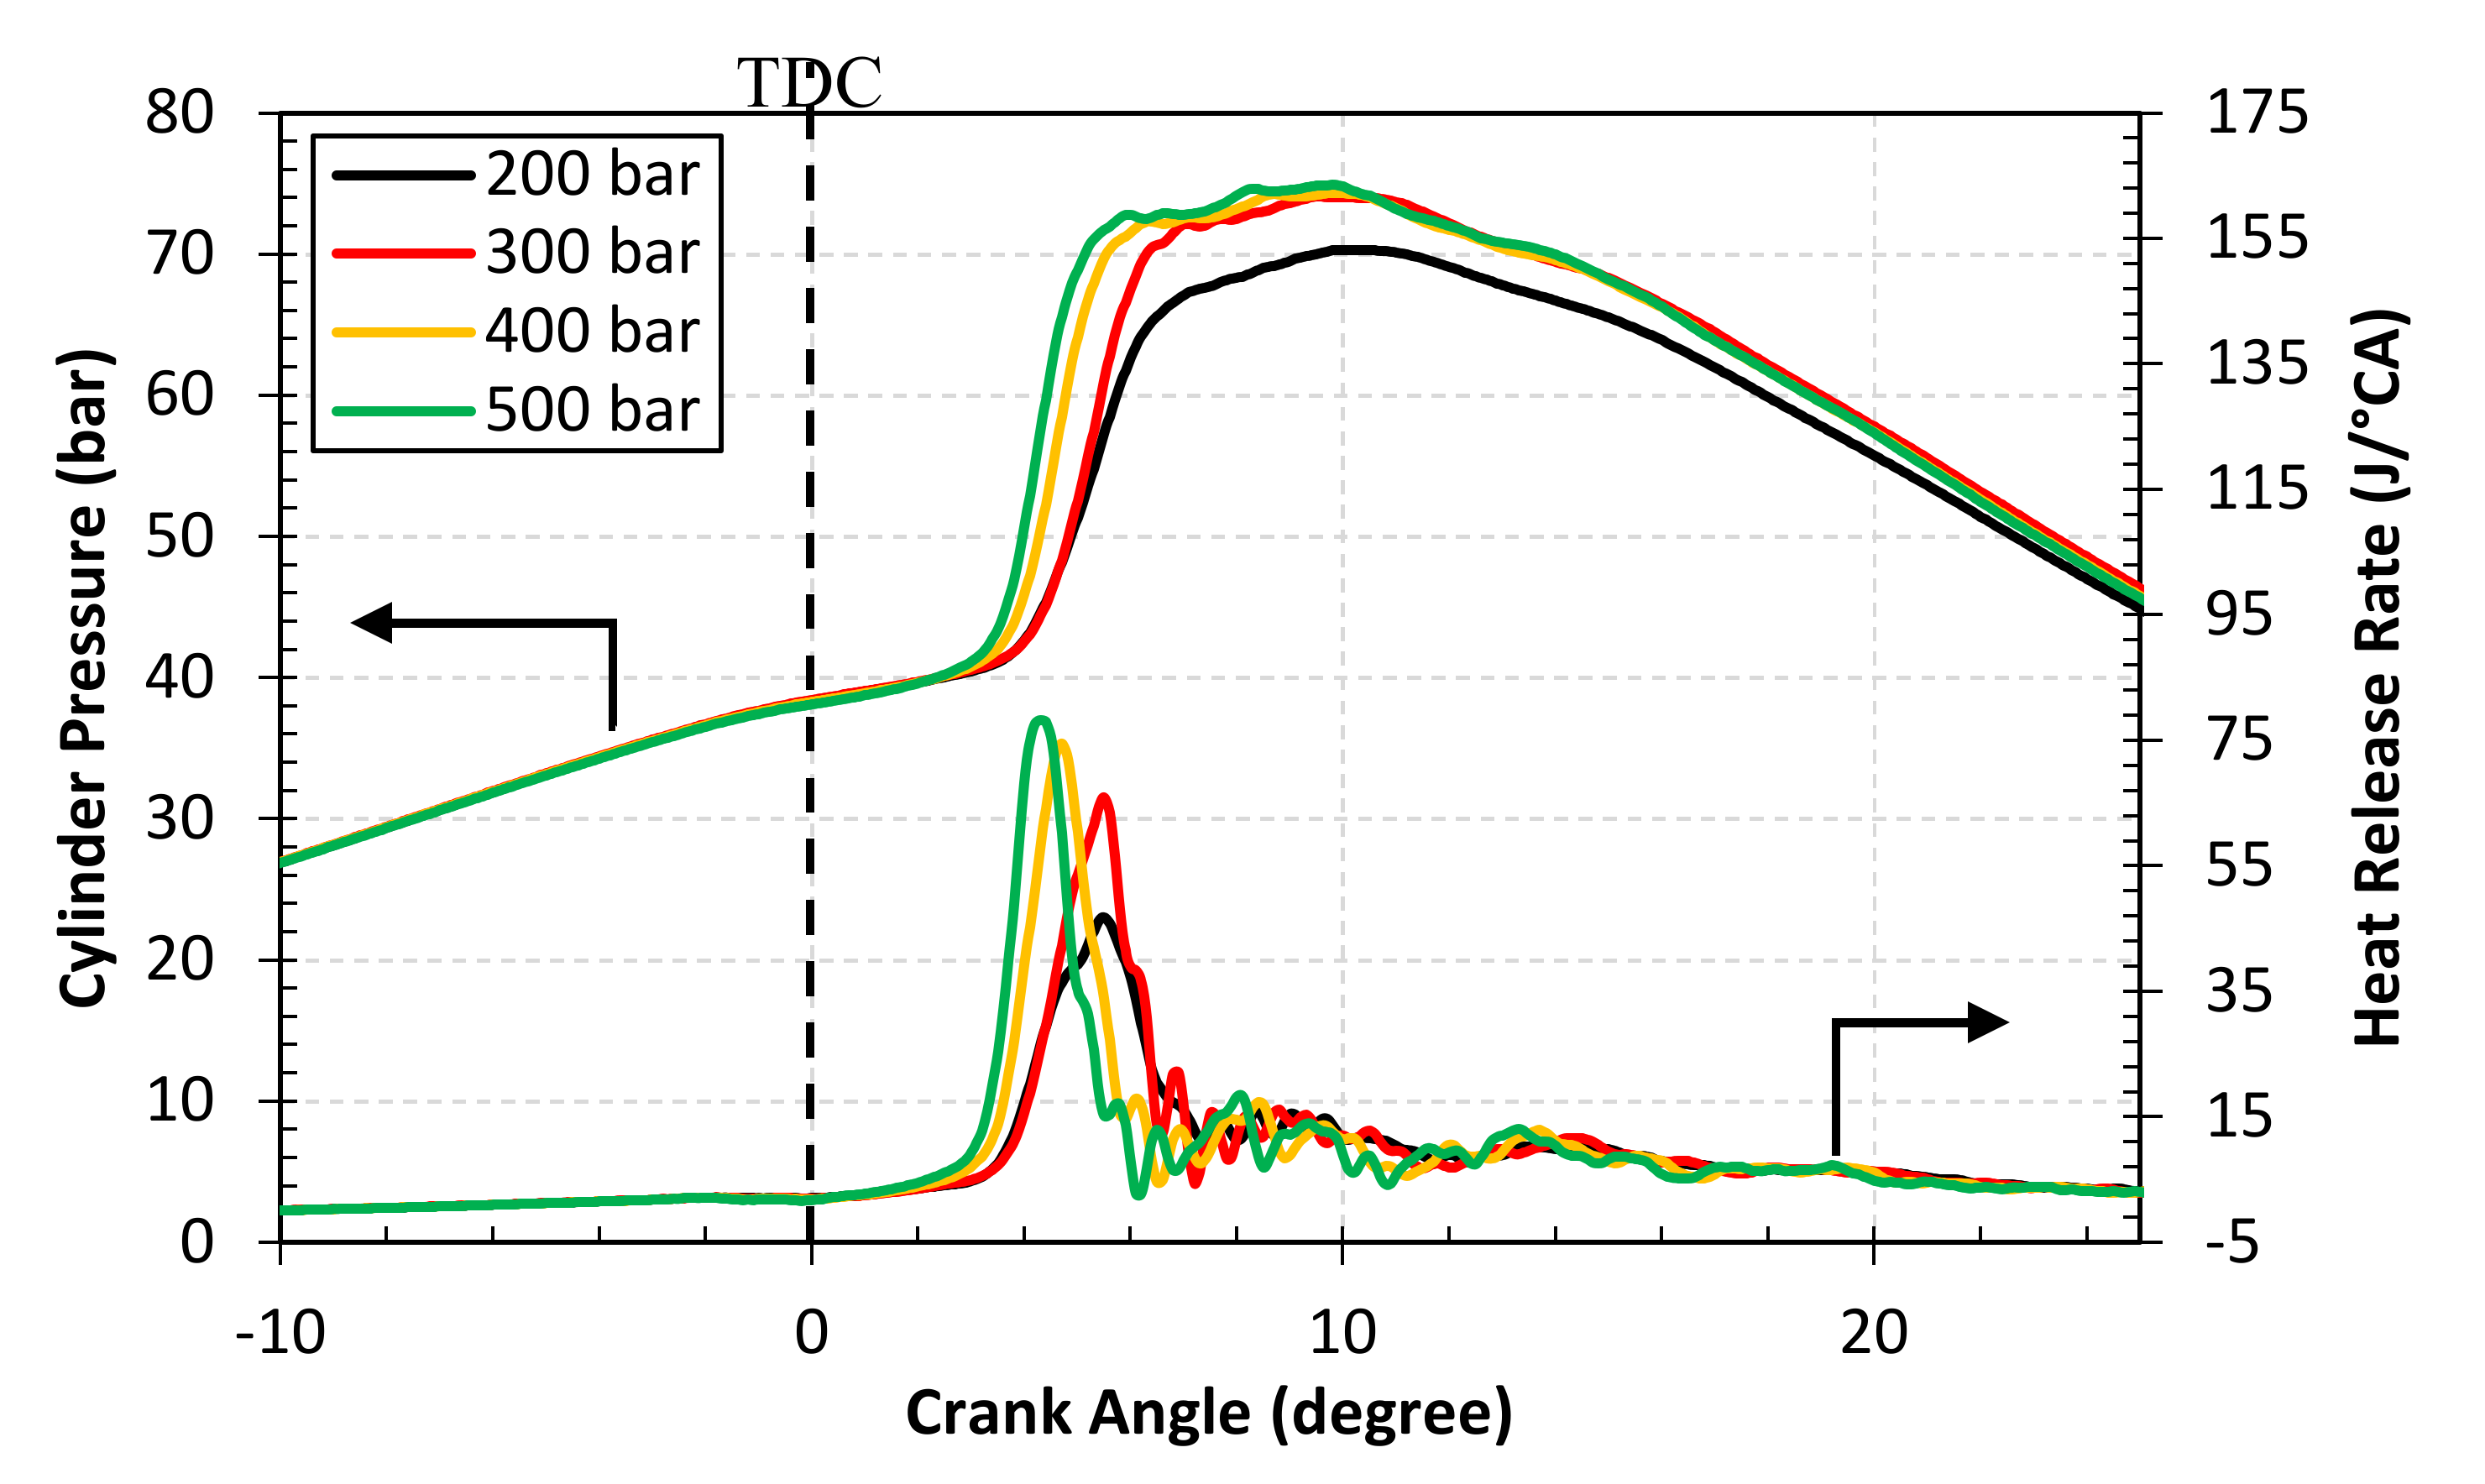
3.2. Combustion Characteristics

Figure 7 illustrated the variation of cylinder pressure and HRR against crank angle for different SOI timings under engine speed of 1600 rpm with a load of 5 Nm. As can be seen from the figure, with advancing in SOI timing, the cylinder pressure peak rises and shifted toward the TDC position constantly. The peak pressure increment is due to longer ignition delay and promotes the air fuel mixing [21]. As the effective pressure increases, it can be converted into more useful work and increase the brake torque. The HRR curves share same patterns as cylinder pressure curves, the HRR peak also shifted toward the TDC position with advanced in SOI timing. The HRR peak is associated with premixed combustion phase of diesel fuel. As the SOI was advanced, the HRR peak is first declined at SOI timing equal to 2° BTDC and inclined to initial level at SOI timing equal to 4° BTDC and remain constant.
Figure 8 shows the cylinder pressure and HRR curves for engine operating at 1600 rpm and load of 5 Nm with SOI timing of 4° BTDC under a different injection pressure. In general, it is observed that the cylinder pressure peak is constantly rising and shifts toward the TDC position when the injection pressure increases. The resultant higher effective pressure from combustion was utilized to produce more useful work and increase the brake torque. This is because higher injection pressure improves the atomization and penetration of fuel, reduces the fuel evaporation time results in shorter combustion duration and higher HRR [28]. This has been proven as the HRR curves have similar trends as cylinder pressure curves as shown in the figure. The peak of HRR for higher injection pressure is higher than those with lower injection pressure.
Multiple injections such as pilot with main injection, main followed by post injection and combination of pilot, main and post injection are widely used to control engine noise, reduce PM and NOx emissions and help in exhaust after-treatment device management. Figure 9 shows the comparison of injection strategies in terms of cylinder pressure and HRR. The engine is operated with speed of 1600 rpm and 5 Nm load at 4° BTDC SOI timing. The cylinder pressure peak reduces as the number of injections increases. The single injection strategy has the highest cylinder peak while the triple injection strategy has the lowest cylinder peak. The maximum PRR is calculated based on the maximum gradient of pressure curve. The combustion process has been smoothened with the association of pilot injection in double- and triple-injection strategies. Introduction of pilot injection reduced the maximum PPR and help in reducing the engine noise [34]. Apart from that, the HHR peak for double and triple injection also reduced as compared to single injection. This is because the pilot injection reduced the impact of dominant premixed combustion phase. The temperature and PRR is then reduced and decrease the NOx emission [54]. It is also observed that the HRR for triple injection at the late combustion phase is higher than single and double injection as highlighted with an oval shape in the figure. This shows that post injection increases the temperature in late combustion phase and potentially reduce the soot emission [55].
Based on the results obtained, the injection timing, injection pressure and number of injections per cycle are able to be controlled by developed ECU. The developed ECU is also able to control the rail pressure and engine speed with steady state error less than 5% and rising time of less or around one second.

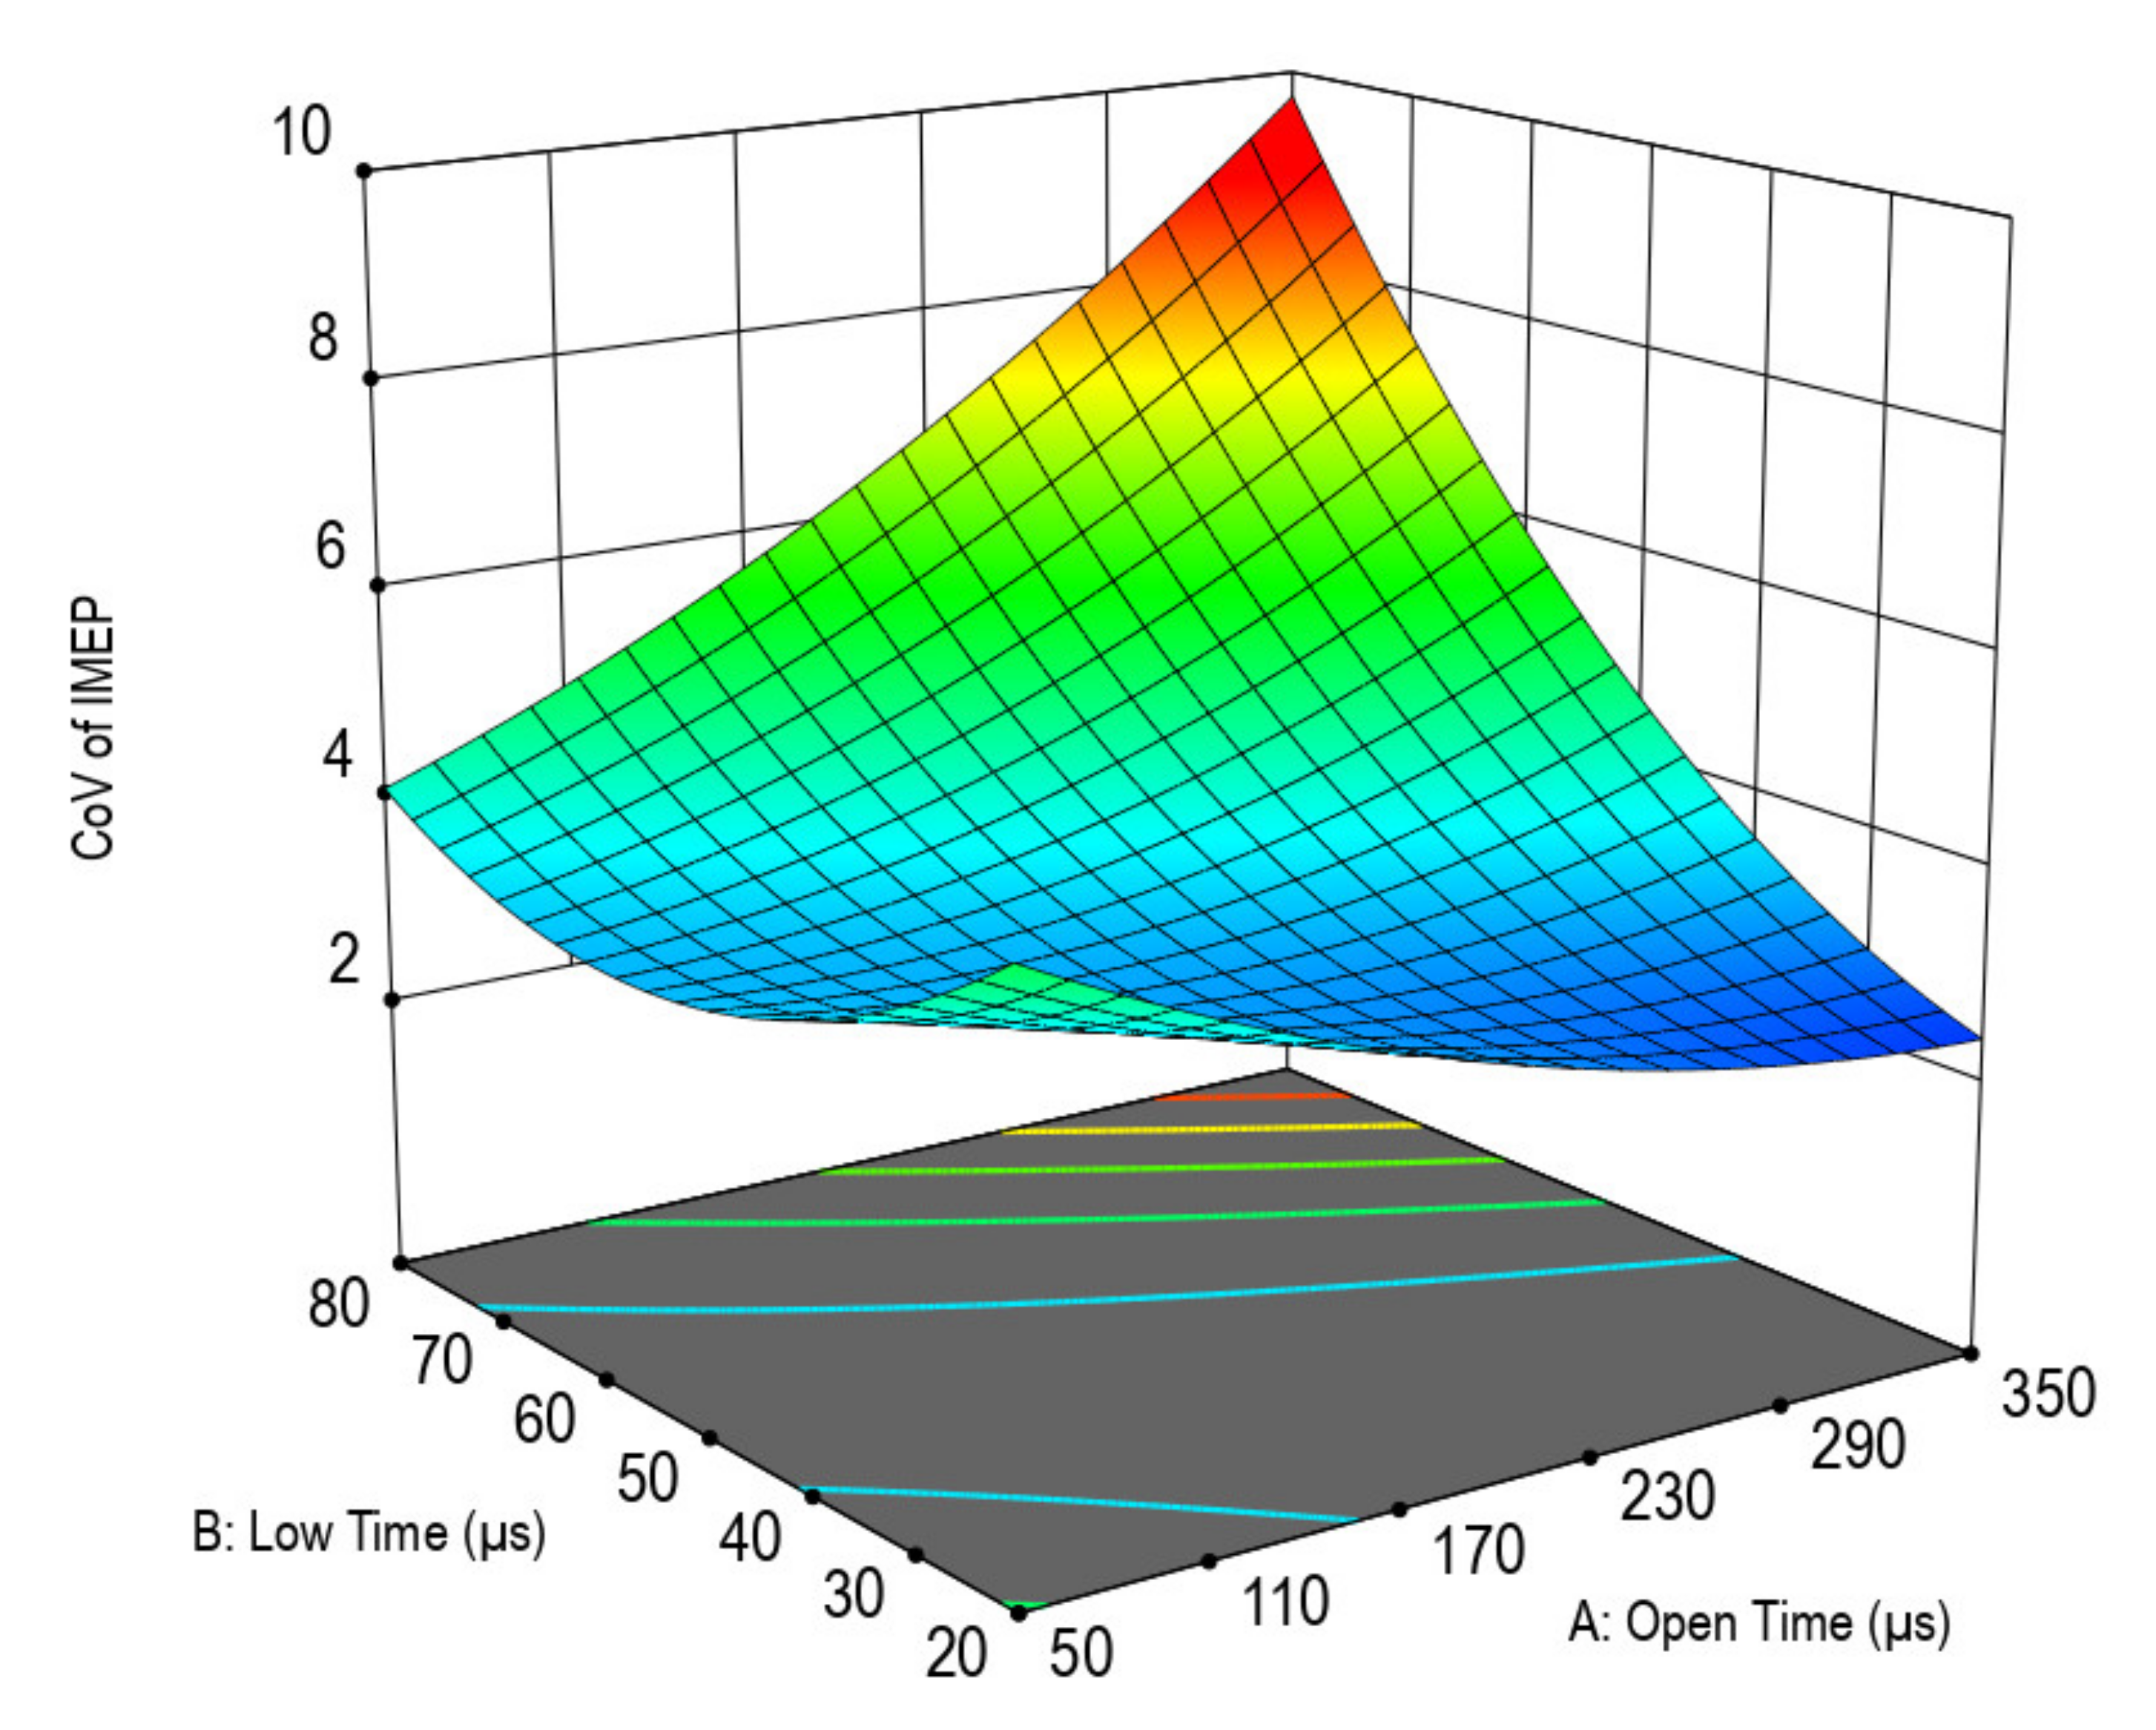
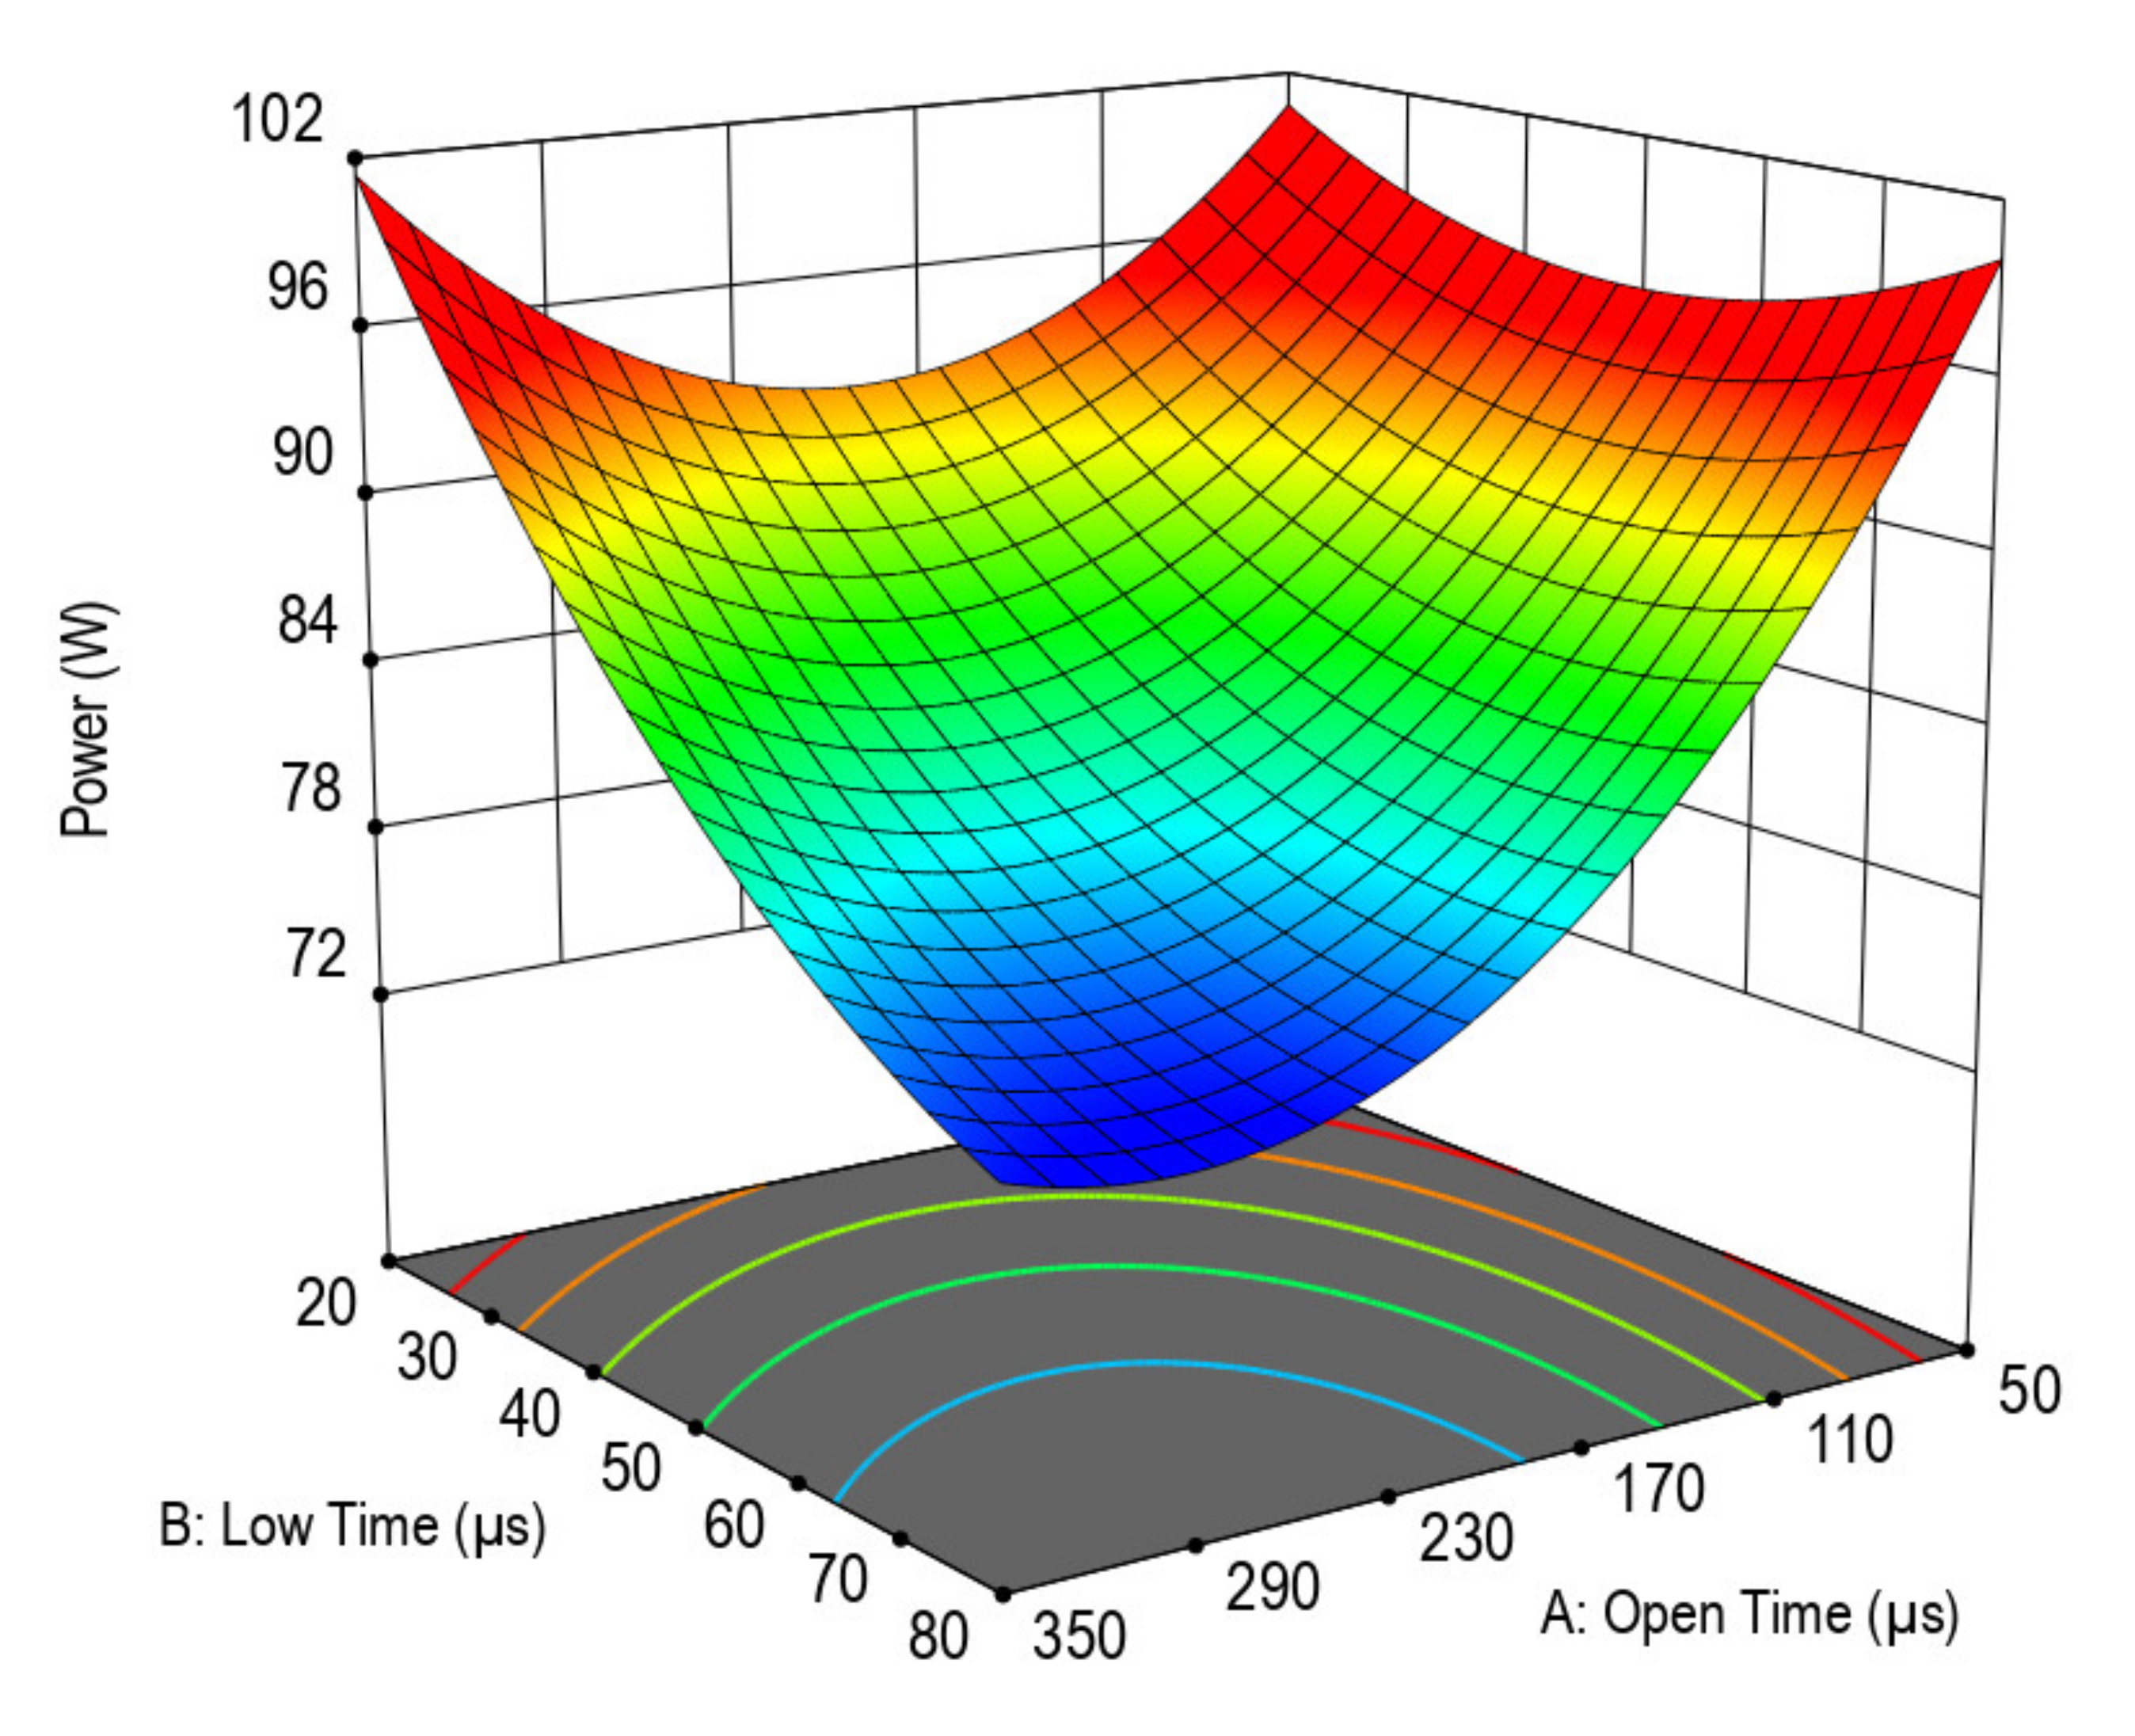
3.3. Optimization of Injector Parameters

After carrying out the all the experiments with parameters recommended by Design-Expert software, the indicated mean effective pressure (IMEP) collected for 100 cycles for run point number 1, 5, 10, 15 and 20 with parameters tabulated in Table 5 are illustrated in Figure 10. From the figure, it is observed that the IMEP for run point number 10 with Open time of 50 µs, Low time of 20 µs and 20% duty cycle fluctuated the most as compare to others. Based on the Analysis of Variance (ANOVA) table, significant factors affecting CoV of IMEP and injector power have been determined. Based on the ANOVA table for CoV of IMEP (Table 6) and injector power (Table 7), factor A, B, AB and AC interaction were significant for CoV of IMEP while factor A, B, and AB interaction were significant for injector power. In other word, Open time and Low time as well as interaction between Open time and Low time and interaction between Open time and duty cycle would have major impact for CoV of IMEP. While injector power was influenced by Open time and Low time as well as interaction between Open time and Low time.
The Prob > F value (p-value) in the tables indicated the probability of the factor being insignificant to the response. Since the Prob > F value for those factors stated above was less than 0.05, they were significant factors to the responses. To identify the fitness of experimental data, the R-squared value for CoV of IMEP and injector power was identified. Figure 11 shows the fitness graph for CoV of IMEP. The result shows that the CoV of IMEP data fitted the predicted line nicely with R-squared value of 0.928. However, the data collected for injector power did not fit the predicted line as well as CoV of IMEP with R-squared value equal to 0.8126 as shown in Figure 12. The surface in Figure 13 shows how the CoV of IMEP varied with Open time and Low time under 30% duty cycle. It can be noticed that the CoV of IMEP peak at high Open time and high Low time.
The effect of high Open time with low time on CoV of IMEP was the similar to low Open time with high Low time. The surface response of injector power with same parameters is illustrated in Figure 14. As seen in the figure, the power for low Open time was always high. This is because the injector required a long time to achieve peak current and more power was consumed during this duration. As the Open time increased, the power would reduce but this trend did not continue if the Open time was increased further. The final equation describes CoV of IMEP and injector power is tabulated in Table 8. Based on the analysis of software, the optimum condition for lowest CoV of IMEP and injector power was 230 µs Open time with 53 µs Low time and 27.5% duty cycle.

3.4. Result Validation

Validation is performed by carried out experiment with optimum parameters and compare the result to the predicted value. The experimental and predicted results are tabulated in Table 9. The percentage error for CoV of IMEP is 4.83% and for injector power is 0.033%; the percentage error for both is less than 5%. Therefore, the optimum parameters suggested by the software are accepted.

4. Conclusions

The conversion to a common rail fuel injection system for a single-cylinder diesel engine has been successfully performed and tested. A custom-made ECU has been developed to control the injection parameters. The injection parameters include SOI timings, rail pressure and number of injections applied in multiple injection scheme. The rail pressure and engine speed responses of the diesel engine after the conversion have been investigated. The in-cylinder pressure profile and HRR profile during combustion cycle have been obtained for varying SOI timings, rail pressure and number of injections applied in multiple injection scheme. A further study on the fuel injector parameters of a diesel engine equipped with common rail fuel injection system have been optimized by carrying out using RSM. The fuel injector parameters included open time, low time and duty cycle of injector signals. The results obtained could be summarized as follows:
  • The rail pressure response showed an error of less than 5% at steady state and rising time of less than 1 s. Hence, the rail pressure response was accurate and sufficiently quick.
  • The engine speed response showed an error of less than 5% at steady state and rising time of around 1 s. Hence, the engine speed response was accurate and sufficiently quick.
  • When SOI timing was advanced, the in-cylinder peak pressure increased and was shifted towards TDC, causing an increase in brake torque.
  • When rail pressure was increased, the in-cylinder peak pressure increased and was shifted towards TDC, causing an increase in brake torque.
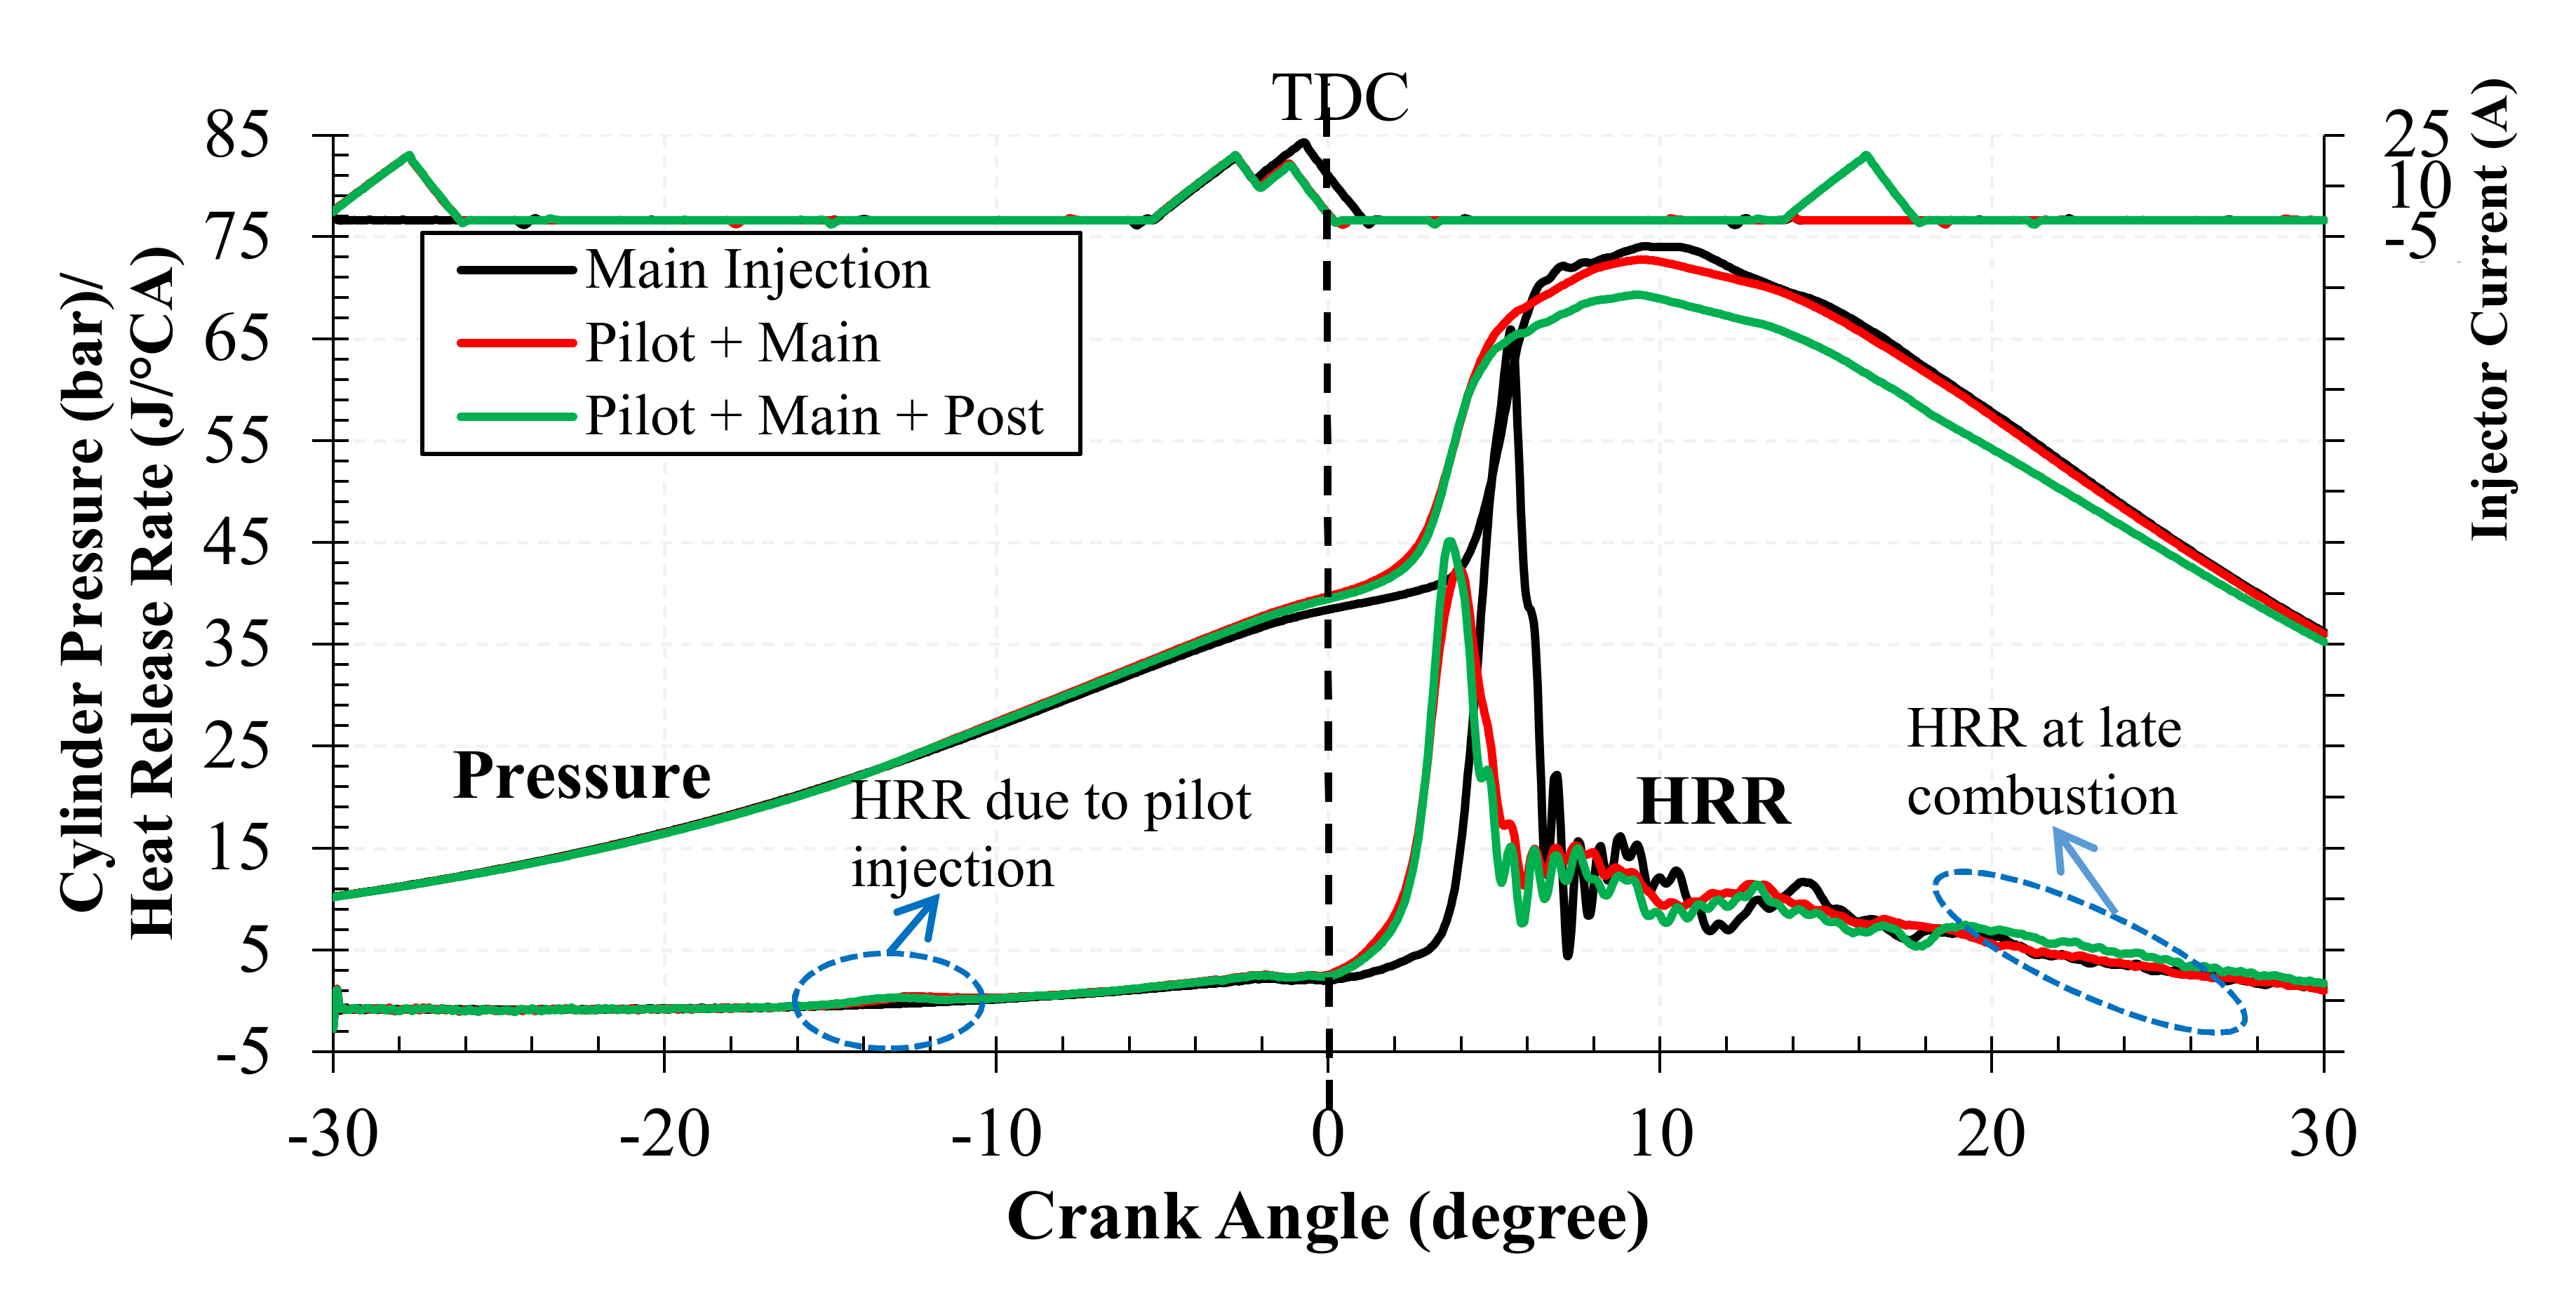
  • Implementation of multiple injection scheme caused a decrease in maximum PRR and peak HRR.
  • Application of post injection increased the late combustion HRR.
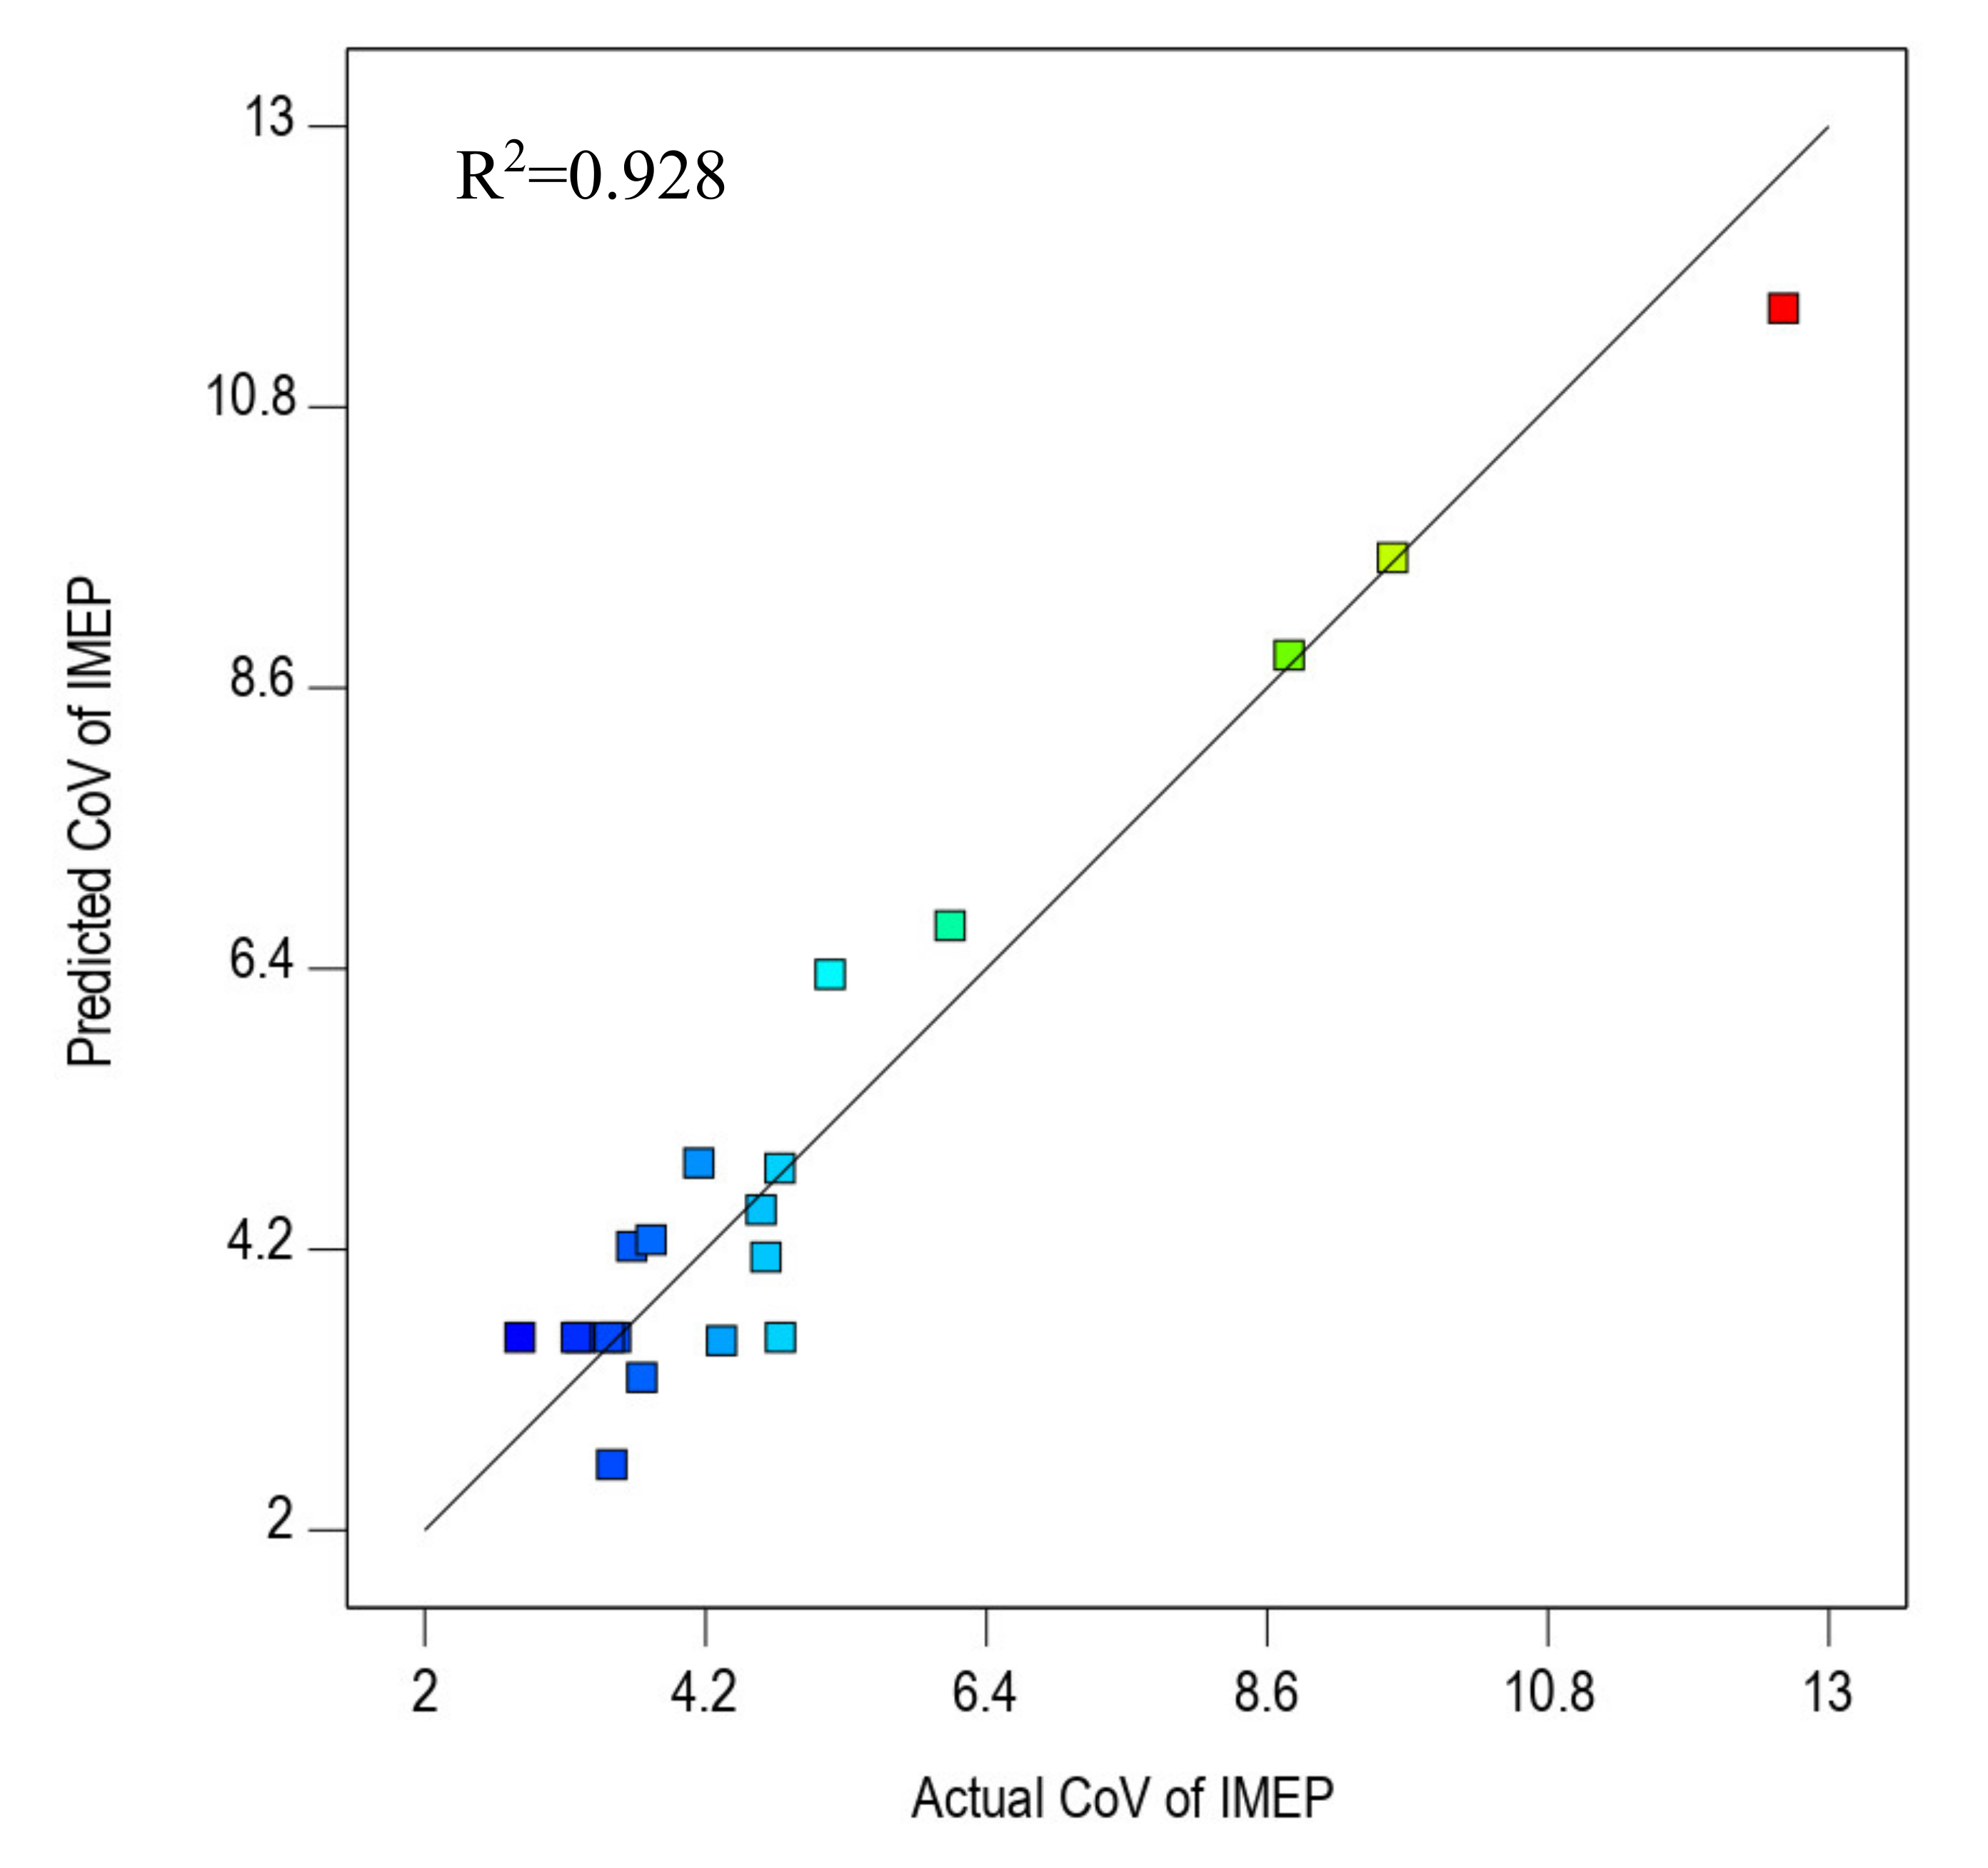
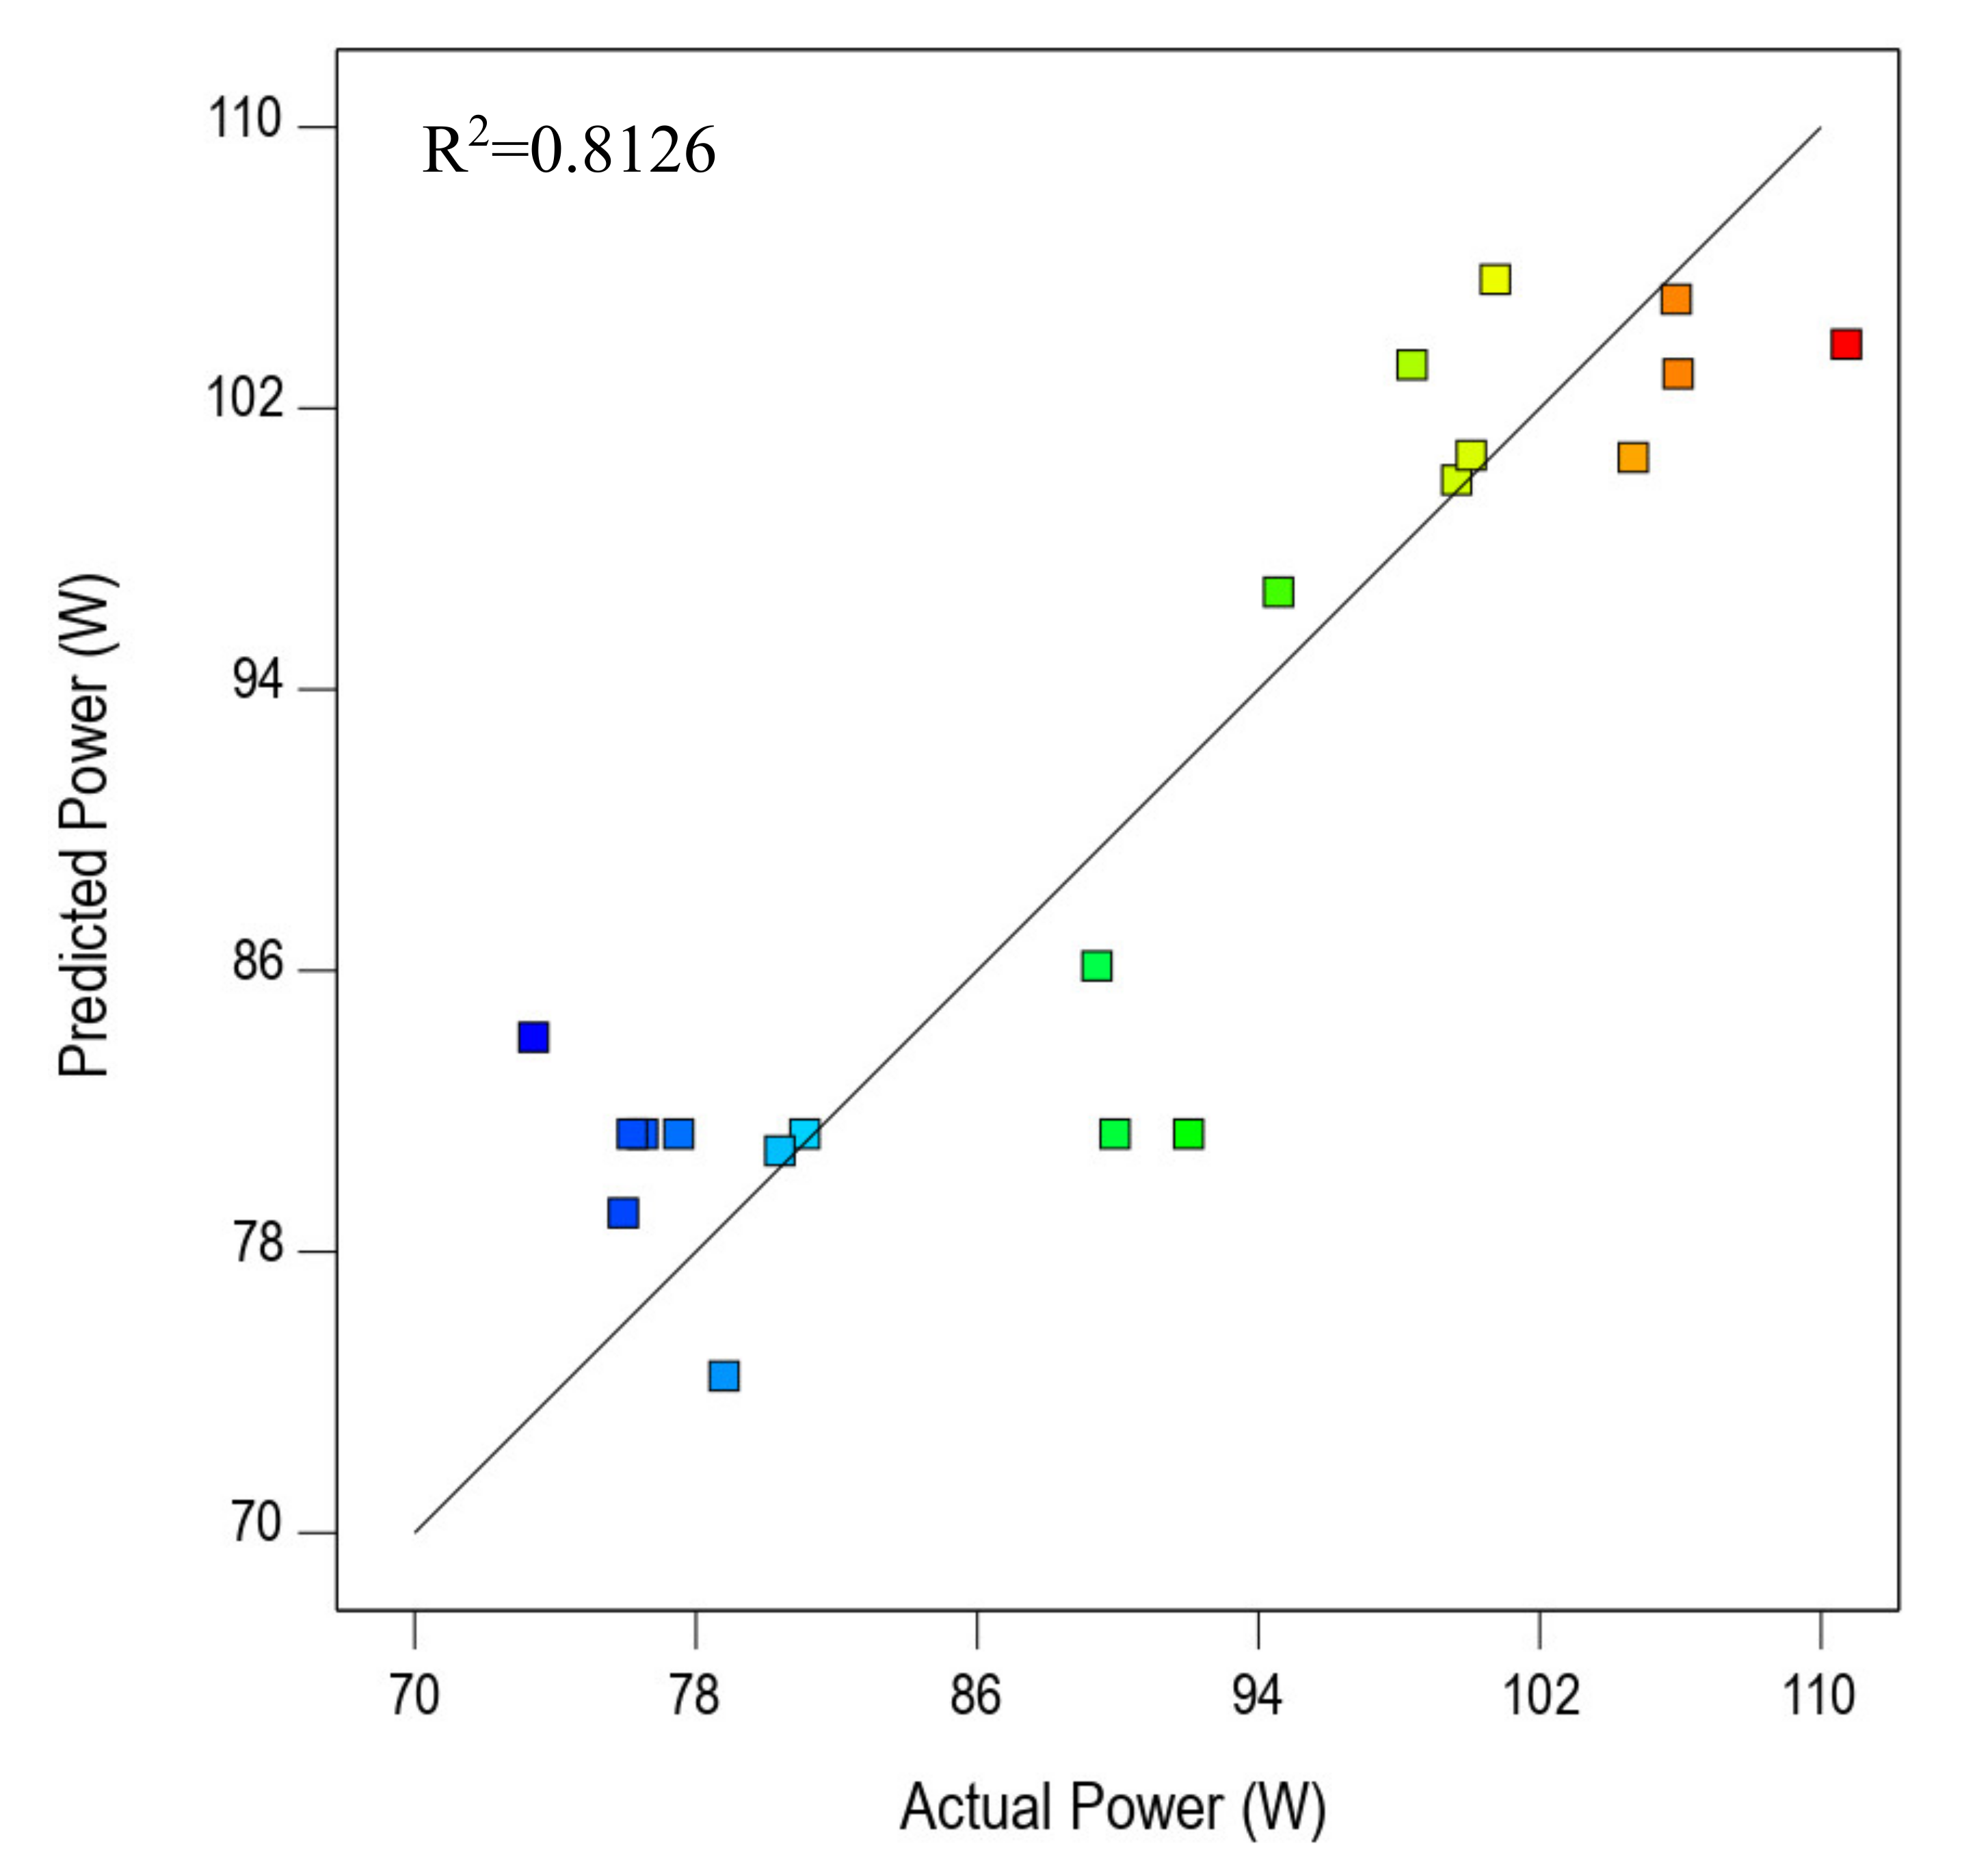
  • The optimum injector parameters to achieve lowest CoV of IMEP and injector power were 230 µs Open time with 53 µs Low time and 27.5% duty cycle.
  • Percentage of error between predicted and experimental results of injector power when optimum injector parameters were applied was 0.033%.
  • Percentage of error between predicted and experimental results of CoV of IMEP when optimum injector parameters were applied was 4.83%.
From this overview, it can be concluded that the developed common rail direct injection system is capable to control injection timing, injection pressure and number of injections per cycle. Additionally, the injector control parameters have been successfully optimized to operate under the best possible conditions.

Author Contributions

Conceptualization, Y.H.T.; Data curation, C.G.P.; Formal analysis, Y.H.T.; Funding acquisition, Y.H.T. and H.G.H.; Investigation, H.G.H.; Methodology, H.G.H.; Project administration, Y.H.T.; Resources, Y.H.T. and H.G.H.; Software, H.G.H. and T.D.L.; Supervision, Y.H.T.; Validation, Y.H.T.; Visualization, C.G.P., T.D.L. and H.T.N.; Writing—original draft, Y.H.T. and H.G.H.; Writing—review and editing, C.G.P., T.D.L. and H.T.N. All authors have read and agreed to the published version of the manuscript.

Funding

This study was supported by the Ministry of Higher Education of Malaysia and Universiti Sains Malaysia (USM) through Fundamental Research Grant Scheme (FRGS)- 203.PMEKANIK.6071444 (Title: Mechanism Study of Combustion and Formulation of Surrogate Biomass Producer Gas Using a CVCC System) and Universiti Sains Malaysia Research University (RUI) Grant Scheme- 1001.PMEKANIK.8014136 (Title: Effect of Fuel Injection Strategies and Intake Air Supply Control on Performance, Emissions, and Combustion Characteristics of Diesel Engine Fueled with Biodiesel Blended Fuels).

Conflicts of Interest

The authors declare no conflict of interest.

References

  1. United Nation. World Population Prospects The 2017 Revision: Key Findings and Advance Tables. 2017. Available online: https://esa.un.org/unpd/wpp/Publications/Files/WPP2017_KeyFindings.pdf (accessed on 11 August 2020).
  2. ExxonMobile. 2018 Outlook for Energy: A View to 2040. 2018. Available online: http://cdn.exxonmobil.com/~/media/global/files/outlook-for-energy/2018/2018-outlook-for-energy.pdf (accessed on 11 July 2020).
  3. International Energy Agency (IEA). Southeast Asia Energy Outlook. 2017. Available online: https://www.iea.org/publications/freepublications/publication/WEO2017SpecialReport_SoutheastAsiaEnergyOutlook.pdf (accessed on 11 July 2020).
  4. Mofijur, M.; Masjuki, H.H.; Kalam, M.; Rahman, S.A.; Mahmudul, H. Energy scenario and biofuel policies and targets in ASEAN countries. Renew. Sustain. Energy Rev. 2015, 46, 51–61. [Google Scholar] [CrossRef] [Green Version]
  5. International Energy Agency (IEA). Southeast Asia Energy Outlook—WEO Special Report. 2013. Available online: https://www.iea.org/publications/freepublications/publication/SoutheastAsiaEnergyOutlook_WEO2013SpecialReport.pdf (accessed on 30 July 2020).
  6. IEA. IEA (2020), European Union 2020. 2020. Available online: https://www.iea.org/reports/european-union-2020 (accessed on 11 July 2020).
  7. BP. Statistical Review of World Energy 2016. 2016. Available online: https://www.bp.com/content/dam/bp/pdf/energy-economics/statistical-review-2016/bp-statistical-review-of-world-energy-2016-full-report.pdf (accessed on 11 July 2020).
  8. Behera, S.R.; Dash, D.P. The effect of urbanization, energy consumption, and foreign direct investment on the carbon dioxide emission in the SSEA (South and Southeast Asian) region. Renew. Sustain. Energy Rev. 2017, 70, 96–106. [Google Scholar] [CrossRef]
  9. Gonzalez-Sanchez, M.; Martín-Ortega, J.L. Greenhouse Gas Emissions Growth in Europe: A Comparative Analysis of Determinants. Sustainability 2020, 12, 1012. [Google Scholar] [CrossRef] [Green Version]
  10. Virginie Marchal, R.D.; van Vuuren, D.; Clapp, C.; Château, J.; Lanzi, E.; Magné, B.; van Vliet, J. OECD ENVIRONMENTAL OUTLOOK TO 2050. CHAPTER 3: CLIMATE CHANGE. 2011. Available online: https://www.oecd.org/env/cc/49082173.pdf (accessed on 15 January 2018).
  11. Liaquat, A.M.; Kalam, M.A.; Masjuki, H.H.; Jayed, M.H. Potential emissions reduction in road transport sector using biofuel in developing countries. Atmos. Environ. 2010, 44, 3869–3877. [Google Scholar] [CrossRef]
  12. Gilpin, G.; Hanssen, O.J.; Czerwinski, J. Biodiesel’s and advanced exhaust aftertreatment’s combined effect on global warming and air pollution in EU road-freight transport. J. Clean. Prod. 2014, 78, 84–93. [Google Scholar] [CrossRef]
  13. Borecki, M.; Prus, P.; Korwin-Pawlowski, M.L. Capillary Sensor with Disposable Optrode for Diesel Fuel Quality Testing. Sensors 2019, 19, 1980. [Google Scholar] [CrossRef] [Green Version]
  14. Borecki, M.; Gęca, M.; Korwin-Pawlowski, M.L.; Prus, P. Capillary Sensor with UV-Forced Degradation and Examination of Fluorescence for Determination of Chemical Stability of Diesel and Biodiesel Fuels. Sens. Transducers 2018, 220, 20–30. [Google Scholar]
  15. Tamilselvan, P.; Nallusamy, N.; Rajkumar, S. A comprehensive review on performance, combustion and emission characteristics of biodiesel fuelled diesel engines. Renew. Sustain. Energy Rev. 2017, 79, 1134–1159. [Google Scholar] [CrossRef]
  16. Wierzbicka, A.; Nilsson, P.T.; Rissler, J.; Sällsten, G.; Xu, Y.; Pagels, J.; Albin, M.; Österberg, K.; Strandberg, B.; Eriksson, A.; et al. Detailed diesel exhaust characteristics including particle surface area and lung deposited dose for better understanding of health effects in human chamber exposure studies. Atmos. Environ. 2014, 86, 212–219. [Google Scholar] [CrossRef] [Green Version]
  17. Tan, X.-G.; Sang, H.-L.; Qiu, T.; Fan, Z.-Q.; Yin, W.-H. The Impact of Common Rail System’s Control Parameters on the Performance of High-power Diesel. Energy Procedia 2012, 16, 2067–2072. [Google Scholar]
  18. Natarajan, S.; Trasy, K.A.; Srihari, N.; Raja, S. Effects of Injection Timing on CI Engine Fuelled with Algae Oil Blend with Taguchi Technique. Energy Procedia 2017, 105, 1043–1050. [Google Scholar] [CrossRef]
  19. Ashok, B.; Nanthagopal, K.; Raj, R.T.K.; Bhasker, J.P.; Vignesh, D.S. Influence of injection timing and exhaust gas recirculation of a Calophyllum inophyllum methyl ester fuelled CI engine. Fuel Process. Technol. 2017, 167, 18–30. [Google Scholar] [CrossRef]
  20. Lim, G.; Lee, S.; Park, C.; Choi, Y.; Kim, C.G. Effect of ignition timing retard strategy on NOx reduction in hydrogen-compressed natural gas blend engine with increased compression ratio. Int. J. Hydrog. Energy 2014, 39, 2399–2408. [Google Scholar] [CrossRef]
  21. How, H.; Masjuki, H.H.; Kalam, M.; Teoh, Y. Influence of injection timing and split injection strategies on performance, emissions, and combustion characteristics of diesel engine fueled with biodiesel blended fuels. Fuel 2018, 213, 106–114. [Google Scholar] [CrossRef]
  22. Agarwal, A.K.; Srivastava, D.K.; Dhar, A.; Maurya, R.K.; Shukla, P.C.; Singh, A.P. Effect of fuel injection timing and pressure on combustion, emissions and performance characteristics of a single cylinder diesel engine. Fuel 2013, 111, 374–383. [Google Scholar] [CrossRef]
  23. Park, S.H.; Yoon, S.H.; Lee, C.S. HC and CO emissions reduction by early injection strategy in a bioethanol blended diesel-fueled engine with a narrow angle injection system. Appl. Energy 2013, 107, 81–88. [Google Scholar] [CrossRef]
  24. Khalid, A.; Manshoor, B. Effect of high injection pressure on mixture formation, burning process and combustion characteristics in diesel combustion. World Acad. Sci. Eng. Technol. 2012. [Google Scholar] [CrossRef]
  25. Chen, P.-C.; Wang, W.-C.; Roberts, W.L.; Fang, T. Spray and atomization of diesel fuel and its alternatives from a single-hole injector using a common rail fuel injection system. Fuel 2013, 103, 850–861. [Google Scholar] [CrossRef]
  26. Srinath, P.; Abdul, S.; Shreeprakash, B. Study of the Effect of Fuel Injection Pressure on Diesel Engine Performance and Emission—A Review. In Proceedings of the IEEE -International Conference on Research and Development Prospectus on Engineering and Technology (ICRDPET), EGS Pillay Engineering College, Nagapattinam, Tamil Nadu, India, 29–30 March 2013. [Google Scholar]
  27. Hwang, J.; Qi, D.; Jung, Y.; Bae, C. Effect of injection parameters on the combustion and emission characteristics in a common-rail direct injection diesel engine fueled with waste cooking oil biodiesel. Renew. Energy 2014, 63, 9–17. [Google Scholar] [CrossRef]
  28. Aalam, C.S.; Saravanan, C.; Anand, B.P. Impact of high fuel injection pressure on the characteristics of CRDI diesel engine powered by mahua methyl ester blend. Appl. Therm. Eng. 2016, 106, 702–711. [Google Scholar] [CrossRef]
  29. Nanthagopal, K.; Ashok, B.; Rajagopal, T.K.R. Influence of fuel injection pressures on Calophyllum inophyllum methyl ester fuelled direct injection diesel engine. Energy Convers. Manag. 2016, 116, 165–173. [Google Scholar] [CrossRef]
  30. Gumus, M.; Sayin, C.; Canakci, M. The impact of fuel injection pressure on the exhaust emissions of a direct injection diesel engine fueled with biodiesel–diesel fuel blends. Fuel 2012, 95, 486–494. [Google Scholar] [CrossRef]
  31. Labecki, L.; Ganippa, L. Effects of injection parameters and EGR on combustion and emission characteristics of rapeseed oil and its blends in diesel engines. Fuel 2012, 98, 15–28. [Google Scholar] [CrossRef]
  32. Sperl, A. The Influence of Post-Injection Strategies on the Emissions of Soot and Particulate Matter in Heavy Duty Euro V Diesel Engine. SAE Tech. Pap. Ser. 2011. [Google Scholar] [CrossRef]
  33. Wang, Z.; Wyszynski, M.L.; Xu, H.; Abdullah, N.R.; Piaszyk, J. Fuel injection and combustion study by the combination of mass flow rate and heat release rate with single and multiple injection strategies. Fuel Process. Technol. 2015, 132, 118–132. [Google Scholar] [CrossRef]
  34. Busch, S.; Zha, K.; Miles, P.C. Investigations of closely coupled pilot and main injections as a means to reduce combustion noise in a small-bore direct injection Diesel engine. Int. J. Engine Res. 2014, 16, 13–22. [Google Scholar] [CrossRef]
  35. Badami, M.; Mallamo, F.; Millo, F.; Rossi, E.E. Influence of Multiple Injection Strategies on Emissions, Combustion Noise and BSFC of a DI Common Rail Diesel Engine. SAE Tech. Pap. Ser. 2002. [Google Scholar] [CrossRef]
  36. D’Ambrosio, S.; Ferrari, A. Potential of double pilot injection strategies optimized with the design of experiments procedure to improve diesel engine emissions and performance. Appl. Energy 2015, 155, 918–932. [Google Scholar] [CrossRef]
  37. Zhuang, J.; Qiao, X.; Bai, J.; Hu, Z. Effect of injection-strategy on combustion, performance and emission characteristics in a DI-diesel engine fueled with diesel from direct coal liquefaction. Fuel 2014, 121, 141–148. [Google Scholar] [CrossRef]
  38. Goldwine, G. The Effect of Fuel Injection Profile on Diesel Engine Performance. Ph.D. Thesis, The Senate of Ben-Gurion University, Beersheba, Israel, 2008. [Google Scholar]
  39. Ergenç, A.T.; Koca, D.Ö. PLC controlled single cylinder diesel-LPG engine. Fuel 2014, 130, 273–278. [Google Scholar] [CrossRef]
  40. Carpenter, A.L.; Mayo, R.E.; Wagner, J.G.; Yelvington, P.E. High-Pressure Electronic Fuel Injection for Small-Displacement Single-Cylinder Diesel Engines. J. Eng. Gas Turbines Power 2016, 138, 102808. [Google Scholar] [CrossRef]
  41. Agarwal, A.K.; Gupta, P.; Dhar, A. Combustion, performance and emissions characteristics of a newly developed CRDI single cylinder diesel engine. Sadhana 2015, 40, 1937–1954. [Google Scholar] [CrossRef]
  42. Mäkelä, M. Experimental design and response surface methodology in energy applications: A tutorial review. Energy Convers. Manag. 2017, 151, 630–640. [Google Scholar] [CrossRef]
  43. Bezerra, M.A.; Santelli, R.E.; Oliveira, E.P.; Villar, L.S.; Escaleira, L.A. Response surface methodology (RSM) as a tool for optimization in analytical chemistry. Talanta 2008, 76, 965–977. [Google Scholar] [CrossRef] [PubMed]
  44. Wang, G.; Deng, Y.; Xu, X.; He, X.; Zhao, Y.; Zou, Y.; Liu, Z.; Yue, J. Optimization of air jet impingement drying of okara using response surface methodology. Food Control. 2016, 59, 743–749. [Google Scholar] [CrossRef]
  45. Gunst, R.F. Response Surface Methodology: Process and Product Optimization Using Designed Experiments. Technometrics 1996, 38, 284–286. [Google Scholar] [CrossRef]
  46. Gilmour, S.G. Response Surface Designs for Experiments in Bioprocessing. Biometrics 2005, 62, 323–331. [Google Scholar] [CrossRef]
  47. Yusri, I.; Majeed, A.P.P.A.; Mamat, R.; Ghazali, M.; Awad, O.I.; Azmi, W. A review on the application of response surface method and artificial neural network in engine performance and exhaust emissions characteristics in alternative fuel. Renew. Sustain. Energy Rev. 2018, 90, 665–686. [Google Scholar] [CrossRef]
  48. Singh, Y.; Sharma, A.; Singh, G.K.; Singla, A.; Singh, N.K. Optimization of performance and emission parameters of direct injection diesel engine fuelled with pongamia methyl esters-response surface methodology approach. Ind. Crop. Prod. 2018, 126, 218–226. [Google Scholar] [CrossRef]
  49. Sharma, A.; Singh, Y.; Singh, G.K.; Habte, A.T.; Singh, N. Production of polanga methyl esters and optimization of diesel engine parameters through response surface methodology approach. Process. Saf. Environ. Prot. 2019, 121, 94–102. [Google Scholar] [CrossRef]
  50. Patel, H.; Rajai, V.; Das, P.; Charola, S.; Mudgal, A.; Maiti, S. Study of Jatropha curcas shell bio-oil-diesel blend in VCR CI engine using RSM. Renew. Energy 2018, 122, 310–322. [Google Scholar] [CrossRef]
  51. Khoobbakht, G.; Karimi, M.; Kheialipour, K. Effects of biodiesel-ethanol-diesel blends on the performance indicators of a diesel engine: A study by response surface modeling. Appl. Therm. Eng. 2019, 148, 1385–1394. [Google Scholar] [CrossRef]
  52. Gopal, K.; Sathiyagnanam, A.; Kumar, B.R.; Saravanan, S.; Rana, D.; Sethuramasamyraja, B. Prediction of emissions and performance of a diesel engine fueled with n-octanol/diesel blends using response surface methodology. J. Clean. Prod. 2018, 184, 423–439. [Google Scholar] [CrossRef]
  53. Buxton, R. Design Expert 7: Introduction. 2007. Available online: https://www.lboro.ac.uk/media/media/schoolanddepartments/mlsc/downloads/Design-Expert-7.pdf (accessed on 8 September 2020).
  54. Jeon, J.; Park, S. Effects of pilot injection strategies on the flame temperature and soot distributions in an optical CI engine fueled with biodiesel and conventional diesel. Appl. Energy 2015, 160, 581–591. [Google Scholar] [CrossRef]
  55. Li, H.; Song, C.; Lv, G.; Pang, H.; Qiao, Y. Assessment of the impact of post-injection on exhaust pollutants emitted from a diesel engine fueled with biodiesel. Renew. Energy 2017, 114, 924–933. [Google Scholar] [CrossRef]
Figure 1. Front view of engine test bed.
Processes 08 01122 g001
Figure 2. The timing diagram of encoder and proximity sensor signal together with SOICU and DI-PWCU signals.
Processes 08 01122 g002
Figure 3. Schematic photo of (a) base engine before modification and (b) retrofitted test engine. Note that the retrofitted engine is equipped with a common-rail solenoid injector mounted on the engine cylinder head.
Processes 08 01122 g003
Figure 4. Flowchart of optimization algorithm.
Processes 08 01122 g004
Figure 5. Rail pressure response from 200 to 500 bar with 100 bar step change at engine speed of 1600 rpm.
Processes 08 01122 g005
Figure 6. Engine speed response from 1600 to 2000 rpm with a 100-rpm step change at rail pressure of 300 bar.
Processes 08 01122 g006
Figure 7. Cylinder pressure and HRR curves for various SOI timing.
Processes 08 01122 g007
Figure 8. Cylinder pressure and HRR curves for various injection pressures.
Processes 08 01122 g008
Figure 9. Cylinder pressure and HRR curves for various injection strategies.
Processes 08 01122 g009
Figure 10. 100 cycles IMEP for run point number 1, 5, 10, 15 and 20.
Processes 08 01122 g010
Figure 11. Fitness graph for CoV of IMEP.
Processes 08 01122 g011
Figure 12. Fitness graph for injector power.
Processes 08 01122 g012
Figure 13. Response surface of CoV of IMEP as a function of Open time and Low time.
Processes 08 01122 g013
Figure 14. Response surface of injector power as a function of Open time and Low time.
Processes 08 01122 g014
Table 1. Specification of (a) engine used as a construction base for the test engine and (b) test engine.
Parameter(a) Construction Base Engine(b) Test Engine
Bore × Stroke70 mm × 57 mm
Displacement219 cm3
Rated power3.5 kW @3600 rpm
Compression ratio20.1:1
Fuel injection systemMechanical cam driven injectionElectronic common rail fuel injection
Fuel pumpEngine mechanically drivenElectrically driven
Table 2. Common rail direct injection fuel system specification.
ComponentSpecification
Fuel
Injector
ModelDelphi
Number of injector nozzle5
Nominal injector nozzle diameter0.134 mm
Supply voltage12 V
Fuel Supply PumpModelDenso HP 3 gear pump
Maximum working pressure1800 bar
Table 3. Injection tests which have been conducted.
Variable InvestigatedValue TestedConstant
SOI timing0, 2, 4, 6, 8, 10°BTDCEngine speed: 1600 rpm
Load: 5 Nm
Rail pressure200, 300, 400, 500 barEngine speed: 1600 rpm
Load: 5 Nm
SOI timings: 4°BTDC
Multiple injection schemeMain injection
Pilot + main injection
Pilot + main + post injection
Engine speed: 1600 rpm
Load: 5 Nm
SOI timings: 4°BTDC
Table 4. Experiment run point recommended by the Design-Expert® software.
StdRunFactor 1Factor 2Factor 3
A: Open Time B: Low TimeC: PWM
(µs)(µs)(%)
613502040
1724505030
153502040
18420010030
1052005047
1662005030
772005030
208508020
1392005015
1910502020
9112005030
112200030
11133508020
3143502020
121505030
8162005030
2173508040
4182005030
519508040
14202005030
Table 5. Injector parameters for run point number 1, 5, 10, 15 and 20.
Run PointOpen Time (µs)Low Time (µs)Duty Cycle (%)
13502040
52005047
10502020
1505030
202005030
Table 6. ANOVA table for CoV of IMEP.
SourceSum of SquaresdfMean SquareF-Valuep-Value
Model111.48912.3914.320.0001significant
A-Open Time7.1917.198.320.0163
B-Low Time35.54135.5441.08< 0.0001
C-PWM0.011810.01180.01370.9092
AB33.98133.9839.28< 0.0001
AC5.3815.386.220.0318
BC2.0712.072.390.1529
A23.3713.373.90.0767
B221.36121.3624.690.0006
C22.6612.663.080.1098
Residual8.65100.8651
Lack of Fit6.2551.252.60.1591not significant
Pure Error2.450.4809
Cor Total120.1319
Table 7. ANOVA table for injector power.
SourceSum of SquaresdfMean SquareF-Valuep-Value
Model2314.499257.174.820.0109significant
A-Open Time440.761440.768.260.0166
B-Low Time610.251610.2511.440.007
C-Duty cycle1.7811.780.03330.8589
AB320.051320.0560.0343
AC29.36129.360.55010.4753
BC0.009710.00970.00020.9895
A2893.121893.1216.740.0022
B2210.061210.063.940.0754
C226.61126.610.49860.4962
Residual533.651053.36
Lack of Fit285.83557.171.150.4397not significant
Pure Error247.82549.56
Cor Total2848.1319
Table 8. Final equation for CoV of IMEP and injector power.
CoV of IMEP=Power=
18.69484 133.4455
−0.044174*Open Time−0.171042*Open Time
−0.224953*Low Time−0.374014*Low Time
−0.469936*Duty cycle−1.10553*Duty cycle
0.000458*Open Time * Low Time−0.001406*Open Time * Low Time
0.000547*Open Time * Duty cycle0.001277*Open Time * Duty cycle
0.001696*Low Time * Duty cycle0.000116*Low Time * Duty cycle
0.000025*(Open Time)20.000407*(Open Time)2
0.001365*(Low Time)20.00428*(Low Time)2
0.004648*(Duty cycle)20.014689*(Duty cycle)2
Table 9. Comparison of experimental and predicted results.
ExperimentalPredicted Error = E x p e r i m e n t P r e d i c t E x p e r i m e n t × 100 %
CoV of IMEP4.02443.82994.83%
Power (W)79.833879.80770.033%

