Abstract
A dynamic model of a Direct Methanol Fuel Cell is developed in the MATLAB platform. A newly proposed Coefficient Diagram based Proportional Integral Controller (CD-PIC) is designed and its parameters are calculated. The newly designed CD-PIC is implemented in a real time Direct Methanol Fuel Cell (DMFC) experimental setup. Performances in real time operation of the Direct Methanol Fuel Cell (DMFC) are evaluated. The performance of CD-PIC is obtained under tracking of set point changes. In order to evaluate the CD-PIC performances, most popular tuning rules based Conventional PI Controllers (C-PIC) are also designed and analyzed. Set point tracking is carried out for the step changes of ±10% and ±15% at two different operational points. The controller performances are analyzed in terms of Controller Performance Measuring (CPM) indices. The said performance measures indicate that the proposed CD-PIC gives the superior performances for set point changes and found very much robust in controlling DMFC.
1. Introduction
In the present stage of the energy crisis, it has become unavoidable to find out the alternatives for the largely exploited fossil fuels. Recent developments in the field of fuel cells have given encouraging results suggesting their possible use of replacing the conventional highly polluting, less efficient combustible engines. A considerable development in technology has made life on this planet really comfortable, but with this comfort, came the burden of finding and providing quality energy. Fuel cells are energy resources that convert chemical energy into electricity in a clean and resourceful manner, through a chemical reaction with air or oxygen. Although, different varieties of fuel cells have been developed, the search is on to find out the most promising fuel cell that offers higher efficiency. In this context, the Direct Methanol Fuel Cell (DMFC) appears to be the most promising tool to provide power to electronic devices. This DMFC is targeted especially to portable applications, where energy and power density are more important than efficiency. DMFC converts the chemical energy into electricity directly with higher efficiency. DMFC is a subcategory of the Proton-Exchange Membrane Fuel Cell (PEMFC) in which methanol is used as the fuel. The salient features of DMFC are the ease of transport of methanol, low or zero emissions, reliability in operation and utilization of methanol directly as a fuel to convert chemical energy to electric power. The simple design of the fuel cell system does not give maximum efficiency. Dynamic modeling influences a major role to enhance the fuel cell efficiency [1,2]. Dynamic modeling of the fuel cell is also necessary for better understanding of the DMFC operation.
The increasing usage of the control mechanism in various chemical, electrochemical and allied fields, created a need to develop a reliable control strategy. The classical control techniques are applicable for simple processes. Advanced control techniques find wide applications, but the procedure involved in designing the controller is complex. In 1991, a Japanese researcher Prof. Shuji Manabe proposed the polynomial controller concept called the Coefficient Diagram Method. The Coefficient Diagram inherits the classical and advanced control theories. The uniqueness of the method is an adaptation of the polynomial illustration for both the process plant and its controller, which utilize the Two Degrees of Freedom Structure (2DOF) of the control system [3]. In addition, the Coefficient Diagram approach is relatively not very sensitive to load and bounded uncertainties caused by variations in the process variables. One of the important properties of this approach is that, the transient response of the controller is under the control of the designer by selecting the parameter values Viz., stability indices (γi), equivalent time constant (τ), and stability limits (γi*) during the initial stage of the design itself [4].
In this study, the Coefficient Diagram based Proportional Integral Controller (CD-PIC) is designed and tested over DMFC through real time experimentation. The servo response obtained with CD-PIC is compared with the performances of conventional PI Controller tuning rules Viz., Ala Eldin Abdallah Awouda, et al. [5] Tuning Rule (ARTR) and Padma Sree, et al. [6] Tuning Rule (PSCTR). Performance indices are used to validate the results.
2. Materials and Methods
2.1. State of the Art of DMFC Experimentation
The Direct Methanol Fuel Cell is fed with methanol in the anode side where the methanol is oxidized and air is fed at the cathode side where the reduction of oxygen takes place. The anode and cathode are separated by a membrane. The membrane allows the proton to transfer into the cathode from the anode, while blocking other components. Membrane Electrode Assembly (MEA) comprises of electrodes and membrane. Each electrode is made of a gas diffusion layer, followed by a catalyst layer. The membrane used in DMFC is Nafion 117. When an aqueous methanol is fed at the anode layer, it diffuses to the cathode layer and gets oxidized to carbon dioxide, electrons and protons. Protons pass through the membrane, to the cathode side catalytic layer and reduced to form water [7,8]. The Direct Methanol Fuel Cell real time experimental setup available at Sri Venkateswara College of Engineering, Sriperumbudur Tk-602117 (photo plate) is presented in Figure 1a. A dynamic model (Figure 1b) was developed from the mathematical modeling equations of DMFC [9]. The First Order Plus Time Delay transfer function model is obtained from the open loop response of the designed dynamic model of the system.
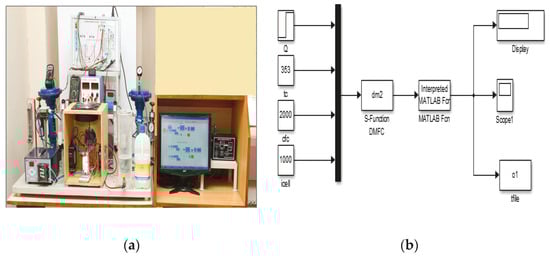
Figure 1.
(a) Photo Plate of the Direct Methanol Fuel Cell (DMFC) control system. (b) Dynamic model of the DMFC.
2.2. Proposed Polynomial PI Controller
The general closed loop block diagram of the Coefficient Diagram based control system [10] is represented in Figure 2a. In the current study, it is assumed that no external disturbance signal is acting on the system. In the transfer function of the system, N(s) is numerator and D(s) is denominator polynomials. A(s) is the forward denominator, F(s) is the reference numerator and B(s) is the feedback numerator polynomials of the controller transfer function. It resembles a 2DOF structure [11,12], since the transfer function of the controller has two numerators.
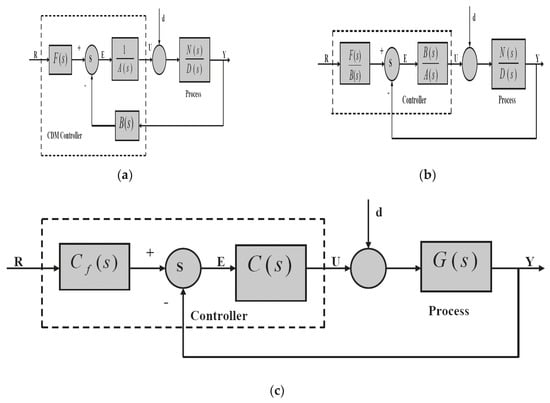
Figure 2.
(a) General closed loop Coefficient Diagram. (b) Equivalent closed loop Coefficient Diagram. (c) Coefficient Diagram based closed loop PI Control system.
The characteristic polynomial of the closed-loop system is represented as P(s). The steady state system output is represented as
where, , ai > 0
In Equation (1), A(s) and B(s) are controller polynomials and selected as:
To design the CD-PIC, it is necessary to modify the general Coefficient Diagram based closed loop block diagram. The equivalent block diagram of the CDM control system [13] is represented in Figure 2b. In this figure, the controller polynomials Viz., A(s) and B(s) are selected as and . The set-point filter element F(s) in Figure 2b is selected as given in Equation (4). By selecting F(s) in this way, the error that may occur in the steady-state response of the closed-loop system is reduced to zero.
The block diagram of proposed polynomial PI control system is given in Figure 2c. Here C(s) is the main controller and Cf(s) is feed forward controller. The main controller C(s) is said to have the form of the conventional PI controller as
The conventional PI controller parameters in terms of polynomials (k1, k0) are obtained as Kc = k1 and Ti = k1/k0. The parameters of Cf(s) are based on the CD-PIC parameters and there is no need for extra calculations.
2.3. Design of Proposed Coefficient Diagram Based PI Controller
The dynamic model based open loop simulation studies with the step changes (±10% and ±15%) at two different steady state operating points Viz., 40% cell voltage and 60% of cell voltage, were carried out and their responses were recorded. From these open loop step responses, model parameters of FOPTD system Viz., process time constant, process gain and process time delay were determined. The derived FOPTD model of the DMFC system given in Equation (9) was considered [14,15] to illustrate the performance of the proposed Coefficient Diagram based PI control strategy.
The delay present in the said DMFC model was approximated using the Pade’s approximation procedure and represented as
The CD-PIC polynomials were selected as, and . The stability indices selected to design CD-PIC strategy were γ1 = 5 and γ2 = 2.5. The target characteristic polynomial was derived using an equivalent time constant (τ), and stability indices (γi).
PTarget(s) = 0.0034s3 + 0.0428s2 + 0.214s + 0.214
The CD-PIC polynomials were computed from target characteristic polynomial as k1 = 13.407 and k0 = 1. Comparing CD-PIC polynomials with the PI Controller transfer function, the CD-PIC parameters were computed as Kc = 13.407 and KI = 1
The parameters of Cf(s) were obtained from the CD-PIC parameters without any extra calculations and is given as
The set point tracking studies were conducted [16,17] in the DMFC closed loop system real time experimental setup and the designed CD-PIC parameters.
3. Results and Discussion
In this section, the real time implementation of the newly proposed Coefficient Diagram based PI Controller (CD-PIC) and popular tuning rules (ARTR and PSCTR) based convectional PI Controllers on the Direct Methanol Fuel Cell (DMFC) were discussed [18]. It was done at an operating point of 40% cell voltage and 60% cell voltage with ± 10% and ± 15% step changes [19].
3.1. CD-PIC in DMFC
The proposed CD-PIC was implemented in DMFC real time experimental setup using the CD-PIC design parameters derived in the Section 2.3. The CD-PIC structure was developed in the MATLAB platform and interfaced with the real time DMFC experiment through the VDPID-03 data acquisition card [20]. Set point tracking of CD-PIC in the real time experiment was conducted with the step changes of ±10% and ±15% at the operating points of 40% cell voltage and the responses are shown in Figure 3a. Controller Performance Measuring Indices (CPM Indices) were calculated and represented in Table 1a. The set point tracking was repeated at another operating point of 60% cell voltage and the responses are shown in Figure 3b. CPM Indices were calculated and reported in Table 1b.
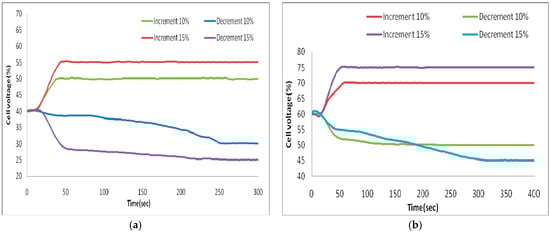
Figure 3.
(a) Coefficient Diagram based PI Controller (CD-PIC): real time servo response at the 40% operating point. (b) CD-PIC: real time servo response at the 60% operating point.

Table 1.
(a) CD-PIC real time step responses at the 40% operating point. (b) CD-PIC real time step responses at the 60% operating point.
3.2. Conventional PIC in DMFC
Set point tracking with a conventional PIC in real time was experimented. It is observed that no control action was performed by the conventional PI Controllers under set point tracking condition for 10% step change at both the operating points of 40% cell voltage and 60% cell voltage. The set point tracking responses obtained are represented in Figure 4a–d for 40% cell voltage and 60% cell voltage. CD-PIC performances were compared with Conventional PICs to confirm the suitability of CD-PIC for the control of the Direct Methanol Fuel Cell system.
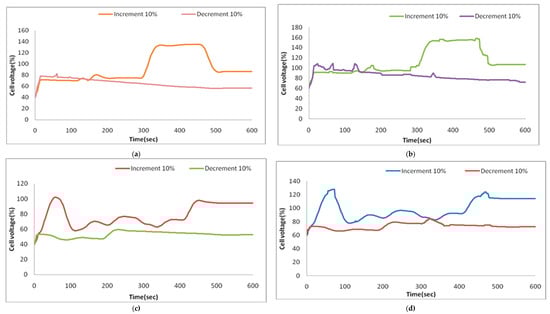
Figure 4.
(a) Ala Eldin Abdallah Awouda, et al. Turning Rule (ARTR): real time set point tracking at the 40% operating point. (b) ARTR: real time set point at the 60% operating point. (c) Padma Sree, et al. Tuning rule (PSCTR): real time set point at the 40% operating point. (d) PSCTR: real time set point tracking at the 60% operating point.
4. Conclusions
In the current study, a new Coefficient Diagram based PI Control strategy was represented for DMFC. The proposed CD-PIC behaviors were compared with Conventional PI Controllers through real time experimentation. The proposed new control strategy was very plain, highly efficient and more reliable. It was implemented in real time experimentation of DMFC system in a closed loop, compared with recently developed two different conventional PI controllers for validation. It was found that the performance indices Viz., error indices and time domain indices of CD-PIC in real time were having only a marginal difference and had reasonable agreement. Moreover, from the real time set point tracking responses, it was observed that ARTR and PSCTR based conventional PICs were not able to track the set point changes in the DMFC operation. In all the cases of investigation with the CD-PIC, overshoot did not exist when compared to conventional PI controllers. The overall performance of DMFC operation clearly got enhanced in real time experiment with the newly proposed CD-PIC.
Author Contributions
Project administration, funding acquisition, conceptualization, methodology, investigation and validation are done by R.G., Resources, Formal analysis, review and editing are done by S.S., All authors have read and agreed to the published version of the manuscript.
Funding
This research received external funding under Research Promotion Scheme of AICTE, New Delhi, India.
Acknowledgments
The authors are grateful to P.K. Bhaba, Former Head, Department of Chemical Engineering, Annamalai University, Chidambaram, India and R. Parthiban, Head, Department of Chemical Engineering, SSN College of Engineering, Chennai, India for their unlimited lifetime guidance.
Conflicts of Interest
The authors declare no conflict of interest.
References
- Zenith, F.; Krewer, U. Modelling dynamics and control of a portable DMFC system. J. Process. Control. 2010, 20, 630–642. [Google Scholar] [CrossRef]
- Govindarasu, R.; Parthiban, R.; Bhaba, P.K. Experimental characterization of direct methanol fuel cell based on manifold design. Int. J. Appl. Chem. 2014, 10, 197–203. [Google Scholar]
- Manabe, S. The application of coefficient diagram method to ACC benchmark problem. In Proceedings of the 2nd Asian Control Conference, Seoul, Korea, 22–25 July 1997; pp. 135–138. [Google Scholar]
- Manabe, S. Coefficient diagram method. In Proceedings of the IFAC Symposium on Automatic Control in Aerospace, Seoul, Korea, 24–28 August 1998; pp. 211–222. [Google Scholar]
- Awouda, A.E.A.; Mamat, R.B. New PID tuning rule using ITAE criteria. Int. J. Eng. 2007, 3, 597–608. [Google Scholar]
- Padma, S.P.; Srinivas, M.N.; Chidambaram, M. A simple method of tuning PID controllers for stable and unstable FOPTD systems. Comput. Chem. Eng. 2004, 28, 2201–2218. [Google Scholar] [CrossRef]
- Sundmacher, K.; Scultz, T.; Zhou, S.; Scott, K.; Ginkel, M.; Gilles, E.D. Dynamics of the DMFC: Experiments and model-based analysis. Chem. Eng. Sci. 2001, 56, 333–441. [Google Scholar] [CrossRef]
- Govindarasu, R.; Parthiban, R.; Bhaba, P.K. Experimental studies on catalysts in direct methanol fuel cell. Elixir Int. J. Chem. Eng. 2014, 73, 26330–26332. [Google Scholar]
- Govindarasu, R.; Somasundaram, S. Studies on influence of cell temperature in direct methanol fuel cell operation. Process 2020, 8, 353. [Google Scholar] [CrossRef]
- Manabe, S. Brief tutorial and survey of Coefficient Diagram Method. In Proceedings of the 4th Asian Control Conference, Singapore, 25–27 September 2002; pp. 1161–1165. [Google Scholar]
- Imal, E. Design of CDM-based controller for integrating pumped tank process. J. Electr. Electron. Eng. 2009, 9, 1003–1013. [Google Scholar]
- Govindarasu, R.; Parthiban, R.; Bhaba, P.K. Coefficient diagram: A novel tool in polynomial controller design. Int. J. Chem. Sci. 2014, 12, 1645–1654. [Google Scholar]
- Bhaba, P.K.; Somasundram, S. Design and real time implementation of CDM-PI control system in a conical tank liquid level process. Sens. Transducer J. 2011, 133, 53–63. [Google Scholar]
- Argyropoulos, P.; Scott, K.; Taama, W.M. Dynamic response of the direct methanol fuel cell under variable load conditions. J. Power Sources 2000, 87, 153–161. [Google Scholar] [CrossRef]
- Krewer, U.; Sundmacher, K. Transfer function analysis of the dynamic behaviour of DMFCs: Response to step changes in cell current. J. Power Sources 2005, 154, 153–170. [Google Scholar] [CrossRef]
- Govindarasu, R.; Somasundaram, S.; Bhaba, P.K. Computer aided tool box for the design of CDM based PID family controllers. Taga J. Graph. Technol. 2018, 14, 1525–1537. [Google Scholar]
- Somasundaram, S.; Benjanarasuth, T. CDM-based two degree of freedom PI controller tuning rules for stable and unstable FOPTD processes and pure integrating processes with time delay. Int. J. Autom. Control. 2019, 13, 263–281. [Google Scholar] [CrossRef]
- Rinu, R.R.; Anand, L.D.V. Design and real time implementaion of a CDM-PI controller for a spherical tank level system. Int. J. Appl. Res. Mech. Eng. 2013, 2, 2319–3182. [Google Scholar]
- Janani, R.; Thirunavukkarasu, I.; Bhat, V.S. Experimental implementation of cdm based two mode controller for an interacting 2*2 distillation process. Int. J. Pure Appl. Math 2018, 118, 2241–2251. [Google Scholar]
- Meenakshipriya, B.; Saravanan, K.; Krishnamurthy, K.; Bhaba, P.K. Design and implimentation of a CDM-PI control strategy in a pH neutralization system. Asian J. Sci. Res. 2012, 5, 78–92. [Google Scholar] [CrossRef][Green Version]


© 2020 by the authors. Licensee MDPI, Basel, Switzerland. This article is an open access article distributed under the terms and conditions of the Creative Commons Attribution (CC BY) license (http://creativecommons.org/licenses/by/4.0/).