Article

Calculating the Binary Tortuosity in DEM-Generated Granular Beds

by
Wojciech Sobieski
Department of Mechanical Engineering and Fundamentals of Machine Design, Faculty of Technical Sciences, University of Warmia and Mazury in Olsztyn, ul. M. Oczapowskiego 11, 10-957 Olsztyn, Poland
Processes 2020, 8(9), 1105; https://doi.org/10.3390/pr8091105
Submission received: 28 July 2020 / Revised: 28 August 2020 / Accepted: 3 September 2020 / Published: 4 September 2020
(This article belongs to the Special Issue DEM Simulations and Modelling of Granular Materials)

Abstract

:
In this paper, a methodology of calculating the tortuosity in three-dimensional granular beds saved in a form of binary geometry with the application of the A-Star Algorithm and the Path Searching Algorithm is presented. The virtual beds serving as examples are prepared with the use of the Discrete Element Method based on data of real, existing samples. The obtained results are compared with the results described in other papers (obtained by the use of the Lattice Boltzmann Method and the Path Tracking Method) as well as with the selected empirical formulas found in the literature. It was stated in the paper that the A-Star Algorithm gives values similar (but always slightly underestimated) to the values obtained via approaches based on the Lattice Boltzmann Method or the Path Tracking Method. In turn, the Path Searching Algorithm gives results in the same value range as popular empirical formulas and additionally it is approximately two times faster than the A-Star Algorithm.

Graphical Abstract

1. Introduction

The prediction of the pressure drop occurring during fluid flows is one of the most important tasks in mass or heat transport in porous media. If the dynamics of the fluid flow is correctly mapped, then the more complicated phenomena or processes may be taken into account. Despite many years of investigations into the relationships between features of porous media and pressure losses, the problem is still not fully resolved. The main difficulty results from the huge variety of porous materials occurring in nature as well in industry.
In the literature, many laws for calculating the pressure drop in fluid flow systems with porous media can be found; however, most of them may by saved in one unified form [1]
d p d x = A ( Φ ) [ μ v f ] + B ( Φ ) [ ρ v f 2 ]
where p is the pressure [Pa], x is a coordinate along which the pressure drop occurs [m], A ( Φ ) and B ( Φ ) are two generalized terms, dependent on the set Φ characterizing the spatial structure of the porous medium, μ is the dynamic viscosity of the fluid [kg/ms], ρ is the density of the fluid [kg/m 3 ] , and v f is the filtration velocity [m/s].
The set Φ may be defined as follows,
Φ = { d , ϕ ( V , V f ) , ϵ ( V , V s ) , τ ( L p , L 0 ) , S 0 ( S S , V , V s ) , Ψ , . . . }
where d is a representative (e.g., average) particle diameter [m], ϕ is the porosity [ ] , V is the volume of the porous body [m 3 ] , V f is the volume of the pore space (filled by a fluid) [m 3 ] , ε is the volume fraction [ ] , V s is the volume of the solid part of the porous body [m 3 ] , τ is the tortuosity [ ] , L p is the actual path length inside pore space [m], L 0 is the thickness of the porous medium [m], S 0 is the specific surface of the porous body [1/m], S s is the inner surface of the solid body [m 2 ] , and ψ is a sphericity coefficient [ ] (less than 1 in general and equal to 1 when the particles are spherical in shape).
In the literature, one can find many formulas for A ( Φ ) and B ( Φ ) terms matching the topology of Equation (1), e.g., Darcy (1856) [2], Forchheimer (1901) [3], Kozeny-Carman (1937) [4,5], Ergun (1952) [6], Mian (1992) [7], Skjetne (1999) [8], Samsuri et al. (2000) [9], Belyadi (2006) [10], Belyadi (2006) [11], Lord et al. (2006) [12], and Wu et al. (2006) [13], but almost all of them are related to the geometrical structure of the porous media (elements of the set Φ ).
In a porous body consisting of spherical particles (a granular bed), most elements of the set Φ may be easy calculated in an analytical way on the basis of the particle locations and sizes. In fact, the tortuosity, defined as the ratio of the actual path length inside pore channels to the thickness of the porous medium, is the only parameter which is difficult to determine.
There are three main approaches to the calculation of tortuosity in porous media:
  • Direct analysis of the pore channels geometry. The computational space may be expressed directly in a form of the vector geometry, or indirectly, by a grid of nodes, cells, elementary volumes, pixels, or voxels. Algorithms may have analytical origins or may be based on different discrete techniques. In this approach the tortuosity is expressed as follows [4,5],
    τ = L p L 0
    If the tortuosity is calculated directly, on the basis of shapes of pore channels, then it is called the geometric or geometrical tortuosity. Examples of models based on pore channel geometry may be found in [14,15,16].
  • The analysis of transportation properties of fluids flowing through pore channels. In this approach [17,18]
    τ = v v x
    where v is the the absolute value of local flow velocity obtained for a creeping flow, v x is the X-component of velocity (where X is the direction of main flow), and is a spatial average over the pore space. The tortuosity calculated with the use of Equation (4) is in the literature called the hydraulic tortuosity. If a velocity field is available, than the so-called streamline tortuosity may be also calculated [19]. Other examples of calculating the hydraulic tortuosity may be found in [20,21,22].
  • The analysis of diffusional properties of porous media and the application of the following relationship [23,24],
    D e f f = D ε τ f
    where D e f f is the effective diffusivity [m 2 /s], D is the intrinsic diffusivity of the conductive phase [m 2 /s], ε is the volume fraction of the conductive phase [ ] , and τ f is the tortuosity factor [-] defined as the square of the tortuosity. The diffusional approach is applied, e.g., in [25,26,27].
Based on the above-mentioned methodologies, as well as on the experimental measurements that are not described here, different empirical formulas were proposed. In Table 1, examples of such formulas destined for packed beds are presented. It may be seen that the tortuosity is usually treated as a direct function of the porosity. In the last column, some examples of results illustrating the range of the tortuosity for a chosen porosity are shown (see Section 2.1).
In the context of the hereby investigation different methodologies based on the so-called Random Walk technique [32] are particularly interesting. In this approach a virtual object is created, which randomly moves in the available calculational space.
Nakashima and Watanabe (2002) [33] applied the Random Walk method to calculate the tortuosity in a granular bed consisting of spherical particles with the average diameter equal to 2.11 [mm] and the standard deviation 0.06 [mm]. The geometry of the porous medium is described by a discrete lattice of voxels. The walker executes a random jump to one of the six nearest unoccupied sites. If the randomly selected site or a voxel is occupied by an obstacle or solid, the jump is not performed. This model shares many features with the Path Searching Algorithm developed by the author and described in Section 2.4.
Boudreau and Meysman (2015) [34] proposed a geometrical tortuosity model which serves for predicting the tortuosity in marine muds represented by the nonoverlapping disks arranged in layers and located randomly. In this model a virtual walker is defined, attempts to move through the pore space in a direction parallel to the cylindrical axis of the disks. In their model, if the walker is in the pore space between the disks, it will simply move along the main direction. If the walker encounters a disk, it will choose a random direction and take a straight line along the disk surface, until it reaches an edge of the disk and the movement in the main direction will be again possible. The idea is quite similar to the Path Searching Algorithm described in Section 2.4, but the model developed by Boudreau and Meysman is analytical and destined only for obstacles having one shape. In this context the Path Searching Algorithm is more universal.
Huang et al. (2019) [35] propose the so-called Random Walking Particle Tracking (RWPT) method. The random walk of a particle in an advection velocity field is modeled by a stochastic differential equation containing certain terms responsible for the particle displacement, the advection displacement, and a random walk displacement. The geometry is saved in the form of a structural grid, in which each cell represents the pore space or the solid part of the porous medium. Walkers follow a straight trajectory and change this trajectory only as a result of collisions with walls.
Amien et al. (2019) [36] used the Simple Neurite Tracer (SNT) to analyze the tortuosity in four kind of digital samples of porous rock model with the size of 256×256 pixels. NST is a plugin of ImageJ software designed to allow easy semi-automatic tracing of neurons or other filament-like structures (e.g., microtubules and blood vessels) through either 2D images or 3D image stacks [37]. Details related to the method applied are not described, but on the home page of the software it is mentioned that A-Star algorithm is also implemented in this code. In the context of the paper, it is quite important to underline that this approach may be applied only in specific geometries.
Cao et al. (2019) [38] presented an analytical model of calculating the tortuosity in cement-based materials containing aggregates with spherical or quasi-spherical shape. Paths are expressed as straight lines. However, when the path meets an obstacle, it bypasses it and returns to the original trajectory. Their results seem to be debatable, because the obtained tortuosity values are very high (between 25 and 50) and this does not correspond with the schemas presented in this work, in which paths are relatively straight.
In the hereby paper a methodology, based on porous media in which the geometry is saved in a form of binary matrix of zeros and ones, is proposed. The idea was inspired by the Lattice Boltzmann Method [39]. Formula (3), in which the path length is calculated by the use of the A-Star Algorithm or the Path Searching Algorithm, is applied to calculate the tortuosity. In Figure 1, the main idea is presented. Black circles represent the solid part of the porous body. In turn, the white circles represent the grid nodes belonging to the pore space. An example of path is marked by red color. It is important to note that the trajectory depends on the assumptions of the algorithm used (for this reason in Figure 1 two variants of paths are shown). The tortuosity obtained in the described way is called here the binary tortuosity (it is a kind of the geometrical tortuosity). The main difference between binary algorithms described in the paper and Random Walk methods is that the binary algorithms are determined by rigid rules (except for one specific case in the Path Searching Algorithm) and not by random choices.
It should be underlined that the A-Star algorithm is relatively often applied to calculate paths in a space containing different obstacles or limitations. However, it is usually used in other research areas, such as mobile robots, vehicle traffic, transportation, or logistics [40,41]. Papers in which the A-Star algorithm is used directly in the context of porous media are very difficult to find. However, the mentioning of the implementation of A-Star algorithms in the ImageJ code suggests that such papers most probably exist. The implementation of both algorithms (for in the case of the A-Star Algorithm there are two variants) was performed by the author in 2019. The Patch Searching Algorithm was developed by the author the same year.
The proposed methodology covers the following steps.
  • Preparing the geometry of a porous body with the use of any method. In the hereby paper, virtual beds generated by the use of the Discrete Element Method (Section 2.2) are applied. They represent the existing bed samples consisting of glass marbles. Such a choice was dictated by the fact that the alternative results for these bed samples are available and thus can be used as comparative data. At this stage, it is assumed that the porosity of virtual bed samples must be the same as the porosity of a real bed sample. The formulas collected in Table 1 clearly indicate that porosity is the most important factor influencing the tortuosity value.
  • Converting the available vector geometry to a binary geometry.
  • Calculating the path lengths (Section 3.3) and then calculating the binary tortuosity (Section 3.4) with the use of the A-Star Algorithm (Section 2.3) and the Path Searching Algorithm (Section 2.4). At this stage, it is assumed that all calculations will be repeated for three geometries (Section 3.1) and for a few different resolutions of the binary geometry (Section 3.2).
  • Comparing the obtained results with other independent data as well as with the data obtained from empirical formulas collected in Table 1 (Section 3.4). At this stage, the hydraulic tortuosity, calculated with the use of the Lattice Boltzmann Method (which is also based on the geometry expressed by binary matrices), as well as the geometric tortuosity, determined by the Path Tracking Method, serve as the reference data [42]. These tortuosities were obtained for the same material as in the present study (Section 2.1). Additionally, the results obtained by Wang, who investigated tortuosity in very similar granular systems [22], are taken into account during the comparison.
It should be highlighted, however, that the proposed methodology may be used only in the pore system with all channels open. If some pore channels are closed (blind cavities appear), then the path length will be much too long and the tortuosity will be strongly overestimated [21]. There are two kinds of systems in which the binary tortuosity may be calculated: granular beds (in 3D only, where a particle has contact points and the space around these contact points is always available) and any system (in 2D or 3D) with relatively high porosity consisting of separate solid objects. The limitation mentioned here is related to both algorithms used.
The main aim of the study is to find a method for calculating the tortuosity in high scale granular beds (which means the beds consisting of a high number of particles) within a reasonable calculation time. In other words, it is a try to find a good alternative for the approach proposed by Koponen et al. [17], which may be applied only in relatively small systems and which demands a huge computational power [21,42,43]. The hereby paper may be also treated as a continuation of investigations described in the three cited papers.

2. Materials and Methods

2.1. Materials

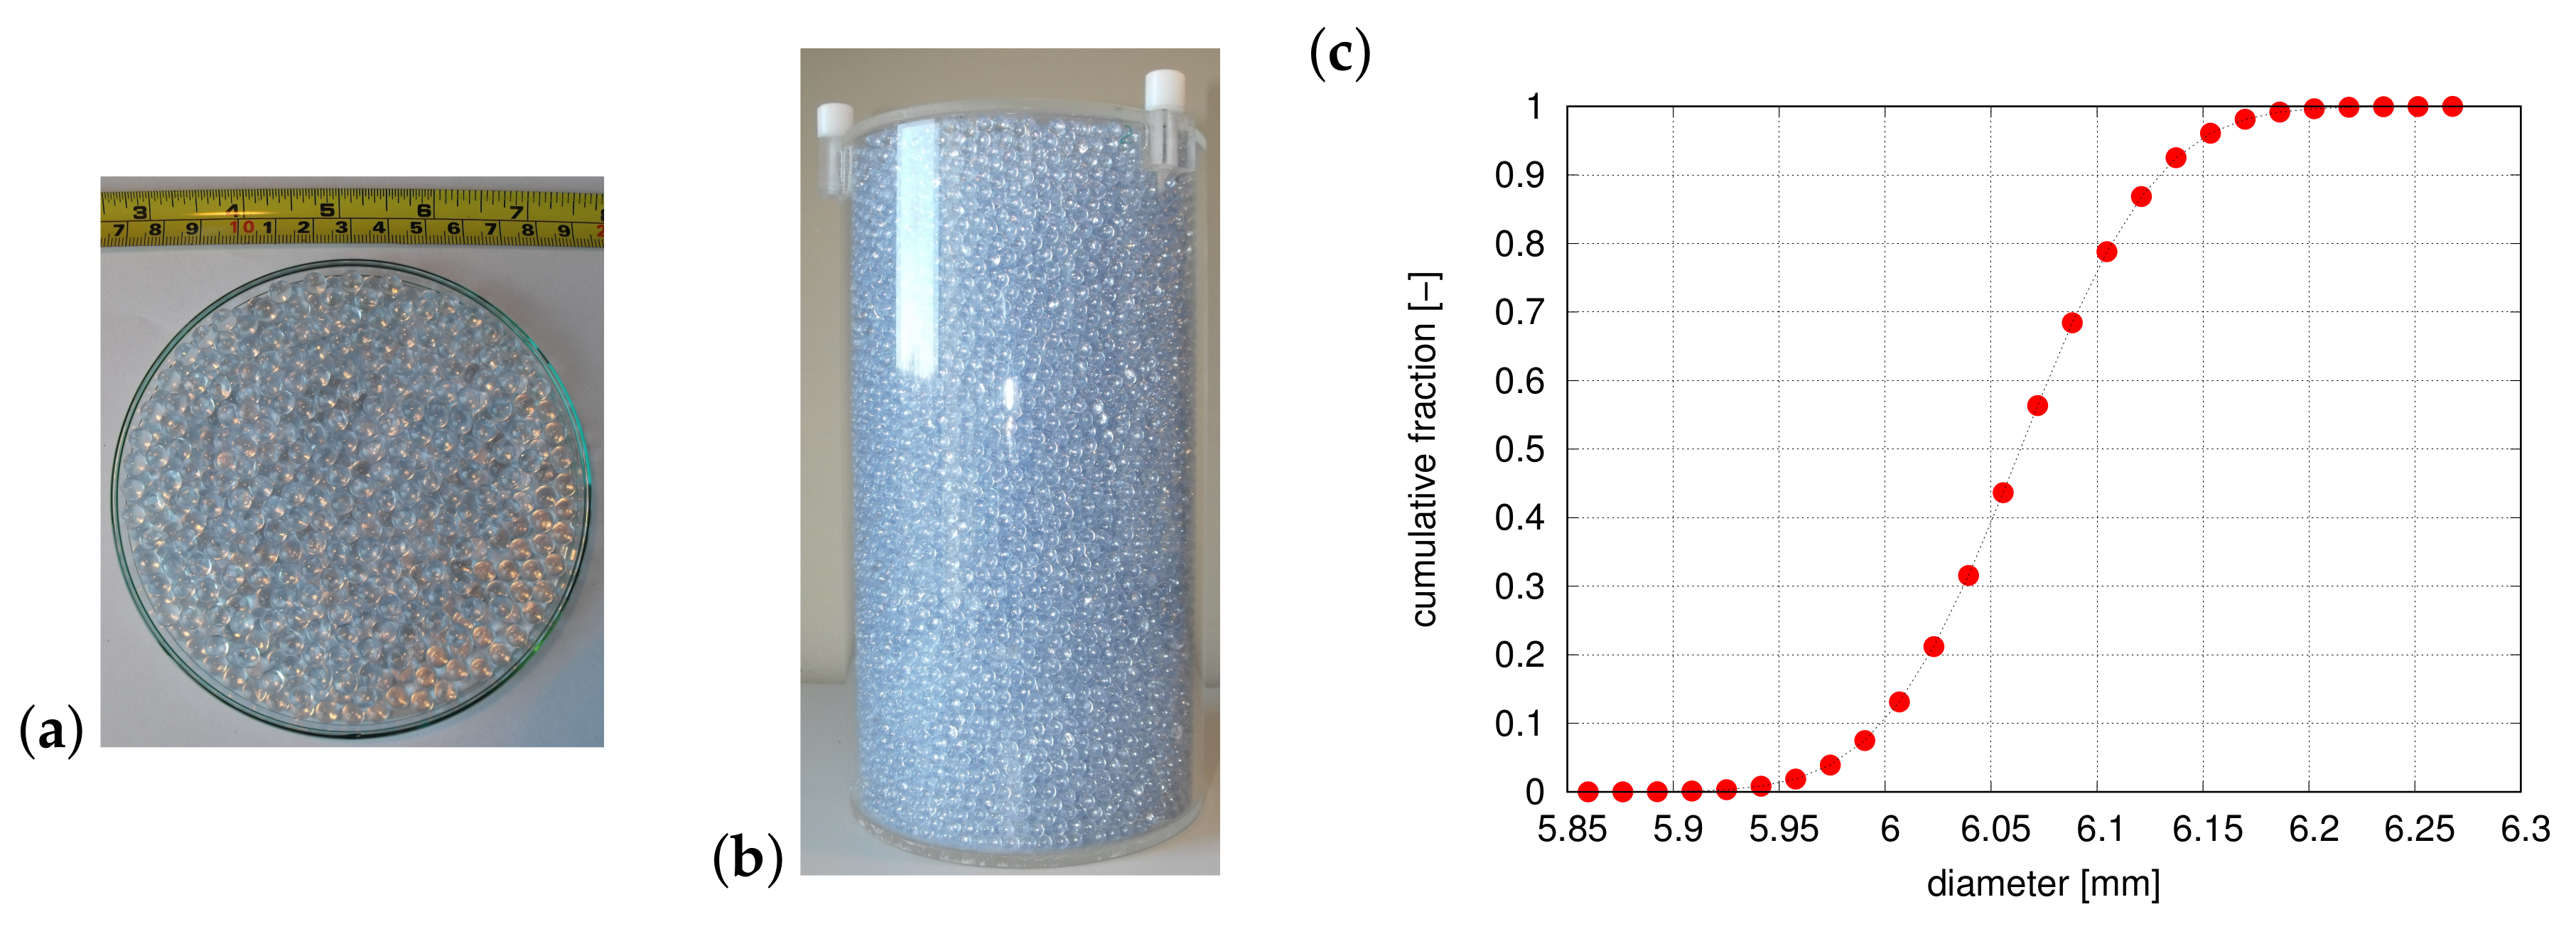
It was assumed that the numerical investigations are related to a real sample of granular bed consisting of SiLibeads Glass beads (Type S) [44] (Figure 2). To obtain the data related to particle sizes, 100 beads were randomly selected and then their diameters were measured, along two axes, with the use of the micrometre screw of ± 0.01 [mm] accuracy. It was stated that the diameters follow Gaussian distribution at significance level 0.01 of the Kolmogorov–Smirnov test [45]. The mean diameter was equal to 6.072 [mm] with the standard deviation of 0.051 [mm]. During the next measurements, based on a graduated 200 [mm] cylinder, it was found out that the average porosity (obtained from 15 repetitions) was equal to 0.413 [ ] . Such a value agrees with the literature data [46,47].

2.2. Discrete Element Method

The Discrete Element Method (DEM) is a method of analyzing various solid systems, which is based on the classic Newton’s dynamic principles [48]. Typically, two kinds of solids are considered: particles, most often representing a granular matter, and walls, representing in turn various parts of technical infrastructure (tanks, bins, silos, pipes, chutes, conveyors components, etc.). Originally, the particles could only have a spherical shape, but nowadays other simple shapes (such as cylinders, cuboids, polyhedrons, etc.) or complex shapes consisting of rigidly connected bodies with basic shapes (the so-called clumps) are increasingly used. Due to the article context, the discussion is limited to analyzing spherical particles only. However, the methodology described may be also used in beds consisting of particles with a more complicated shape.
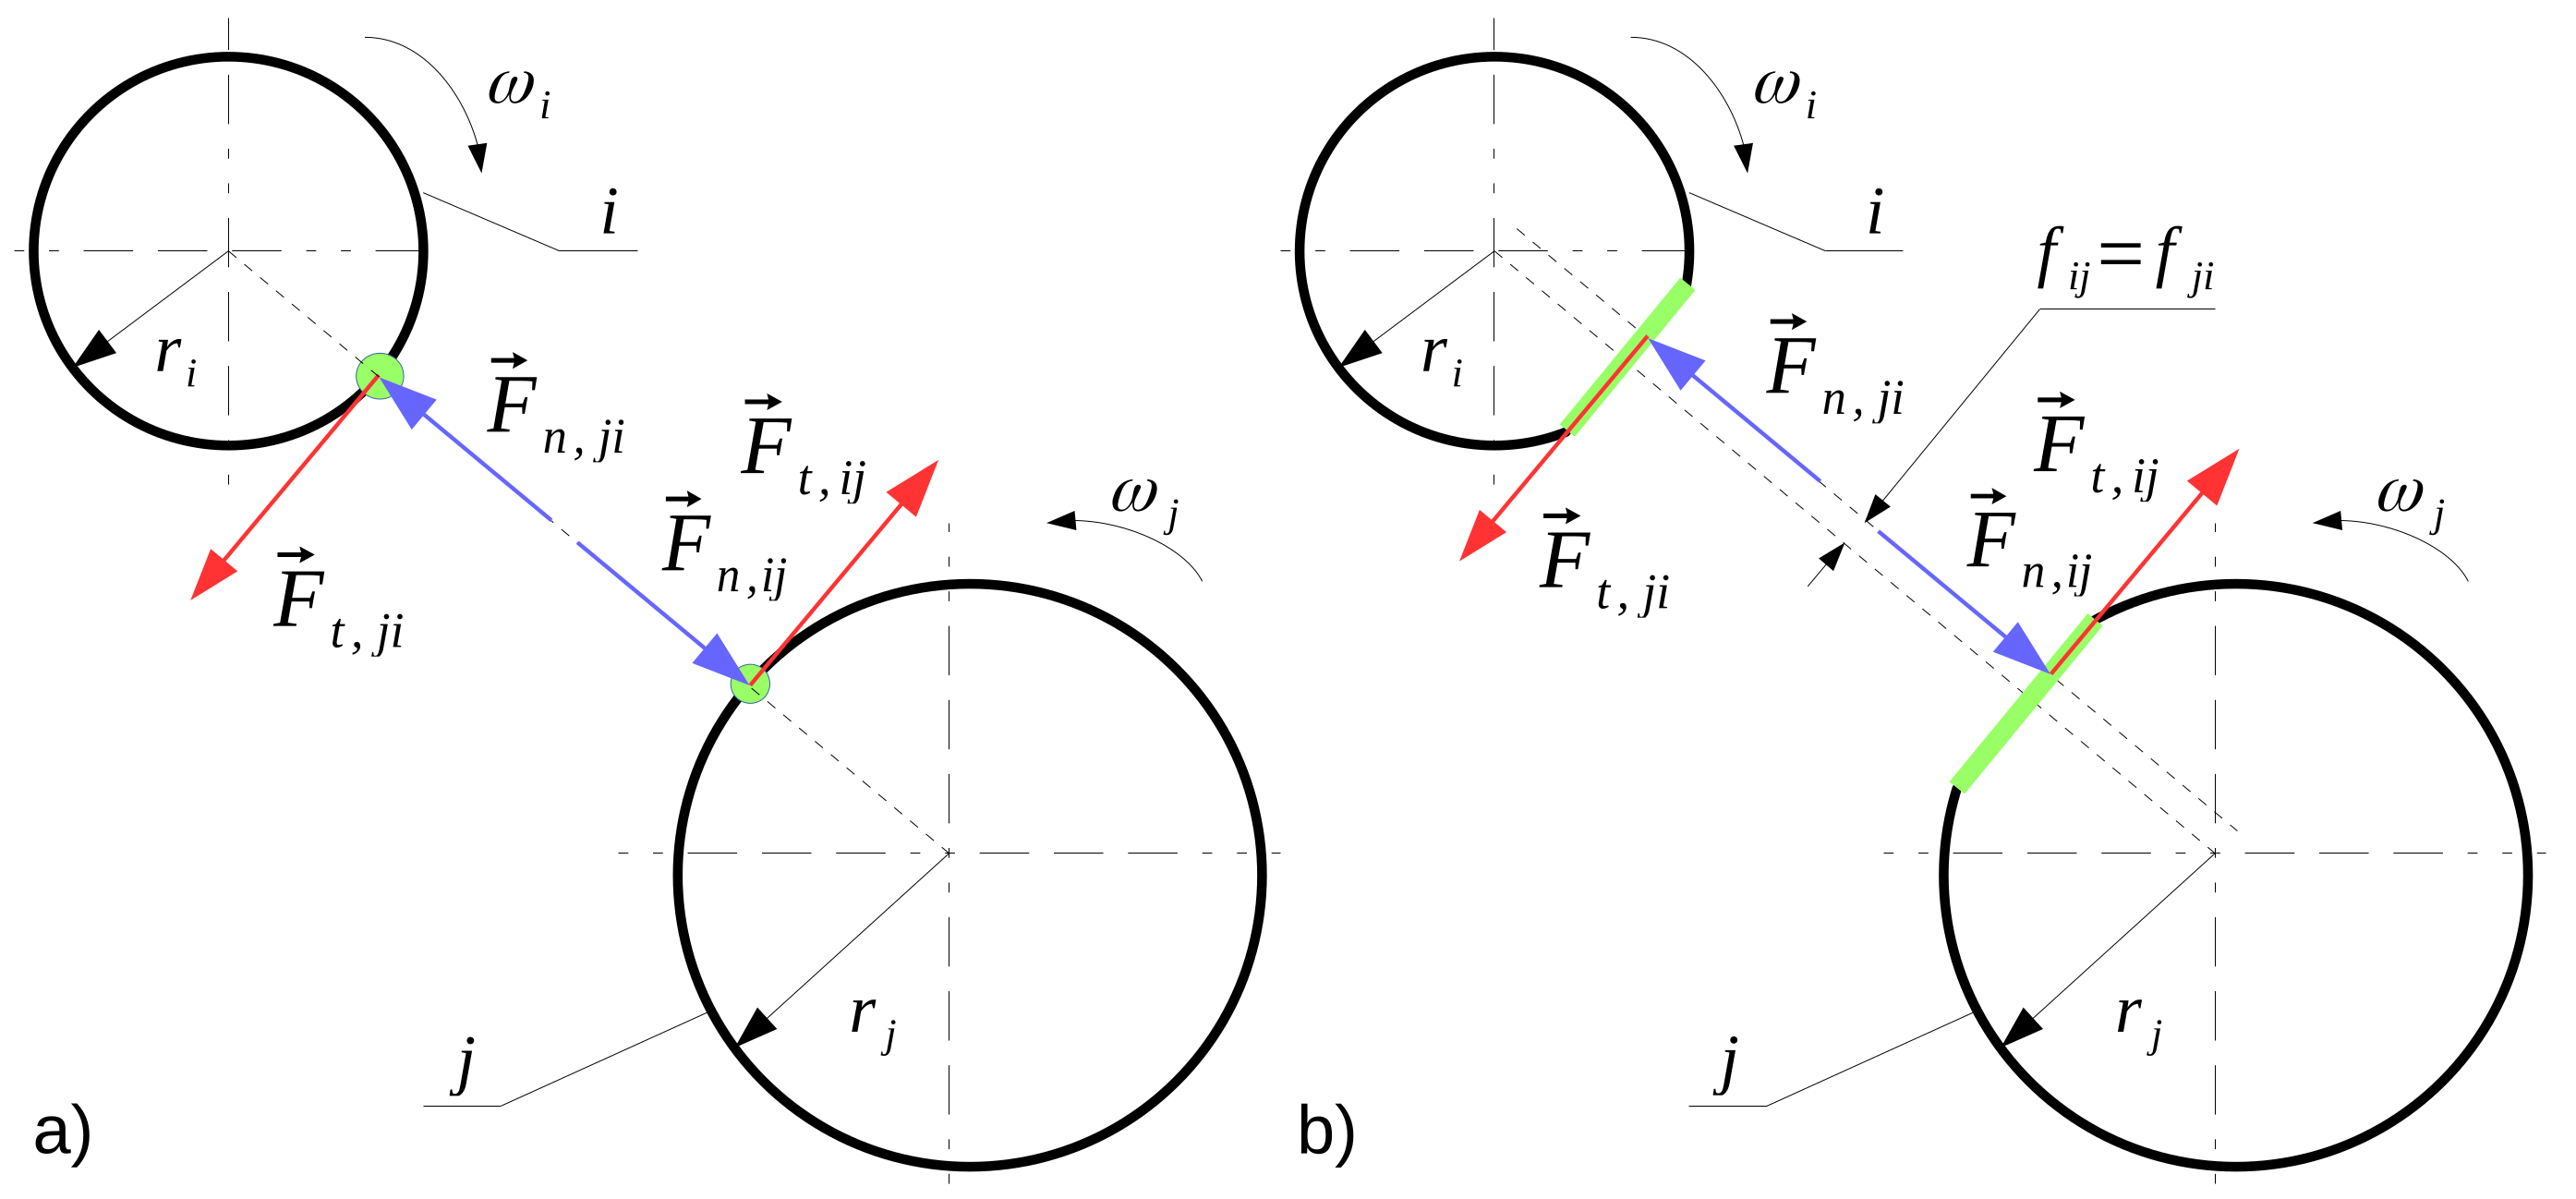
In general, a progression movement equation and a rotation movement equation in DEM is considered. In the case of i-th spherical body, which is in contact with other bodies (Figure 3), the equations may be saved as follows,
m i d v i d t = j = 1 n c F n , j i + F t , j i + F e
and
I i d ω i d t = j = 1 n c r i × F t , j i + f i j × F n , j i
where m is the mass [kg], I is the moment of inertia [kg m 2 ] , v is the linear velocity [m/s], ω is the angular velocity [ 1 / s ] , t is time [ s ] , n c is the number of contacts [ ] , F n is the normal force [ N ] , F t is the tangential force [ N ] , F e is the external force [ N ] , r is the radius [m], and f is the distance between the direction of acting the normal force and the mass centre [m].
If the touching circular or spherical bodies are non-deformable, the contact zone is limited to a point, and the distance f i j = f j i is equal to zero (Figure 3a). The distance between the centers of the particles i and j is equal to r i + r j . This type of contact is called hard contact in the literature. If the bodies are deformable (Figure 3b), instead of a point contact, a linear (in 2D) or surface (in 3D) contact will be created. In this case, the point of acting of the resulting normal force depends on the distribution of normal stress on this line or surface. Consequently, normal force will generate an additional moment of force. Because the particles are deformable, the distance between their centers is smaller than the sum of the radiuses r i and r j . In this way, the degree of the overlap of particles becomes a measure of their deformation. The contact of deformable particles is called soft contact in the literature. Looking at Figure 3, it can be seen that there are two key problems in the Discrete Element Method. The problems are related to (a) searching for all contact points and (b) calculating forces and moments of forces at all contact points based on appropriate contact models. The original Cundall and Strack model (1979) [48,49] or the Hertz theory (1881) [50] is very often used to calculate the normal forces in contact points [51,52,53,54]. In the literature, other contact models may be found, e.g., Kelvin-Voigt (1890) [55], Hunt-Crossley (1975) [56], Kuwabara-Kono (1987) [57], Lankarani-Nikravesh (1990) [58], Tsuji et al. (1992) [59], Zabulionis et al. (2012) [60], and Singh et al. (2014) [61]. Two ranges are usually considered when determining the tangential force. If the tangential force is relatively small, then the tangential deformation is calculated. In this range, similar formulas are used as for the calculation of normal force. If the tangential force exceeds the static friction force, it slips with a constant dynamic friction force.

2.3. A-Star Algorithm

The A-Star (A*) Algorithm is an iterative algorithm serving for finding paths in a graph or a grid of nodes based on a specific weighted function. The aim is to find a path from a chosen Start Point to a given Stop Point at the smallest cost (i.e., the least distance traveled). Points may be freely located in the space or arranged in a form of a structured grid. A binary geometry may serve as a calculation space for the A-Star Algorithm. In such a case, the path may go only through the nodes with a value representing the pore space. Another limitation is that a path cannot go twice through the same grid node. The A-Star Algorithm was described in 1968 by Peter Hart, Nils Nilsson, and Bertram Raphael [62]. In general, the algorithm may be used not only to search distances, but also, for example, to calculate the minimum time of traveling. In the traditional approach, the algorithm is applied for 2D systems, but in the hereby study a 3D implementation has been developed.
The main idea of the A-Star Algorithm acting may be saved as follows,
f ( x , y , z ) = g ( x , y , z ) + h ( x , y , z )
where f ( x , y , z ) is a function serving to choose the next point of the graph or grid of nodes, g ( x , y , z ) is the movement cost (the distance between the Start Point and the current node), and h ( x , y , z ) is a heuristic function (the distance between the current node and the Stop Point).
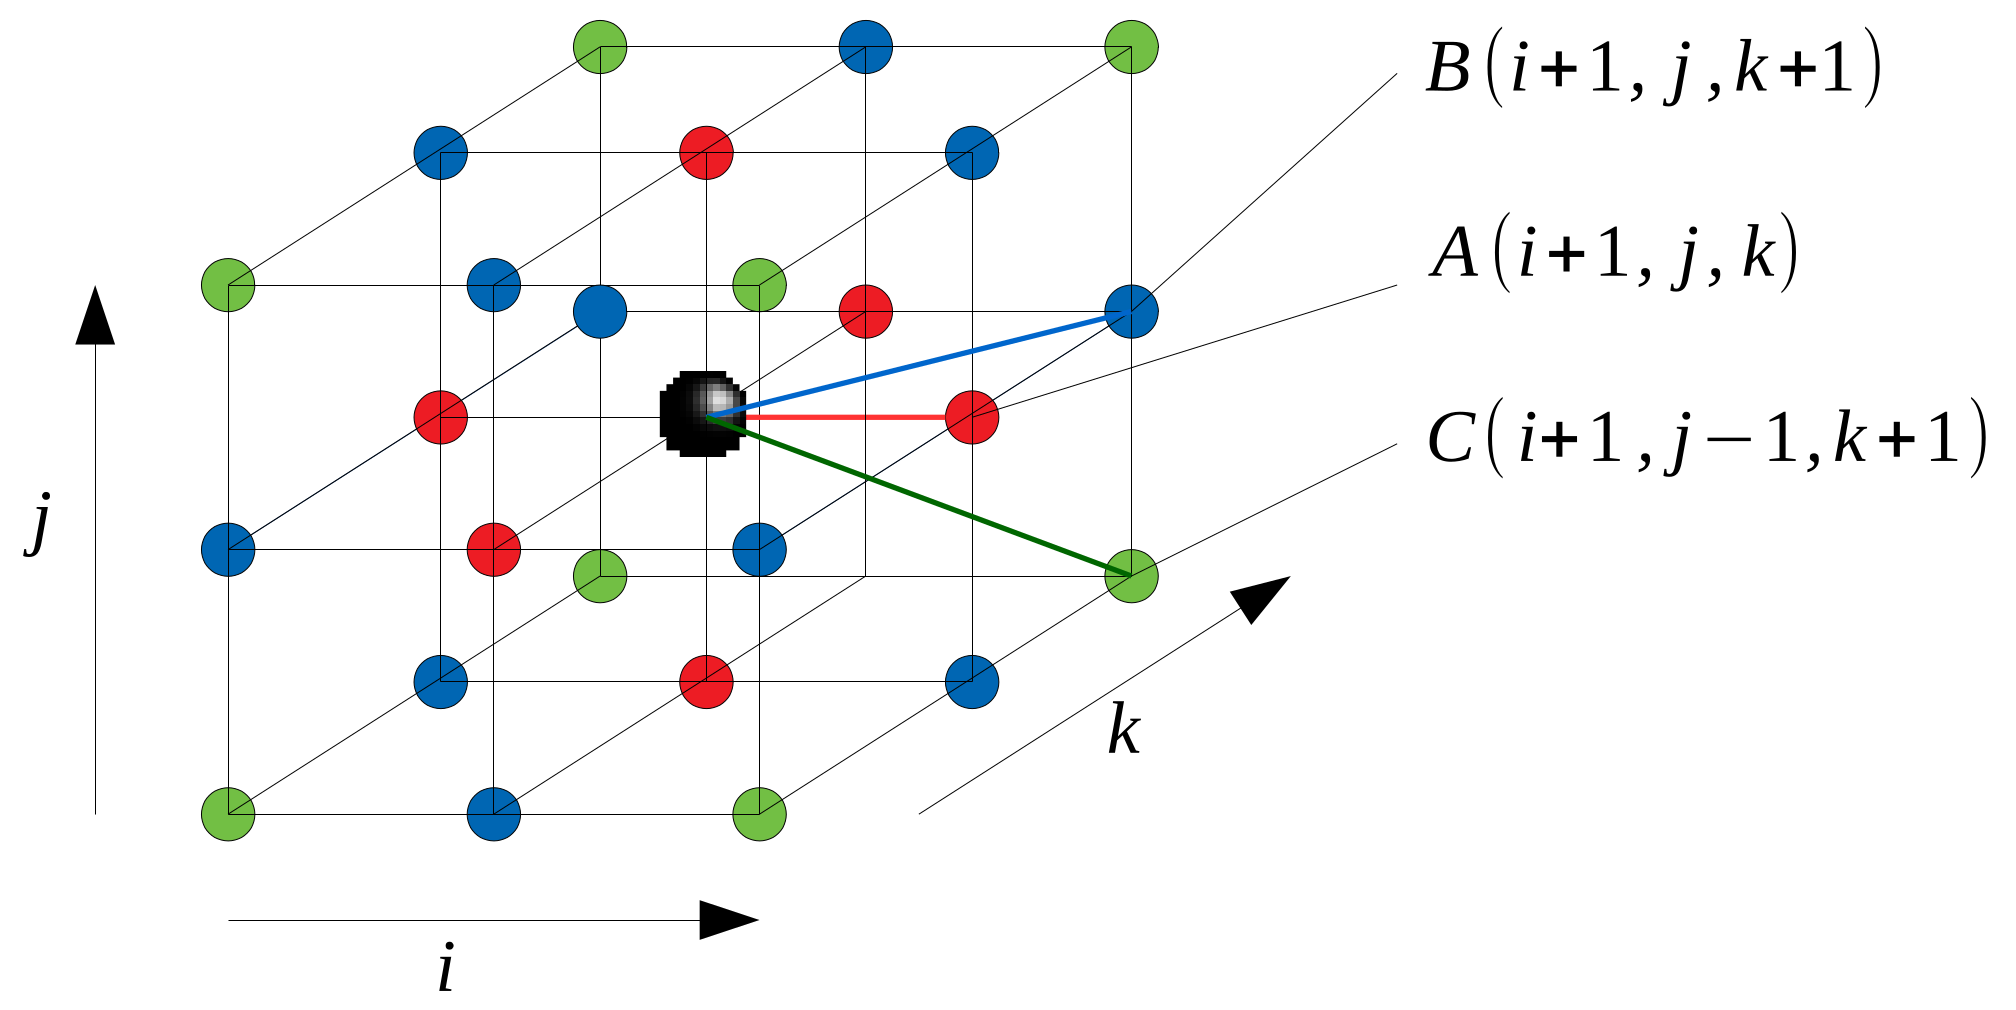
In the regularly structured grids (i.e., the grids with a uniform distance between the nodes in each direction), the function g ( x , y , z ) may have only three values: D · 1 for nodes having two common indexes with the current Start Point (point A in Figure 4); D · 2 for nodes having one common index with the current Start Point (point B in Figure 4); D · 3 for nodes without common indexes with the current Start Point (point C in Figure 4). The current Start Point is marked in Figure 4 by black color. In regular structured grids the space scale coefficient D is usually equal to 10. In such a way, the values of g ( x , y , z ) function are approximately equal to 10, 14, or 17. In fact, the exact values are not important because what really matters is the relation between particular values.
In the regularly structured grids, the function h ( x , y , z ) may be calculated with the use of a few different heuristic functions. The most popular of them are as follows.
  • Manhattan function
    h ( x , y , z ) = D · x i x s t o p + y i y s t o p + z i z s t o p
  • Diagonal function
    h ( x , y , z ) = D · m a x x i x s t o p + y i y s t o p + z i z s t o p
  • Euklides function
    h ( x , y , z ) = D · x i x s t o p 2 + y i y s t o p 2 + z i z s t o p 2
  • Quasi-Euklides function
    h ( x , y , z ) = D · x i x s t o p 2 + y i y s t o p 2 + z i z s t o p 2
    where D is a space scale coefficient; x i , y i , and z i are coordinates of i-th point located adjacent to the Start Point; and x s t o p , y s t o p , and z s t o p are coordinates of the assumed Stop Point of the path.
After calculating the value of f ( x , y , z ) function for every node neighboring to the current Start Point (there are 26 such points in 3D space, see Figure 4), the node with the minimum value of this function is finally selected as the next point of the path. In the next iteration, this new node is treated as the next Start Point.

2.4. Path Searching Algorithm

Path Searching Algorithm (PSA) is destined to search free passages through pore structures saved in a form of binary geometry. The Path Searching Algorithm has the same limitation as the A-Star Algorithm: (1) the path may go only through the nodes with the value representing the pore space and (2) the path cannot go twice through the same grid node. The algorithm may be used in 2D as well as in 3D domains. The algorithm was developed by author in 2019 [21]. It was used in order to filter data in a set of pore structures consisting of 15,000 cases (with random geometries without a free passage omitted). In the present study, the algorithm is employed to calculate the tortuosity.
In the opposition to the A-Star Algorithm, PSA has a solely local character and the locations of Stop Points are not needed for its acting. Other differences are as follows. (a) The path may change the direction only at right angles; (b) the path length increases in each iteration by 1, which simplifies the way of calculating the total paths lengths; and (c) in some specific cases the next node is drawn in a random process (which means that after running a search twice, both paths may have different shapes and lengths).
The acting of the algorithm may be summarized as follows (see Figure 5).
  • If the movement forward is possible (it is a so-called free node), than the path goes straight in this direction (Figure 5a). A free node means here a node located in the pore space and not belonging to the current path. In Figure 5, the main direction in which the path is determined is from the left to the right.
  • If the movement forward is impossible (the next node in the main direction is not free), then the path turns at a right angle (Figure 5b). The movement is possible only to a free node. If there is more than one free node (Figure 5c), then the movement direction is drawn by the use of the random number generator.
  • If the movement forward is impossible, the path cannot go perpendicular to the main direction, but the node located behind the current node is free, then the path turns back (Figure 5d).
  • If no further movement is possible (such a case is called as a cavity, Figure 5e), then the path points are deleted in sequence until another free node (not used before) is found.

3. Results and Discussion

3.1. DEM Simulations

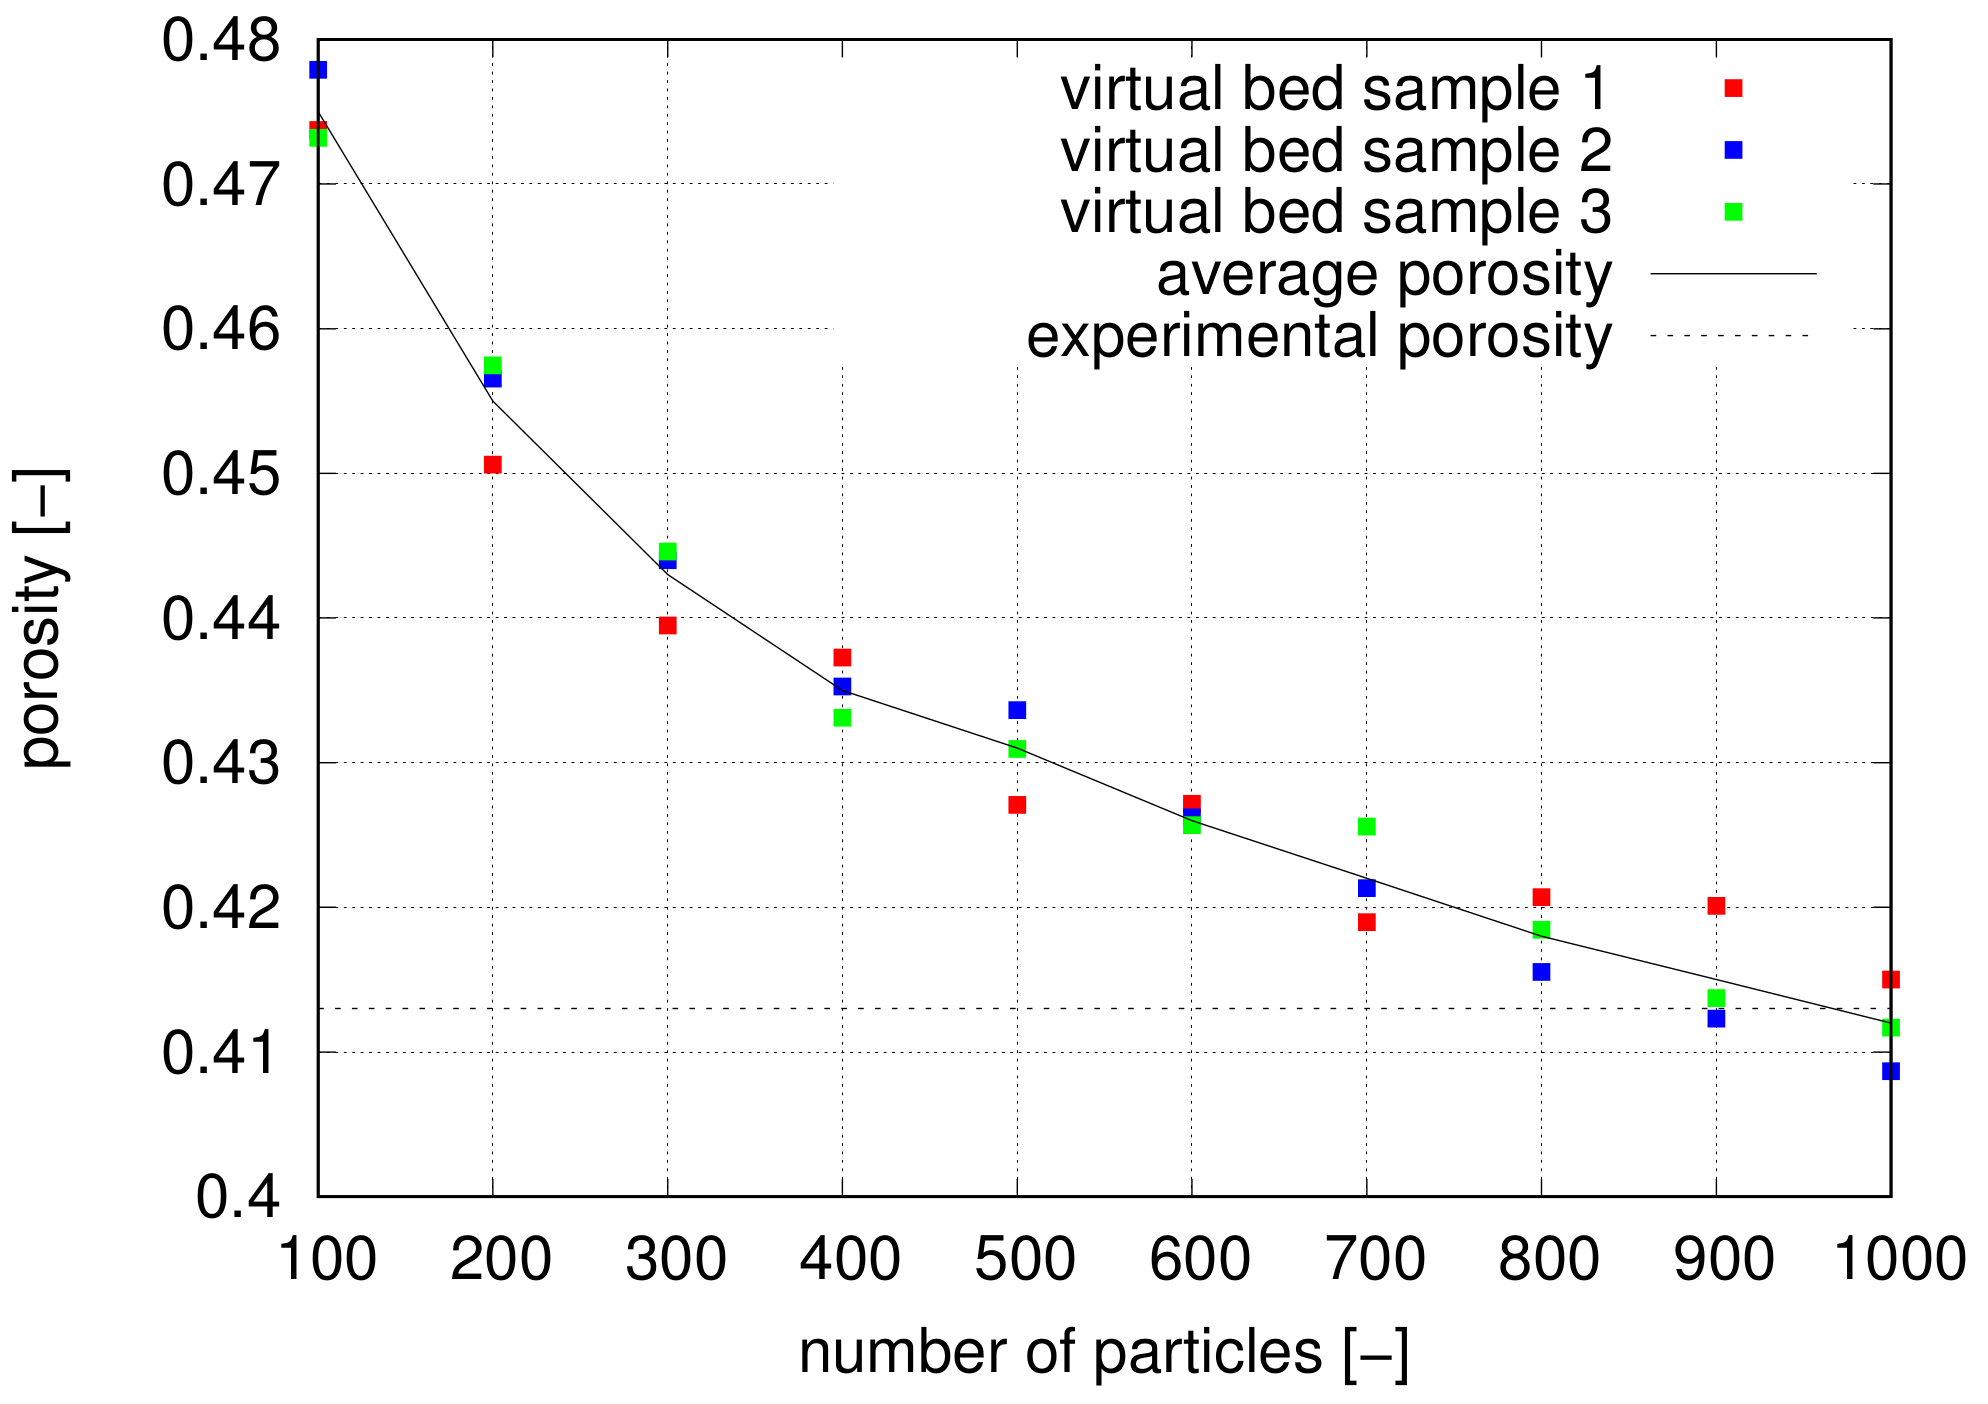
To generate a set of virtual beds, the Discrete Element Method implemented in the YADE code [49,63] was used. The so-called three-axial compression technique was applied, in which in the first phase a random particle cloud inside a cuboid is generated. In the second phase, the cuboid walls are getting closer and the particle cloud is compressed until a target porosity equals to the porosity of real bed samples. The YADE code was used two times in the presented investigations. In the first stage, the relation between the number of particles and the porosity was investigated. In this study, uniform particles were used with the diameter equal to 6.072 [mm]. The number of particles was in the range between 100 and 1000 and during each simulation, one million time steps was performed. The friction angle was set at 0 to facilitate the particle relative movement and to accelerate compression. The traditional Cundall’s linear elastic-plastic contact model in the calculations was used (class Law2_ScGeom_FrictPhys_CundallStrack [49]). It was assumed that the particles are made of glass and the walls of steel.
The results of the calculations are presented in Figure 6. It may be seen that ~1000 particles have to be assumed to obtain the porosity at the similar level as in the experiment. Due to the random character of the particle cloud creation, the resulting porosity varies in some range. It means that not every simulation will fulfill the condition of obtaining an assumed experimental porosity.
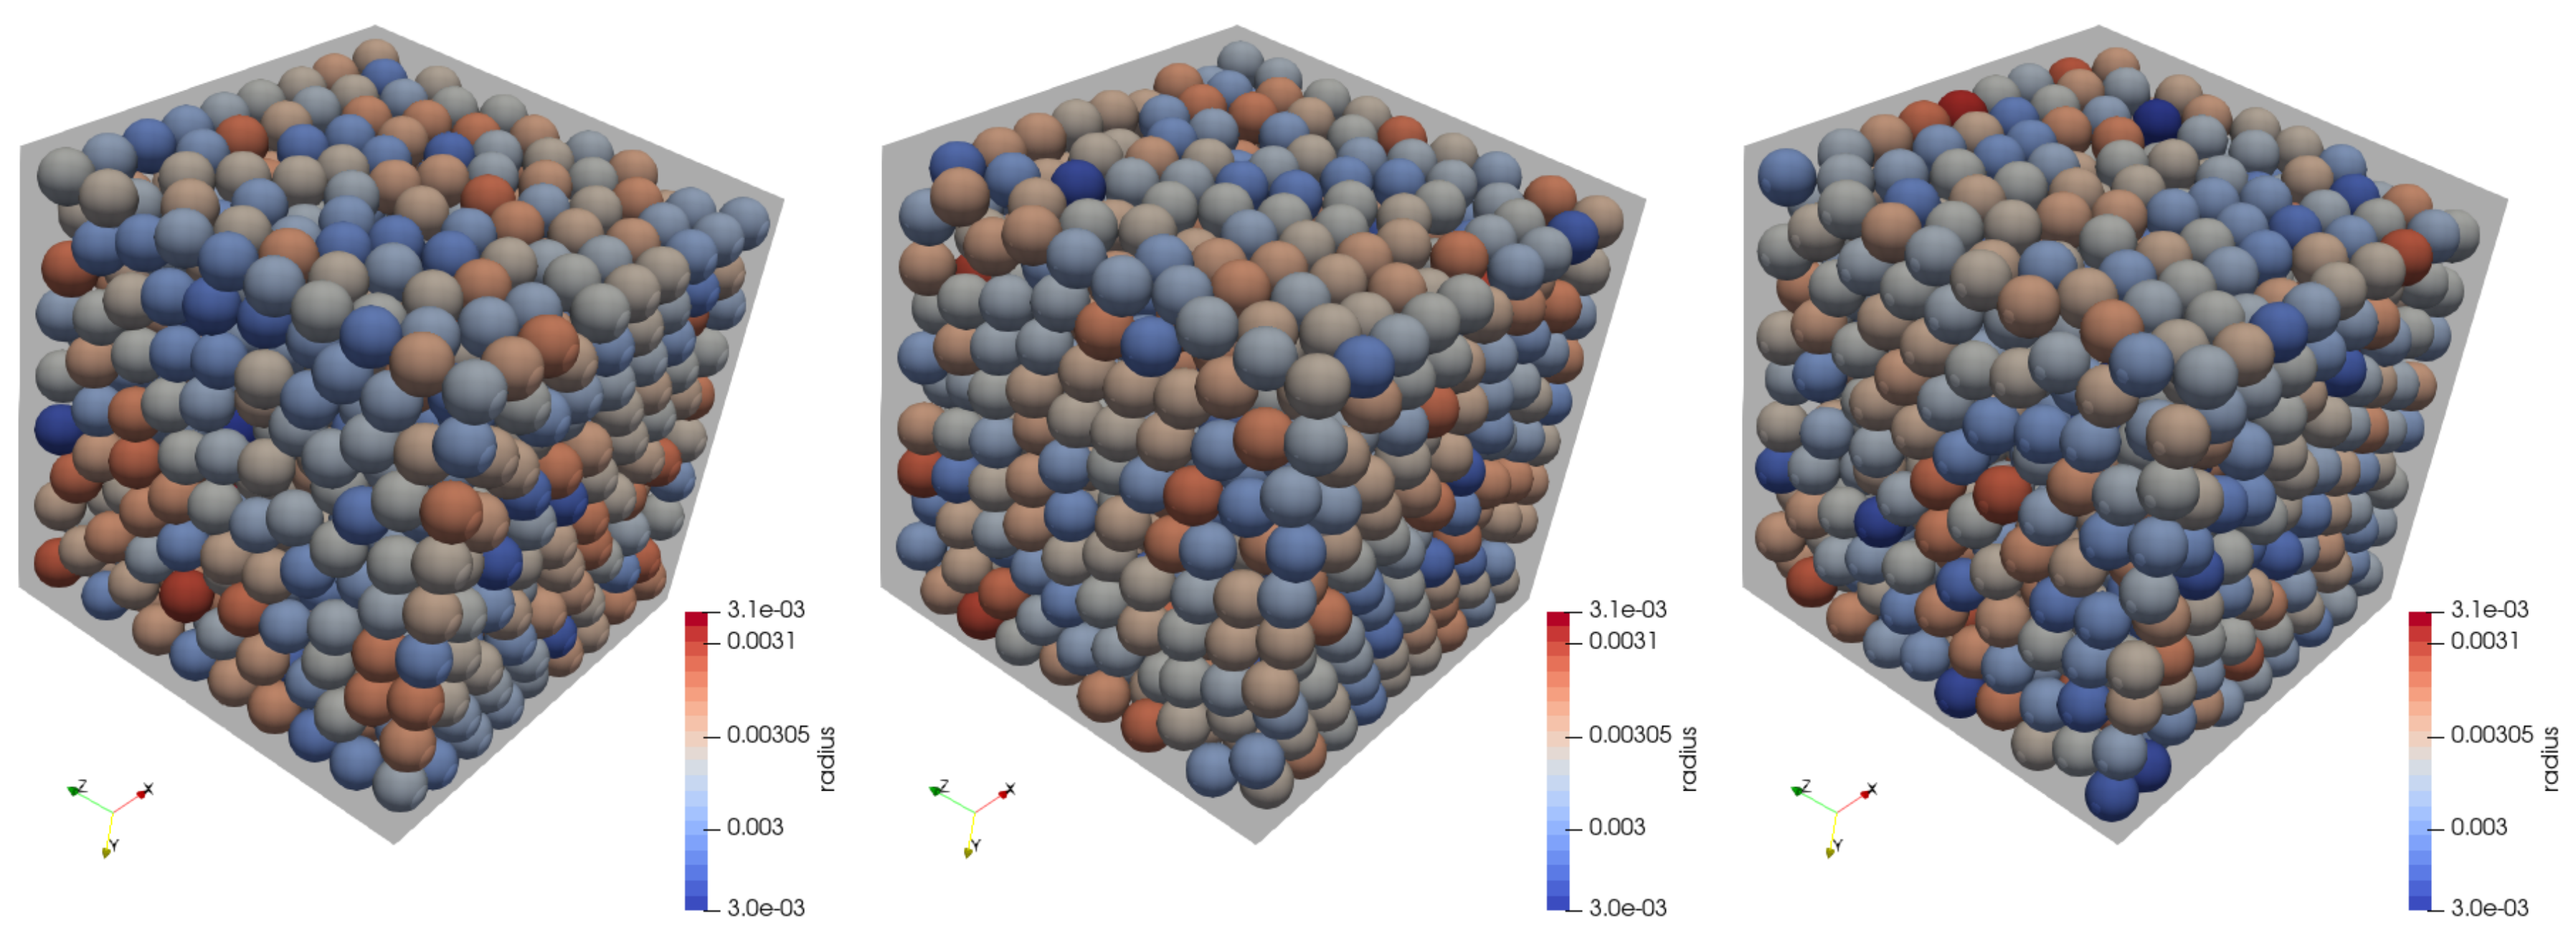
In the second stage of the investigations, the number of particles was set to 1000 and the simulation was continued until the target porosity (equal to 0.413) was reached. The other difference was that the particle size was defined by a cumulative discrete distribution function consisting of 25 bins. In such a way the average diameter and the standard deviation of samples described in Section 2.1 have been mapped. The details related to this issue may be found in the paper [64]. The simulation had to be repeated several times in order to obtain three examples of virtual beds with appropriate porosity. In Figure 7, the resulting virtual beds are visible.

3.2. Geometry Conversion

The virtual beds generated by the Discrete Element Method are expressed in a form of a vector geometry. It is done by saving coordinates of all particle centers and their diameters. It is important to remember that these particles cannot be treated as elements of a graph or as nodes of a non-structural grid for the A-Star Algorithm or the Path Searching Algorithm (tortuosity is calculated between solid objects and not inside them). It means that for the following purposes, the geometry of the pore space must be mapped in some way. To reach this aim, first, the space in which the virtual bed is located, is covered by a structural grid of nodes. Next, a binary value is assigned to each node: TRUE (or 1) if the node is located inside a sphere, and FALSE (or 0) if the node is belonging to the pore space.
As the resolution of grids of cells or nodes in numerical techniques is usually very important, it is probably this factor (for the appropriate data are not available in the literature), which may have an impact on the results in the methodology proposed. For this reason, four numerical node grids with the following resolutions of 50 × 50 × 50 (Figure 8), 100 × 100 × 100 (Figure 9), 150 × 150 × 150 (Figure 10) and 200 × 200 × 200 (not possible to visualize with the available computer) were prepared for every virtual bed. The total number of nodes was limited by the available computational power. It may be seen (Figure 8, right) that the smallest resolution does not provide circular cross sections of the spherical particles. The geometry of the virtual beds used is represented better by higher resolutions. The bed geometry visible in Figure 8, Figure 9 and Figure 10 is rotated in comparison to the original geometry obtained from the YADE code, but this does not matter due to the isotropic character of the sample.

3.3. Determination of Path Lengths

Virtual beds in the binary representation were used to calculate lengths of paths on the basis of the A-Star Algorithm and the Path Tracking Method. Both algorithms were self-implemented in the Fortran programming language. All results were saved in VTK file format, which is very convenient to visualize, e.g., in the ParaView software. The A-Star Algorithm was applied to both versions, i.e., a standard one (here called static) and a modified one (here called dynamic). In the static approach, the coordinates of the Stop Point in the plane perpendicular to the main direction (here X direction) are the same as the coordinates of the Start Point:
i s t o p = n x , j s t o p = j s t a r t , k s t o p = k s t a r t
In the modified version, the Stop Point changes their locations during the calculation as follows,
i s t o p = n x , j s t o p = j i , k s t o p = k i
where index i means the current path node and n x the number of grid nodes in the X direction. The modification is proposed due the fact that, in the transport processes in porous media, the fluid trajectory depends mainly on the local conditions (geometry). In other words, it is not strongly determined by a point located somewhere on the outflow surface far down the flow.
In each case, 25 different Start Points regularly arranged in the inflow plane were used. Their locations were calculated as follows,
i s t a r t = 1 , j s t a r t = s p j · i n t n y n s p j + 1 , k s t a r t = s p k · i n t n z n s p k + 1
where s p j is the ordinal number of Start Points in Y direction [ ] , s p k is the ordinal number of Start Points in Z direction [ ] , n y is the number of grid nodes in the Y direction [ ] , n s p j is the total number of Start Points in Y direction [ ] , n z is the number of grid nodes in the Z direction [ ] , and n s p k is the total number of Start Points in Z direction [ ] . The function i n t ( ) means that the resulting value is rounded to the nearest integer number.
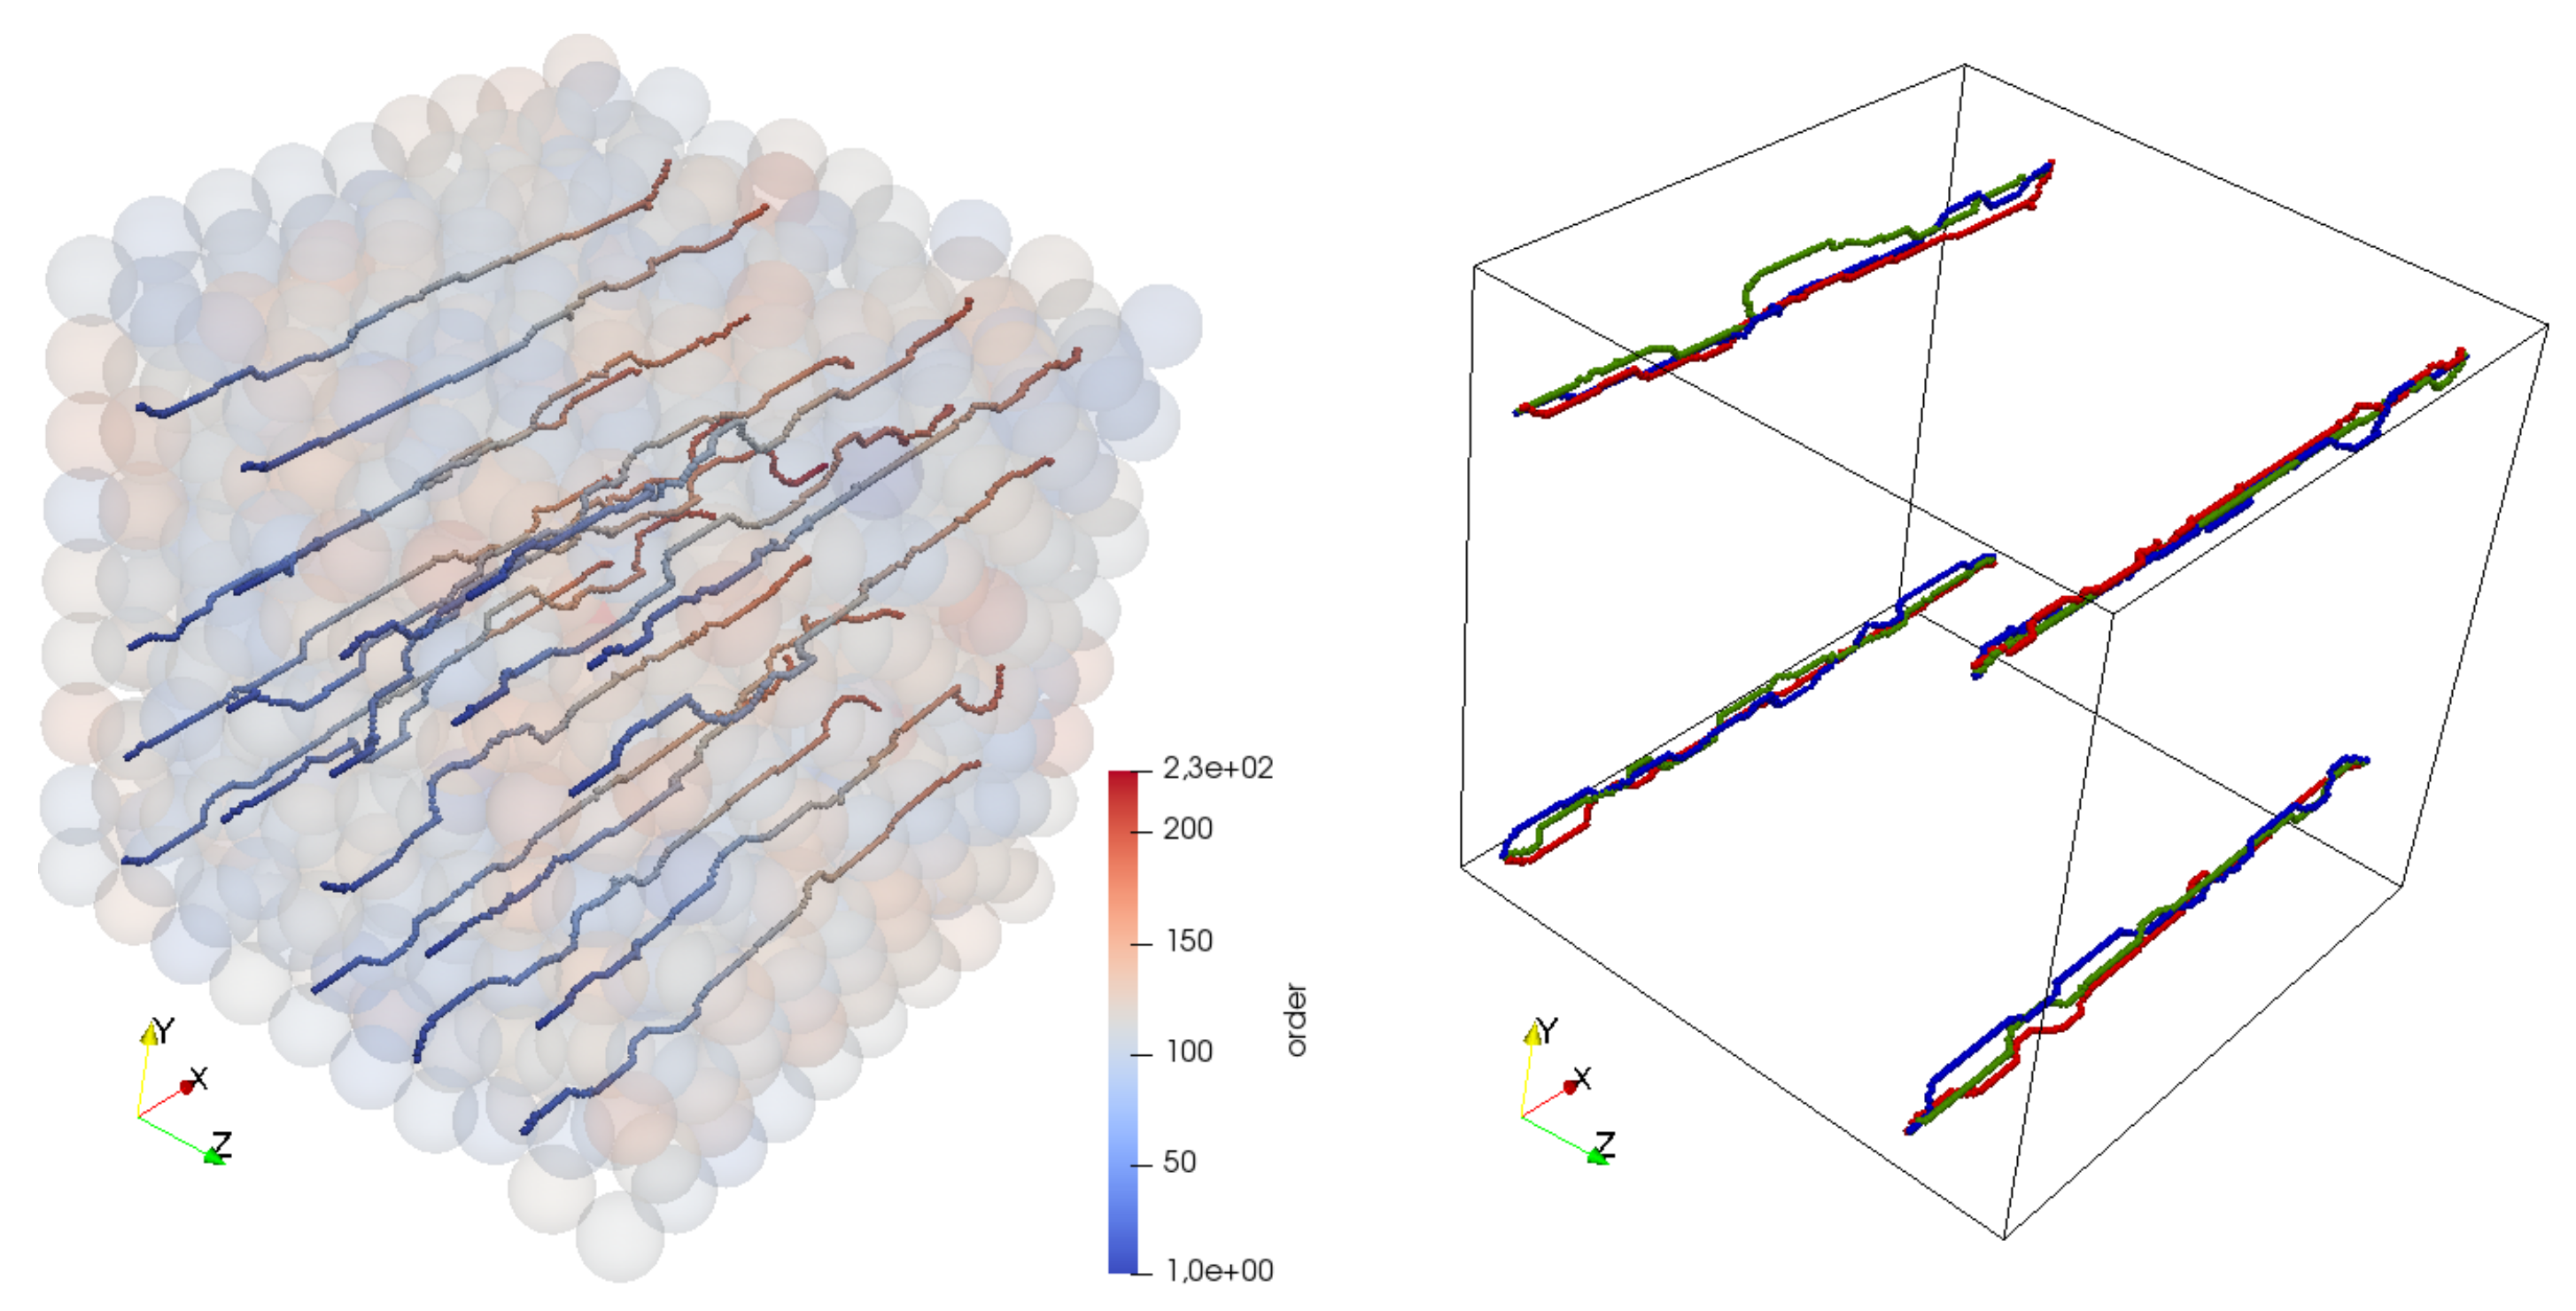
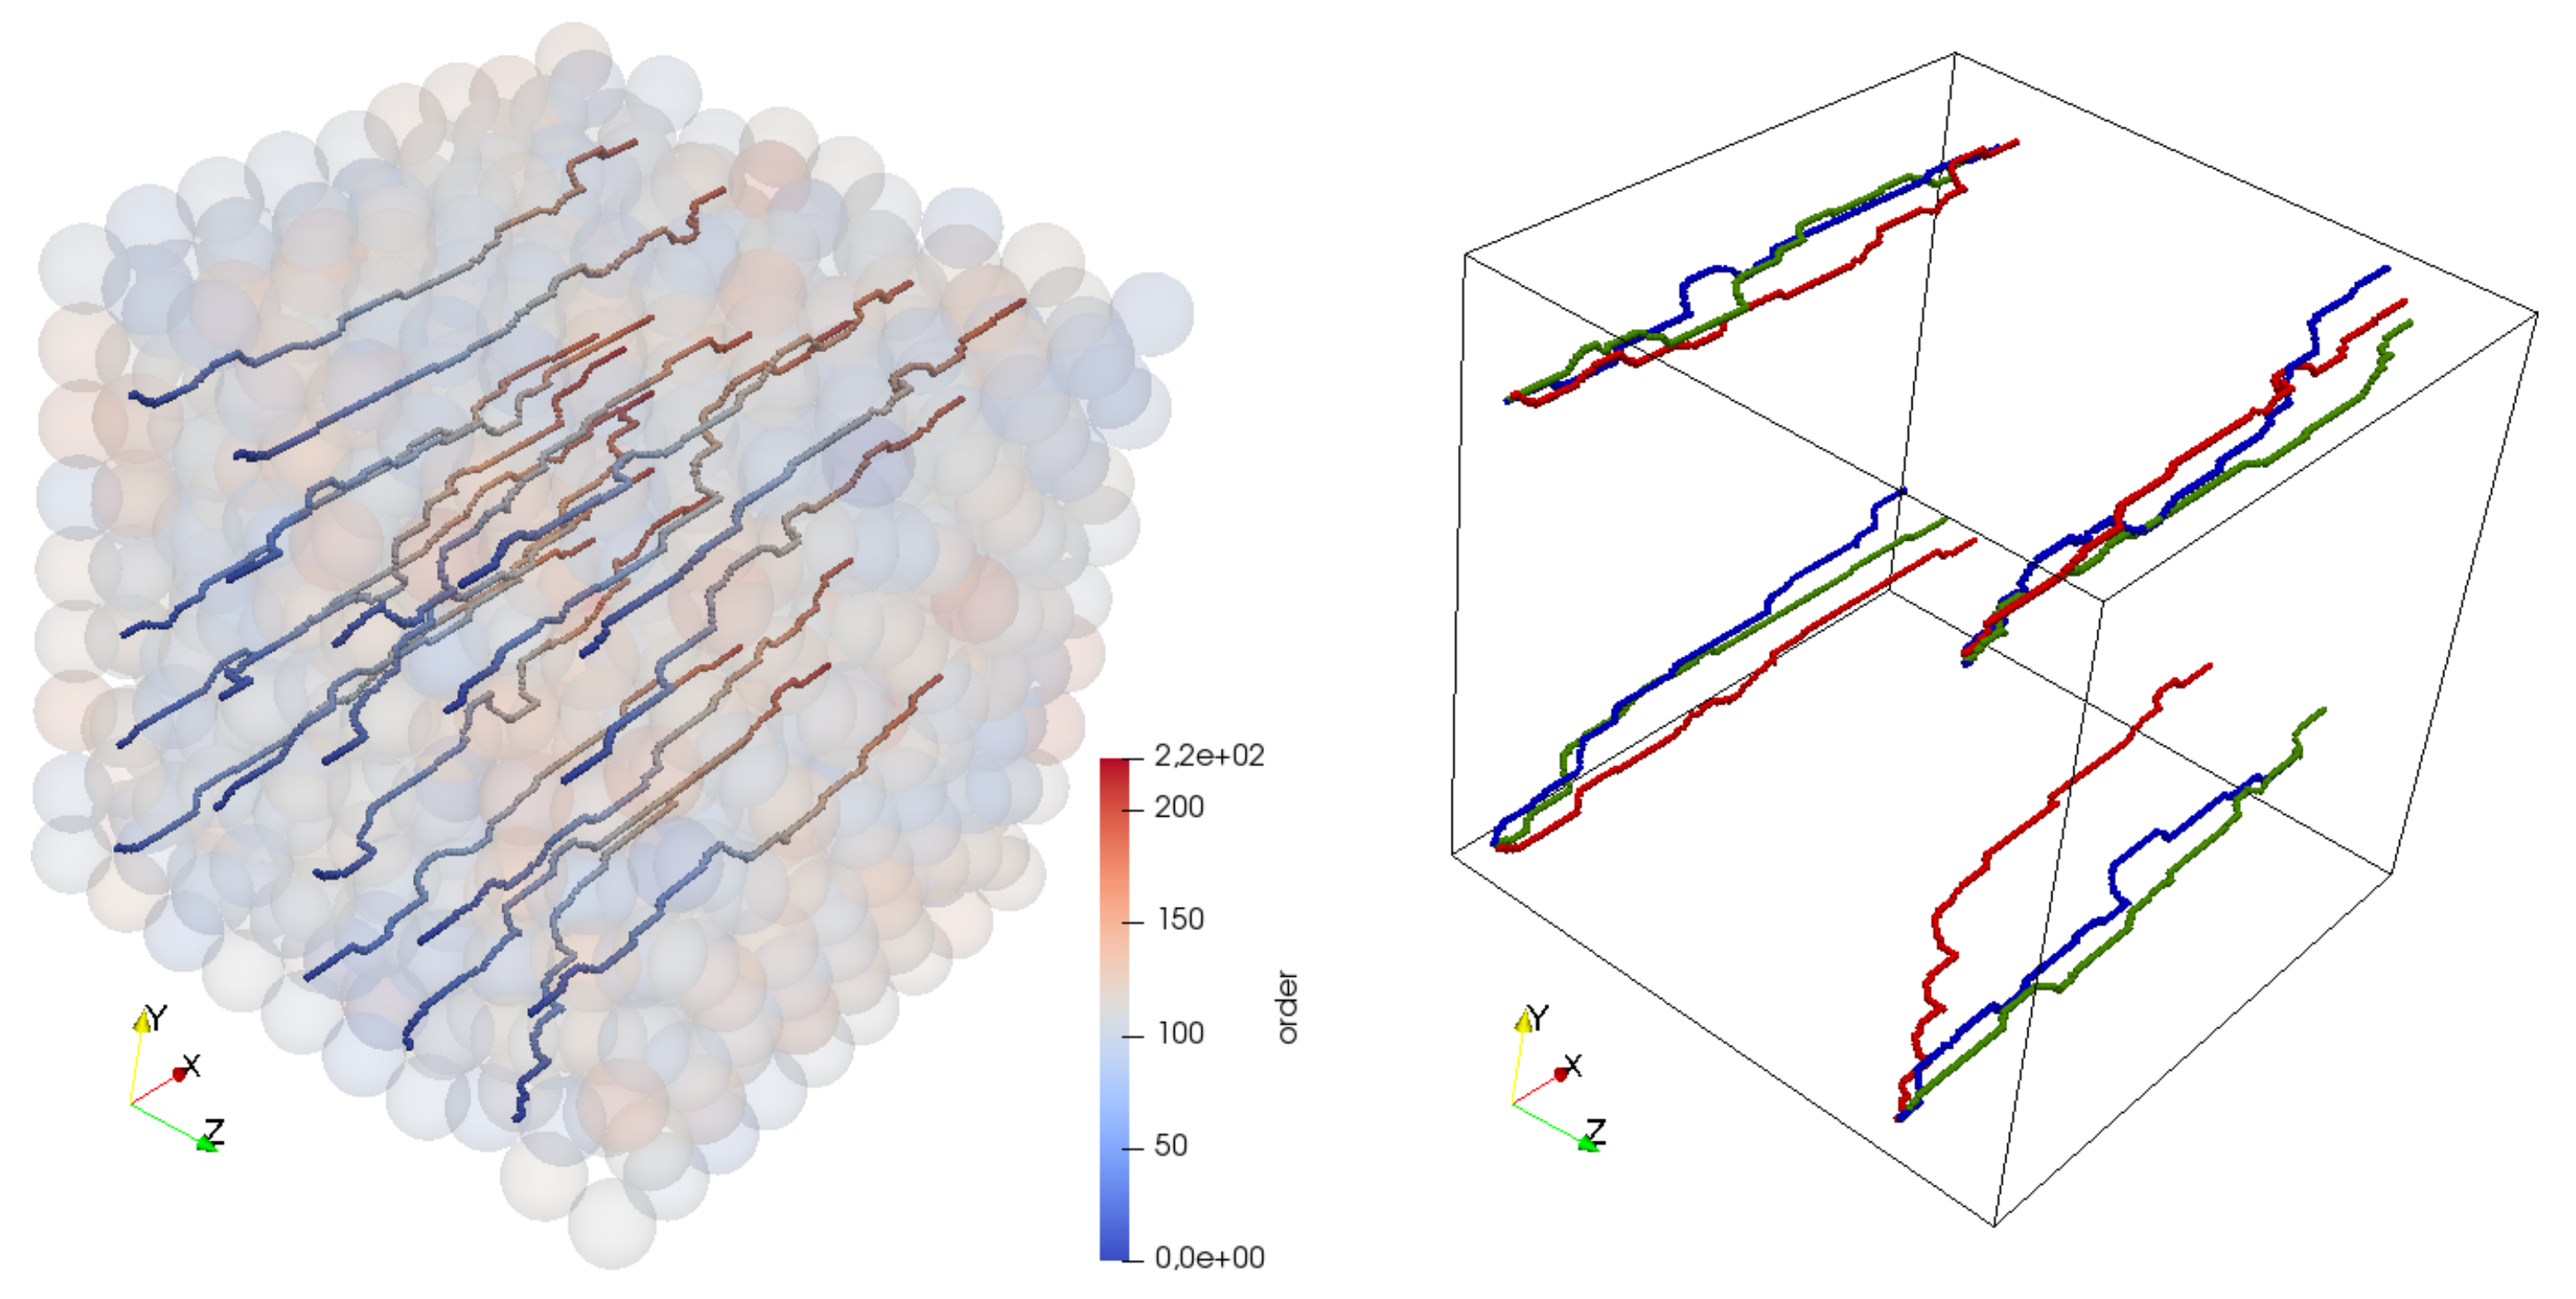
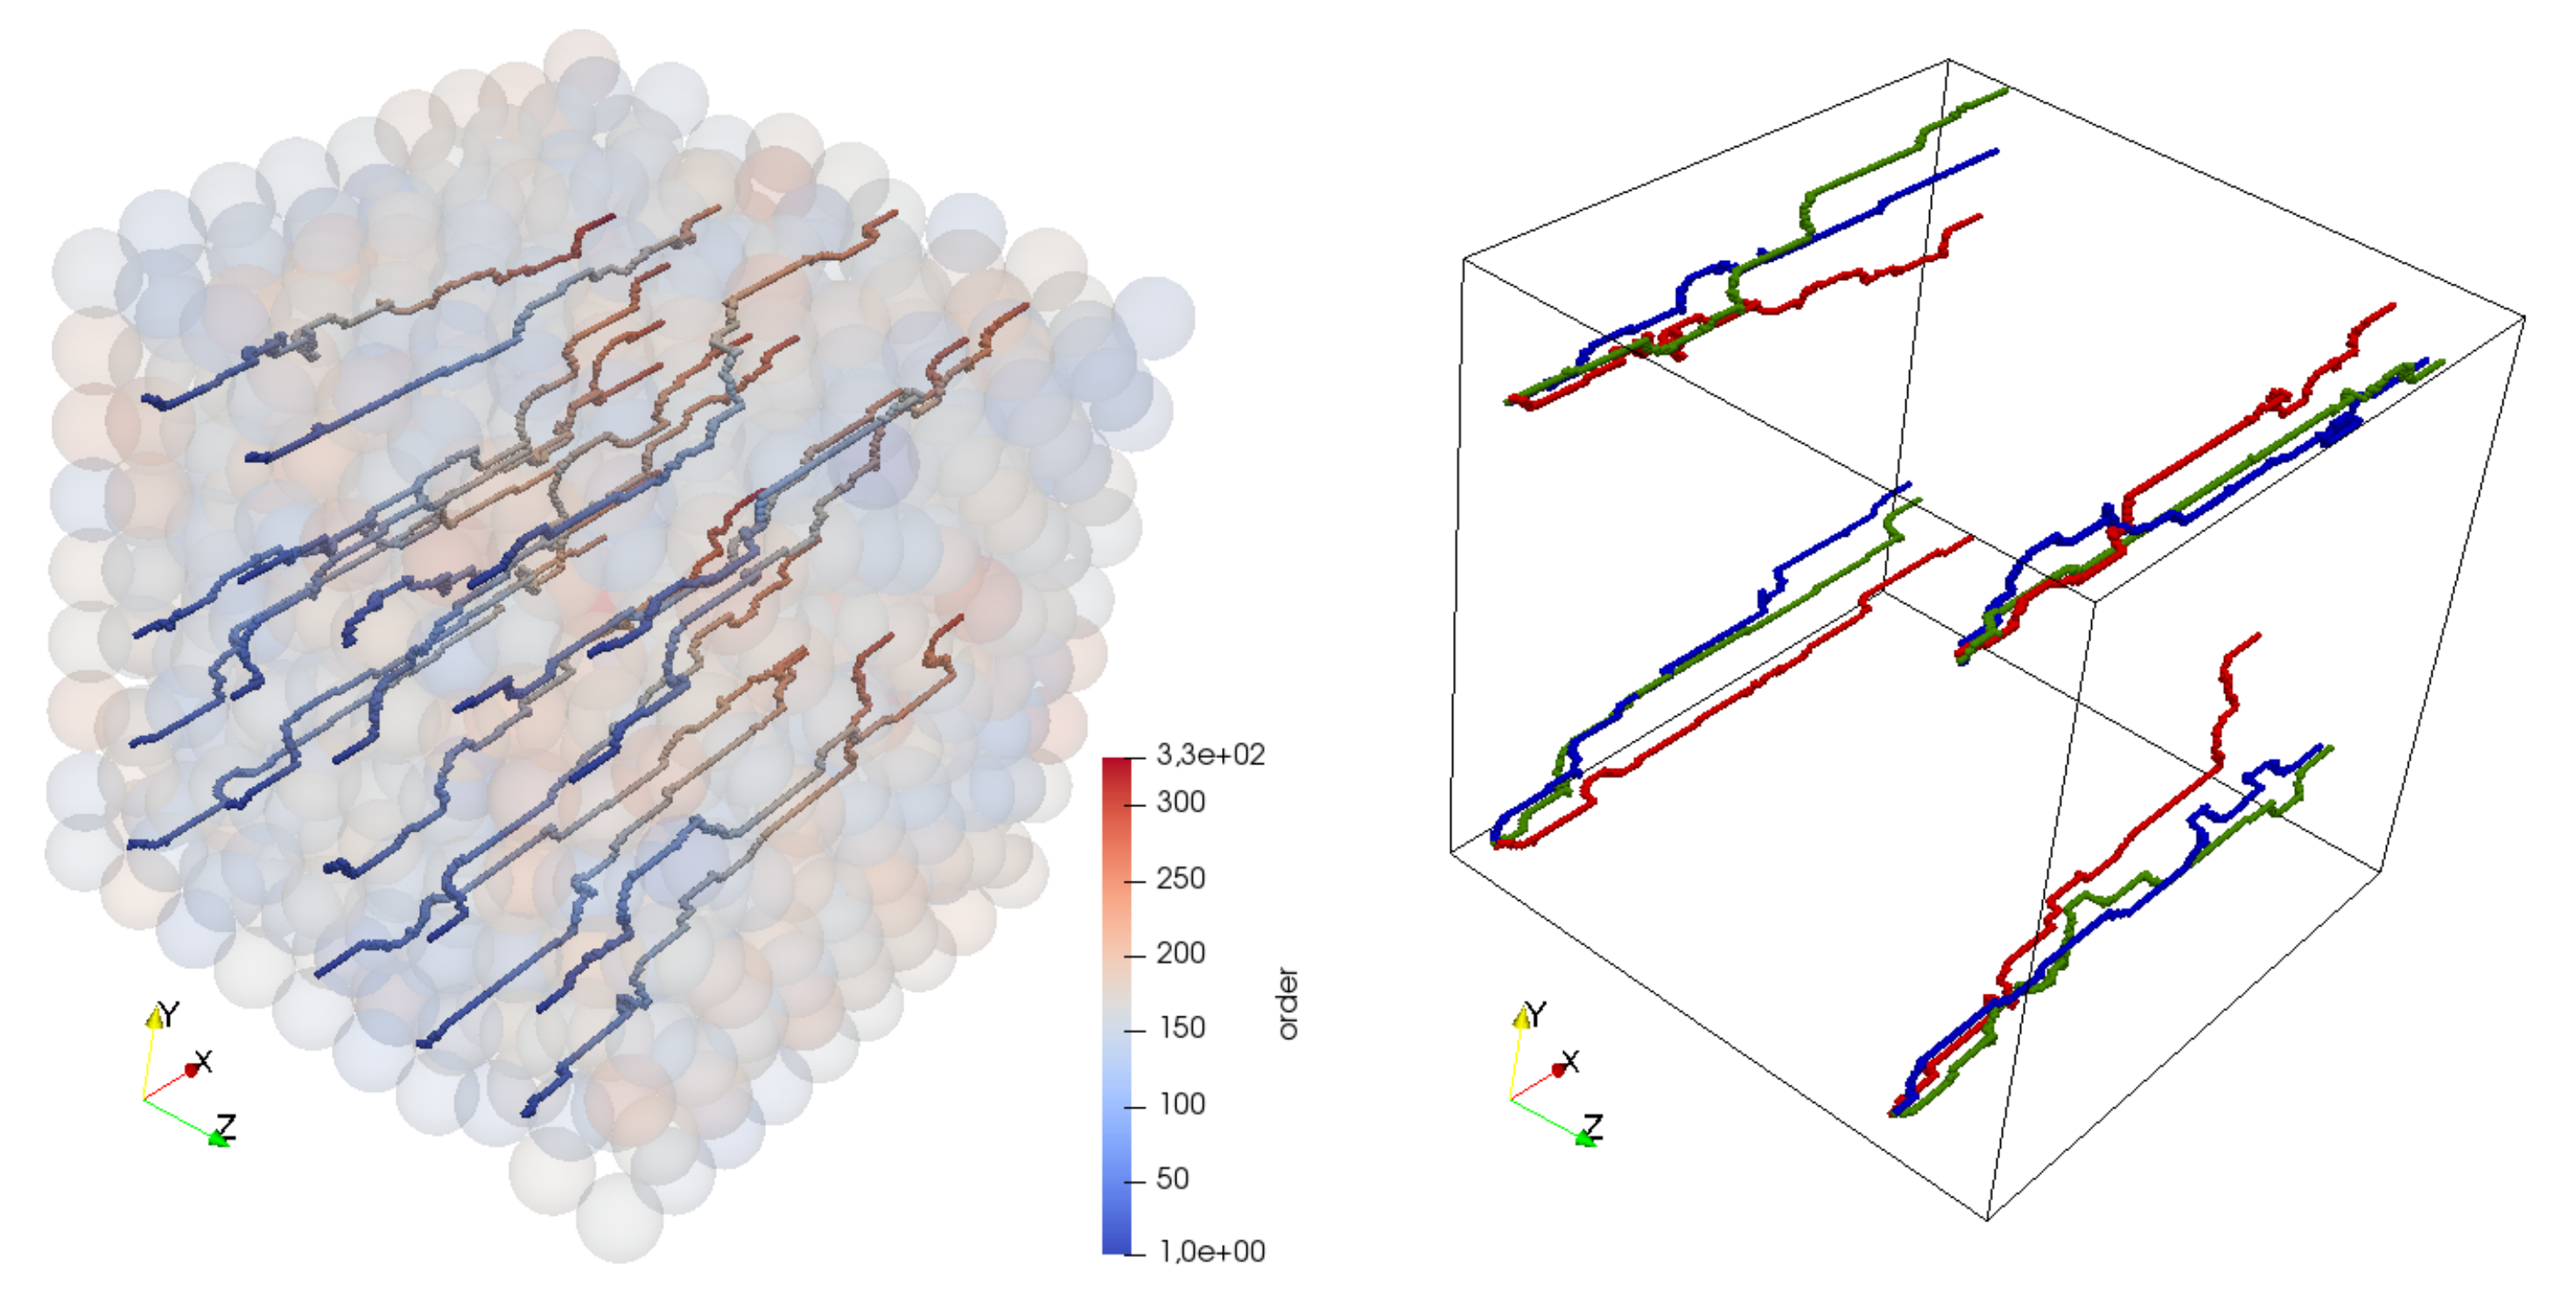
In Figure 11, an example of using the A-Star Algorithm in the static variant for grid resolution equal to 200 × 200 × 200 is presented. On the left, all of the obtained paths for the first geometry are visible. Path points are colored according to the order of adding. On the right, four chosen paths for the same Start Points and three geometries are compared. It should be noted that in the static variant all paths are relatively straight due to assumed “attraction” to the Stop Point. In Figure 12, analogical results, but this time for the A-Star Algorithm in dynamic variant, are visible. It may be seen that the effect of the Stop Point “attraction” does not occur here. In Figure 13, the results of acting of the Path Searching Algorithm are visible. Paths are not as smooth as in the A-Star Algorithm, which is caused by the limitation when it comes to choosing the next path points (a diagonal direction is prohibited).
In Figure 14, four chosen paths for the first virtual sample and different resolutions are visible. Paths obtained for resolution 50 × 50 × 50, 100 × 100 × 100, 150 × 150 × 150 and 200 × 200 × 200 are marked by black, green, blue, and red color, respectively. It may be seen that the resulting number of paths depends on the grid resolution. All Start Points located in the solid space are omitted. If the resolution is low, the probability that a Start Point will be located in a solid node is higher. This probability decreases when the grid resolution increases. This relationship is illustrated in Figure 15.
In Figure 16, the total number of path points divided by the number of grid nodes in the main direction is visible. This number depends on the grid resolution and the method applied. It may be observed that the results obtained for the 50 × 50 × 50 resolution differs in all cases from the other results. Therefore, it may be concluded that the quality of the binary representation of the real geometry is in this case too low. This conclusion is obvious however: the minimum value may depend on the approach used in the investigations. For example, in his study based on the Lattice Boltzmann Method (LBM), Wang stated [22], that the radius of sphere in a binary representation should have at least ten grid nodes and the media length along flow direction should be more than twenty radii. Looking at Figure 7, it may be seen that within the domain, 9 particles are usually located along an edge. It means that the number of nodes per sphere diameter is approximately equal to 6, 11, 17, and 22 for the resolutions of 50 × 50 × 50, 100 × 100 × 100, 150 × 150 × 150 and 200 × 200 × 200, respectively. It seems that if the A-Star Algorithm and the Path Searching Algorithm (which are qualitatively similar) are used, the resolution may be two times smaller then the one mentioned by Wang. It is an important information, because the demand for computing power increases linearly with the number of grid nodes. Lower resolution means faster acting and shorter solution times. The conclusion related to the minimum size of a sample is similar to this, which was reported by Wang. In all virtual bed samples used in the investigations, the domain length was higher than 18 radiuses, which is very close to the value mentioned by Wang (20 radiuses).
One problem with the LBM method is that it works incorrect for the channels narrower than approximately four lattice units [19]. It means that the binary geometry obtained in the current study should be refined at least four times to fulfill this condition. In such a way the resolution of the highest grid should be equal to 800 × 800 × 800 (512 × 10 6 nodes) instead of 200 × 200 × 200 (8 × 10 6 nodes). It is impossible to analyze such big data with a PC computer. In this context, it is very comfortable that the channel width in the proposed methodology may be equal to only one node and a grid refinement is not needed at all.
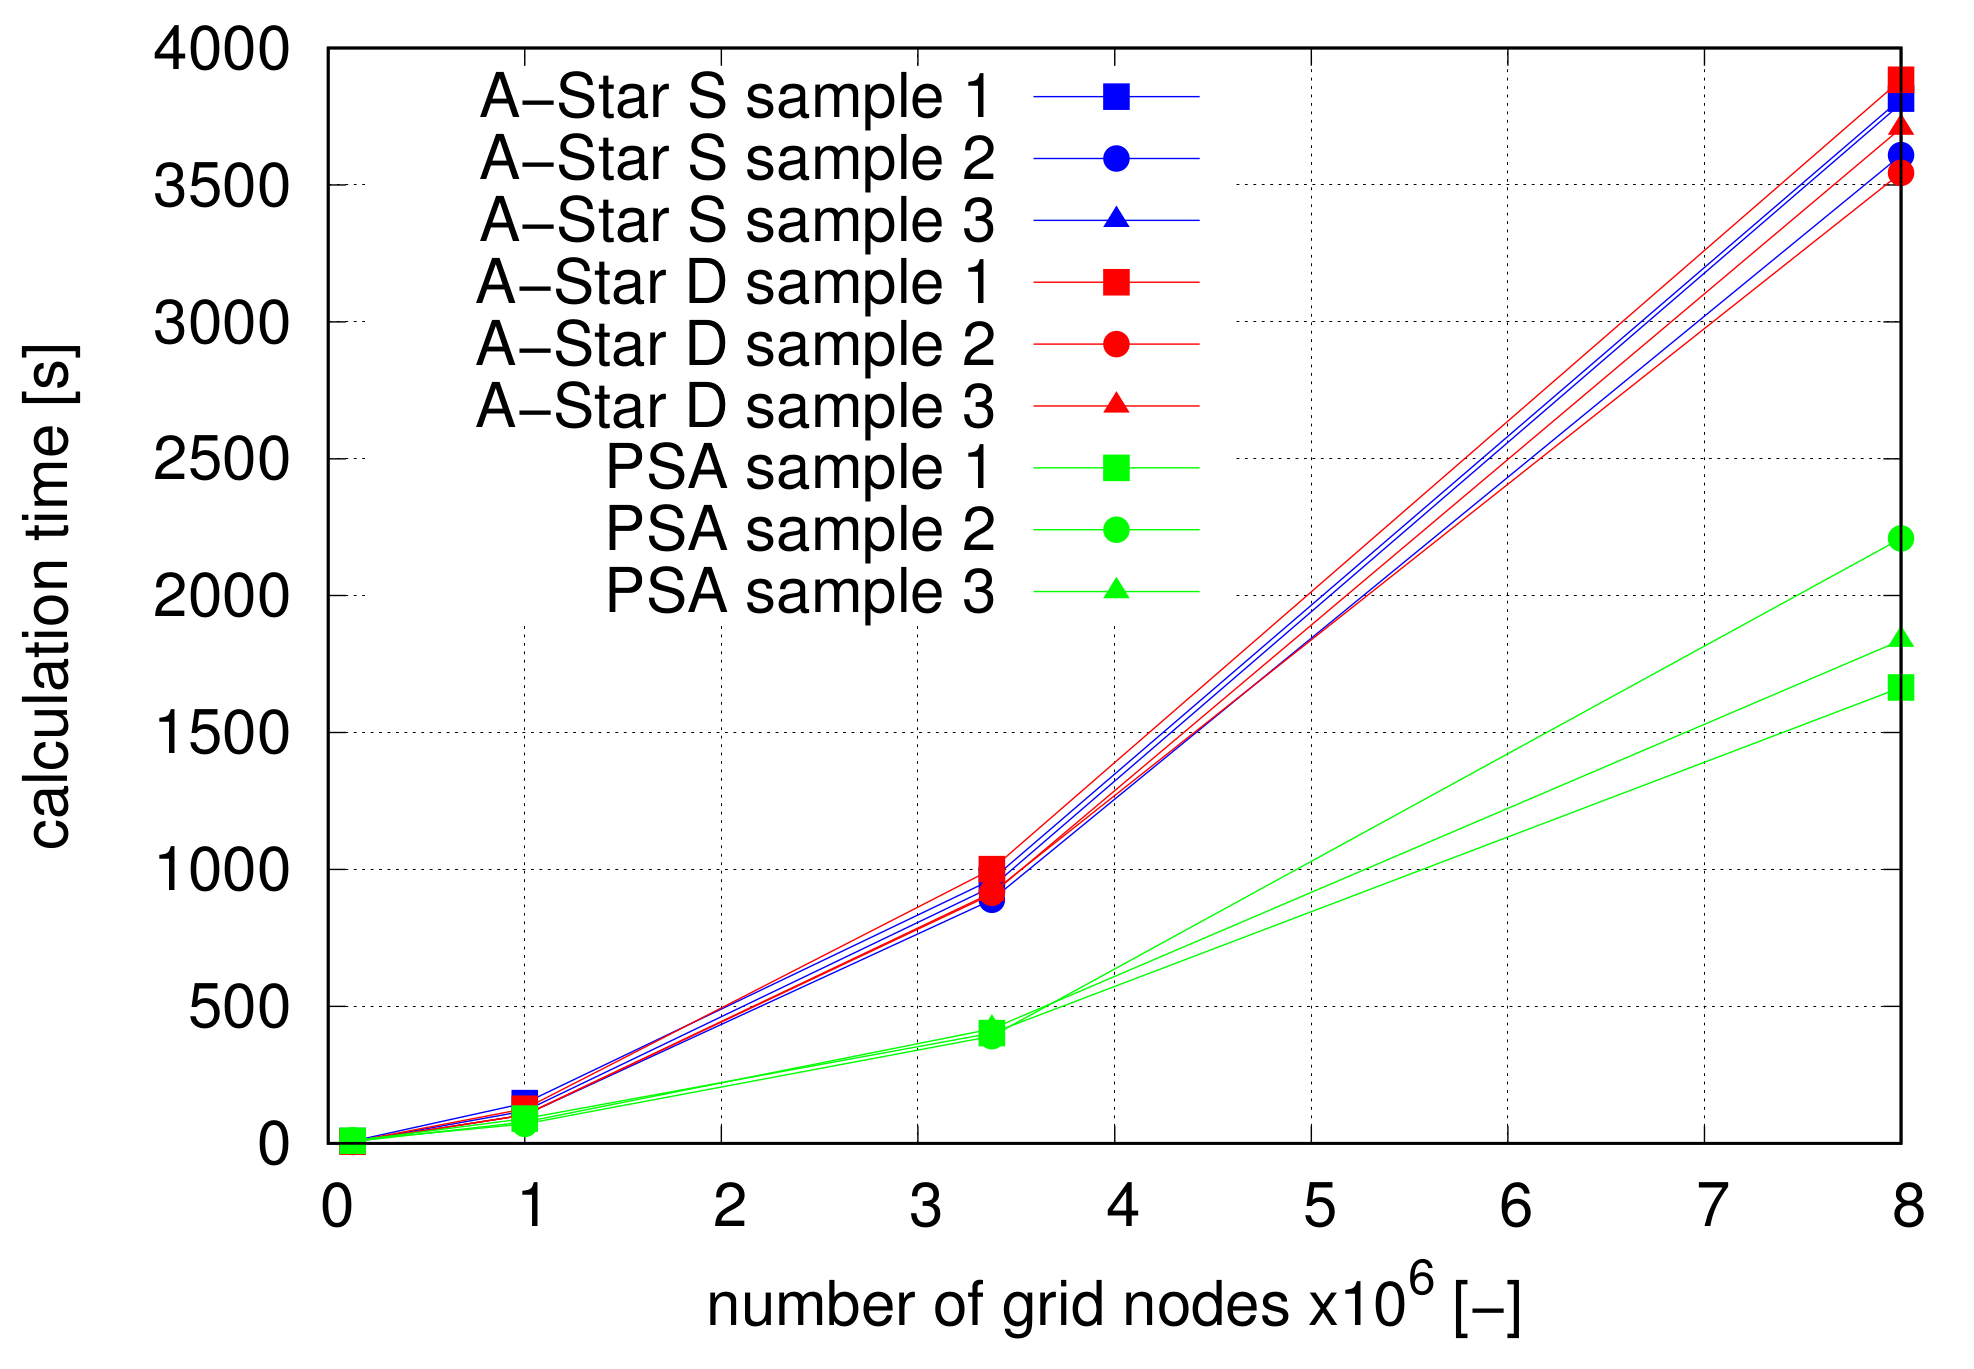
In Figure 17, the real calculation time via the function of grid nodes is presented. It turns out that the Path Searching Algorithm works approximately 2 times faster than the A-Star Algorithm. Moreover, no significant differences between A-Star Algorithm in static and dynamic versions are visible. It should be also noted that in general the calculation time is relatively short. In previous investigations, in which the Lattice Boltzmann Method to calculate the hydraulic tortuosity in a virtual bed consisting of 50 particles was used [43], the calculation time was much longer. For example, the calculation time for a grid with the resolution of 32 × 32 × 64 and 8000 iterations was equal to 8990 s. It is 2.36 times more than the longest calculation time in this study (equal to 3815 second for the A-Star Algorithm in static version, the virtual bed sample number 1 and the grid resolution of 200 × 200 × 200). The difference seems to be not very significant, but previously the binary grid had only 65,536 nodes, while here the number of nodes is equal to 8 × 10 6 (and the number of particles is 20 times higher). The conclusion is that the application of algorithm, such as the A-Star or Path Searching Algorithm, to calculate the path lengths (and tortuosity) is very attractive in comparison with the Lattice Boltzmann Method.

3.4. Tortuosity Calculation

In the last stage of investigations, the tortuosity was calculated according to the Formula (3), wherein L 0 is equal to n x 1 . In Figure 18, all the obtained results are collected. On the left, the data for all resolutions are visible, whereas on the right, only these for the highest grid resolution are presented. In Table 2, a comparison between the average values of tortuosity calculated for all the method applied in this investigation and results from the literature [22,42]. It turned out that in comparison with hydraulic tortuosity calculated on the basis of the Lattice Boltzmann Method as well as with geometric tortuosity calculated with the use of the Path Tracking Method (details in [42]), the A-Star Algorithm underestimates the result and the Path Searching Algorithm overestimates it. Additionally, the Path Searching Algorithm gives in all cases higher relative error. The differences between static and dynamic variants of the A-Star Algorithm are very small, however, the static variant leads to obtaining results with the smallest relative errors.
The situation differs if the obtained data are compared with the results of calculations based on empirical formulas collected in Table 1. In this comparison (visible in Figure 19), the Path Searching Algorithm provides results in the same range. It is visible once more that the smallest resolution does not have enough good quality.
It may be stated that the binary algorithms such as the A-Star Algorithm or The Path Searching Algorithm may be a good alternative for other techniques of calculating the tortuosity, particularly these based on the numerical methods. They are not complex in theory, are relatively easy to implement and use, fast, and do not generate big data files.

4. Summary

The following conclusions can be formulated based on the results of the present study.
  • To obtain the same porosity as in a real bed sample, the virtual bed has to contain approximately 1000 particles.
  • The resolution of the binary representation of a real (or virtual) bed cannot be too small. However, this resolution may be still much lower than the resolution of grids required by other numerical techniques, in particular by the Lattice Boltzmann Method (used by Wang [22] or in the previous investigations described in the [42]).
  • It is possible to calculate tortuosity with algorithms working on a geometry saved in a form of binary matrices.
  • The Path Searching Algorithm gives always higher values of the tortuosity than the A-Star Algorithm.
  • The A-Star Algorithm (in both implemented variants) underestimated the tortuosity in comparison with the tortuosity (hydraulic or geometric) calculated by alternative numerical techniques.
  • The Path Searching Algorithm overestimates the tortuosity in comparison with the tortuosity (hydraulic or geometric) calculated by alternative numerical techniques. However, the results are in good agreement with the values calculated with the use of empirical formulas collected in Table 1.
  • The Path Searching Algorithm is about two times faster than the A-Star Algorithm.

Funding

This study was funded by Polish Ministry of Science and Higher Education in the frames of the statutory research.

Conflicts of Interest

The author declare no conflict of interest.

References

  1. Sobieski, W.; Trykozko, A. Sensitivity aspects of Forchheimer’s approximation. Transp. Porous Med. 2011, 89, 155–164. [Google Scholar] [CrossRef]
  2. Darcy, H. Les Fontaines Publiques De La Ville De Dijon; Victor Dalmont: Paris, France, 1856. (In French) [Google Scholar]
  3. Forchheimer, P. Wasserbewegung durch boden. Zeit. Ver. Deutsch. Ing. 1901, 45, 1781–1788. (In German) [Google Scholar]
  4. Carman, P.C. Fluid Flow through a Granular Bed. Trans. Inst. Chem. Eng. Lond. 1937, 15, 150–156. [Google Scholar] [CrossRef]
  5. Kozeny, J. Über kapillare Leitung des Wassers im Boden; Sitzungsberichte 136/2a; Akademie der Wissenschaften: Wien, Austria, 1927; pp. 271–306. (In German) [Google Scholar]
  6. Ergun, S. Fluid flow through packed columns. Chem. Eng. Prog. 1952, 48, 89–94. [Google Scholar]
  7. Mian, M.A. Petroleum Engineering Handbook for the Practicing Engineer; Pennwell Publishing: Tulsa, OK, USA, 1992. [Google Scholar]
  8. Skjetne, E.; Klov, T.; Gudmundsson, J.S. High-Velocity Pressure Loss In Sandstone Fractures: Modeling And Experiments (SCA-9927). In Proceedings of the International Symposium of the Society of Core Analysts, Colorado School of Mines, Golden, CO, USA, 1–4 August 1999. [Google Scholar]
  9. Samsuri, A.; Sim, S.H.; Tan, C.H. An Integrated Sand Control Method Evaluation. In Proceedings of the Society of Petroleum Engineers, SPE Asia Pacific Oil and Gas Conference and Exhibition, Jakarta, Indonesia, 9–11 September 2003. [Google Scholar]
  10. Belyadi, A. Analysis of Single-Point Test To Determine Skin Factor. Ph.D. Thesis, Department of Petroleum and Natural Gas Engineering, West Virginia University, Morgantown, WV, USA, 2006. [Google Scholar]
  11. Belyadi, F. Determining Low Permeability Formation Properties from Absolute Open Flow Potential. Ph.D. Thesis, Department of Petroleum and Natural Gas Engineering, West Virginia University, Morgantown, WV, USA, 2006. [Google Scholar]
  12. Lord, D.L.; Rudeen, D.K.; Schatz, J.F.; Gilkey, A.P.; Hansen, C.W. DRSPALL: Spallings Model for the Waste Isolation Pilot Plant 2004 Recertification; SAND2004-0730; Sandia National Laboratories: Albuquerque, NM, USA; Livermore, CA, USA, 2006. [Google Scholar]
  13. Wu, Y.S.; van Vliet, L.J.; Frijlink, H.W.; van der Voort Maarschalk, K. The determination of relative path length as a measure for tortuosity in compacts using image analysis. Eur. J. Pharm. Sci. 2006, 28, 433–440. [Google Scholar] [CrossRef] [PubMed]
  14. Chinda, P.; Brault, P. Tortuosity Model of a Three-Dimensional Stacked Cylindrical Particles Porous Medium for Using with the Thin Film Solid Oxide Fuel Cell Electrodes. Thammasat Int. J. Sci. Technol. 2012, 17, 42–53. [Google Scholar]
  15. Yu, B.M.; Li, J.H. A geometry model for tortuosity of flow path in porous media. Chin. Phys. Lett. 2004, 21, 1569–1571. [Google Scholar]
  16. Yun, M.-J.; Yu, B.-M.; Bin, Z.; Huang, M.-T. A Geometry Model for Tortuosity of Streamtubes in Porous Media with Spherical Particles. Chin. Phys. Lett. 2005, 22, 1464. [Google Scholar]
  17. Koponen, A.; Kataja, M.; Timonen, J. Tortuous flow in porous media. Phys. Rev. E 1996, 54, 406–410. [Google Scholar] [CrossRef]
  18. Koponen, A.; Kataja, M.; Timonen, J. Permeability and effective porosity of porous media. Phys. Rev. E 1997, 56, 3319. [Google Scholar] [CrossRef]
  19. Matyka, M.; Khalili, A.; Koza, Z. Tortuosity-porosity relation in porous media flow. Phys. Rev. E 2008, 78, 026306. [Google Scholar] [CrossRef] [PubMed] [Green Version]
  20. Duda, A.; Koza, Z.; Matyka, M. Hydraulic tortuosity in arbitrary porous media flow. Phys. Rev. E 2011, 84, 036319. [Google Scholar] [CrossRef] [PubMed] [Green Version]
  21. Sobieski, W. Numerical investigations of tortuosity in randomly generated pore structures. Math. Comput. Simulat. 2019, 166, 20. [Google Scholar] [CrossRef]
  22. Wang, P. Lattice Boltzmann Simulation of Permeability and Tortuosity for Flow through Dense Porous Media. Math. Probl. Eng. 2014, 2014, 694350. [Google Scholar] [CrossRef]
  23. Epstein, N. On tortuosity and the tortuosity factor in flow and diffusion through porous media. Chem. Eng. Sci. 1989, 44, 777–779. [Google Scholar] [CrossRef]
  24. Holt, T.E.; Smith, D.M. Surface roughness effects on Knudsen diffusion. Chem. Eng. Sci. 1989, 44, 779–781. [Google Scholar] [CrossRef]
  25. Chou, H.; Wu, L.; Zeng, L.; Chang, A. Evaluation of solute diffusion tortuosity factor models for variously saturated soils. Water Resour. Res. 2012, 48, 11. [Google Scholar] [CrossRef]
  26. Cooper, S.J.; Bertei, A.; Shearing, P.R.; Kilner, J.A.; Brandon, N.P. TauFactor: An open-source application for calculating tortuosity factors from tomographic data. SoftwareX 2016, 5, 203–210. [Google Scholar] [CrossRef]
  27. Kong, W.; Chen, D.; Zhang, Q.; Su, S.; Zhang, J.; Gao, X. A Method for Predicting the Tortuosity of Pore Phase in Solid Oxide Fuel Cells. Electrode Int. J. Electrochem. Sci. 2015, 10, 5800–5811. [Google Scholar]
  28. Ahmadi, M.M.; Mohammadi, S.; Hayati, A.N. Analytical derivation of tortuosity and permeability of mono-sized spheres: A volume averaging approach. Phys. Rev. E 2011, 83, 026312. [Google Scholar] [CrossRef] [Green Version]
  29. Lanfrey, P.-Y.; Kuzeljevic, Z.V.; Dudukovic, M.P. Tortuosity model for fixed beds randomly packed with identical particles. Chem. Eng. Sci. 2010, 65, 1891–1896. [Google Scholar] [CrossRef]
  30. Allen, R.; Sun, S. Investigating the role of tortuosity in the Kozeny-Carman equation. In Proceedings of the International Conference on Numerical and Mathematical Modeling of Flow and Transport in Porous Media, Dubrovnik, Croatia, 29 September–3 October 2014. [Google Scholar]
  31. Tang, X.-W.; Sun, Z.-F.; Cheng, G.C. Simulation of the relationship between porosity and tortuosity in porous media with cubic particles. Chin. Phys. B 2012, 21, 100201. [Google Scholar] [CrossRef]
  32. Pearson, K. The Problem of the Random Walk. Nature 1905, 72, 294. [Google Scholar] [CrossRef]
  33. Nakashima, Y.; Watanabe, Y. Estimate of transport properties of porous media by microfocus X-ray computed tomography and random walk simulation. Water Resour. Res. 2002, 38, 1272. [Google Scholar] [CrossRef]
  34. Boudreau, B.P.; Meysman, F.J.R. Predicted tortuosity of muds. Geology 2006, 34, 693–696. [Google Scholar] [CrossRef]
  35. Huang, J.; Xiao, F.; Dong, H.; Yin, X. Diffusion Tortuosity in Complex Porous Media from Pore-Scale Numerical Simulations. Comput. Fluids 2019, 183, 66–74. [Google Scholar] [CrossRef]
  36. Amien, M.N.; Pantouw, G.T.; Juliust, H.; Dzar, F.; Latief, E. Geometric tortuosity analysis of porous medium using simple neurite tracer. In Proceedings of the IOP Conference Series: Earth and Environmental Science, Bandung, Indonesia, 2–4 July 2018; Volume 311, p. 012041. [Google Scholar]
  37. Simple Neurite Tracer. Available online: https://imagej.net/SNT (accessed on 1 August 2020).
  38. Cao, T.; Zhang, L.; Sun, G.; Wang, C.; Zhang, Y.; Yan, N.; Xu, A. Model for Predicting the Tortuosity of Transport Paths in Cement-Based Materials. Materials 2019, 12, 3623. [Google Scholar] [CrossRef] [Green Version]
  39. Bhatnagar, P.L.; Gross, E.P.; Krook, M. A Model for Collision Processes in Gases. I. Small Amplitude Processes in Charged and Neutral One-Component Systems. Phys. Rev. 1954, 94, 511–525. [Google Scholar] [CrossRef]
  40. Bell, M.; Trozzi, V.; Hosseinloo, S.; Gentile, G.; Fonzone, A. Time-dependent Hyperstar algorithm for robust vehicle navigation. Transp. Res. Part Policy Pract. 2012, 46, 790–800. [Google Scholar] [CrossRef]
  41. Opoku, D.; Homaifar, A.; Tunstel, E. The A-r-Star (Ar*) Pathfinder. Int. J. Comput. Appl. 2013, 67, 32–44. [Google Scholar] [CrossRef]
  42. Sobieski, W.; Matyka, M.; Gołembiewski, J.; Lipiński, S. The Path Tracking Method as an alternative for tortuosity determination in granular beds. Granul. Matter. 2018, 20, 72. [Google Scholar] [CrossRef] [Green Version]
  43. Sobieski, W.; Zech, A.; Roaff, A. Time consumption in calculations of the hydraulic and geometrical tortuosity in granular beds. Tech. Sci. 2020, 23, 25–51. [Google Scholar] [CrossRef]
  44. Lindner, S. Product Data Sheet. Available online: http://www.tecmos.com/wp-content/uploads/2018/05/SiLibeads-Type-S.pdf (accessed on 1 August 2020).
  45. Lilliefors, H.W. On the Kolmogorov-Smirnov Test for Normality with Mean and Variance Unknown. J. Am. Stat. Assoc. 1967, 62, 399–402. [Google Scholar] [CrossRef]
  46. Cooke, A.; Rowe, R. Extension of porosity and surface area models for uniform porous media. J. Environ. Eng. 1999, 125, 126–136. [Google Scholar] [CrossRef]
  47. Ribeiro, A.; Neto, P.; Pinho, C. Mean porosity and pressure drop measurements in packed beds of monosized spheres. Int. Rev. Chem. Eng. 2010, 2, 40–46. [Google Scholar]
  48. Cundall, P.A.; Strack, O.D. A discrete element model for granular assemblies. Géotechnique 1979, 29, 47–65. [Google Scholar] [CrossRef]
  49. Šmilauer, V.; Catalano, E.; Chareyre, B.; Sergei, D.; Duriez, J.; Dyck, N.; Eliáš, J.; Er, B.; Eulitz, A.; Gladky, A.; et al. Yade Documentation, 2nd ed. Available online: https://yade-dem.org/doc/Yade.pdf (accessed on 3 June 2020).
  50. Hertz, H. On the contact of elastic solids. J. Reine. Angew. Math. 1881, 92, 156–171. [Google Scholar]
  51. Nosewicz, S.; Rojek, J.; Chmielewski, M.; Pietrzak, K.; Lumelskyj, D. Application of the hertz formulation in the discrete element model of pressure-assisted sintering. Granul. Matter. 2017, 19, 16. [Google Scholar] [CrossRef] [Green Version]
  52. Sykut, J.; Molenda, M.; Horabik, J. Discrete element method (dem) as a tool for investigating. Pol. J. Food Nutr. Sci. 2007, 52, 169–173. [Google Scholar]
  53. van Lew, J.T.; Park, Y.-H.; Ying, A.; Abdoua, M. Modifying young’s modulus in dem simulations based ondistributions of experimental measurements. Fusion Eng. Des. 2015, 98–99, 1893–1897. [Google Scholar] [CrossRef] [Green Version]
  54. van Zeebroeck, M. The Discrete Element Method (DEM) to Simulate Fruit Impact Damage during Transport and Handling. Ph.D. Thesis, Katholieke Universiteit Leuven, Leuven, Belgium, 2005. [Google Scholar]
  55. Voigt, W. Abhandlungen der Königlichen Gesellschaft von Wissenschaften zu Göttingen; Weidmann: Berlin, Germany, 1890; p. 36. (In German) [Google Scholar]
  56. Hunt, K.H.; Crossley, F.R.E. Coeffcient of restitution interpreted as damping in vibroimpact. J. Appl. Mech. 1975, 7, 440–445. [Google Scholar] [CrossRef]
  57. Kuwabara, G.; Kono, K. Restitution coeffcient in a collision between two spheres. Jpn. J. Appl. Phys. 1987, 26, 1230. [Google Scholar] [CrossRef]
  58. Lankarani, H.M.; Nikravesh, P. A contact force model with hysteresis damping for impact analysis of multibody systems. J. Mech. Des. 1990, 112, 369–376. [Google Scholar] [CrossRef]
  59. Tsuji, Y.; Tanaka, T.; Ishida, T. Lagrangian numerical simulation of plug flow of cohesionless particles in a horizontal pipe. Powder Technol. 1992, 71, 239–250. [Google Scholar] [CrossRef]
  60. Zabulionis, D.; Kačianauskas, R.; Markauskas, D.; Rojek, J. An investigation of nonlinear tangential contact behaviour of a spherical particle under varying loading. Bull. Pol. Acad. Sci. Tech. Sci. 2012, 60, 265–278. [Google Scholar] [CrossRef]
  61. Singh, A.; Magnanimo, V.; Saitoh, K.; Luding, S. Effect of cohesion on shear banding in quasistatic granular materials. Phys. Rev. E 2014, 90, 022202. [Google Scholar] [CrossRef] [Green Version]
  62. Hart, P.E.; Nilsson, N.J.; Raphael, B. A formal basis for the heuristic determination of minimum cost paths. IEEE Trans. Syst. Sci. Cyb. 1986, 4, 100–107. [Google Scholar] [CrossRef]
  63. Kozicki, J.; Donze, F. Yade-open dem: An open-source software using a discrete element method to simulate granular material. Eng. Comput. 2009, 26, 786–805. [Google Scholar] [CrossRef] [Green Version]
  64. Sobieski, W.; Lipiński, S. The influence of particle size distribution on parameters characterizing the spatial structure of porous beds. Granul. Matter. 2019, 21, 14. [Google Scholar] [CrossRef] [Green Version]
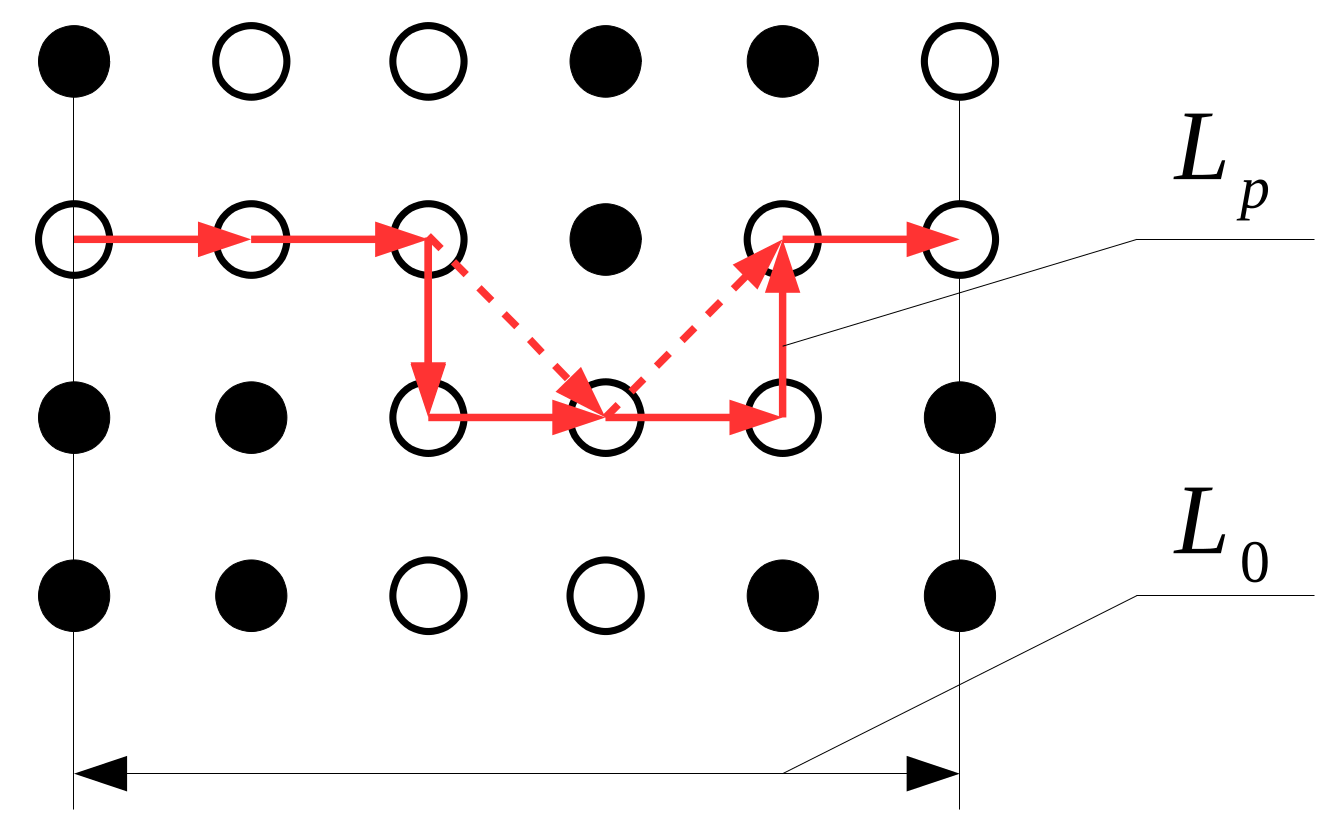
Figure 1. The idea of calculating the so-called binary tortuosity.
Processes 08 01105 g001
Figure 2. Glass marbles (a), a bed sample (b), and a cumulative discrete distribution function consisting of 25 fractions (c).
Processes 08 01105 g002
Figure 3. Interaction of two circular or spherical particles: (a) hard contact model, (b) soft contact model.
Processes 08 01105 g003
Figure 4. A schema of directions in a regular grid of nodes.
Processes 08 01105 g004
Figure 5. Movement possibilities in the PSA algorithm: (a) forward movement, (b) one side movement, (c) random sideways movement, (d) backward movement, (e) no possibility of movement.
Processes 08 01105 g005
Figure 6. Relationship between the number of particles and the bed porosity.
Processes 08 01105 g006
Figure 7. Virtual bed samples numbered 1, 2, and 3 (counting from the left).
Processes 08 01105 g007
Figure 8. Virtual bed sample number 3 in resolution 50 × 50 × 50.
Processes 08 01105 g008
Figure 9. Virtual bed sample number 3 in resolution 100 × 100 × 100.
Processes 08 01105 g009
Figure 10. Virtual bed sample number 3 in resolution 150 × 150 × 150.
Processes 08 01105 g010
Figure 11. Paths calculated by the A-Star Algorithm in static variant (resolution 200 × 200 × 200).
Processes 08 01105 g011
Figure 12. Paths calculated by the A-Star Algorithm in dynamic variant (resolution 200 × 200 × 200).
Processes 08 01105 g012
Figure 13. Paths calculated by the Path Searching Algorithm (resolution 200 × 200 × 200).
Processes 08 01105 g013
Figure 14. Impact of grid resolution on the results: A-Star static (a), A-Star dynamic (b), and Path Searching Algorithm (PSA) (c).
Processes 08 01105 g014
Figure 15. The number of solid Start Points in the function of grid resolution.
Processes 08 01105 g015
Figure 16. Normalized number of path points in the function of grid resolution and the algorithm used.
Processes 08 01105 g016
Figure 17. Real calculation time in the function of the number of grid nodes.
Processes 08 01105 g017
Figure 18. Comparison of tortuosity values (for alternative calculating methods).
Processes 08 01105 g018
Figure 19. Comparison of tortuosity values (for chosen empirical formulas).
Processes 08 01105 g019
Table 1. Examples of empirical formulas serving to calculate the tortuosity for packed beds.
No.SourceFormula τ ( ϕ = 0.413 )
1Bartell & Osterhof (1928) [28,29] τ = 0.5 π 1.5708
2Carman (1937) [4,5] τ = 2 1.4142
3Weissberg (1963) [28,30] τ = 1 0.49 l n ( ϕ ) 1.4333
4Du Plessis & Masliyah (1988) [28,30] τ = ϕ 1 ( 1 ϕ ) 2 / 3 1.3816
5Comiti & Renaud (1989) [28,30,31] τ = 1 C l n ( ϕ ) 1.3626 for C = 0.41 [29]
6Boudreau (1996) τ = 1 l n ( ϕ 2 ) 1.6639
7Lanfrey et al. (2010) [29] τ = 1.23 ( 1 ϕ ) 4 / 3 ϕ k 2 , where k is a shape factor1.4638 for k = 1
Table 2. Relative errors between the results obtained in the investigation and data from the works in [22,42].
Method τ δ Wang δ LBM δ PTM
[ ] [ % ] [ % ] [ % ]
A-Star static1.1464−4.27−7.01−5.53
A-Star dynamic1.1259−5.98−8.67−7.21
PSA1.422018.7515.3517.19