Performance Analysis and Working Fluid Selection for Single and Two Stages Vapor Compression Refrigeration Cycles

 ,
, 
Abstract
1. Introduction
2. Methodology
2.1. Single-Stage Vapor Compression Refrigeration Cycle Description
2.2. Two-Stage Compression Refrigeration Cycle with Flash Intercooler
2.3. Refrigerant Selection
3. Mathematical Model
3.1. VCRC Mathematical Model
3.2. TSVCRC Mathematical Model
4. Results and Discussion
4.1. Thermodynamic Data
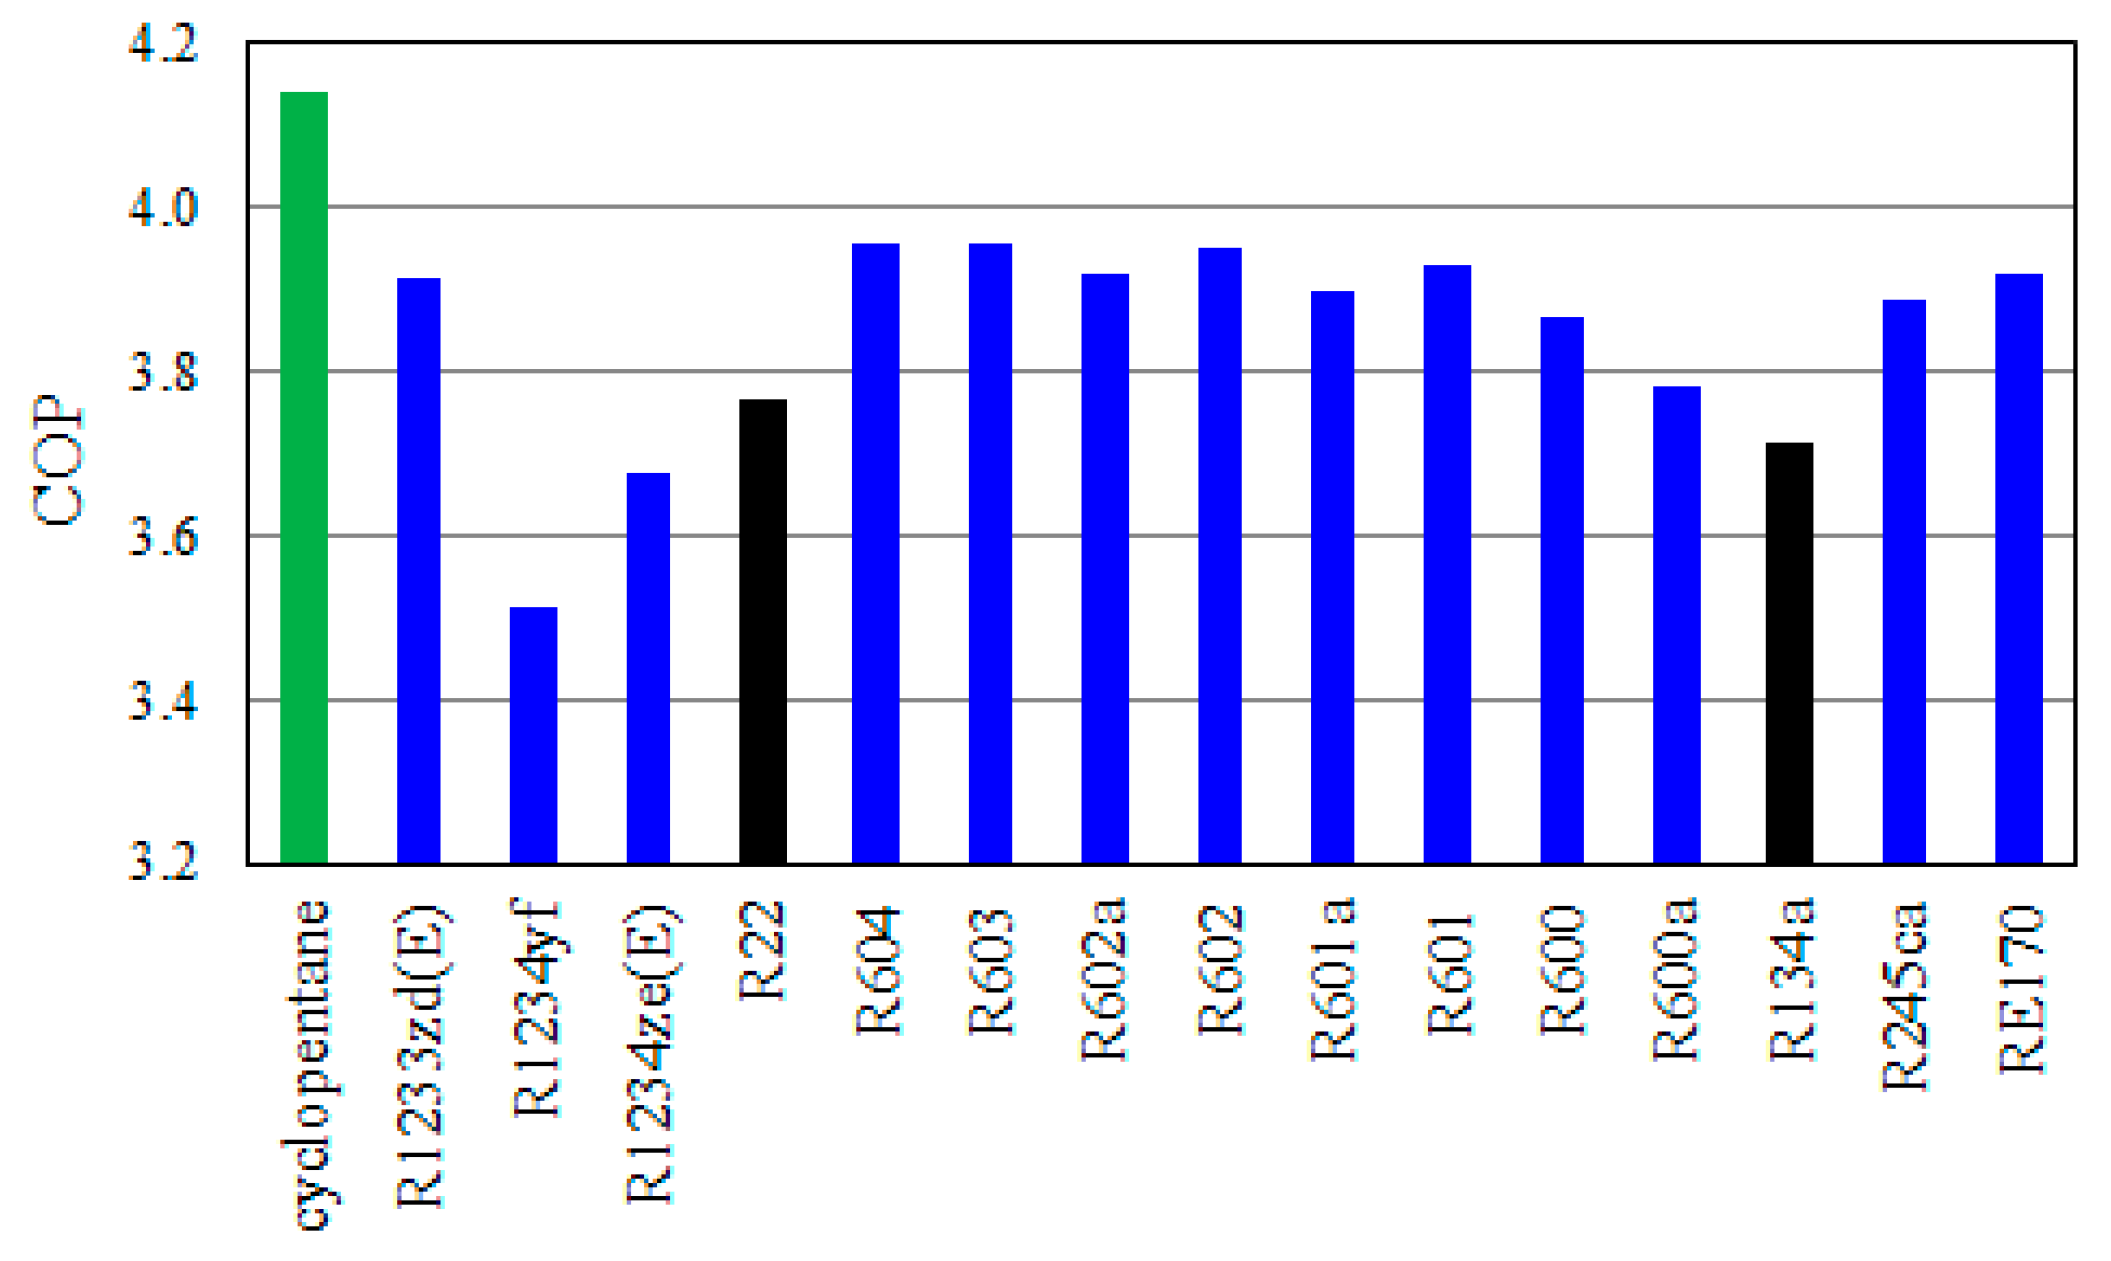
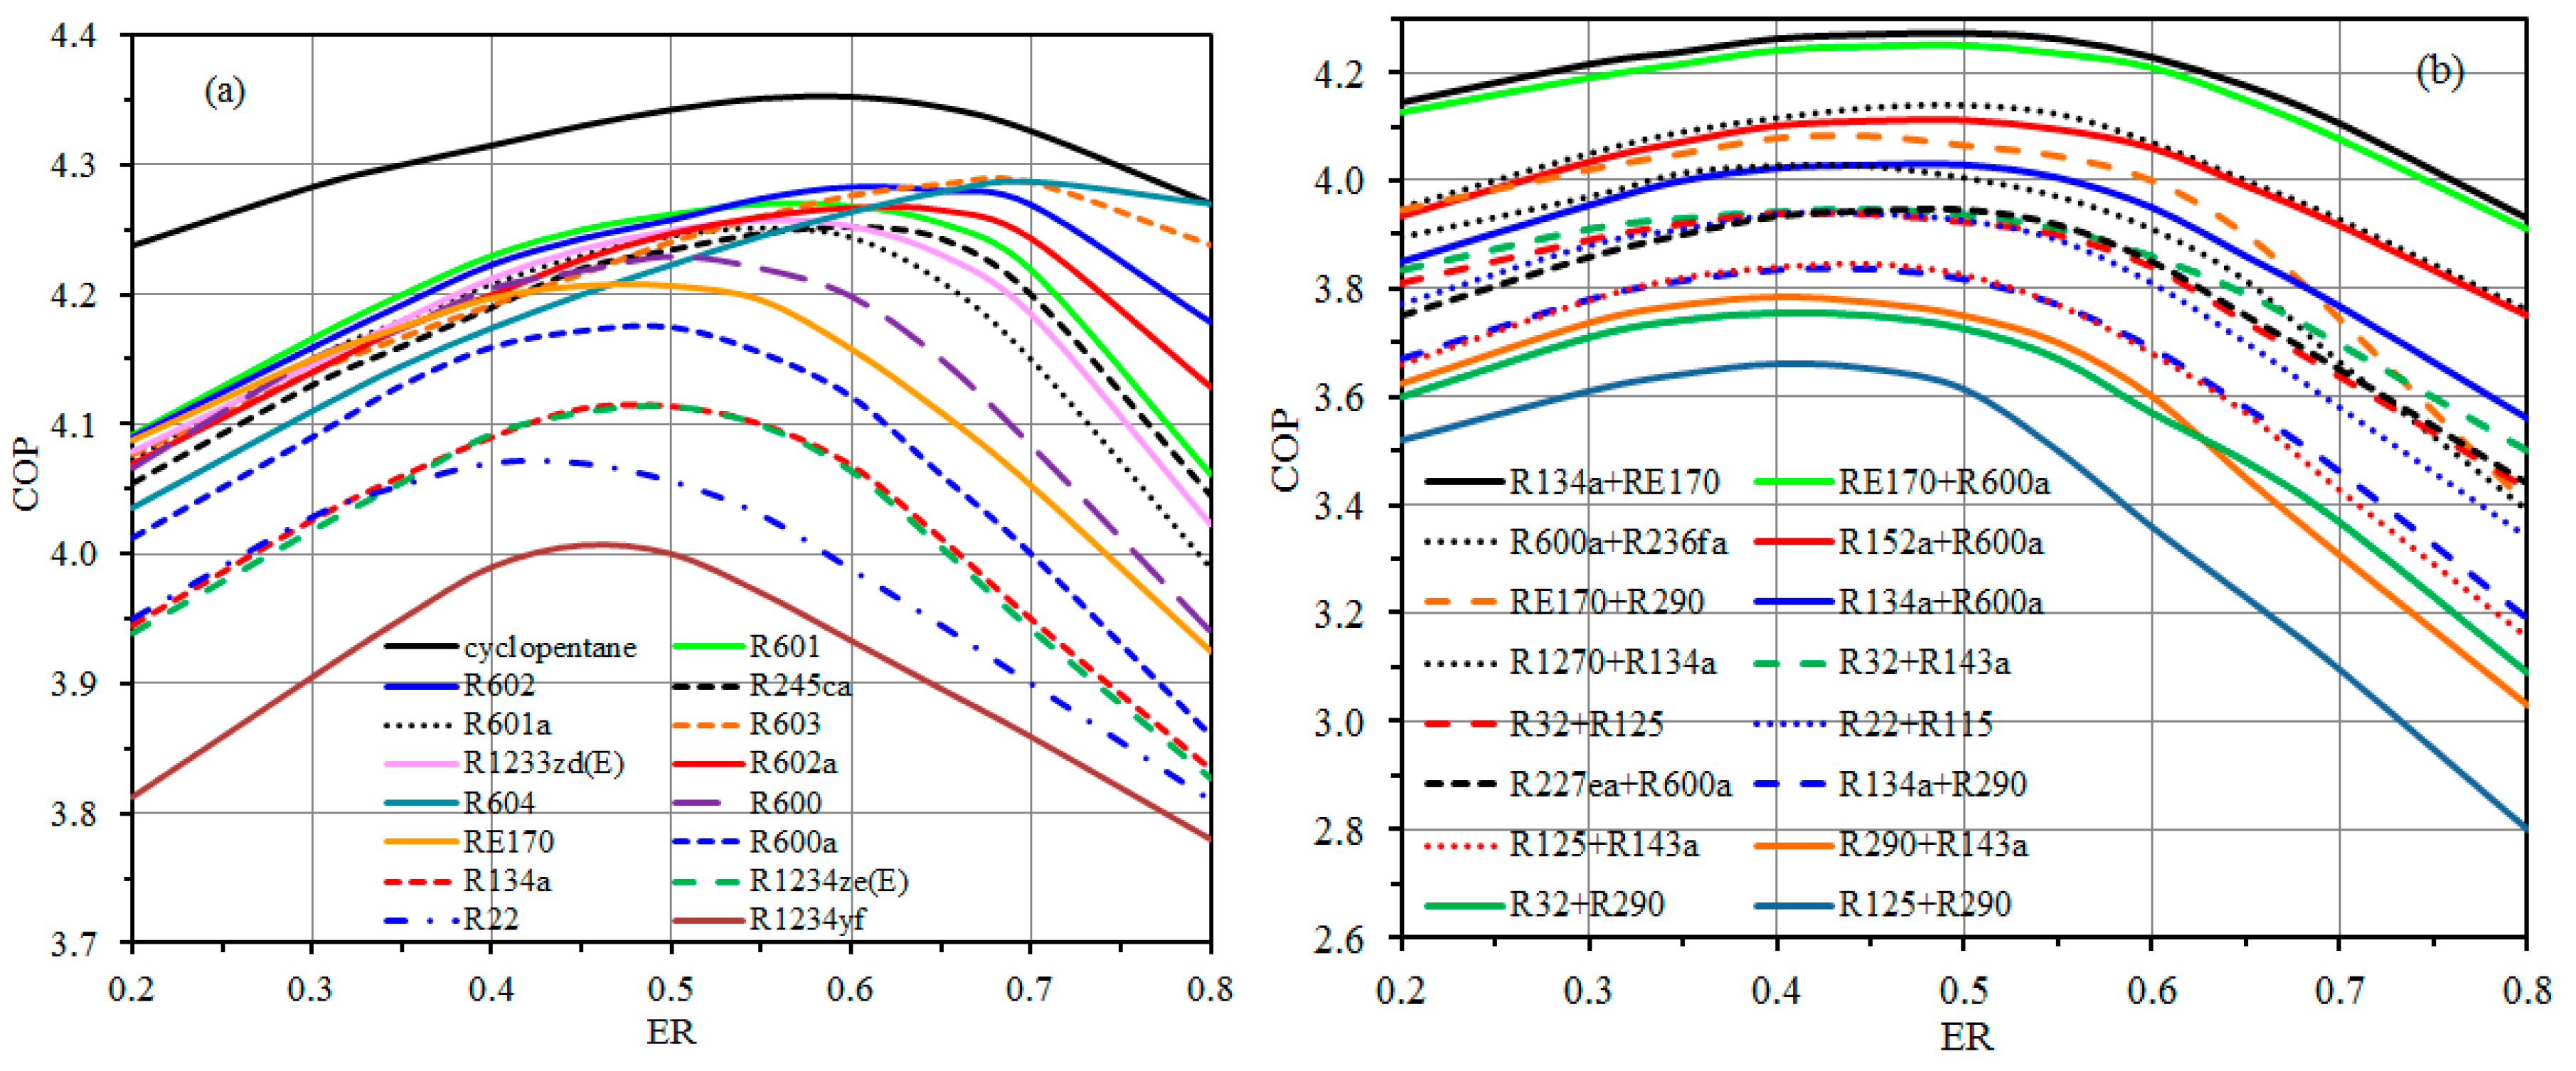
4.2. Performance Analysis of VCRC
4.3. Performance Analysis of TSVCRC
5. Conclusions
Author Contributions
Funding
Acknowledgments
Conflicts of Interest
References
- Carvalho, S.M.R.; Massuchetto, L.H.P.; Nascimento, R.B.C.; Araujo, H.V.; D′Angelo, J.V.H. Optimization of a vapor injection refrigeration cycle using hydrocarbon mixed refrigerants. Int. J. Refrig. 2019, 98, 109–119. [Google Scholar] [CrossRef]
- Heo, J.; Jeong, M.W.; Kim, Y. Effects of flash tank vapor injection on the heating performance of an inverter-driven heat pump for cold regions. Int. J. Refrig. 2010, 33, 848–855. [Google Scholar] [CrossRef]
- Park, C.; Lee, H.; Hwang, Y.; Radermacher, R. Recent advances in vapor compression cycle technologies. Int. J. Refrig. 2015, 60, 118–134. [Google Scholar] [CrossRef]
- Xu, X.; Hwang, Y.; Radermacher, R. Refrigerant injection for heat pumping/air conditioning systems: Literature review and challenges discussions. Int. J. Refrig. 2011, 34, 402–415. [Google Scholar] [CrossRef]
- Xu, S.; Fan, X.; Ma, G. Experimental investigation on heating performance of gas-injected scroll compressor using R32, R1234yf and their 20wt%/80wt% mixture under low ambient temperature. Int. J. Refrig. 2017, 75, 286–292. [Google Scholar] [CrossRef]
- Qi, H.; Liu, F.; Yu, J. Performance analysis of a novel hybrid vapor injection cycle with subcooler and flash tank for air-source heat pumps. Int. J. Refrig. 2017, 74, 540–549. [Google Scholar] [CrossRef]
- Tello-Oquendo, F.M.; Navarro-Perris, E.; Gonzalvez-Macia, J. A comprehensive study of two-stage vapor compression cycles with vapor-injection for heating applications, taking into account heat sink of finite capacity. Int. J. Refrig. 2018, 93, 52–64. [Google Scholar] [CrossRef]
- Xu, S.; Niu, J.; Cui, Z.; Ma, G. Experimental research on vapor-injectetd heat pump using injection subcooling. Appl. Therm. Eng. 2018, 136, 674–681. [Google Scholar] [CrossRef]
- Zhao, Y.; Li, Z.; Zhang, X.; Wang, X.; Dong, X.; Gao, B.; Gong, M.; Shen, J. Azeotropic refrigerants and its application in vapor compression refrigeration cycle. Int. J. Refrig. 2019, 108, 1–13. [Google Scholar] [CrossRef]
- Mohammad, T.; Hoseyn, S. Optimal design of a two-stage refrigeration cycle for natural gas pre-cooling in a gas refinery considering the best allocation of refrigerant. Energy Convers. Manage. 2020, 210, 112743. [Google Scholar]
- D′Angelo, J.V.H.; Aute, V.; Radermacher, R. Performance evaluation of a vapor injection refrigeration system using mixture refrigerant R290/R600a. Int. J. Refrig. 2016, 65, 194–208. [Google Scholar] [CrossRef]
- Lee, Y.; Kang, D.; Jung, D. Performance of virtually non-flammable azeotropic HFO1234yf/HFC134a mixture for HFC134a applications. Int. J. Refrig. 2013, 36, 1203–1207. [Google Scholar] [CrossRef]
- Shaik, S.V.; Babu, T.P.A. Theoretical performance investigation of vapour compression refrigeration system using HFC and HC refrigerant mixtures as alternatives to replace R22. Energy Procedia 2017, 109, 235–242. [Google Scholar] [CrossRef]
- Chen, J.; Havtun, H.; Palm, B. Screening of working fluids for the ejector refrigeration system. Int. J. Refrig. 2014, 47, 1–14. [Google Scholar] [CrossRef]
- Besagni, G.; Mereu, R.; Leo, G.D.; Inzoli, F. A study of working fluids for heat driven ejector refrigeration using lumped parameter models. Int. J. Refrig. 2015, 58, 154–171. [Google Scholar] [CrossRef]
- Calm, J.M. The next generation of refrigerants-Historical review, considerations, and outlook. Int. J. Refrig. 2008, 31, 1123–1133. [Google Scholar] [CrossRef]
- Gil, B.; Kasperski, J. Efficiency analysis of alternative refrigerants for ejector cooling cycles. Energy Convers. Manage. 2015, 94, 12–18. [Google Scholar] [CrossRef]
- Molés, F.; Navarro-Esbrí, J.; Peris, B.; Mota-Babiloni, A.; Kontomaris, K. Thermodynamic analysis of a combined organic Rankine cycle and vapor compression cycle system activated with low temperature heat sources using low GWP fluids. Appl. Therm. Eng. 2015, 87, 444–453. [Google Scholar] [CrossRef]
- Sethi, A.; Becerra, E.V.; Motta, S.Y. Low GWP R134a replacements for small refrigeration (plug-in) applications. Int. J. Refrig. 2016, 66, 64–72. [Google Scholar] [CrossRef]
- Intergovernmental Panel on Climate Change (IPCC). Fifth Assessment Report: Climate Change; IPCC: Geneva, Switzerland, 2013. [Google Scholar]
- Calm, J.M.; Hourahan, G.C. Physical, safety, and environmental data summary for current and alternative refrigerants. In Proceedings of the 23rd International Congress of Refrigeration, Prague, Czech Republic, 21–26 August 2011; pp. 1–22. [Google Scholar]
- Saleh, B.; Weingerl, U.; Wendland, M. Description of the Thermodynamic Properties of Natural Refrigerants with BACKONE Equations. In Proceedings of the IIR Conference on Thermophysical Properties and Transfer Processes of New Refrigerants, Paderborn, Germany, 3–5 October 2001; pp. 31–38. [Google Scholar]
- Saleh, B.; Wendland, M. Screening of pure fluids as alternative refrigerants. Int. J. Refrig. 2006, 29, 260–269. [Google Scholar] [CrossRef]
- Saleh, B.; Koglbauer, G.; Wendland, M.; Fischer, J. Working fluids for low temperature organic Rankine cycles. Energy 2007, 32, 1210–1221. [Google Scholar] [CrossRef]
- Lai, N.A.; Wendland, M.; Fischer, J. Working fluids for high-temperature organic Rankine cycles. Energy 2011, 36, 199–211. [Google Scholar] [CrossRef]
- Saleh, B. Performance analysis and working fluid selection for ejector refrigeration cycle. Appl. Therm. Eng. 2016, 107, 114–124. [Google Scholar] [CrossRef]
- Saleh, B.; Wendland, M. Description of the Thermodynamic Properties of Fluorinate Ethers as Pure and Mixed Refrigerants with BACKONE equations, abstract no. In Proceedings of the 17th IUPAC Conference on Chemical Thermodynamics, Rostock, Germany, 28 July–2 August 2002. [Google Scholar]
- Saleh, B.; Wendland, M. Screening of mixture as alternative refrigerants. In Proceedings of the Eurotherm Seminar No. 72 on Thermodynamics, Heat and Mass Transfer of Refrigeration Machines and Heat Pumps, Valencia, Spain, 31 March–2 April 2003; pp. 331–336. [Google Scholar]
- Lai, N.A.; Phan, T.T.H. Review of the BACKONE equation of state and its applications. Mol. Phys. 2017, 115, 1041–1050. [Google Scholar] [CrossRef]
- Bolaji, B.O.; Komolafe, D.O.; Ajayi, F.O.; Akinnibosun, E. Performance Assessment of Three Eco-Friendly Hydro-Fluorocarbon and Hydrocarbon Refrigerant Mixtures as R22 Alternatives in Refrigeration Systems. Middle East. J. Sci. Res. 2015, 23, 1677–1684. [Google Scholar]
- Bolaji, B.O.; Oyelaran, O.A.; Okoye, O.C. Thermodynamic study of environment-friendly R429A, R435A and R457A refrigerants as substitutes for ozone depleting R22 in refrigeration and air-conditioning systems. Sci. J. Marit. Res. 2017, 31, 45–52. [Google Scholar]


| Substance | Chemical Formula | Physical Data | Environmental Data | Safety Data | |||||||
|---|---|---|---|---|---|---|---|---|---|---|---|
| M | NBP | Tc | Pc | vc × 103 | ALT | ODP | GWP 100 yr | LFL | Safety Group | ||
| g/mol | °C | °C | MPa | m3/kg | Year | % | |||||
| R125 | CHF2CF3 | 120.02 | −48.1 | 66.0 | 3.62 | 1.74 | 28.2 | 0.0 | 3420 | none | A1 |
| R143a | CF3CH3 | 84.04 | −47.2 | 72.7 | 3.76 | 2.32 | 47.1 | 0.0 | 4180 | 8.2 | A2L |
| R32 | CH2F2 | 52.024 | −51.7 | 78.1 | 5.78 | 2.36 | 5.2 | 0.0 | 716 | 14.4 | A2L |
| R115 | CCLF2CF3 | 154.47 | −39.3 | 80.0 | 3.13 | 1.63 | 1020 | 0.57 | 7230 | none | A1 |
| R1270 | CH3-CH=CH2 | 42.08 | −47.7 | 92.4 | 4.67 | 4.48 | 0.001 | 0.0 | <20 | 2.7 | A3 |
| R1234yf | CF3CF=CH2 | 114.04 | −29.5 | 94.7 | 3.38 | 2.10 | 0.029 | 0.0 | 4.4 | 6.2 | A2L |
| R22 | CHCLF2 | 86.47 | −40.8 | 96.2 | 4.99 | 1.91 | 11.9 | 0.04 | 1790 | none | A1 |
| R290 | C3H8 | 44.10 | −42.1 | 96.7 | 4.25 | 4.58 | 0.041 | 0.0 | ~20 | 2.1 | A3 |
| R134a | CF3-CH2F | 102.0 | −26.1 | 101.1 | 4.06 | 1.95 | 13.4 | 0.0 | 1370 | none | A1 |
| R227ea | CF3-CHF-CF3 | 170.0 | −16.3 | 101.8 | 2.93 | 1.68 | 38.9 | 0.0 | 3580 | none | A1 |
| R1234ze(E) | CHF=CHCF3 | 114.04 | −19.0 | 109.4 | 3.64 | 2.04 | 0.045 | 0.0 | 6 | 7.6 | A2L |
| R152a | CH3-CHF2 | 66.05 | −24.0 | 113.3 | 4.52 | 2.72 | 1.1 | 0.0 | 133 | 4.8 | A2 |
| R236fa | CF3-CH2-CF3 | 152.0 | −1.5 | 124.9 | 3.20 | 1.81 | 242 | 0.0 | 9820 | none | A1 |
| RE170 | CH3-O-CH3 | 46.1 | −24.8 | 127.2 | 5.34 | 3.65 | 0.015 | 0.0 | <1 | 3.4 | A3 |
| R600a | iso-C4H10 | 58.12 | −11.7 | 134.7 | 3.63 | 4.46 | 0.016 | 0.0 | ~20 | 1.6 | A3 |
| R600 | C4H10 | 58.12 | −0.55 | 152.0 | 3.80 | 4.39 | 0.018 | 0.0 | ~20 | 2.0 | A3 |
| R1233zd(E) | CHCL=CH-CF3 | 130.5 | 18.3 | 165.6 | 3.57 | 2.10 | 0.071 | 0.0 | --- | --- | --- |
| R245ca | CHF2-CF2-CH2F | 134.1 | 25.3 | 174.4 | 3.94 | 1.90 | 6.5 | 0.0 | 726 | 7.1 | --- |
| R601a | CH3CH2CH(CH3)2 | 72.15 | 27.8 | 187.2 | 3.38 | 4.24 | 0.009 | 0.0 | ~20 | 1.3 | A3 |
| R601 | CH3(CH2)3CH3 | 72.15 | 36.1 | 196.6 | 3.37 | 4.31 | 0.009 | 0.0 | ~20 | 1.2 | A3 |
| R602a | (CH3)2CH(CH2)2CH3 | 86.2 | 60.2 | 224.6 | 3.04 | 4.27 | --- | 0.0 | ~20 | 1.2 | A3 |
| R602 | CH3-4(CH2)-CH3 | 86.2 | 68.7 | 234.7 | 3.03 | 4.29 | --- | 0.0 | ~20 | 1.2 | A3 |
| cyclopentane | C5H10 | 70.1 | 49.3 | 238.6 | 4.57 | 3.73 | 0.007 | 0.0 | <0.1 | 1.1 | A3 |
| R603 | CH3-5(CH2)-CH3 | 100.2 | 98.4 | 267.0 | 2.74 | 4.31 | --- | 0.0 | 3 | 1.2 | --- |
| R604 | CH3-6(CH2)-CH3 | 114.2 | 125.6 | 296.2 | 2.50 | 4.26 | --- | 0.0 | 3 | 1.0 | --- |
| Mixture | Phase Behavior | x1 | k12 |
|---|---|---|---|
| R290 + R143a | azeotropic | 0.35 | 0.077 |
| R125 + R290 | azeotropic | 0.65 | 0.083 |
| R600a + R236fa | azeotropic | 0.56 | 0.081 |
| R227ea + R600a | azeotropic | 0.63 | 0.072 |
| R134a + R290 | azeotropic | 0.40 | 0.073 |
| R134a + R600a | azeotropic | 0.71 | 0.073 |
| R152a + R600a | azeotropic | 0.74 | 0.071 |
| R125 + R143a | near azeotropic | 0.0:1.0 | −0.032 |
| R32 + R125 | near azeotropic | <0.19, >0.69 | 0.006 |
| R32 + R290 | azeotropic | 0.68 | 0.033 |
| R32 + R143a | near azeotropic | 0.85 | 0.003 |
| RE170 + R600a | azeotropic | 0.90 | 0.026 |
| RE170 + R290 | azeotropic | 0.1 | 0.028 |
| R22 + R115 | azeotropic | 0.63 | 0.044 |
| R134a + RE170 | azeotropic | 0.30 | −0.034 |
| R1270 + R134a | azeotropic | 0.81 | 0.051 |
| Refrigerant | Type | , kW | COP | Tdis, °C | CCR | |
|---|---|---|---|---|---|---|
| cyclopentane | o | 84.8 | 351.2 | 4.14 | 62.48 | 7.20 |
| R1233zd(E) | i | 39.5 | 154.4 | 3.91 | 43.79 | 6.08 |
| R1234yf | i | 31.1 | 109.1 | 3.51 | 37.92 | 4.04 |
| R1234ze(E) | i | 35.2 | 129.4 | 3.68 | 40.47 | 4.53 |
| R22 | b | 42.0 | 158.1 | 3.77 | 66.69 | 3.82 |
| R604 | o | 72.7 | 287.4 | 3.96 | 35.83 | 17.25 |
| R603 | o | 72.8 | 288.0 | 3.96 | 36.10 | 12.31 |
| R602a | o | 69.3 | 271.4 | 3.92 | 35.02 | 7.99 |
| R602 | o | 73.1 | 288.7 | 3.95 | 36.68 | 8.82 |
| R601a | o | 69.6 | 270.9 | 3.90 | 36.61 | 5.87 |
| R601 | o | 73.8 | 290.0 | 3.93 | 38.03 | 6.43 |
| R600 | o | 74.2 | 286.9 | 3.87 | 40.37 | 4.72 |
| R600a | o | 68.0 | 257.3 | 3.78 | 39.11 | 4.29 |
| R134a | b | 38.7 | 143.7 | 3.72 | 48.24 | 4.42 |
| R245ca | o | 41.8 | 162.5 | 3.89 | 41.00 | 7.05 |
| RE170 | b | 86.9 | 340.3 | 3.92 | 58.89 | 4.21 |
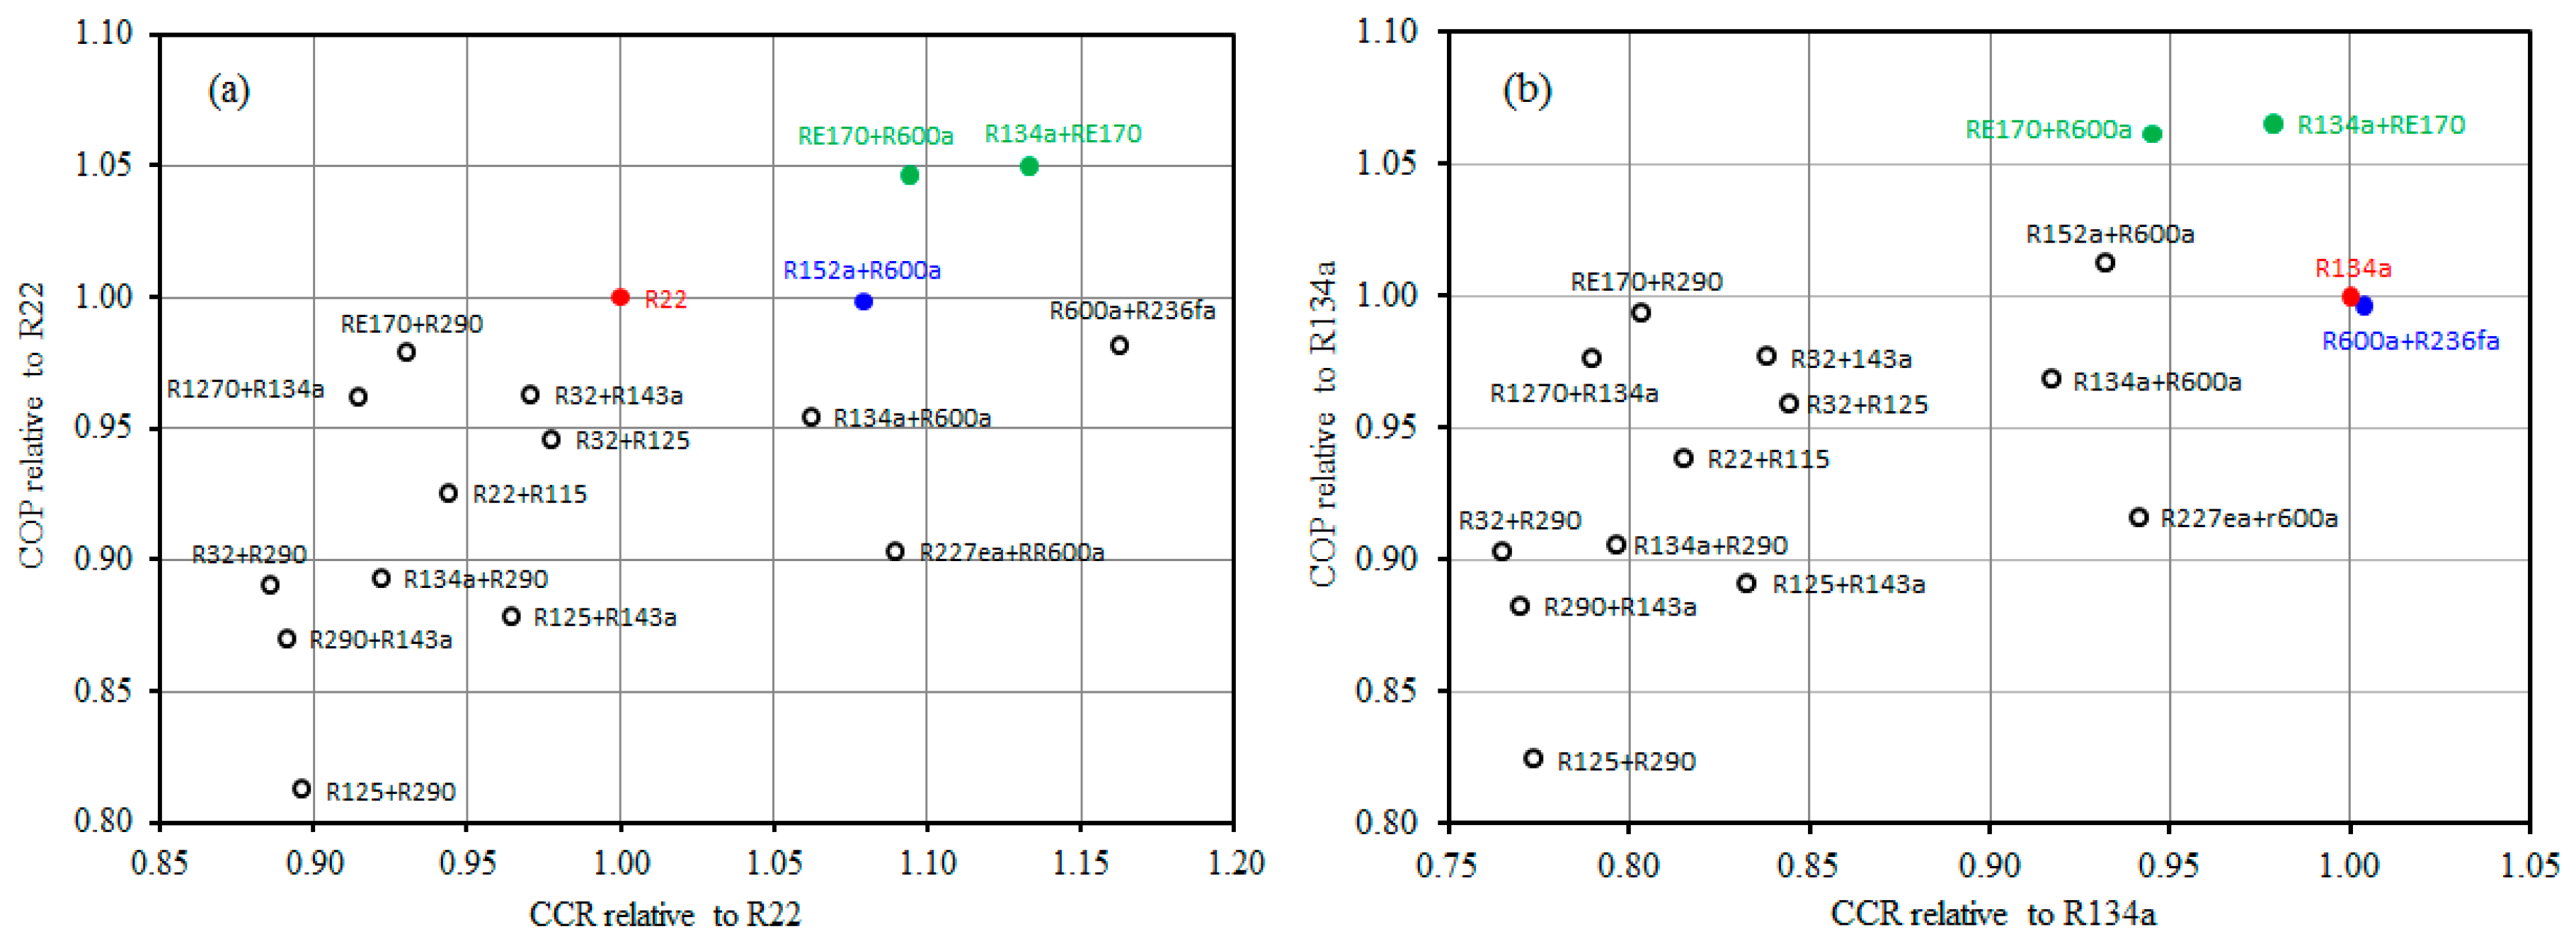
| Mixture | , kW | COP | Tdis, °C | CCR | |
|---|---|---|---|---|---|
| R290 + R143a | 42.3 | 138.6 | 3.28 | 49.66 | 3.40 |
| R125 + R290 | 30.9 | 94.5 | 3.06 | 45.26 | 3.42 |
| R600a + R236fa | 41.9 | 155.2 | 3.70 | 44.86 | 4.44 |
| R227ea + R600a | 29.1 | 99.2 | 3.40 | 36.63 | 4.16 |
| R134a + R290 | 54.0 | 181.7 | 3.37 | 38.66 | 3.52 |
| R134a + R600a | 41.3 | 148.4 | 3.60 | 47.72 | 4.05 |
| R152a + R600a | 59.8 | 225.2 | 3.76 | 53.03 | 4.12 |
| R125 + R143a | 31.6 | 104.6 | 3.31 | 44.67 | 3.68 |
| R32 + R125 | 46.6 | 166.0 | 3.56 | 67.98 | 3.73 |
| R32 + R290 | 60.7 | 203.7 | 3.35 | 65.81 | 3.38 |
| R32 + R143a | 59.8 | 217.1 | 3.63 | 74.86 | 3.71 |
| RE170 + R600a | 82.5 | 325.2 | 3.94 | 55.11 | 4.18 |
| RE170 + R290 | 74.1 | 273.6 | 3.69 | 48.95 | 3.55 |
| R22 + R115 | 28.6 | 99.8 | 3.49 | 45.41 | 3.60 |
| R134a + RE170 | 63.2 | 250.0 | 3.96 | 55.29 | 4.33 |
| R1270 + R134a | 59.7 | 216.5 | 3.63 | 53.20 | 3.49 |
© 2020 by the authors. Licensee MDPI, Basel, Switzerland. This article is an open access article distributed under the terms and conditions of the Creative Commons Attribution (CC BY) license (http://creativecommons.org/licenses/by/4.0/).
Share and Cite
Saleh, B.; Aly, A.A.; Alsehli, M.; Elfasakhany, A.; Bassuoni, M.M. Performance Analysis and Working Fluid Selection for Single and Two Stages Vapor Compression Refrigeration Cycles. Processes 2020, 8, 1017. https://doi.org/10.3390/pr8091017
Saleh B, Aly AA, Alsehli M, Elfasakhany A, Bassuoni MM. Performance Analysis and Working Fluid Selection for Single and Two Stages Vapor Compression Refrigeration Cycles. Processes. 2020; 8(9):1017. https://doi.org/10.3390/pr8091017
Chicago/Turabian StyleSaleh, Bahaa, Ayman A. Aly, Mishal Alsehli, Ashraf Elfasakhany, and Mohamed M. Bassuoni. 2020. "Performance Analysis and Working Fluid Selection for Single and Two Stages Vapor Compression Refrigeration Cycles" Processes 8, no. 9: 1017. https://doi.org/10.3390/pr8091017
APA StyleSaleh, B., Aly, A. A., Alsehli, M., Elfasakhany, A., & Bassuoni, M. M. (2020). Performance Analysis and Working Fluid Selection for Single and Two Stages Vapor Compression Refrigeration Cycles. Processes, 8(9), 1017. https://doi.org/10.3390/pr8091017