Article

Process Optimization for Green Synthesis of Silver Nanoparticles Using Indonesian Medicinal Plant Extracts

1
Department of Pharmaceutical Biology, Faculty of Pharmacy, University of Surabaya, Jl. Raya Kalirungkut, Surabaya 60293, Indonesia
2
Department of Pharmaceutics, Faculty of Pharmacy, University of Surabaya, Jl. Raya Kalirungkut, Surabaya 60293, Indonesia
3
Faculty of Biotechnology, University of Surabaya, Jl. Raya Kalirungkut, Surabaya 60293, Indonesia
*
Author to whom correspondence should be addressed.
Processes 2020, 8(8), 998; https://doi.org/10.3390/pr8080998
Submission received: 19 July 2020 / Revised: 12 August 2020 / Accepted: 12 August 2020 / Published: 17 August 2020
(This article belongs to the Special Issue Green Separation and Extraction Processes)

Abstract

:
Silver nanoparticles (AgNPs) are an interesting metal nanoparticle that can be incorporated into pharmaceutical products, including for diabetic foot ulcers as an antimicrobial agent. Green synthesis of AgNPs using plant extracts has been drawing much attention as it is simple, eco-friendly, stable, and cost-effective. This present study was performed to evaluate the potential of three Indonesian medicinal plant extracts, namely Phyllanthus niruri (PN), Orthosiphon stamineus (OS), and Curcuma longa (CL), as reducing and capping agents in the green synthesis of AgNPs, and to optimize their concentrations. Based on the yields and characteristics of the formed nanoparticles, which were analyzed using a UV-Vis spectrophotometer, particle size analyzer, scanning electron microscope, and X-ray diffractometer, Phyllanthus niruri extract at a concentration of 0.5% was concluded as the best extract in the green synthesis of AgNPs. It is thereby a prospective reducing and capping agent for further scale-up studies.

Graphical Abstract

1. Introduction

Diabetic foot ulcers (DFUs) are one of the common complications of diabetes mellitus. The wound healing process in this disorder is much more delicate than normal wounds and can be inhibited by the presence of oxygen-free radicals, microbial infection, and high blood glucose. The microbial burden is believed to underlie the delayed healing process in DFU [1], and Staphylococci, Pseudomonas, Citrobacter, and Enterococci are major bacteria colonizing diabetic wounds [2]. Therefore, ulcer treatment requires comprehensive management, including the use of appropriate antibiotics. Silver and polyherbal dressing, and natural polymers dressing, have exhibited promising results in diabetic wound healing [3,4].
Silver ions have been recognized for decades as active antimicrobial and tissue regenerating agents. Silver or other antimicrobial agents containing dressings can be considered in the routine management of DFU. Wound dressing containing silver ions has the potential to be used in the management of DFU [5]. Reducing the size of silver ions to nanoparticles has been shown to release silver ions more rapidly than bulk silver. Silver nanoparticles (AgNPs) are interesting metal nanoparticles, whose unique physical and chemical properties are responsible for their antimicrobial applications in pharmaceutical and clinical areas, cosmetics, and dentistry. Wound dressings with AgNPs also have the potential to be used as an alternative for topical antibiotics, which have been proven to be effective and safe [6,7]. AgNPs naturally interact with bacterial membranes and interfere with their integrity, further binding to sulfur, oxygen, and nitrogen of essential biological molecules, while inhibiting bacterial growth [8]. Despite the various techniques available for their synthesis, i.e., physical, chemical, and green techniques, only the first two approaches have been widely implemented. Moreover, chemical synthesis uses reducing agents and stabilizers that are known to carry a risk of toxicity to the environment. Green synthesis, or the bio-based method, involves a wide range of organisms, from simple prokaryotic bacterial cells to eukaryotic fungi and plants. Some limitations in its application are attributed to the use of microbes that require a sterile environment and must be handled by staff with specific skills, all of which create time- and cost-ineffective processes [9]. Plant-based green synthesis has become increasingly popular owing to its safe, environmentally-friendly, simple, and cost-effective process that is easy to upscale [10,11]. Plant metabolites, such as proteins, enzymes, tannins, phenols, sugars, and flavonoids, act as reducing and capping or stabilizing agents to form nanometals [12]. Plants rich in these compounds are presumed to be promising bio-reducing agents in metal nanoparticles.
Our previous studies on seven native Indonesian plant species showed that the three plants commonly used in herbal medicines, namely Phyllanthus niruri (PN), Orthosiphon stamineus (OS), and Curcuma longa (CL), had the highest total phenolic and flavonoid contents and exhibited antioxidant activities [13,14]. These plants also demonstrated antibacterial activities against various pathogenic gram-positive and gram-negative bacteria [15,16,17,18,19,20].
As an initial step in the development of topical AgNPs products for diabetic wound healing, this present work was conducted to (i) optimize the concentrations of PN, OS, and CL extracts in the green synthesis of AgNPs and (ii) select the best candidate of plant extract for a bio-reducer in further research based on the characteristics of the AgNPs formed.

2. Materials and Methods

2.1. Chemical and Plant Materials

Crude drugs consisting of the aerial parts of Phyllanthus niruri, Orthosiphon stamineus leaves, and Curcuma longa rhizomes, provided by a cultivation and research center for medicinal plants in Tawangmangu City, Indonesia, were collected in June 2019. Plant materials were authenticated by the Center for Traditional Medicine Information and Development, Faculty of Pharmacy, University of Surabaya, Indonesia (certificate numbers: 1405/D.T/VIII/2019, 1400/D.T/V/2019, and 1401/D.T/V/2019 for PN, OS, and CL, respectively). Silver nitrate (AgNO3), ethanol, sodium hydroxide (NaOH), and potassium bromide (KBr, spectroscopy grade) were procured from Merck (Darmstadt, Germany). Unless stated otherwise, the chemicals used were analytical grade. Demineralized water was used in all processes involving water.

2.2. Preparation of Plant Extracts

For PN, OS, and CL, the dry plant material was ground and sifted with 20 mesh sieves. A total of 10 g of the resulting crude drug powder was then extracted by the ultrasound-assisted extraction method, using 50 mL of 80% ethanol for 10 min. The residue, which had been separated from the extract, was re-extracted using the same procedure. Afterward, the extracts were collected, put into a 100 mL volumetric flask, and the volume was adjusted to 100 mL using 80% ethanol. This liquid is hereinafter referred to as the parent extract (the concentration is equivalent to 10%).

2.3. Green Synthesis of AgNPs Using the Plant Extracts

The synthesis of AgNPs used three kinds of extracts, namely the ethanol extracts of PN, OS, and CL; each was prepared at 0.125, 0.25, 0.5, 0.75, and 1% concentrations. The temperature and duration of the syntheses were slightly adjusted from the procedures described in previous studies [21,22]. First of all, 100 mL of the extract was added with 1 mL of 100 mM AgNO3 (1 mL of the extract was removed prior to the addition so that the concentration of AgNO3 in the mixture was 1 mM). This mixture was then heated at 60 °C with constant stirring (150 rpm, 30 min). During the heating and stirring process, the UV-Vis spectrum of the mixture was recorded every 10 min (t0, t10, t20, t30). The products of this procedure were then stored for 24 h, and the UV-Vis spectrum was re-observed. A maximum of 1 mL of 0.2 M NaOH was then dripped into the mixture, and the presence of sediment and brownish-red solution indicated that AgNPs had formed. After the addition of NaOH, the UV-Vis spectrum of the mixture was reread, then centrifuged (2500× g rpm, 15 min) to remove the suspended material. Afterward, the spectrum of the supernatant was measured again at 200–600 nm to confirm the formation of AgNPs. The product was collected by centrifugation (10,000× g rpm, 15 min). The AgNPs were then washed with demineralized water three times, then dried in a desiccator until a constant weight was achieved.

2.4. Characterization of AgNPs

The synthesized AgNPs were characterized based on absorption spectra, particle size, size distribution, shape, morphology, and crystalline phases. The UV-Vis absorption spectra were read using a Shimadzu UV–1900 UV-Vis spectrophotometer, Shimadzu (Tokyo, Japan). Particle size and size distributions were determined by a Nanotrac Wave II particle size analyzer (Microtrac, Germany), while the shape and morphology were evaluated using a Hitachi Flexsem 100 scanning electron microscope (SEM) (Tokyo, Japan). A Jasco FT/IR-4200 spectrophotometer (Japan) with a deuterated triglycine sulfate (DTGS) detector was also used to identify the functional groups contained in the extracts and the synthesized AgNPs. Finally, the crystalline phases were analyzed using an X’pert Philips X-ray diffractometer (PANanalytical B.V., Almelo, The Netherlands).

3. Results

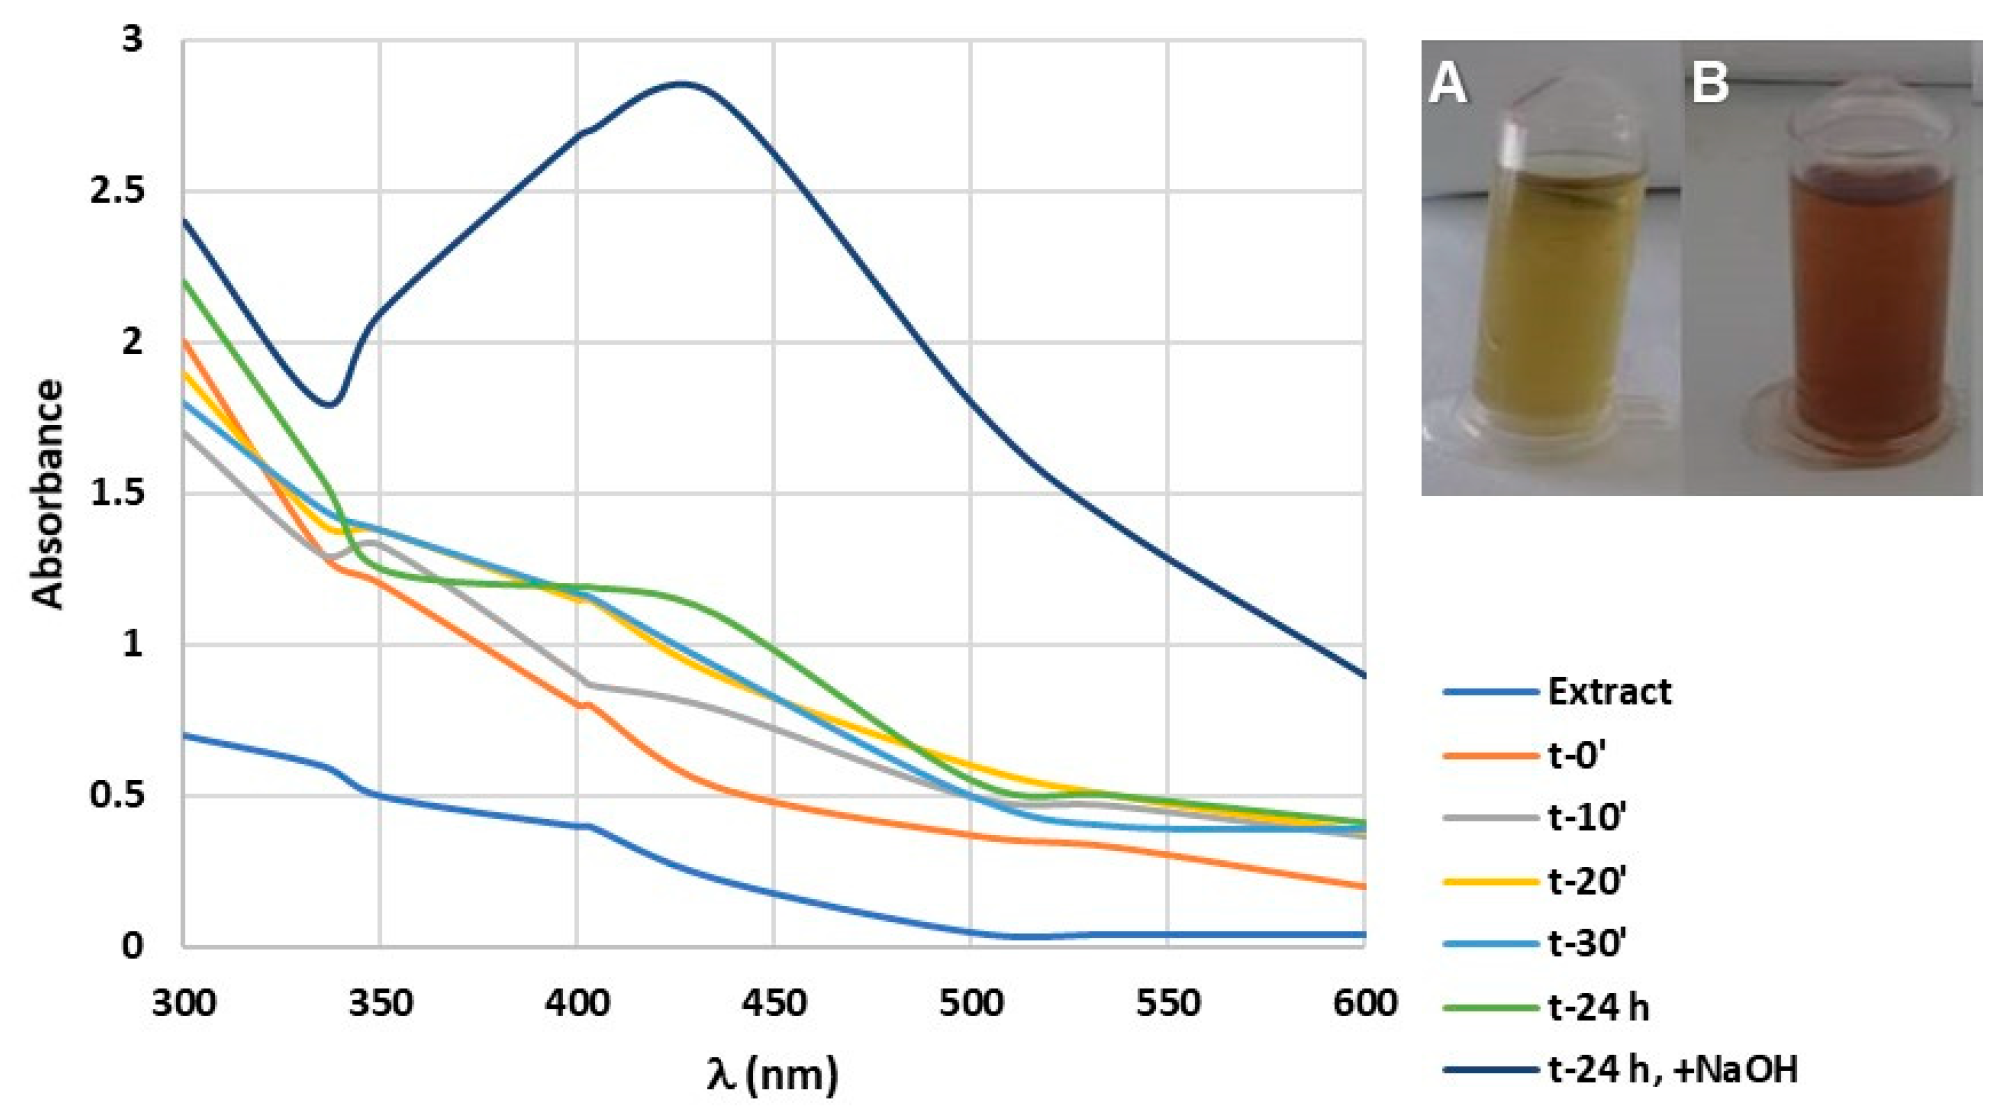
3.1. Optimization of the Extract Concentration

During the green synthesis, the formation of AgNPs can be monitored visually from the color change (i.e., from yellowish-green to reddish-brown) and absorbance (measured using a UV-Vis spectrophotometer). Absorbance values were recorded every 10 min during the 30-min synthesis process. Afterward, the solution was kept for up to 24 h and then added gradually with 0.2 M NaOH, while observing any color changes. Subsequently, the absorbance was reread to see if there was any increment, which indicates an optimum synthesis reaction. Changes in absorbance values during the AgNPs synthesis using the PN extract are depicted in Figure 1 (the ones using the OS and CL extracts are not presented). This figure shows that AgNPs were formed after 24 h in the green synthesis.
In this optimization process, five concentrations of PN, OS, and CL extracts (i.e., 0.125, 0.25, 0.5, 0.75, and 1%) were analyzed. AgNPs were only produced in extracts with concentrations of 0.5 and 0.75%. At 0.5%, the PN and OS extracts produced higher yields than at 0.75%, while the contrary was true for the CL extract (Table 1).

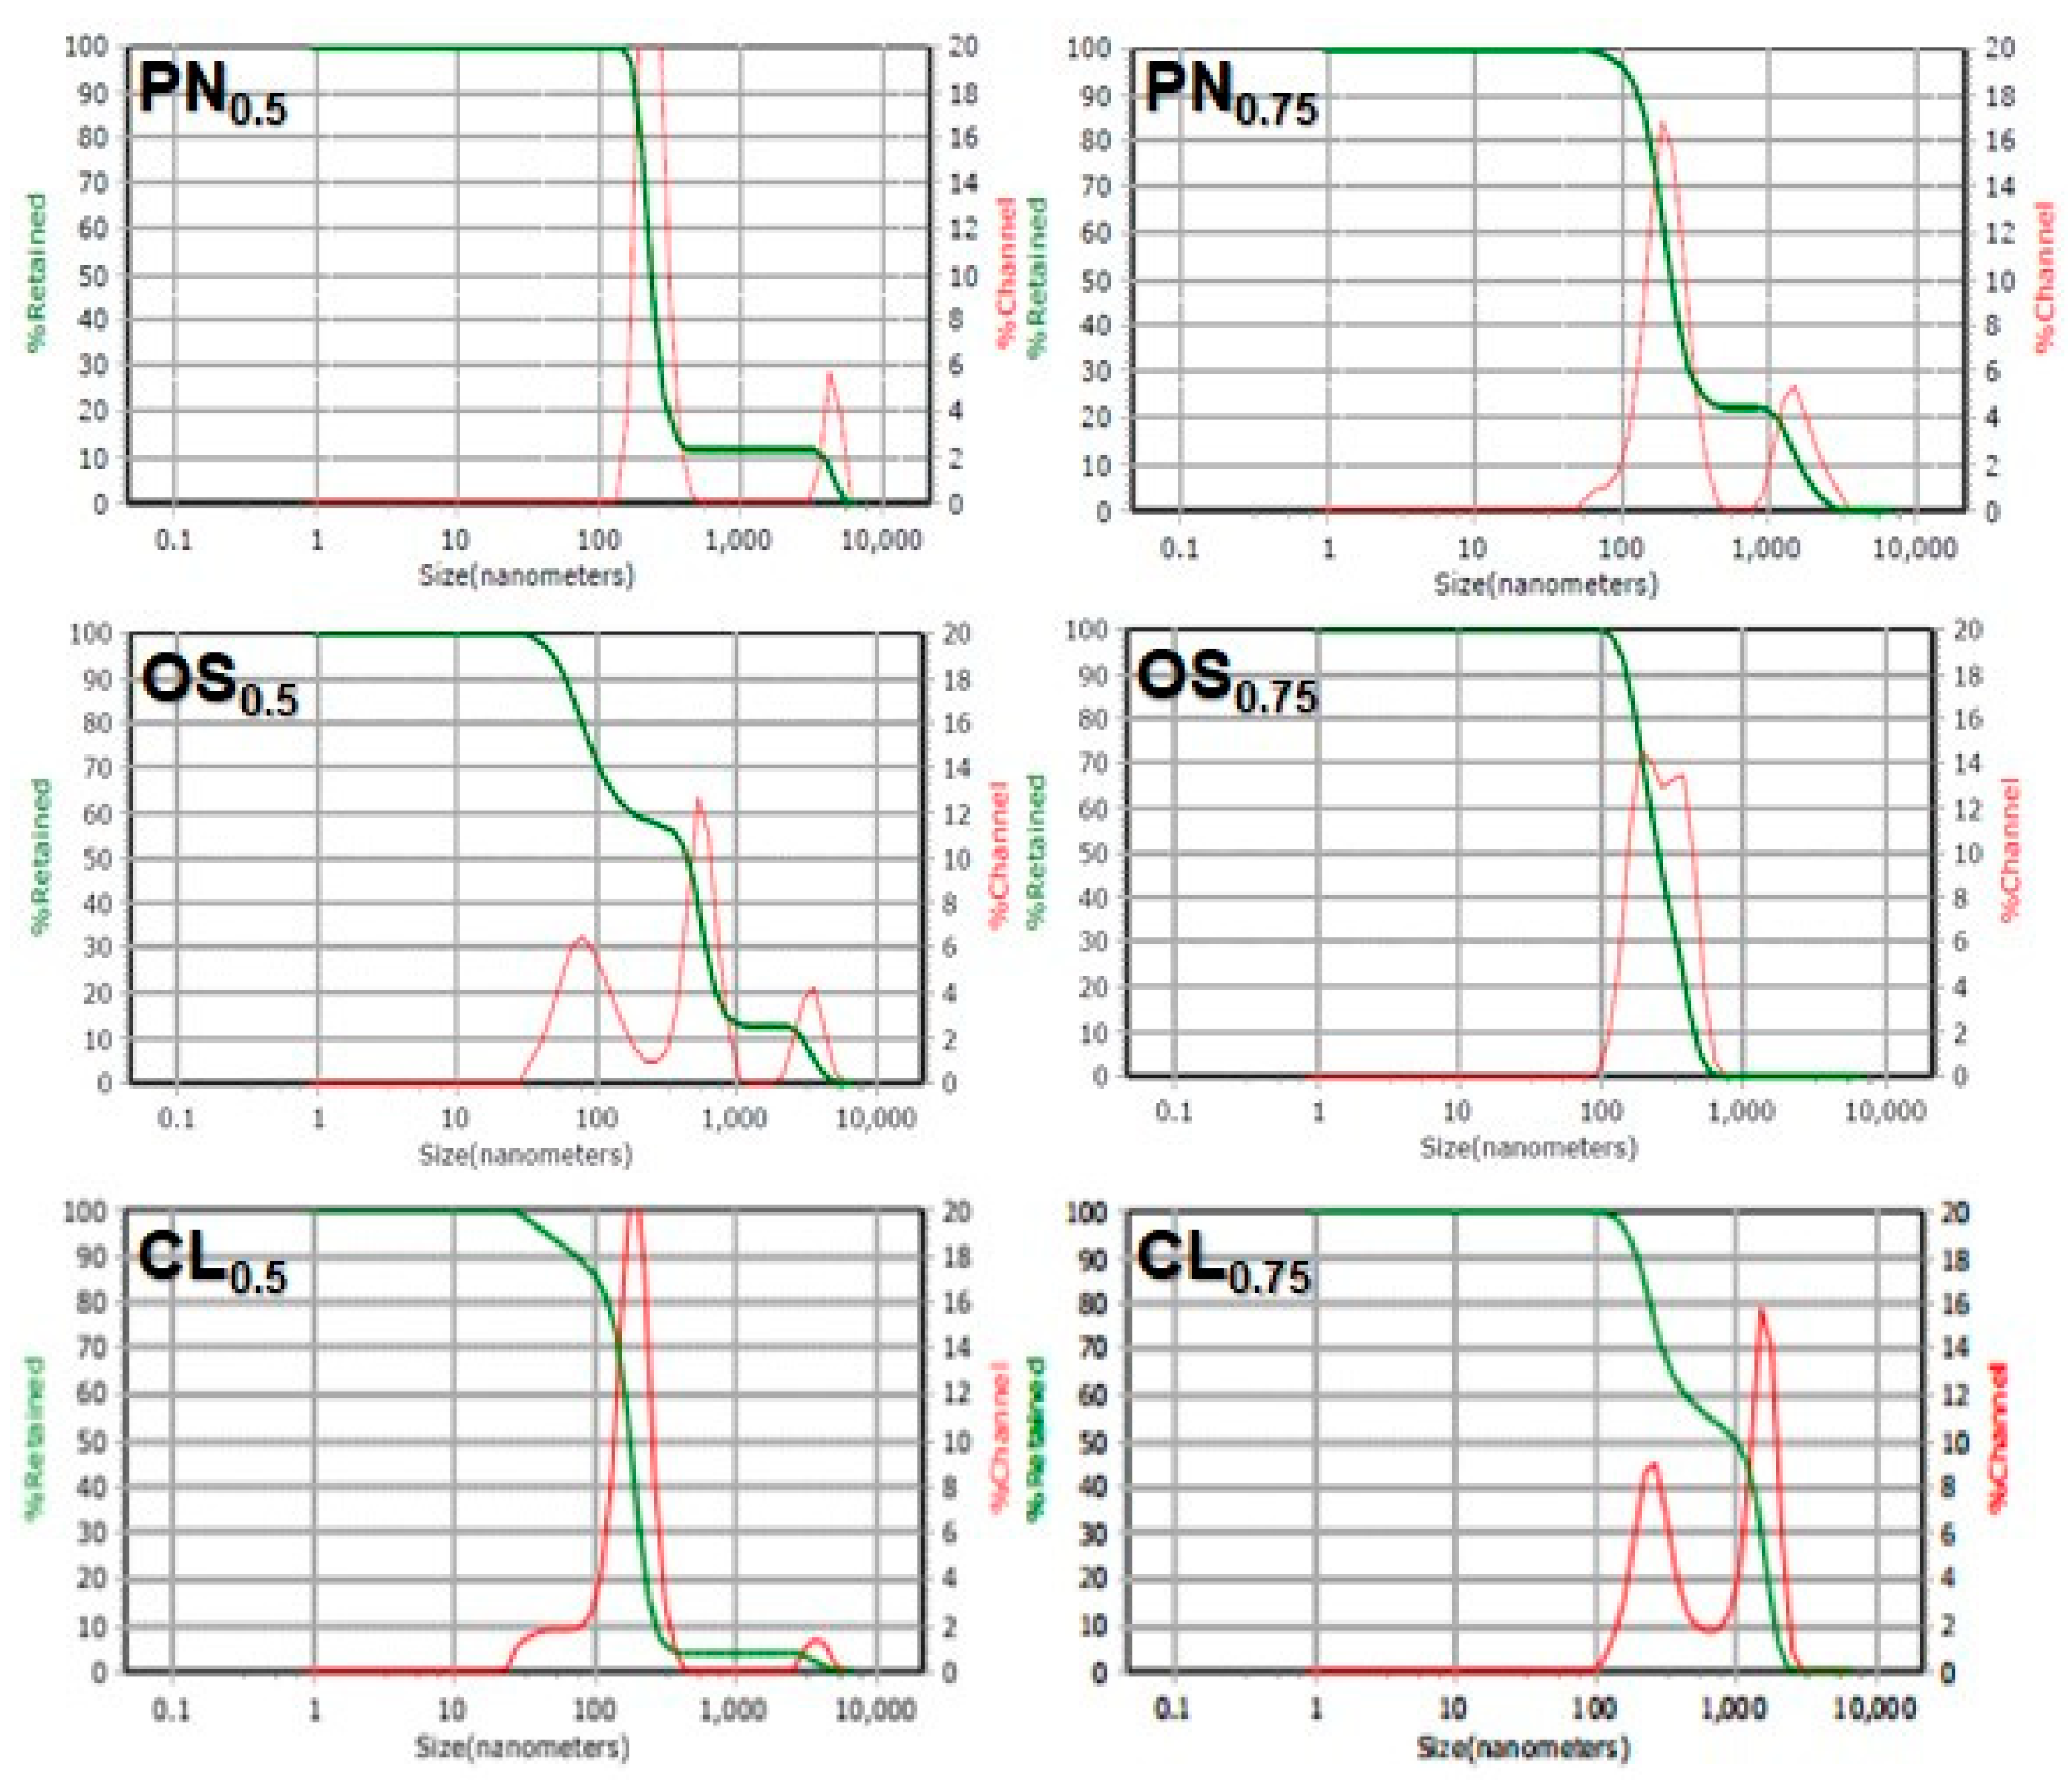
3.2. Particle Size and Particle Size Distribution of AgNPs

As shown in Table 2 and Figure 2, the particle sizes of the produced AgNPs ranged between 277 and 918 nm. The OS extract at a concentration of 0.75% (denoted as OS0.75) yielded AgNPs with the smallest particle size, whereas CL0.75 produced the largest sizes. Besides this particle size, the dispersity (or poly-dispersity index) of AgNPs was also measured to justify the occurrence of agglomeration or aggregation of the sample during the process.

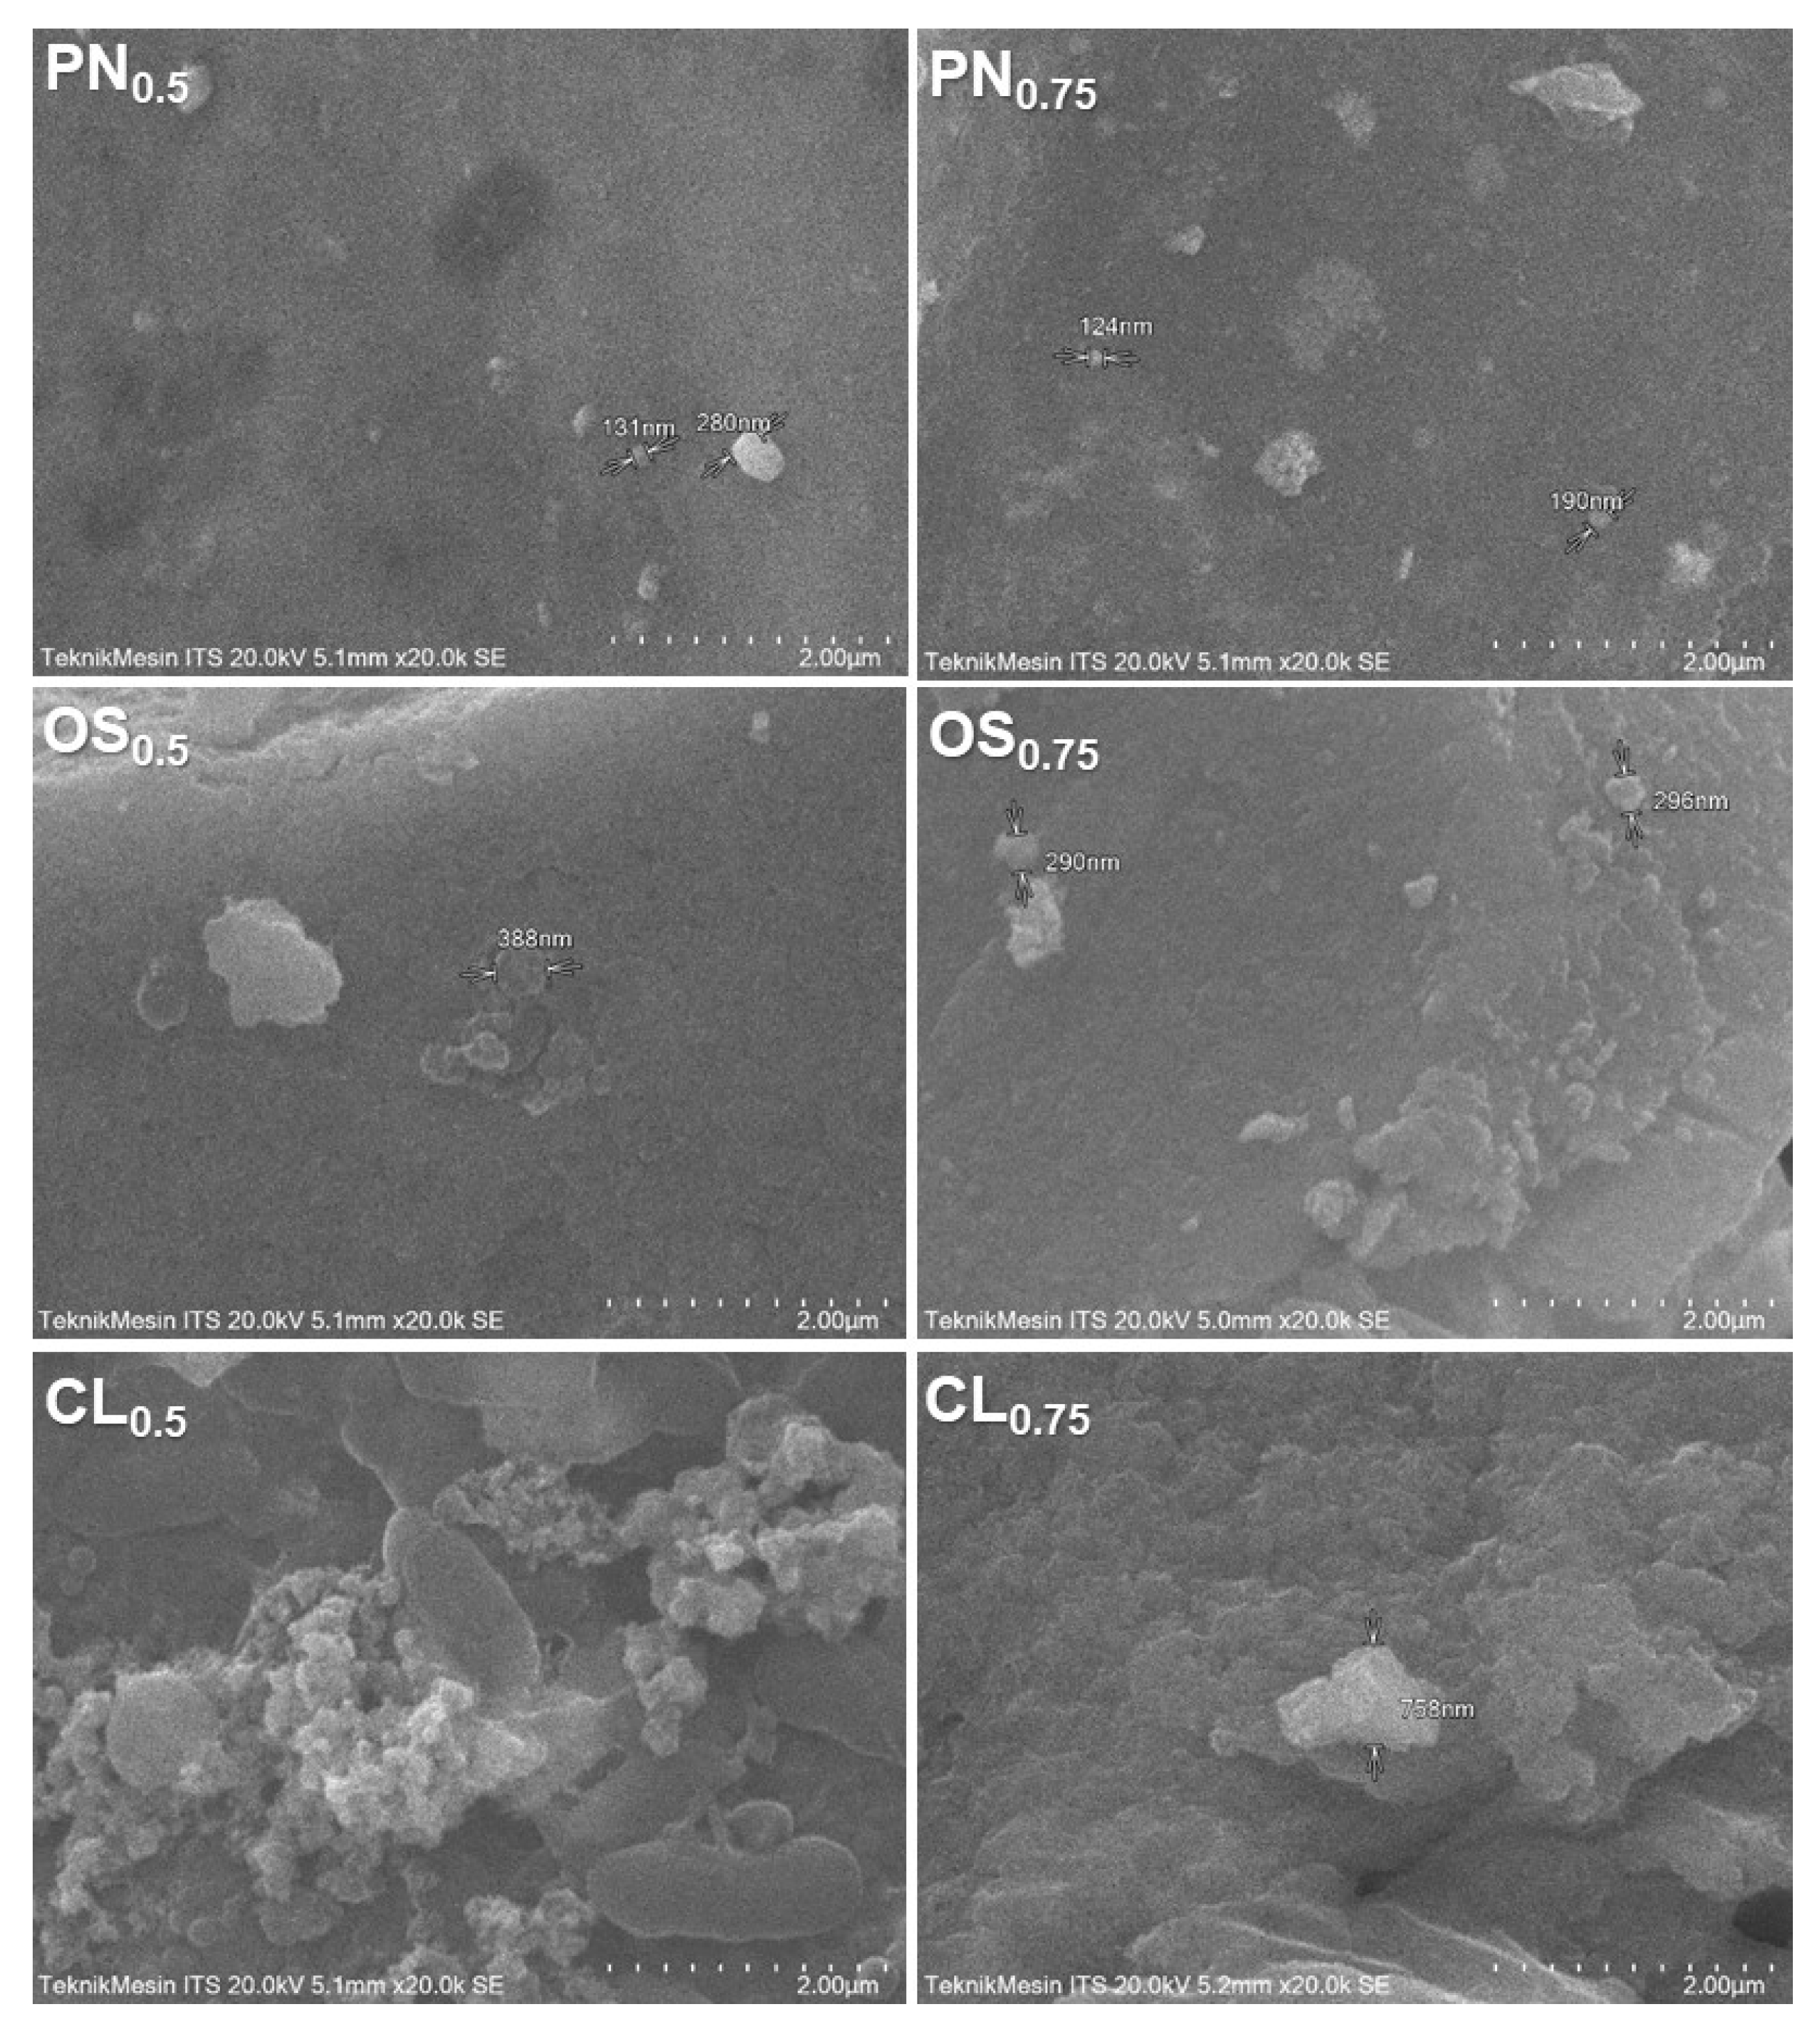
3.3. Morphological AgNP Evaluation by Scanning Electron Microscopy (SEM)

The SEM images (Figure 3) present that the AgNPs synthesized using PN extracts were spherical with particle sizes in the ranges of 100–300 nm and 100–200 nm for PN0.5 and PN0.75, respectively. Additionally, OS0.5 and OS0.75 produced spherical AgNPs with particle sizes of 300–400 and 200–300 nm, respectively. These products are consistent with the PSA results, i.e., PN and OS with higher concentrations produced smaller silver nanoparticles. However, CL extract created AgNPs with a dominant irregular shapes and larger sizes, which can be caused by solvent evaporation during sample preparation or differences in chemical constituents of the extracts.

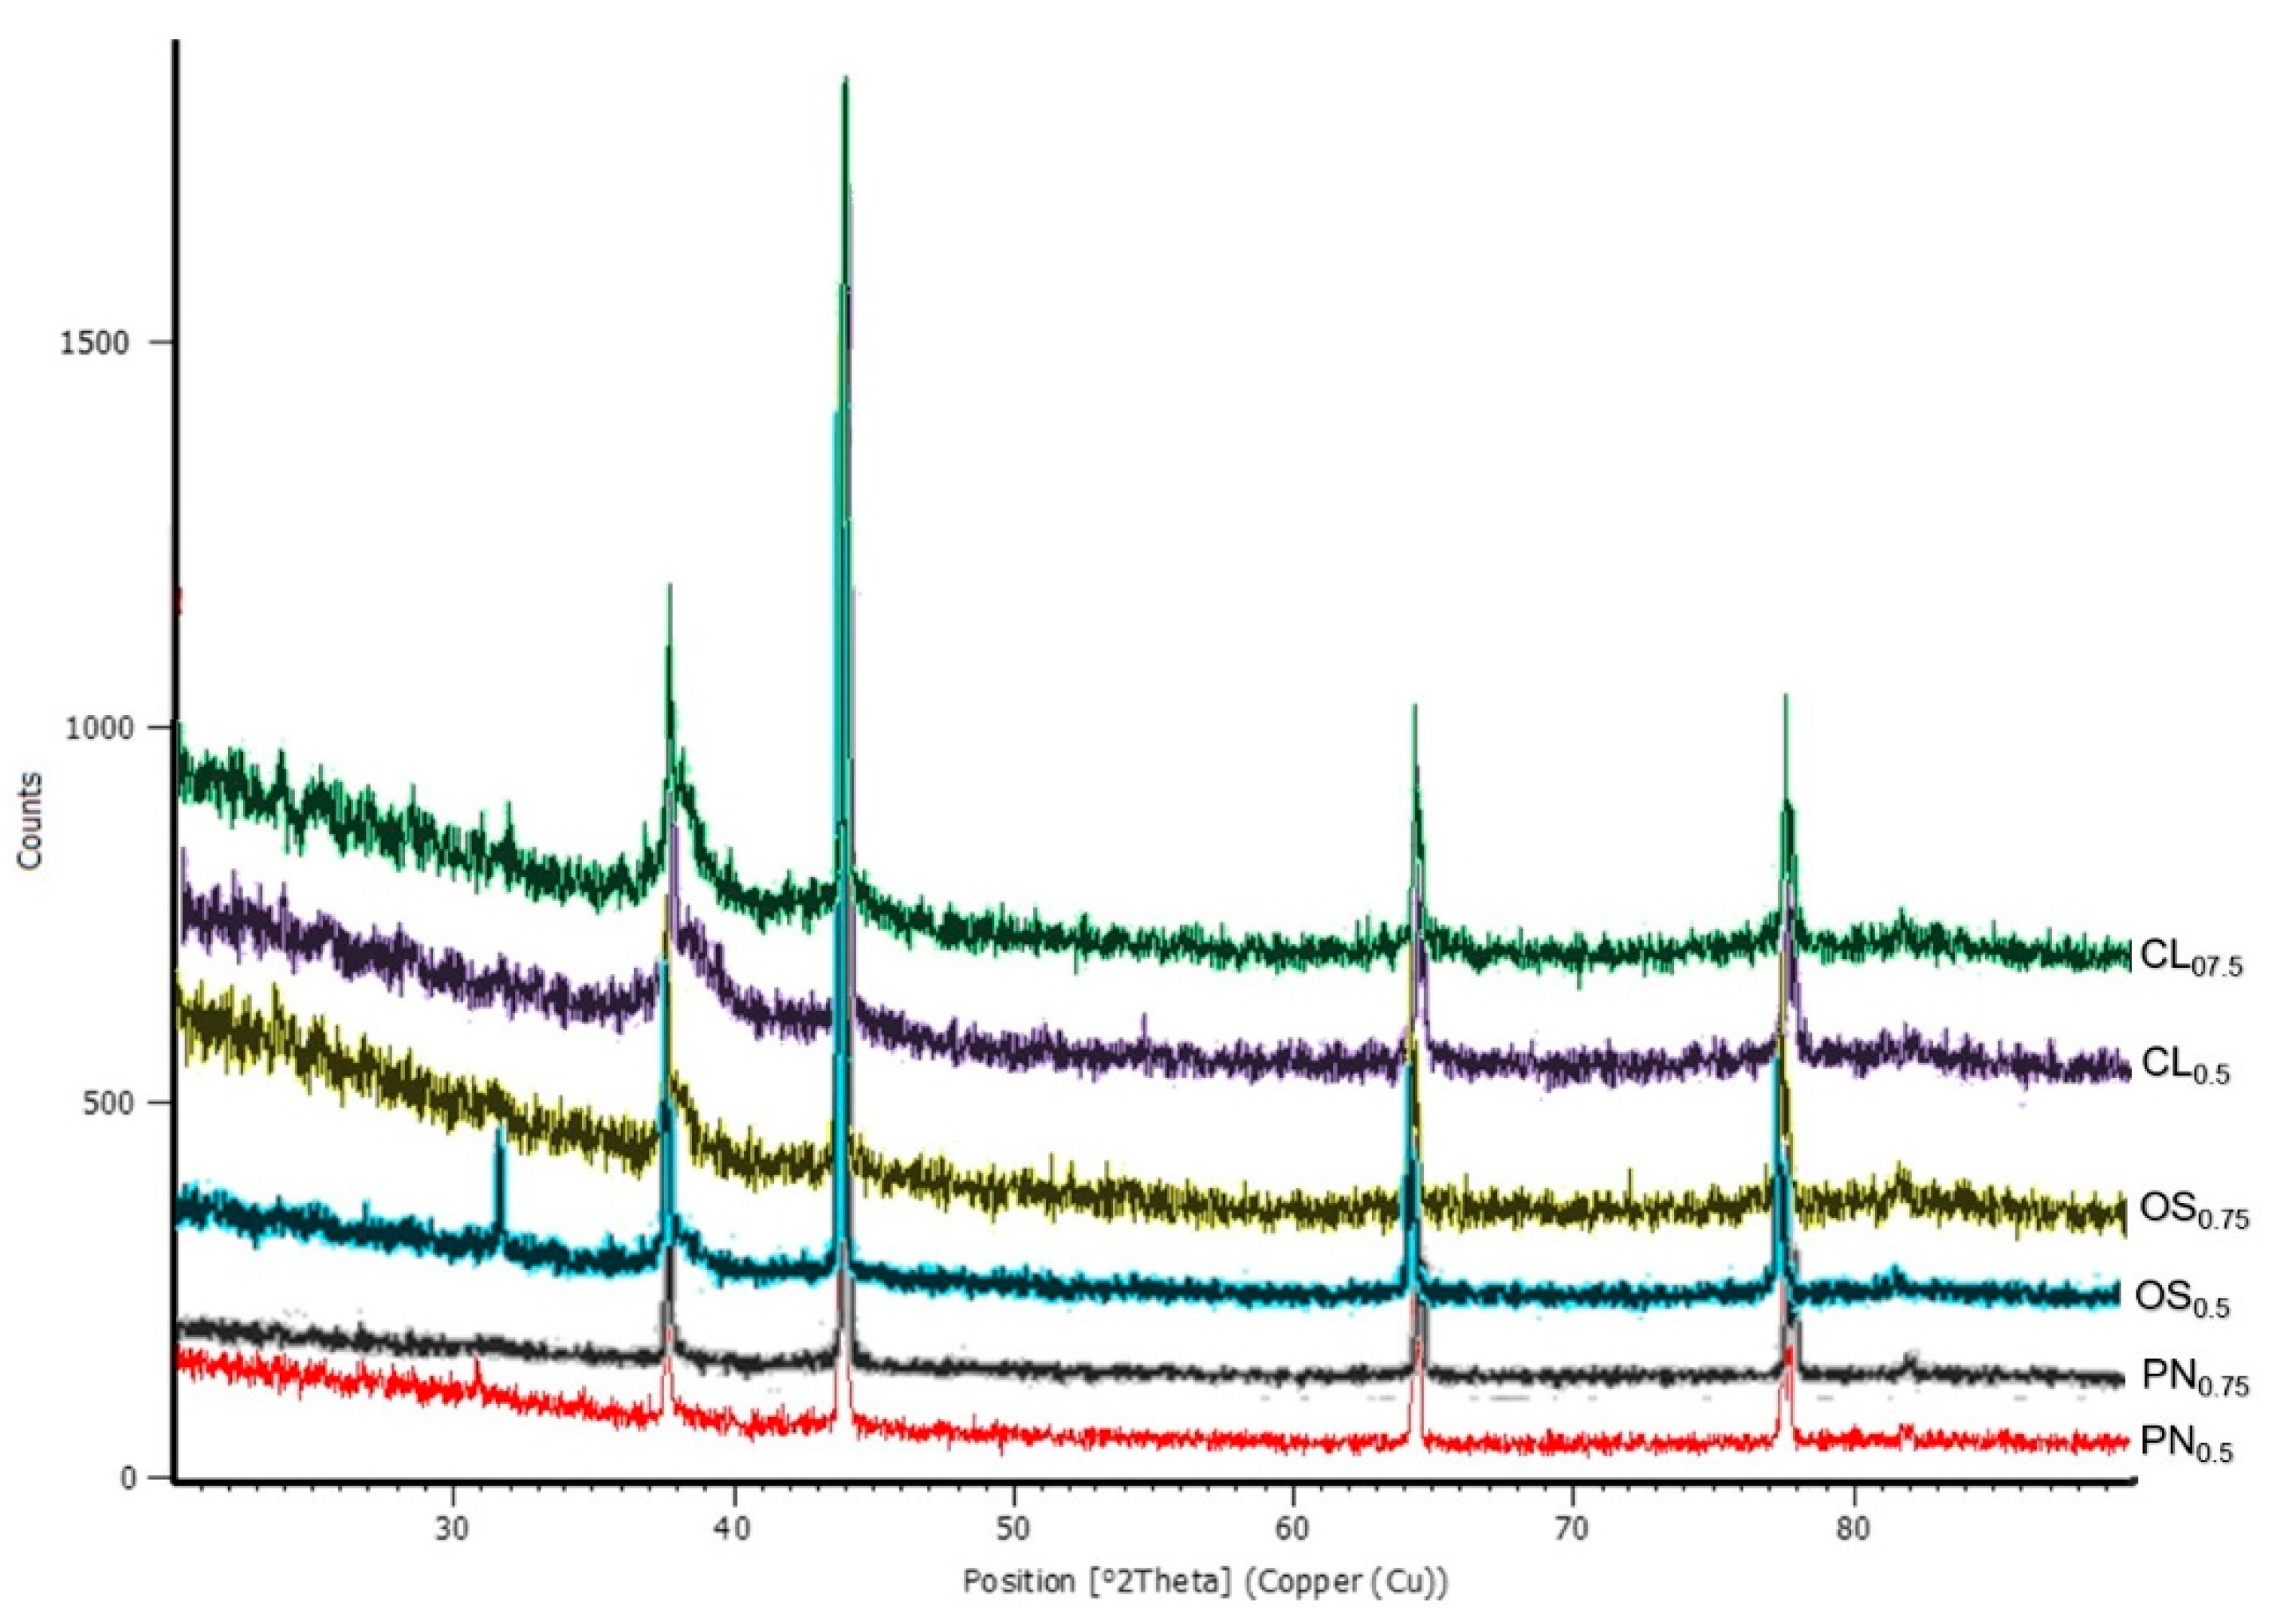
3.4. Characterization of AgNPs by X-ray Diffraction (X-RD)
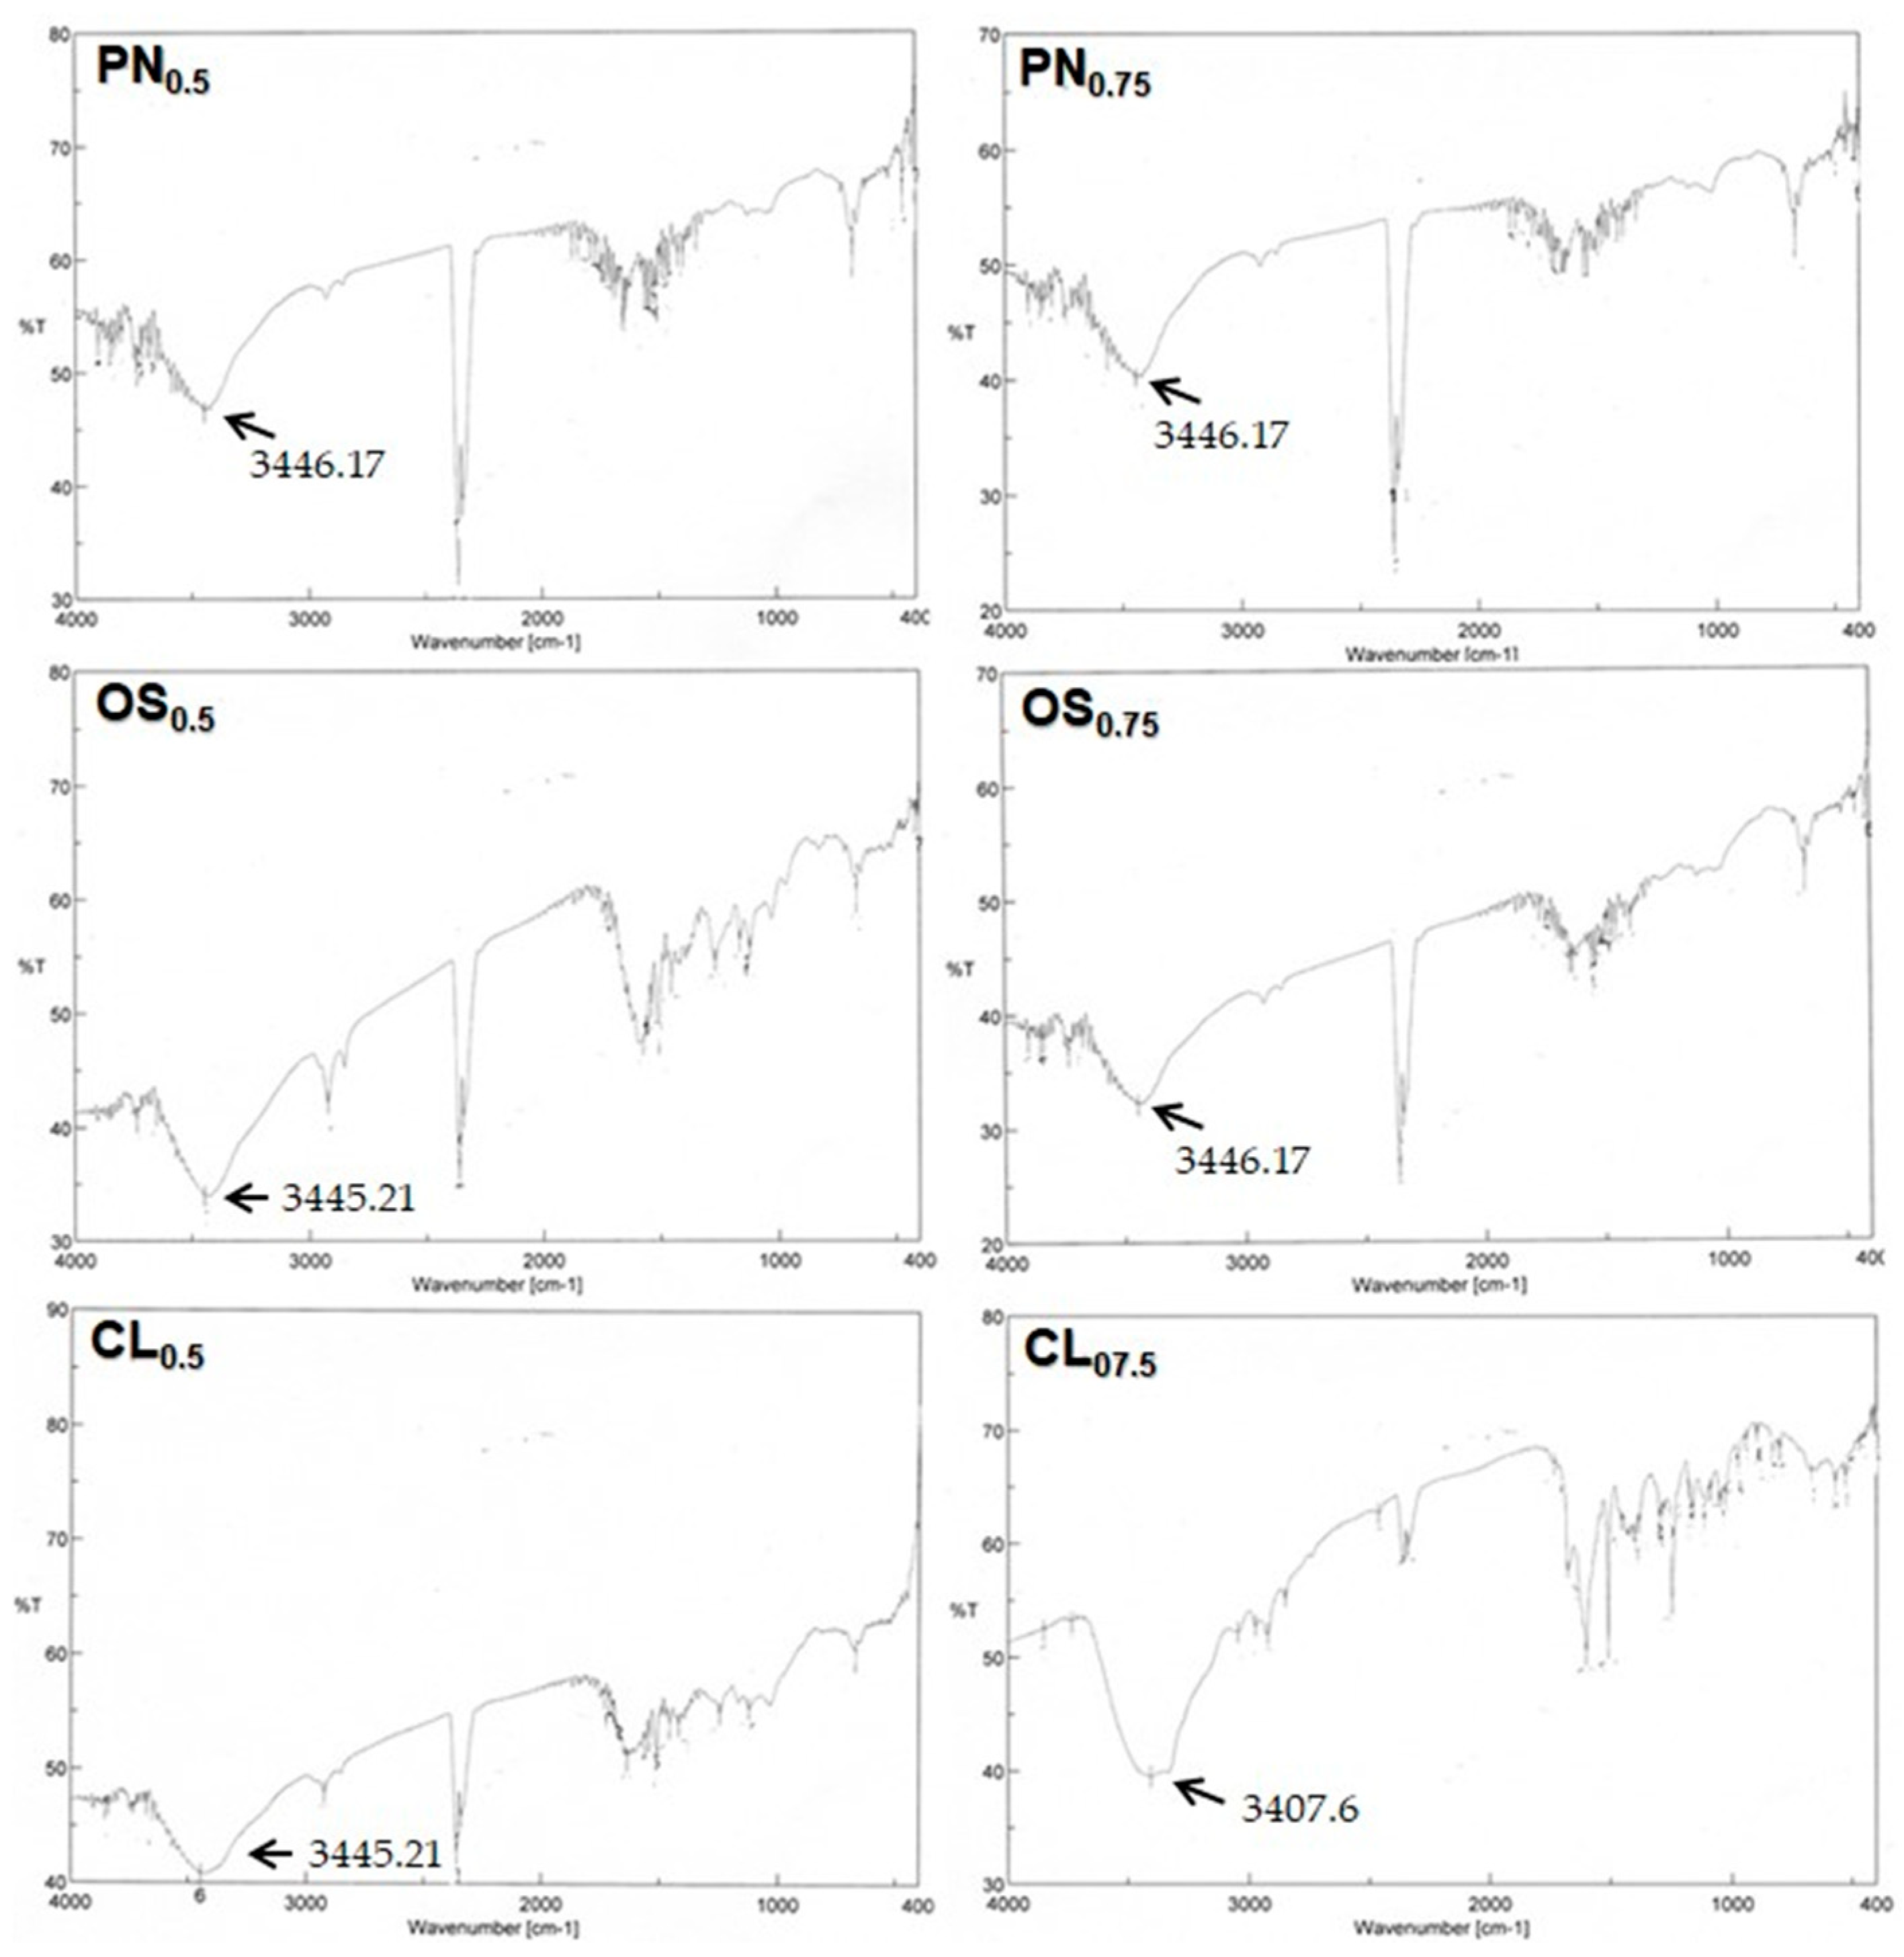
The X-RD analysis was carried out to confirm the presence of silver compounds in the synthesized nanoparticles (Figure 4). The reflections of the AgNPs (recorded at 2θ) that formed with PN, OS, and CL extracts are shown in Table 3.

3.5. FTIR

The FTIR spectra (Figure 5) were read at the wavenumbers of 4000–400 cm−1 with a 4 cm−1 resolution and processed in the Spectra Manager Version 2 program. FTIR spectra of AgNPs synthesized using PN, OS, and CL extracts showed distinct and wide peaks at the wavenumbers of 3446.17, 3445.21, and 3445.21 cm−1, respectively. These peaks indicate the presence of the O-H bond of hydroxyl groups, which may be derived from phenolic compounds in the extracts.

4. Discussions

The green synthesis of nanoparticles is deemed a success or a failure according to various factors, including types and genetic properties of organisms, substrate concentration, pH, light, temperature, buffer strength, biomass, mixing speed, and exposure time. These factors control the sizes and morphologies of the NPs [6,21,22,24,25]. Therefore, the concentrations of PN, OS, and CL extracts were optimized in this recent study. Five concentrations of PN, OS, and CL extracts (i.e., 0.125, 0.25, 0.5, 0.75, and 1%) were analyzed. Among the three extracts, PN produced the highest yield, which is very important for the scale-up process. For this reason, PN was the best reducing and capping agent in the synthesis of AgNPs. However, further evaluation is required to compare the characteristics of AgNPs generated from each extract at every tested concentration. Our previous study showed that among the three plant extracts, PN was the strongest antioxidant, followed by OS and then CL. This was indicated by their IC50 value on the DPPH scavenging method, i.e., 102, 133, and 363 µg/mL, respectively [14]. In the biosynthesis of metal nanoparticles using plant extract, metal ions are reduced and then the reduced metal atoms undergo nucleation [23]. The high reducing capacity of PN is presumably the cause the high yields of formed AgNPs in this study.
Biological activities, including antimicrobial effects, of AgNPs depend on various parameters, such as morphology and shape, size, pH, ionic strength, capping agent, and the surface charge of the particles [23,26]. Analysis using the particle size analyzer showed that particle size of the synthesized AgNPs ranged between 277 and 918 nm. Moreover, the dispersity of AgNPs was deduced from its poly-dispersity index (PDI). The International Organization for Standardization (ISO) established that PDI < 0.05 is more common in monodisperse samples, while PDI > 0.7 is common in a broad distribution of particle size (e.g., polydisperse) [27]. Table 2 shows that the synthesized AgNPs using PN0.5 and CL0.5 had a monodisperse system, while the others were polydisperse. The polydisperse system can be attributed to differences in the growth rate of individual particles during the nucleation step.
SEM depicted that the particle size of AgNPs synthesized using PN, OS, and CL extracts ranged between 100 and 400 nm. Overall, there were quite a few differences in particle sizes based on SEM results compared to the DLS results. DLS will tend to show a larger size than SEM analysis, because the principals involved for the analysis of both techniques are different. DLS showed results showing bigger particle sizes, and its hydrodynamic diameter therefore had a larger size than SEM, which was due to a scattering of electrons in sample irradiation [28]. Additionally, since DLS used a solution to analyze AgNPs, it gave AgNPs a chance to agglomerate and show bigger sizes than the actual size.
The presence of silver compounds in the synthesized nanoparticles was confirmed by the X-RD profiles. Comparisons between these diffractogram patterns and the diffractogram of the AgNPs from the previous study [23] clearly illustrate that silver nanoparticles are present in the yield of the green synthesis. A high crystallinity in the synthesized AgNPs can also be detected in Figure 4, as is evident from the presence of a sharp peak.
The FTIR spectra of the synthesized AgNPs indicated the presence of the O-H bond, which was presumably derived from phenolic compounds in the plant extracts. Phyllanthus niruri contains various phenolics compounds, such as flavonoids (rutin, quercetin, quercitrin, astragalin, catechin), tannins, and saponins [29]. Diverse phenolic compounds, such as rosmarinic acid, 3′-hydroxy-5,6,7,4′-tetramethoxyflavone, sinensetin, and eupatorin, have also been identified in Orthosiphon stamineus [30], while curcuminoids are the predominant phenolic compound in Curcuma longa. Even though the exact mechanism and components responsible for extract-mediated green synthesis of nanoparticles remain not elucidated, primary metabolites (i.e., proteins, amino acids, organic acid, and vitamins) and secondary metabolites (i.e., flavonoids, alkaloids, polyphenols, and terpenoids) have been proposed as having significant contributions in metal salt reduction and, thereby, acting as capping and stabilizing agents for synthesized nanoparticles [10].

5. Conclusions

An environmental-friendly and low-cost synthesis method of AgNPs using three Indonesian plant extracts commonly used as traditional medicines has been conducted. Types and concentrations of plant extracts affect the characteristics of the synthesized AgNPs. The findings of this study suggest that Phyllanthus niruri extract at a concentration of 0.5% is a prospective reducing and capping agent for the green synthesis of AgNPs. This extract can be considered for further scale-up process studies to provide AgNPs in a sufficient amount. Furthermore, formulation and bioactivity tests of these AgNPs-based dosage forms need to be performed as well.

Author Contributions

C.A. conceptualized the research, A.A., D.A., and A.F.F. performed the experiments, while K.K. and J.S. analyzed the data. K.K. wrote the manuscript; C.A. and J.S. contributed to the revision of the final manuscript. All authors have read and agreed to the published version of the manuscript.

Funding

This research was funded by the Ministry of Research and Technology/National Research and Innovation Agency of the Republic of Indonesia (grant number: 030/SP-Lit/LPPM-01/RistekBRIN/Multi/FF/III/2020).

Conflicts of Interest

The authors declare no conflict of interest. The funders had no role in the design of the study; in the collection, analyses, or interpretation of data; in the writing of the manuscript; or in the decision to publish the results.

References

  1. Gardner, S.E.; Hillis, S.L.; Heilmann, K.; Segre, J.A.; Grice, E.A. The neuropathic diabetic foot ulcer microbiome is associated with clinical factors. Diabetes 2013, 62, 923–930. [Google Scholar] [CrossRef] [PubMed] [Green Version]
  2. Murali, T.S.; Kavitha, S.; Spoorthi, J.; Bhat, D.V.; Prasad, A.S.B.; Upton, Z.; Ramachandra, L.; Acharya, R.V.; Satyamoorthy, K. Characteristics of microbial drug resistance and its correlates in chronic diabetic foot ulcer infections. J. Med. Microbiol. 2014, 63, 1377–1385. [Google Scholar] [CrossRef] [PubMed]
  3. Viswanathan, V.; Kesavan, R.; Kavitha, K.; Kumpatla, S. A pilot study on the effects of a polyherbal formulation cream on diabetic foot ulcers. Indian J. Med. Res. 2011, 134, 168. [Google Scholar] [PubMed]
  4. Moura, L.I.; Dias, A.M.; Carvalho, E.; de Sousa, H.C. Recent advances on the development of wound dressings for diabetic foot ulcer treatment—A review. Acta Biomater. 2013, 9, 7093–7114. [Google Scholar] [CrossRef] [PubMed] [Green Version]
  5. Bakker, K.; Apelqvist, J.; Schaper, N.C.; IWGDF. Practical guidelines on the management and prevention of the diabetic foot 2011. Diabetes Metab. Res. Rev. 2012, 28, 225–231. [Google Scholar]
  6. Iravani, S.; Korbekandi, H.; Mirmohammadi, S.V.; Zolfaghari, B. Synthesis of silver nanoparticles: Chemical, physical and biological methods. Res. Pharm. Sci. 2014, 9, 385. [Google Scholar]
  7. Balzarro, M.; Rubilotta, E.; Trabacchin, N.; Soldano, A.; Cerrato, C.; Migliorini, F.; Mancini, V.; Pastore, A.L.; Carbone, A.; Cormio, L. Early and late efficacy on wound healing of silver nanoparticle gel in males after circumcision. J. Clin. Med. 2020, 9, 1822. [Google Scholar] [CrossRef]
  8. Hajipour, M.J.; Fromm, K.M.; Ashkarran, A.A.; de Aberasturi, D.J.; de Larramendi, I.R.; Rojo, T.; Serpooshan, V.; Parak, W.J.; Mahmoudi, M. Antibacterial properties of nanoparticles. Trends Biotechnol. 2012, 30, 499–511. [Google Scholar] [CrossRef] [Green Version]
  9. Velusamy, P.; Kumar, G.V.; Jeyanthi, V.; Das, J.; Pachaiappan, R. Bio-inspired green nanoparticles: Synthesis, mechanism, and antibacterial application. Toxicol. Res. 2016, 32, 95–102. [Google Scholar] [CrossRef]
  10. Singh, P.; Kim, Y.-J.; Zhang, D.; Yang, D.-C. Biological synthesis of nanoparticles from plants and microorganisms. Trends Biotechnol. 2016, 34, 588–599. [Google Scholar] [CrossRef]
  11. Reda, M.; Ashames, A.; Edis, Z.; Bloukh, S.; Bhandare, R.; Abu Sara, H. Green synthesis of potent antimicrobial silver nanoparticles using different plant extracts and their mixtures. Processes 2019, 7, 510. [Google Scholar] [CrossRef] [Green Version]
  12. Duan, H.; Wang, D.; Li, Y. Green chemistry for nanoparticle synthesis. Chem. Soc. Rev. 2015, 44, 5778–5792. [Google Scholar] [CrossRef] [PubMed]
  13. Sukweenadhi, J.; Setiawan, F.; Yunita, O.; Kartini, K.; Avanti, C. Antioxidant activity screening of seven Indonesian herbal extract. Biodiversitas 2020, 21, 2062–2067. [Google Scholar] [CrossRef]
  14. Kartini, K.; Setiawan, F.; Sukweenadhi, J.; Yunita, O.; Avanti, C. Selection of potential Indonesian plant species for antioxidant. In IOP Conference Series: Earth and Environmental Science; IOP Publishing: Bristol, UK, 2020. [Google Scholar]
  15. Ranilla, L.G.; Apostolidis, E.; Shetty, K. Antimicrobial activity of an Amazon medicinal plant (Chancapiedra) (Phyllanthus niruri L.) against Helicobacter pylori and lactic acid bacteria. Phytother. Res. 2012, 26, 791–799. [Google Scholar] [PubMed]
  16. Ibrahim, D.; Hong, L.S.; Kuppan, N. Antimicrobial activity of crude methanolic extract from Phyllanthus niruri. Nat. Prod. Commun. 2013, 8, 493–496. [Google Scholar] [CrossRef] [Green Version]
  17. Alshawsh, M.A.; Abdulla, M.A.; Ismail, S.; Amin, Z.A.; Qader, S.W.; Hadi, H.A.; Harmal, N.S. Free radical scavenging, antimicrobial and immunomodulatory activities of Orthosiphon stamineus. Molecules 2012, 17, 5385–5395. [Google Scholar] [CrossRef]
  18. Malahubban, M.; Alimon, A.; Sazili, A.; Fakurazi, S.; Zakry, F. Phytochemical analysis of Andrographis paniculata and Orthosiphon stamineus leaf extracts for their antibacterial and antioxidant potential. Trop. Biomed. 2013, 30, 467–480. [Google Scholar]
  19. Gupta, A.; Mahajan, S.; Sharma, R. Evaluation of antimicrobial activity of Curcuma longa rhizome extract against Staphylococcus aureus. Biotechnol. Rep. 2015, 6, 51–55. [Google Scholar] [CrossRef] [Green Version]
  20. Niamsa, N.; Sittiwet, C. Antimicrobial activity of Curcuma longa aqueous extract. J. Pharmacol. Toxicol. 2009, 4, 173–177. [Google Scholar]
  21. Lestari, T.P.; Tahlib, F.A.; Sukweenadhi, J.; Kartini, K.; Avanti, C. Physical characteristic and antibacterial activity of silver nanoparticles from green synthesis using ethanol extracts of Phaleria macrocarpa (Scheff.) Boerl Leaves. Tradit. Med. J. 2019, 24, 16–21. [Google Scholar] [CrossRef]
  22. Dewi, K.T.A.; Kartini, K.; Sukweenadhi, J.; Avanti, C. Karakter fisik dan aktivitas antibakteri nanopartikel perak hasil green synthesis menggunakan ekstrak air daun sendok (Plantago major L.). Pharm. Sci. Res. 2019, 6, 69–81. [Google Scholar] [CrossRef]
  23. Keat, C.L.; Aziz, A.; Eid, A.M.; Elmarzugi, N.A. Biosynthesis of nanoparticles and silver nanoparticles. Bioresour. Bioprocess. 2015, 2, 47. [Google Scholar] [CrossRef] [Green Version]
  24. Geetha, A.R.; George, E.; Srinivasan, A.; Shaik, J. Optimization of green synthesis of silver nanoparticles from leaf extracts of Pimenta dioica (Allspice). Sci. World J. 2013, 2013. [Google Scholar] [CrossRef] [PubMed]
  25. Fatimah, I. Green synthesis of silver nanoparticles using extract of Parkia speciosa Hassk pods assisted by microwave irradiation. J. Adv. Res. 2016, 7, 961–969. [Google Scholar] [CrossRef] [Green Version]
  26. Ahmed, S.; Ahmad, M.; Swami, B.L.; Ikram, S. A review on plants extract mediated synthesis of silver nanoparticles for antimicrobial applications: A green expertise. J. Adv. Res. 2016, 7, 17–28. [Google Scholar] [CrossRef] [Green Version]
  27. Mudalige, T.; Qu, H.; Van Haute, D.; Ansar, S.M.; Paredes, A.; Ingle, T. Characterization of nanomaterials: Tools and challenges. In Nanomaterials for Food Applications; Elsevier: Amsterdam, The Netherlands, 2019; pp. 313–353. [Google Scholar]
  28. Eaton, P.; Quaresma, P.; Soares, C.; Neves, C.; De Almeida, M.; Pereira, E.; West, P. A direct comparison of experimental methods to measure dimensions of synthetic nanoparticles. Ultramicroscopy 2017, 182, 179–190. [Google Scholar] [CrossRef]
  29. Bagalkotkar, G.; Sagineedu, S.; Saad, M.; Stanslas, J. Phytochemicals from Phyllanthus niruri Linn. and their pharmacological properties: A review. J. Pharm. Pharmacol. 2006, 58, 1559–1570. [Google Scholar]
  30. Saidan, N.H.; Hamil, M.S.R.; Memon, A.H.; Abdelbari, M.M.; Hamdan, M.R.; Mohd, K.S.; Majid, A.M.S.A.; Ismail, Z. Selected metabolites profiling of Orthosiphon stamineus Benth leaves extracts combined with chemometrics analysis and correlation with biological activities. BMC Complement. Altern. Med. 2015, 15, 350. [Google Scholar] [CrossRef] [PubMed] [Green Version]
Figure 1. UV-Vis spectra of silver nanoparticles (AgNPs) prepared with Phyllanthus niruri (0.5%). (A) initial extract; (B) green synthesis products (AgNPs).
Processes 08 00998 g001
Figure 2. Particle size analysis of AgNPs using a particle size analyzer (PSA).
Processes 08 00998 g002
Figure 3. The scanning electron microscopic (SEM; 20,000×) profiles of AgNPs synthesized with PN, OS, and CL extracts.
Processes 08 00998 g003
Figure 4. X-ray diffraction profiles of AgNPs synthesized using PN, OS, and CL extracts.
Processes 08 00998 g004
Figure 5. FTIR spectra of AgNPs synthesized using PN, OS, and CL extracts.
Processes 08 00998 g005
Table 1. Yields of the green synthesis of AgNPs using Phyllanthus niruri (PN), Orthosiphon stamineus (OS), and Curcuma longa (CL) extracts.
ExtractsConcentrations (%w/v)Color of Solution *Silver Luster **Yields
%w/wmg
PN0.125Blackish brown---
0.25Blackish brown---
0.50Blackish brown+++15.7678.8
0.75Blackish brown+++6.8851.6
1.00Dark green---
PN0.125Reddish-brown---
0.25Reddish-brown---
0.50Reddish-brown+++1.276.35
0.75Reddish-brown+++0.644.78
1.00Reddish-brown---
CL 0.125Brownish-yellow---
0.25Brownish-yellow---
0.50Reddish-brown+++0.532.64
0.75Reddish-brown+++2.4612.3
1.00Blackish brown---
* Color of the solution in the AgNP synthesis process (24 h + NaOH). Phyllanthus niruri (PN); Orthosiphon stamineus (OS); Curcuma longa (CL). ** +++: high intensity of silver luster; -: no silver luster.
Table 2. Particle size and poly-dispersity index for each sample of AgNPs.
Plant ExtractsParticle Size (nm)Poly-Dispersity Index (PDI)
PN0.5715.00.0085
PN0.75522.01.2370
OS0.5729.00.1716
OS0.75277.90.2378
CL0.5318.00.0431
CL0.75918.00.6040
Table 3. Diffraction peaks of the AgNPs formed with PN, OS, and CL extracts, measured at the detector angle of 2θ (degrees).
PN0.5PN0.75OS0.5OS0.75CL0.5CL0.75AgNPs [23]
37.645437.627437.624837.642037.640637.649438.45
44.014644.002043.907343.838844.015143.885746.35
64.509164.489364.325964.317364.491064.522464.75
77.506777.721877.518677.521777.731377.744178.05

