Analysis and Prediction of Influencing Parameters on the Coal Classification Performance of a Novel Three Products Hydrocyclone Screen (TPHS) Based on Grey System Theory


Abstract
:1. Introduction
- (1)
- Comprehensively verify the separation characteristic including the size distribution and the partition curve;
- (2)
- systematically explore the closeness between the performance and the relevant factors (operational and structural); and
- (3)
- critically analyze and verify the prediction model of the performance evaluation based on the parameters of operation and structure.
2. Experimental
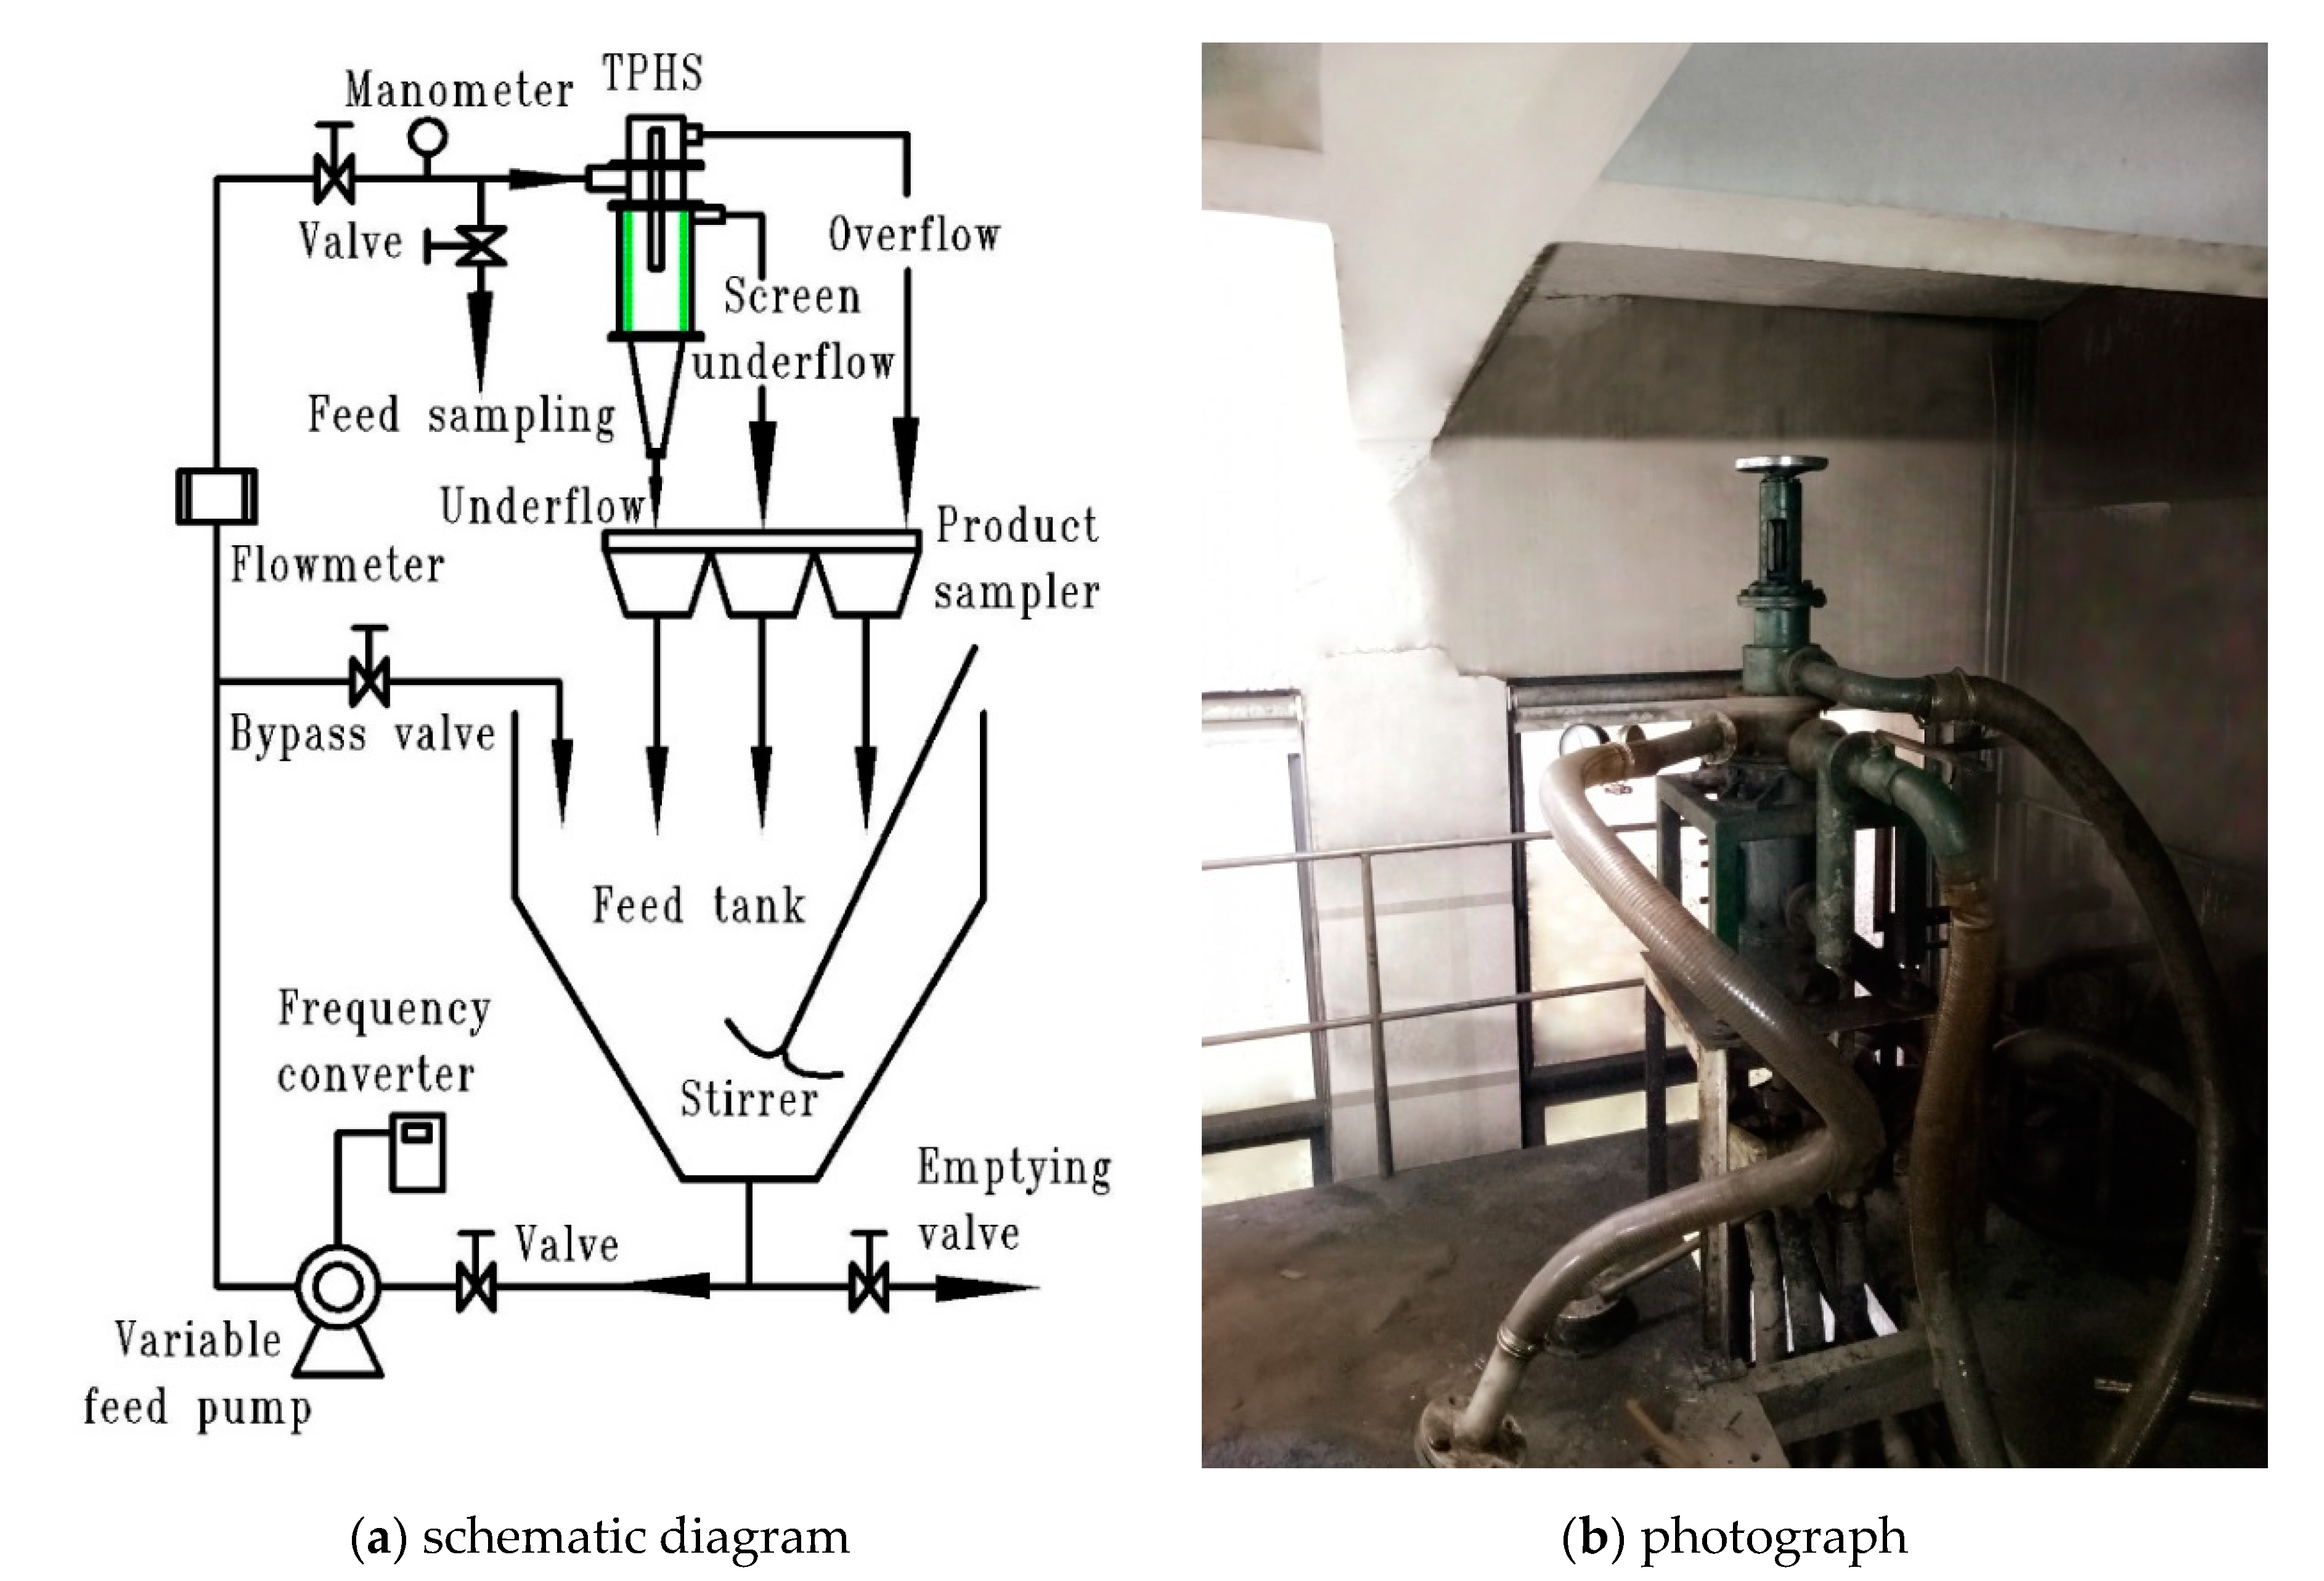
2.1. Experiment Rig
2.2. Experiment Procedure
- (1)
- The process cycle starts with a coal slurry being stirred ~10 min. Subsequently the homogeneous slurry was reported to TPHS by the variable speed pump with different experiment conditions (see Table 2 for the details). Based on the previous works [18,19], the operational parameters feed concentration and feed pressure were considered as 60–220 g/L and 0.04–0.06 MPa, respectively, while the structural parameters aperture size, spigot diameter and vortex finder diameter were 0.60–0.80 mm, 18.00–24.00 mm, and 30.00–60.00 mm, respectively. As mentioned, Grey System theory is less limited to the experimental conditions., thus different parameters were combined from large to small in the present research.
- (2)
- Then, every experiment was run about 30 min to get the steady particle separation. Afterwards, the inlet and outlet streams were sampled simultaneously, where three sets of each stream sample were taken with the intervals of 5 min, i.e., at 40, 45, and 50 min for the sample representativeness.
- (3)
- Finally, all the samples were processed by the weighing, filtration, and drying for the granularity test. It is noted that wet sieving [28] was considered for the analysis of particle size distribution to avoid the particle aggregation.
2.3. Data Analysis
3. Results and Discussions
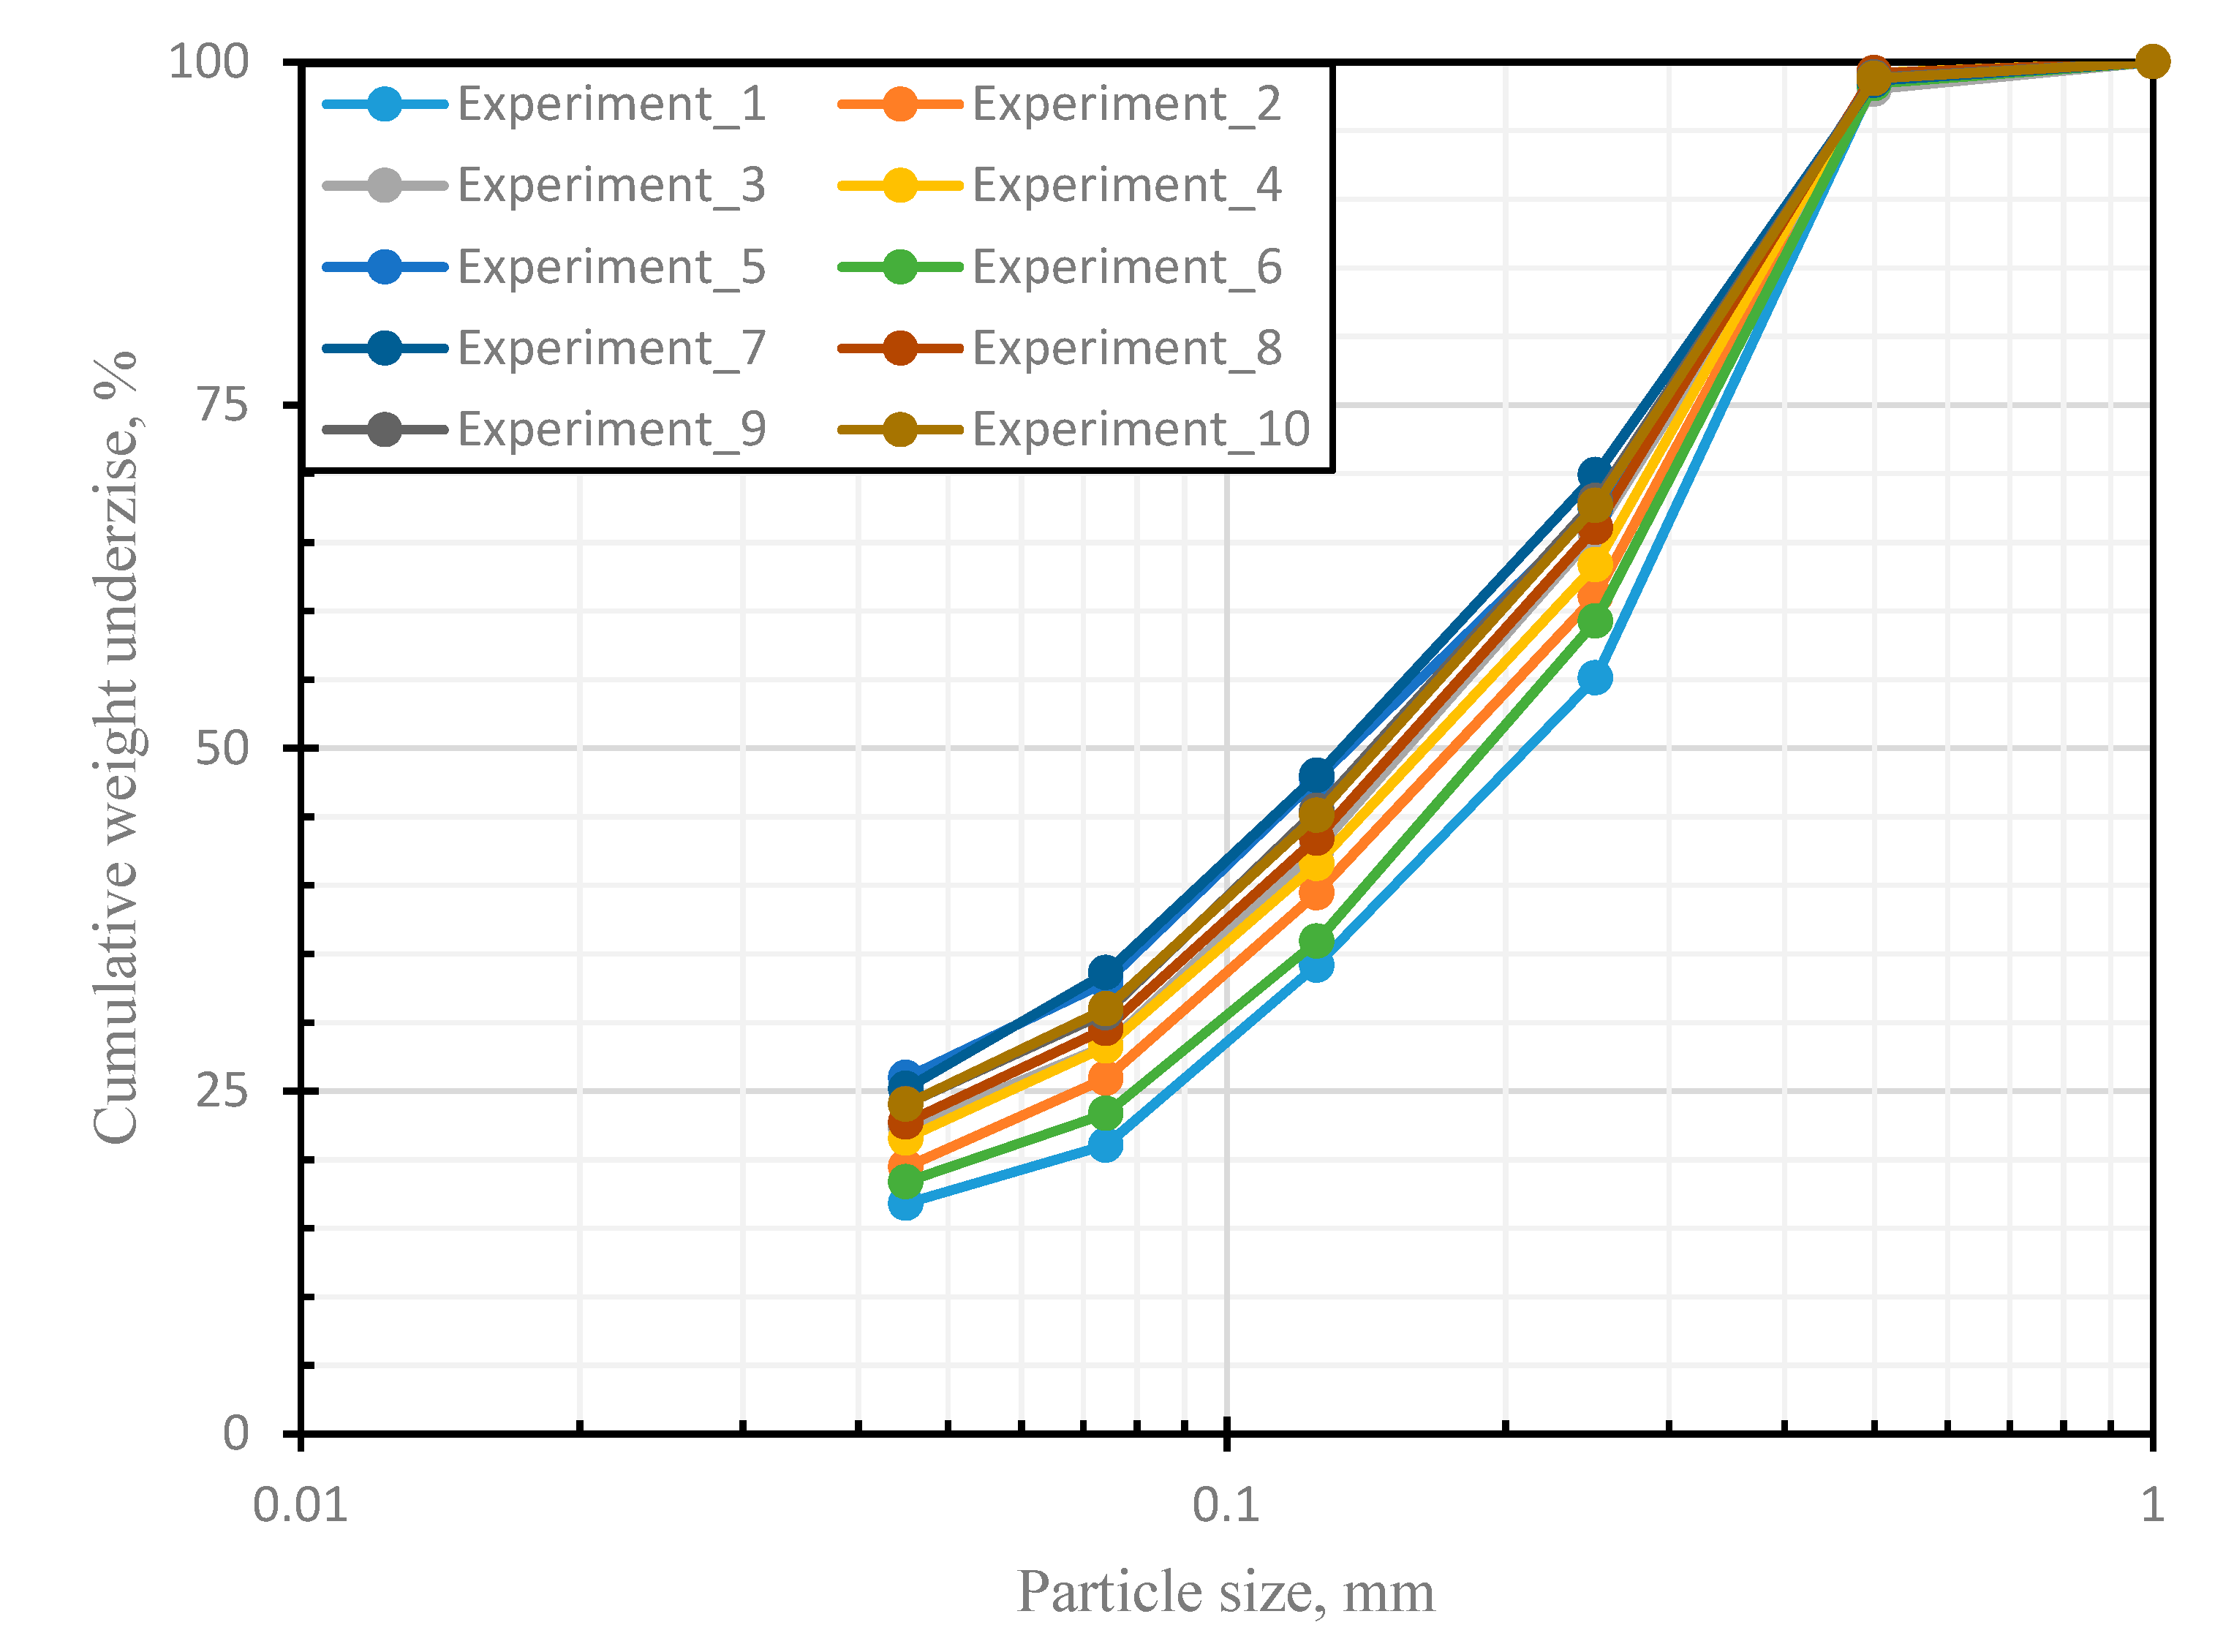
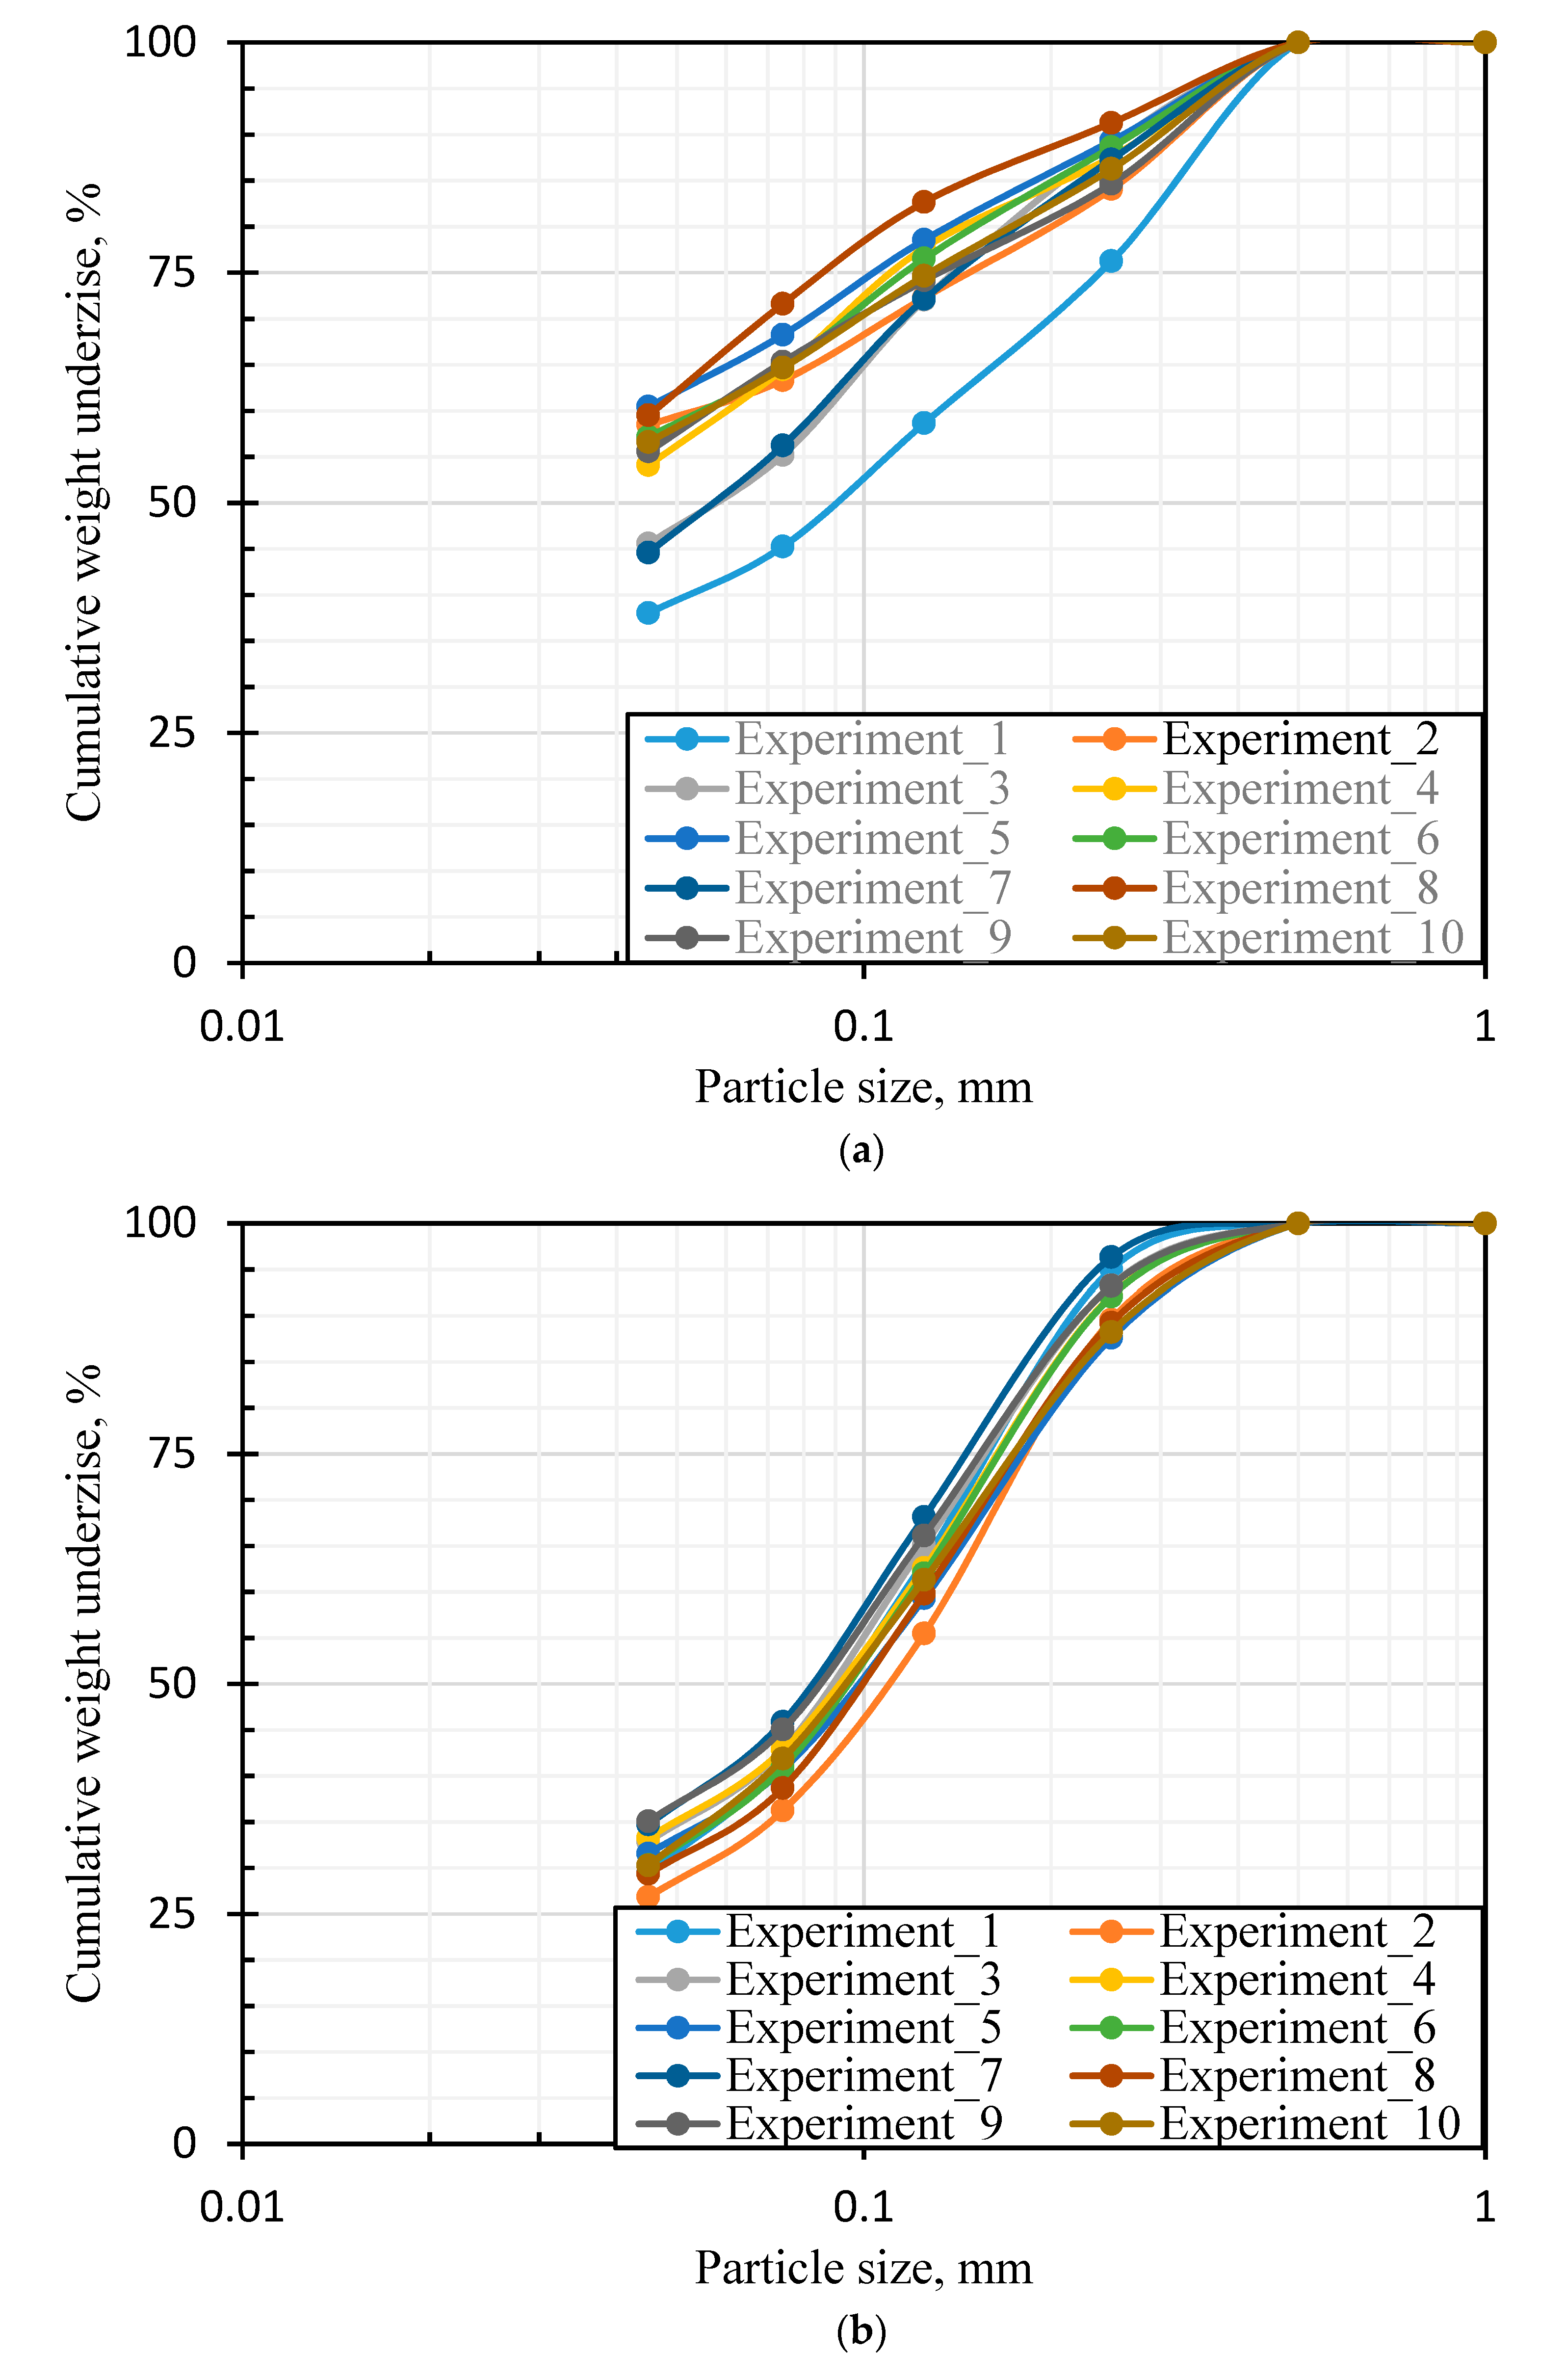
3.1. Separation Characteristic
3.2. Closeness Analysis
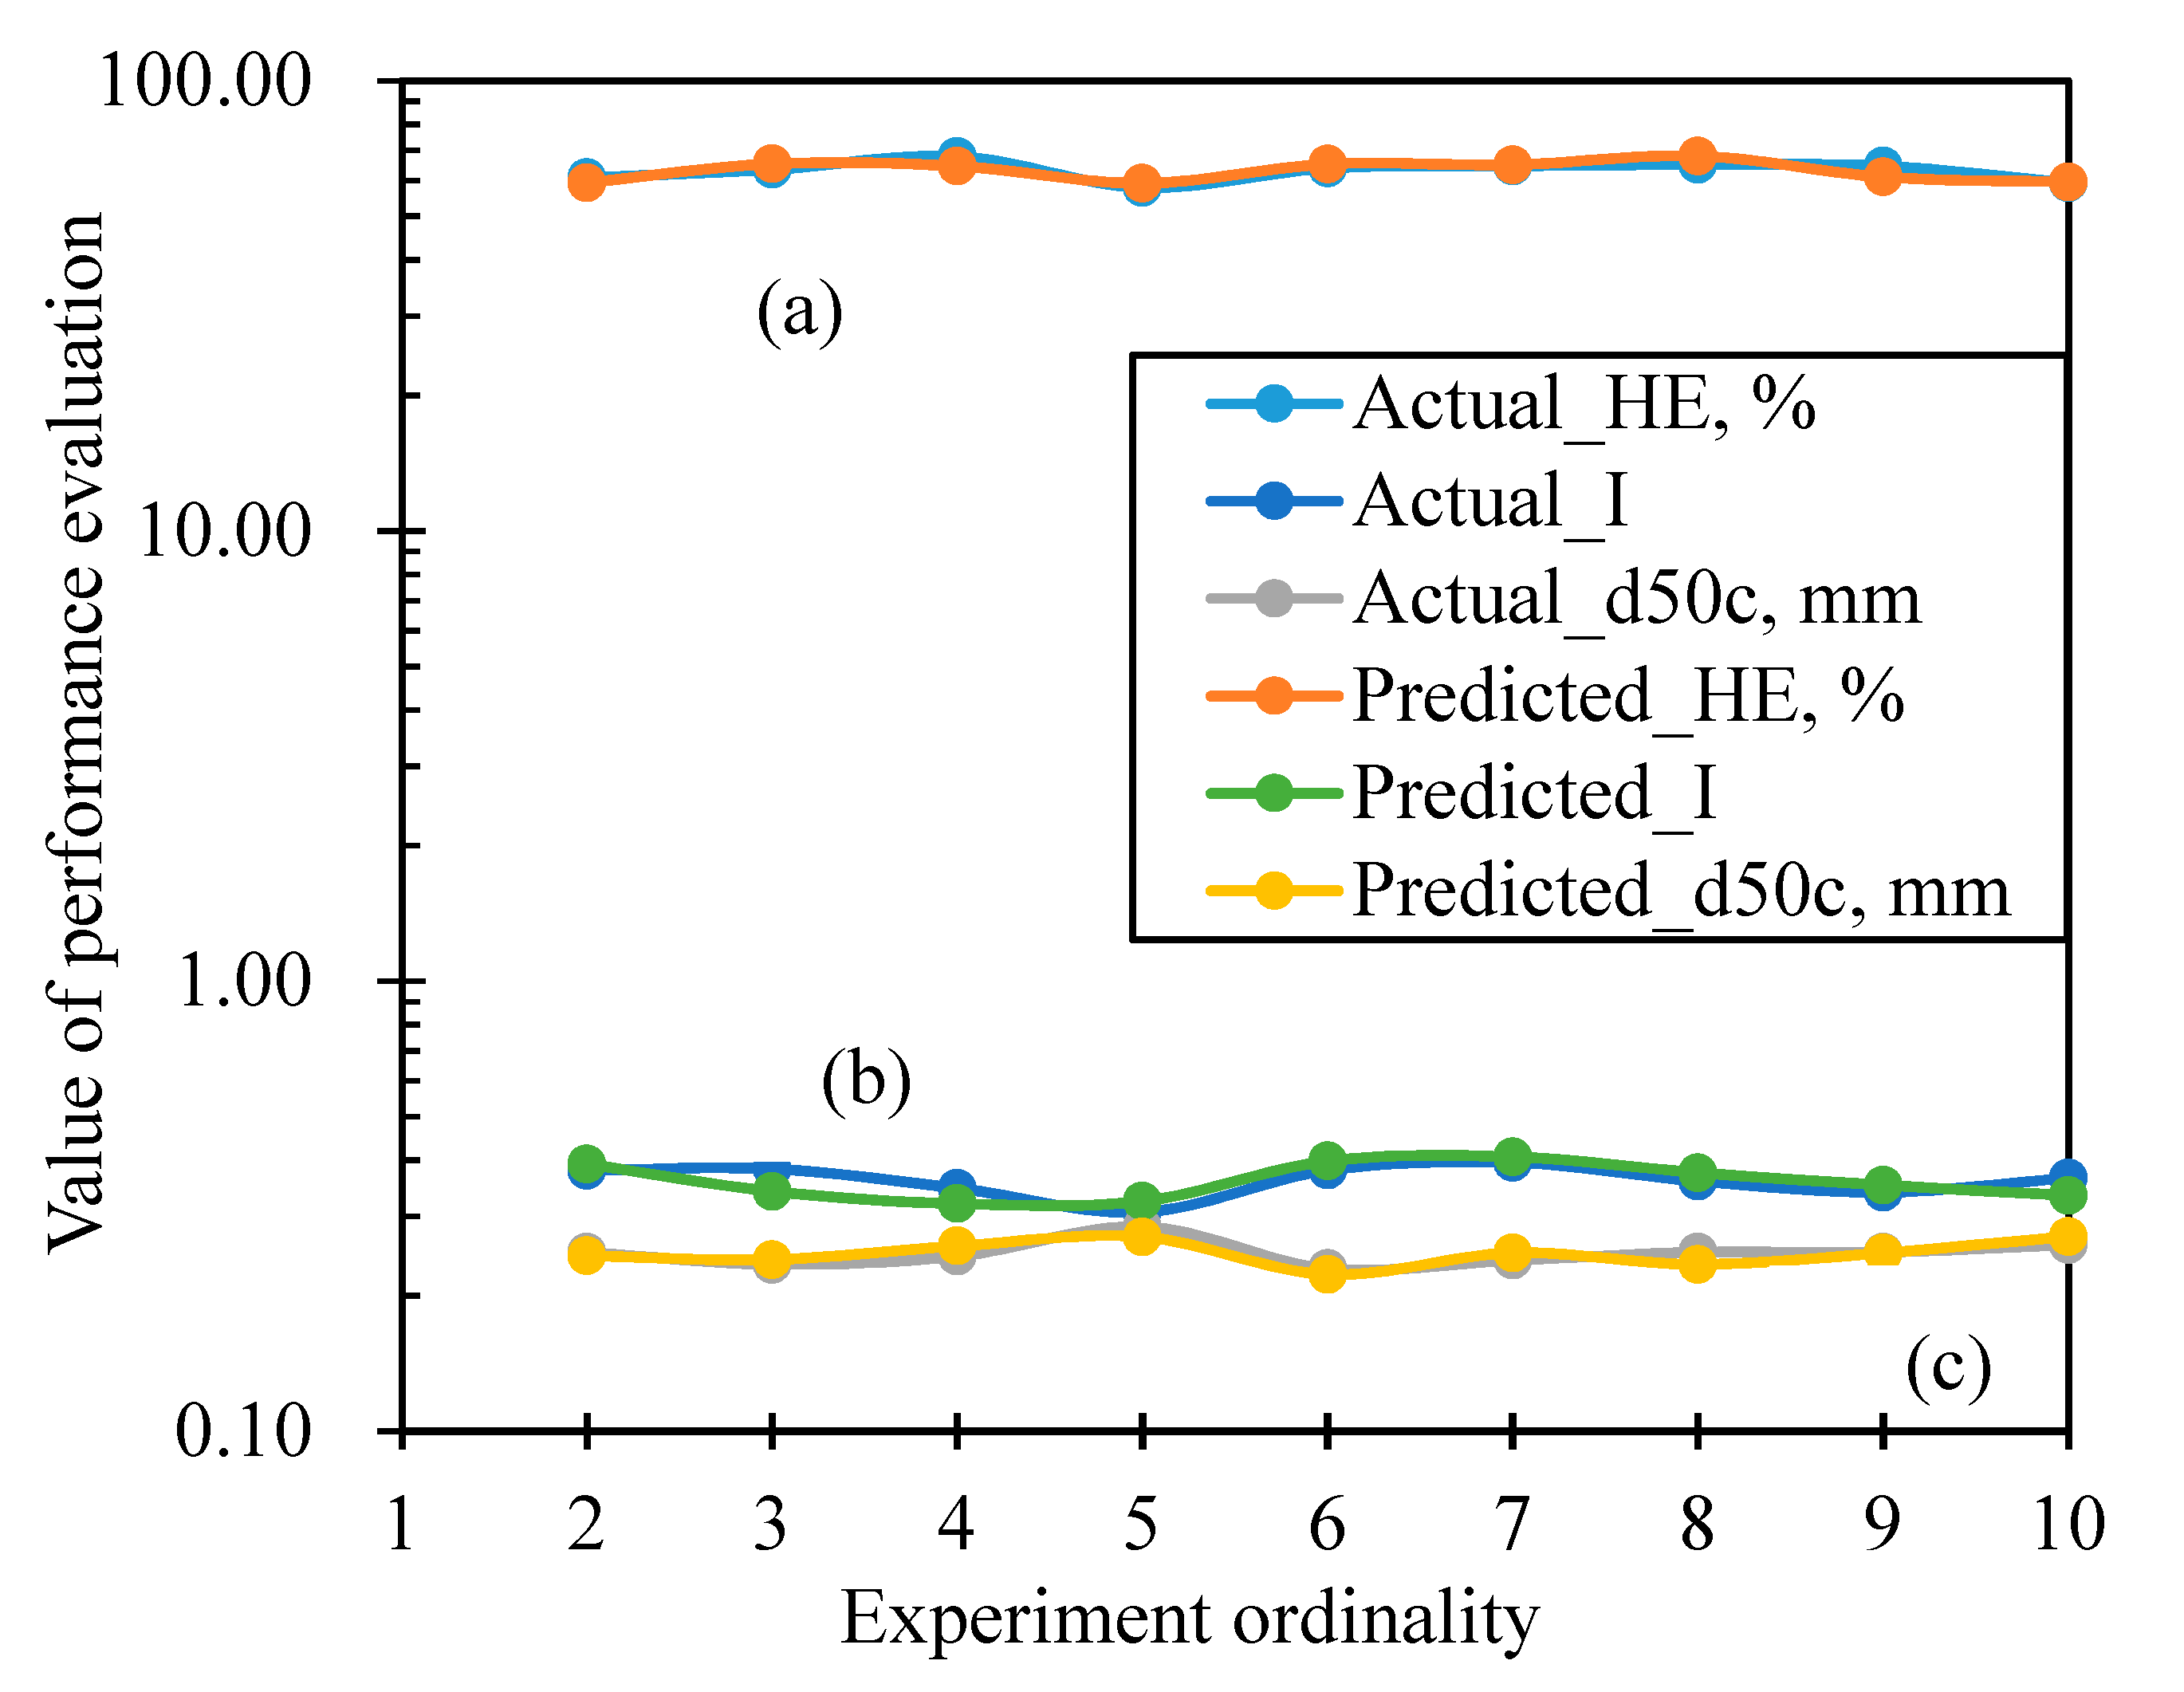
3.3. Prediction and Verification
4. Conclusions
- (1)
- In TPHS, the size distribution in overflow and screen underflow was finer than that in underflow, further, the absent “fish-hook” can be observed due to the presence of cylindrical screen. This is consistent with the previous literature.
- (2)
- The closeness analysis using the Grey System theory reveals that the operational and structural parameters greatly influenced the performance of TPHS with the relative grey incidence degree of ~0.5 to 1. Further, the order of grey incidence degree between different parameters and HE (or I or d50c) is that: The spigot diameter and aperture size present the highest incidence degree; the feed pressure and vortex finder diameter exhibit the middle incidence degree; and the feed concentration shows the lowest incidence degree.
- (3)
- The dynamic performance prediction model using the GM(1, N) can be generated according to the operation, structure, and previous performance value. As the accumulated generation operation (AGO) of the aperture size decreased or the AGO of the previous HE (I or d50c), feed concentration and feed pressure increased, the predicted HE (I or d50c) decreased. Besides, the predicted HE and d50c reduced but the predicted I improved with the increasing AGO of the spigot size, while the predicted HE declined yet the I and d50c increased with the growing AGO of the vortex finder diameter.
- (4)
- The performance evaluations estimated using the prediction model present excellent agreement with those gotten using the actual pilot-scale experiment, wherein the mean relative errors were 2.84%, 5.83%, and 3.57%, respectively.
Author Contributions
Funding
Conflicts of Interest
Appendix A

| Items | Experiment_ | ||||||||||
|---|---|---|---|---|---|---|---|---|---|---|---|
| 1 | 2 | 3 | 4 | 5 | 6 | 7 | 8 | 9 | 10 | ||
| HE | 1.000 | 0.995 | 1.039 | 1.110 | 0.947 | 1.046 | 1.057 | 1.065 | 1.057 | 0.864 | |
| Feed concentration | 1.000 | 1.741 | 2.332 | 3.068 | 3.627 | 1.099 | 1.726 | 2.422 | 2.987 | 3.620 | |
| Feed pressure | 1.000 | 1.250 | 1.500 | 1.000 | 1.250 | 1.500 | 1.000 | 1.250 | 1.500 | 1.000 | |
| Aperture size | 1.000 | 1.200 | 1.400 | 1.000 | 1.200 | 1.400 | 1.000 | 1.200 | 1.400 | 1.000 | |
| Diameter of spigot | 1.000 | 1.333 | 1.000 | 1.333 | 1.000 | 1.333 | 1.000 | 1.333 | 1.000 | 1.333 | |
| Diameter of vortex finder | 1.000 | 1.333 | 1.667 | 2.000 | 1.000 | 1.333 | 1.667 | 2.000 | 1.000 | 1.333 | |
| Experiment_ | |||||||||||
|---|---|---|---|---|---|---|---|---|---|---|---|
| 1 | 2 | 3 | 4 | 5 | 6 | 7 | 8 | 9 | 10 | ||
| Feed concentration | 0.000 | 0.746 | 1.294 | 1.957 | 2.680 | 0.054 | 0.669 | 1.357 | 1.930 | 2.755 | |
| Feed pressure | 0.000 | 0.255 | 0.461 | 0.110 | 0.303 | 0.454 | 0.057 | 0.185 | 0.443 | 0.136 | |
| Aperture size | 0.000 | 0.205 | 0.361 | 0.110 | 0.253 | 0.354 | 0.057 | 0.135 | 0.343 | 0.136 | |
| Diameter of spigot | 0.000 | 0.338 | 0.039 | 0.223 | 0.053 | 0.288 | 0.057 | 0.268 | 0.057 | 0.469 | |
| Diameter of vortex finder | 0.000 | 0.338 | 0.628 | 0.890 | 0.053 | 0.288 | 0.609 | 0.935 | 0.057 | 0.469 | |
| Experiment_ | Average | |||||||||||
|---|---|---|---|---|---|---|---|---|---|---|---|---|
| 1 | 2 | 3 | 4 | 5 | 6 | 7 | 8 | 9 | 10 | |||
| Feed concentration | 1.000 | 0.649 | 0.516 | 0.413 | 0.339 | 0.962 | 0.673 | 0.504 | 0.417 | 0.333 | 0.581 | |
| Feed pressure | 1.000 | 0.844 | 0.749 | 0.926 | 0.820 | 0.752 | 0.960 | 0.882 | 0.757 | 0.910 | 0.860 | |
| Aperture size | 1.000 | 0.870 | 0.792 | 0.926 | 0.845 | 0.795 | 0.960 | 0.911 | 0.800 | 0.910 | 0.881 | |
| Diameter of spigot | 1.000 | 0.803 | 0.973 | 0.861 | 0.963 | 0.827 | 0.960 | 0.837 | 0.960 | 0.746 | 0.893 | |
| Diameter of vortex finder | 1.000 | 0.803 | 0.687 | 0.608 | 0.963 | 0.827 | 0.693 | 0.596 | 0.960 | 0.746 | 0.788 | |
Appendix B
| Items | Experiment_ | ||||||||||
|---|---|---|---|---|---|---|---|---|---|---|---|
| 1 | 2 | 3 | 4 | 5 | 6 | 7 | 8 | 9 | 10 | ||
| HE | 1.000 | 1.995 | 3.034 | 4.144 | 5.091 | 6.136 | 7.194 | 8.259 | 9.316 | 10.285 | |
| d50c | 1.000 | 2.087 | 3.109 | 4.174 | 5.413 | 6.413 | 7.457 | 8.543 | 9.630 | 10.761 | |
| I | 1.000 | 2.028 | 3.065 | 4.003 | 4.834 | 5.863 | 6.935 | 7.909 | 8.829 | 9.817 | |
| Feed concentration | 1.000 | 2.741 | 5.074 | 8.142 | 11.769 | 12.868 | 14.594 | 17.016 | 20.003 | 23.622 | |
| Feed pressure | 1.000 | 2.250 | 3.750 | 4.750 | 6.000 | 7.500 | 8.500 | 9.750 | 11.250 | 12.250 | |
| Aperture size | 1.000 | 2.200 | 3.600 | 4.600 | 5.800 | 7.200 | 8.200 | 9.400 | 10.800 | 11.800 | |
| Diameter of spigot | 1.000 | 2.333 | 3.333 | 4.667 | 5.667 | 7.000 | 8.000 | 9.333 | 10.333 | 11.667 | |
| Diameter of vortex finder | 1.000 | 2.333 | 4.000 | 6.000 | 7.000 | 8.333 | 10.000 | 12.000 | 13.000 | 14.333 | |
| Items | Experiment_ | ||||||||||
|---|---|---|---|---|---|---|---|---|---|---|---|
| 1 | 2 | 3 | 4 | 5 | 6 | 7 | 8 | 9 | 10 | ||
| HE | 1.498 | 2.514 | 3.589 | 4.617 | 5.613 | 6.665 | 7.726 | 8.787 | 9.800 | 1.498 | |
| d50c | 1.543 | 2.598 | 3.641 | 4.793 | 5.913 | 6.935 | 8.000 | 9.087 | 10.196 | 1.543 | |
| I | 1.514 | 2.546 | 3.534 | 4.419 | 5.349 | 6.399 | 7.422 | 8.369 | 9.323 | 1.514 | |
Appendix C
References
- Wasilewski, M. Analysis of the effects of temperature and the share of solid and gas phases on the process of separation in a cyclone suspension preheater. Sep. Purif. Technol. 2016, 168, 114–123. [Google Scholar] [CrossRef]
- Li, X.; Xu, H.; Liu, J.; Zhang, J.; Li, J.; Gui, Z. Cyclonic state micro-bubble flotation column in oil-in-water emulsion separation. Sep. Purif. Technol. 2016, 165, 101–106. [Google Scholar] [CrossRef]
- Chen, L.; You, Z.; Xie, H.; Zhang, H.; Li, Y.; Wei, Z. Fluidized hydrocyclone for continuous centrifugal concentration. Sep. Purif. Technol. 2017, 52, 1283–1288. [Google Scholar] [CrossRef]
- Bradley, D. The Hydrocyclone: International Series of Monographs in Chemical Engineering; Elsevier: Amsterdam, The Netherlands, 2013; Volume 4. [Google Scholar]
- Wang, G.; Liu, Q.; Wang, C.; Dong, L.; Processes, L.S.J. Study of blockage diagnosis for hydrocyclone using vibration-based technique based on wavelet denoising and discrete-time fourier transform method. Processes 2020, 8, 440. [Google Scholar] [CrossRef] [Green Version]
- Chu, L.-Y.; Yu, W.; Wang, G.-J.; Zhou, X.-T.; Chen, W.-M.; Dai, G.-Q. Enhancement of hydrocyclone separation performance by eliminating the air core. Chem. Eng. Process. Process Intensif. 2004, 43, 1441–1448. [Google Scholar] [CrossRef]
- Dueck, J.; Farghaly, M.; Neesse, T. The theoretical partition curve of the hydrocyclone. Miner. Eng. 2014, 62, 25–30. [Google Scholar] [CrossRef]
- Santana, R.C.; Farnese, A.C.; Fortes, M.C.; Ataíde, C.H.; Barrozo, M.A. Influence of particle size and reagent dosage on the performance of apatite flotation. Sep. Purif. Technol. 2008, 64, 8–15. [Google Scholar] [CrossRef]
- Vieira, L.G.M.; Barrozo, M.A.S. Effect of vortex finder diameter on the performance of a novel hydrocyclone separator. Miner. Eng. 2014, 57, 50–56. [Google Scholar] [CrossRef]
- Vieira, L.G.; Silva, D.O.; Barrozo, M.A. Effect of inlet diameter on the performance of a filtering hydrocyclone separator. Chem. Eng. Technol. 2016, 39, 1406–1412. [Google Scholar] [CrossRef]
- Silva, N.K.G.; Silva, D.O.; Vieira, L.G.M.; Barrozo, M.A.S. Effects of underflow diameter and vortex finder length on the performance of a newly designed filtering hydrocyclone. Powder Technol. 2015, 286, 305–310. [Google Scholar] [CrossRef]
- Obeng, D.; Morrell, S.; Napier-Munn, T. Application of central composite rotatable design to modelling the effect of some operating variables on the performance of the three-product cyclone. Int. J. Miner. Process. 2005, 76, 181–192. [Google Scholar] [CrossRef]
- Nenu, R.K.T.; Yoshida, H. Comparison of separation performance between single and two inlets hydrocyclones. Adv. Powder Technol. 2009, 20, 195–202. [Google Scholar] [CrossRef]
- Hwang, K.-J.; Hwang, Y.-W.; Yoshida, H. Design of novel hydrocyclone for improving fine particle separation using computational fluid dynamics. Chem. Eng. Sci. 2013, 85, 62–68. [Google Scholar] [CrossRef]
- Chu, L.Y.; Chen, W.M.; Lee, X.Z. Effect of structural modification on hydrocyclone performance. Sep. Purif. Technol. 2000, 21, 71–86. [Google Scholar] [CrossRef]
- Delgadillo, J.A.; Rajamani, R.K. Exploration of hydrocyclone designs using computational fluid dynamics. Int. J. Miner. Process. 2007, 84, 252–261. [Google Scholar] [CrossRef]
- Silva, D.; Facanha, J.; Vieira, L.; Barrozo, M.A. Experimental Study of the Influence of Vortex Finder Geometry on Hydrocyclones Performance. Mater. Sci. Forum 2012, 727–728, 1848–1853. [Google Scholar] [CrossRef]
- Wang, C.; Chen, J.; Shen, L.; Hoque, M.M.; Ge, L.; Evans, G.M. Inclusion of screening to remove fish-hook effect in the three products hydro-cyclone screen (TPHS). Miner. Eng. 2018, 122, 156–164. [Google Scholar] [CrossRef]
- Jianzhong, C.; Lijuan, S.; Chuanzhen, W. Desliming performance of the three-product cyclone classification screen. J. China Univ. Min. Technol. 2016, 45, 807–813. [Google Scholar]
- Wang, C.; Chen, J.; Shen, L.; Ge, L. Study of flow behaviour in a three products hydrocyclone screen: Numerical simulation and experimental validation. Physicochem. Probl. Miner. Process. 2019, 55, 879–895. [Google Scholar] [CrossRef]
- Wills, B.A.; Napier-Munn, T. Wills’ Mineral Processing Technology: An Introduction to the Practical Aspects of Ore Treatment and Mineral Recovery; Butterworth-Heinemann: Oxford, UK, 2015. [Google Scholar]
- Julong, D. Control problems of grey systems. Sys. Contr. Lett. 1982, 1, 288–294. [Google Scholar] [CrossRef]
- Liu, S.; Forrest, J.Y.L. Grey Systems: Theory and Applications; Springer: Berlin/Heidelberg, Germany, 2010. [Google Scholar]
- Julong, D. Introduction to grey system theory. J. Grey Syst. 1989, 1, 1–24. [Google Scholar]
- Jiang, P.; Wang, W.; Hu, Y.-C.; Chiu, Y.-J.; Tsao, S.-J. Pattern classification using tolerance rough sets based on non-additive grey relational analysis and DEMATEL. Grey Syst. Theory Appl. 2020, 10, 1108–1125. [Google Scholar] [CrossRef]
- Rawat, M.; Lad, B.K.; Sharma, A. Simulation-based joint optimization of fleet system modularity and level of repair decisions considering different failure rates of components. Grey Syst. Theory Appl. 2020, 10, 377–390. [Google Scholar] [CrossRef]
- Wei, S.; Lijuan, S.; Jianzhong, C.; Shangjie, S. Application of grey correlation to key factor analysis for separation effects of dense-medium cyclones. Min. Process. Equipmen 2013, 41, 6. [Google Scholar]
- China, S.A.O.T.P.S.R.O. GB/T477-2008 Method for Size Analysis of Coal; Standards Press of China: Beijing, China, 2009. [Google Scholar]
- Peng, F.; Chang, D. Solving mass balance problems in coal processing using the constrained/weighted least-squares method. Fuel Energy Abstr. 1996, 17, 384–385. [Google Scholar] [CrossRef]
- Kelsall, D. A further study of the hydraulic cyclone. Chem. Eng. Sci. 1953, 2, 254–272. [Google Scholar] [CrossRef]
- Frachon, M.; Cilliers, J. A general model for hydrocyclone partition curves. Chem. Eng. J. 1999, 73, 53–59. [Google Scholar] [CrossRef]
- Barsky, E.; Barsky, M. Relationship between fractional separation curves and quantitative optimization criteria in the separation of pourable materials. Phys. Sep. Sci. Eng. 2004, 13, 41–51. [Google Scholar] [CrossRef] [Green Version]
- Ranđić, D. Proposition of new indices and parameters for grain size classification efficiency estimation. J. Min. Metall. A Min. 2008, 44, 17–23. [Google Scholar]
- Honaker, R.; Boaten, F.; Luttrell, G. Ultrafine coal classification using 150mm gMax cyclone circuits. Miner. Eng. 2007, 20, 1218–1226. [Google Scholar] [CrossRef]


| Items | Value |
|---|---|
| Diameter of hydrocyclone | 150 mm |
| Aperture size of cylindrical screen | 0.5 mm, 0.6 mm and 0.7 mm |
| Length of inlet column | 130 mm |
| Length of cylindrical envelope | 370 mm |
| Length of vortex finder | 300–400 mm |
| Angle of cone | 20° |
| Size of inlet | 58 mm × 16 mm |
| Diameter of screen underflow outlet | 56 mm |
| Diameter of vortex finder | 30 mm, 40 mm, 50 mm, 60 mm |
| Diameter of spigot | 18 mm, 24 mm |
| Experiment Number | 1 | 2 | 3 | 4 | 5 | 6 | 7 | 8 | 9 | 10 |
|---|---|---|---|---|---|---|---|---|---|---|
| Feed concentration (g/L) | 60.00 | 100.00 | 140.00 | 180.00 | 220.00 | 60.00 | 100.00 | 140.00 | 180.00 | 220.00 |
| Feed pressure (MPa) | 0.04 | 0.05 | 0.06 | 0.04 | 0.05 | 0.06 | 0.04 | 0.05 | 0.06 | 0.04 |
| Aperture size (mm) | 0.60 | 0.70 | 0.80 | 0.60 | 0.70 | 0.80 | 0.60 | 0.70 | 0.80 | 0.60 |
| Diameter of spigot (mm) | 18.00 | 24.00 | 18.00 | 24.00 | 18.00 | 24.00 | 18.00 | 24.00 | 18.00 | 24.00 |
| Diameter of vortex finder (mm) | 30.00 | 40.00 | 50.00 | 60.00 | 30.00 | 40.00 | 50.00 | 60.00 | 30.00 | 40.00 |
| Experiment Number | Solid Recovery in Overflow (%) | Solid Recovery in Screen Underflow (%) | Solid Recovery in Underflow (%) | Water Recovery in Underflow Rf (%) |
|---|---|---|---|---|
| 1 | 12.76 | 32.20 | 55.04 | 10.26 |
| 2 | 13.20 | 40.30 | 46.48 | 6.87 |
| 3 | 17.77 | 39.04 | 43.19 | 4.89 |
| 4 | 9.43 | 46.85 | 43.72 | 5.39 |
| 5 | 13.05 | 51.38 | 35.57 | 7.41 |
| 6 | 5.69 | 42.74 | 51.57 | 6.01 |
| 7 | 27.30 | 34.45 | 38.28 | 3.35 |
| 8 | 12.49 | 47.91 | 39.60 | 3.95 |
| 9 | 6.45 | 52.79 | 40.76 | 6.62 |
| 10 | 10.40 | 52.54 | 37.07 | 8.16 |
| Items | Experiment Number | |||||||||||
|---|---|---|---|---|---|---|---|---|---|---|---|---|
| 1 | 2 | 3 | 4 | 5 | 6 | 7 | 8 | 9 | 10 | |||
| Performance | HE (%) | 61.160 | 60.854 | 63.515 | 67.908 | 57.911 | 63.948 | 64.665 | 65.155 | 64.626 | 59.310 | |
| I | 0.370 | 0.380 | 0.383 | 0.347 | 0.307 | 0.380 | 0.396 | 0.360 | 0.340 | 0.365 | ||
| d50c (mm) | 0.230 | 0.250 | 0.235 | 0.245 | 0.285 | 0.230 | 0.240 | 0.250 | 0.250 | 0.260 | ||
| Relevant factors | Feed concentration (g/L) | 60.00 | 100.00 | 140.00 | 180.00 | 220.00 | 60.00 | 100.00 | 140.00 | 180.00 | 220.00 | |
| Feed pressure (MPa) | 0.04 | 0.05 | 0.06 | 0.04 | 0.05 | 0.06 | 0.04 | 0.05 | 0.06 | 0.04 | ||
| Aperture size (mm) | 0.60 | 0.70 | 0.80 | 0.60 | 0.70 | 0.80 | 0.60 | 0.70 | 0.80 | 0.60 | ||
| Diameter of spigot (mm) | 18.00 | 24.00 | 18.00 | 24.00 | 18.00 | 24.00 | 18.00 | 24.00 | 18.00 | 24.00 | ||
| Diameter of vortex finder (mm) | 30.00 | 40.00 | 50.00 | 60.00 | 30.00 | 40.00 | 50.00 | 60.00 | 30.00 | 40.00 | ||
| Items | Parameter | HE (%) | I | d50c (mm) |
|---|---|---|---|---|
| Development coefficient of system | a | −1.842 | −1.604 | −1.690 |
| Driving coefficient bl | b1 | −0.019 | −0.129 | 0.065 |
| b2 | −6.227 | −9.021 | −9.541 | |
| b3 | 7.902 | 10.994 | 11.632 | |
| b4 | −0.001 | 0.016 | −0.127 | |
| b5 | 0.175 | −0.035 | −0.142 |
| Items | Relative Error = (Predicted-Actual)/Predicted*100% | |||
|---|---|---|---|---|
| HE | I | d50c | ||
| Experiment | 2 | −2.49% | 3.35% | −1.76% |
| 3 | 2.93% | −10.86% | 2.50% | |
| 4 | −4.88% | −7.58% | 5.42% | |
| 5 | 2.22% | 5.71% | −5.09% | |
| 6 | 2.11% | 4.81% | −2.96% | |
| 7 | 0.62% | 2.91% | 3.86% | |
| 8 | 4.44% | 4.36% | −6.00% | |
| 9 | −5.44% | 3.64% | −0.27% | |
| 10 | 0.37% | −8.52% | 4.26% | |
| Mean relative error, % | 2.83% | 5.75% | 3.57% | |
© 2020 by the authors. Licensee MDPI, Basel, Switzerland. This article is an open access article distributed under the terms and conditions of the Creative Commons Attribution (CC BY) license (http://creativecommons.org/licenses/by/4.0/).
Share and Cite
Wang, C.; Sun, X.; Shen, L.; Wang, G. Analysis and Prediction of Influencing Parameters on the Coal Classification Performance of a Novel Three Products Hydrocyclone Screen (TPHS) Based on Grey System Theory. Processes 2020, 8, 974. https://doi.org/10.3390/pr8080974
Wang C, Sun X, Shen L, Wang G. Analysis and Prediction of Influencing Parameters on the Coal Classification Performance of a Novel Three Products Hydrocyclone Screen (TPHS) Based on Grey System Theory. Processes. 2020; 8(8):974. https://doi.org/10.3390/pr8080974
Chicago/Turabian StyleWang, Chuanzhen, Xiaolu Sun, Liang Shen, and Guanghui Wang. 2020. "Analysis and Prediction of Influencing Parameters on the Coal Classification Performance of a Novel Three Products Hydrocyclone Screen (TPHS) Based on Grey System Theory" Processes 8, no. 8: 974. https://doi.org/10.3390/pr8080974
APA StyleWang, C., Sun, X., Shen, L., & Wang, G. (2020). Analysis and Prediction of Influencing Parameters on the Coal Classification Performance of a Novel Three Products Hydrocyclone Screen (TPHS) Based on Grey System Theory. Processes, 8(8), 974. https://doi.org/10.3390/pr8080974