Qualitative and Quantitative Analysis of Heavy Crude Oil Samples and Their SARA Fractions with 13C Nuclear Magnetic Resonance


 ,
,  and
and 
Abstract
:1. Introduction
2. Materials and Methods
2.1. SARA Fractionation
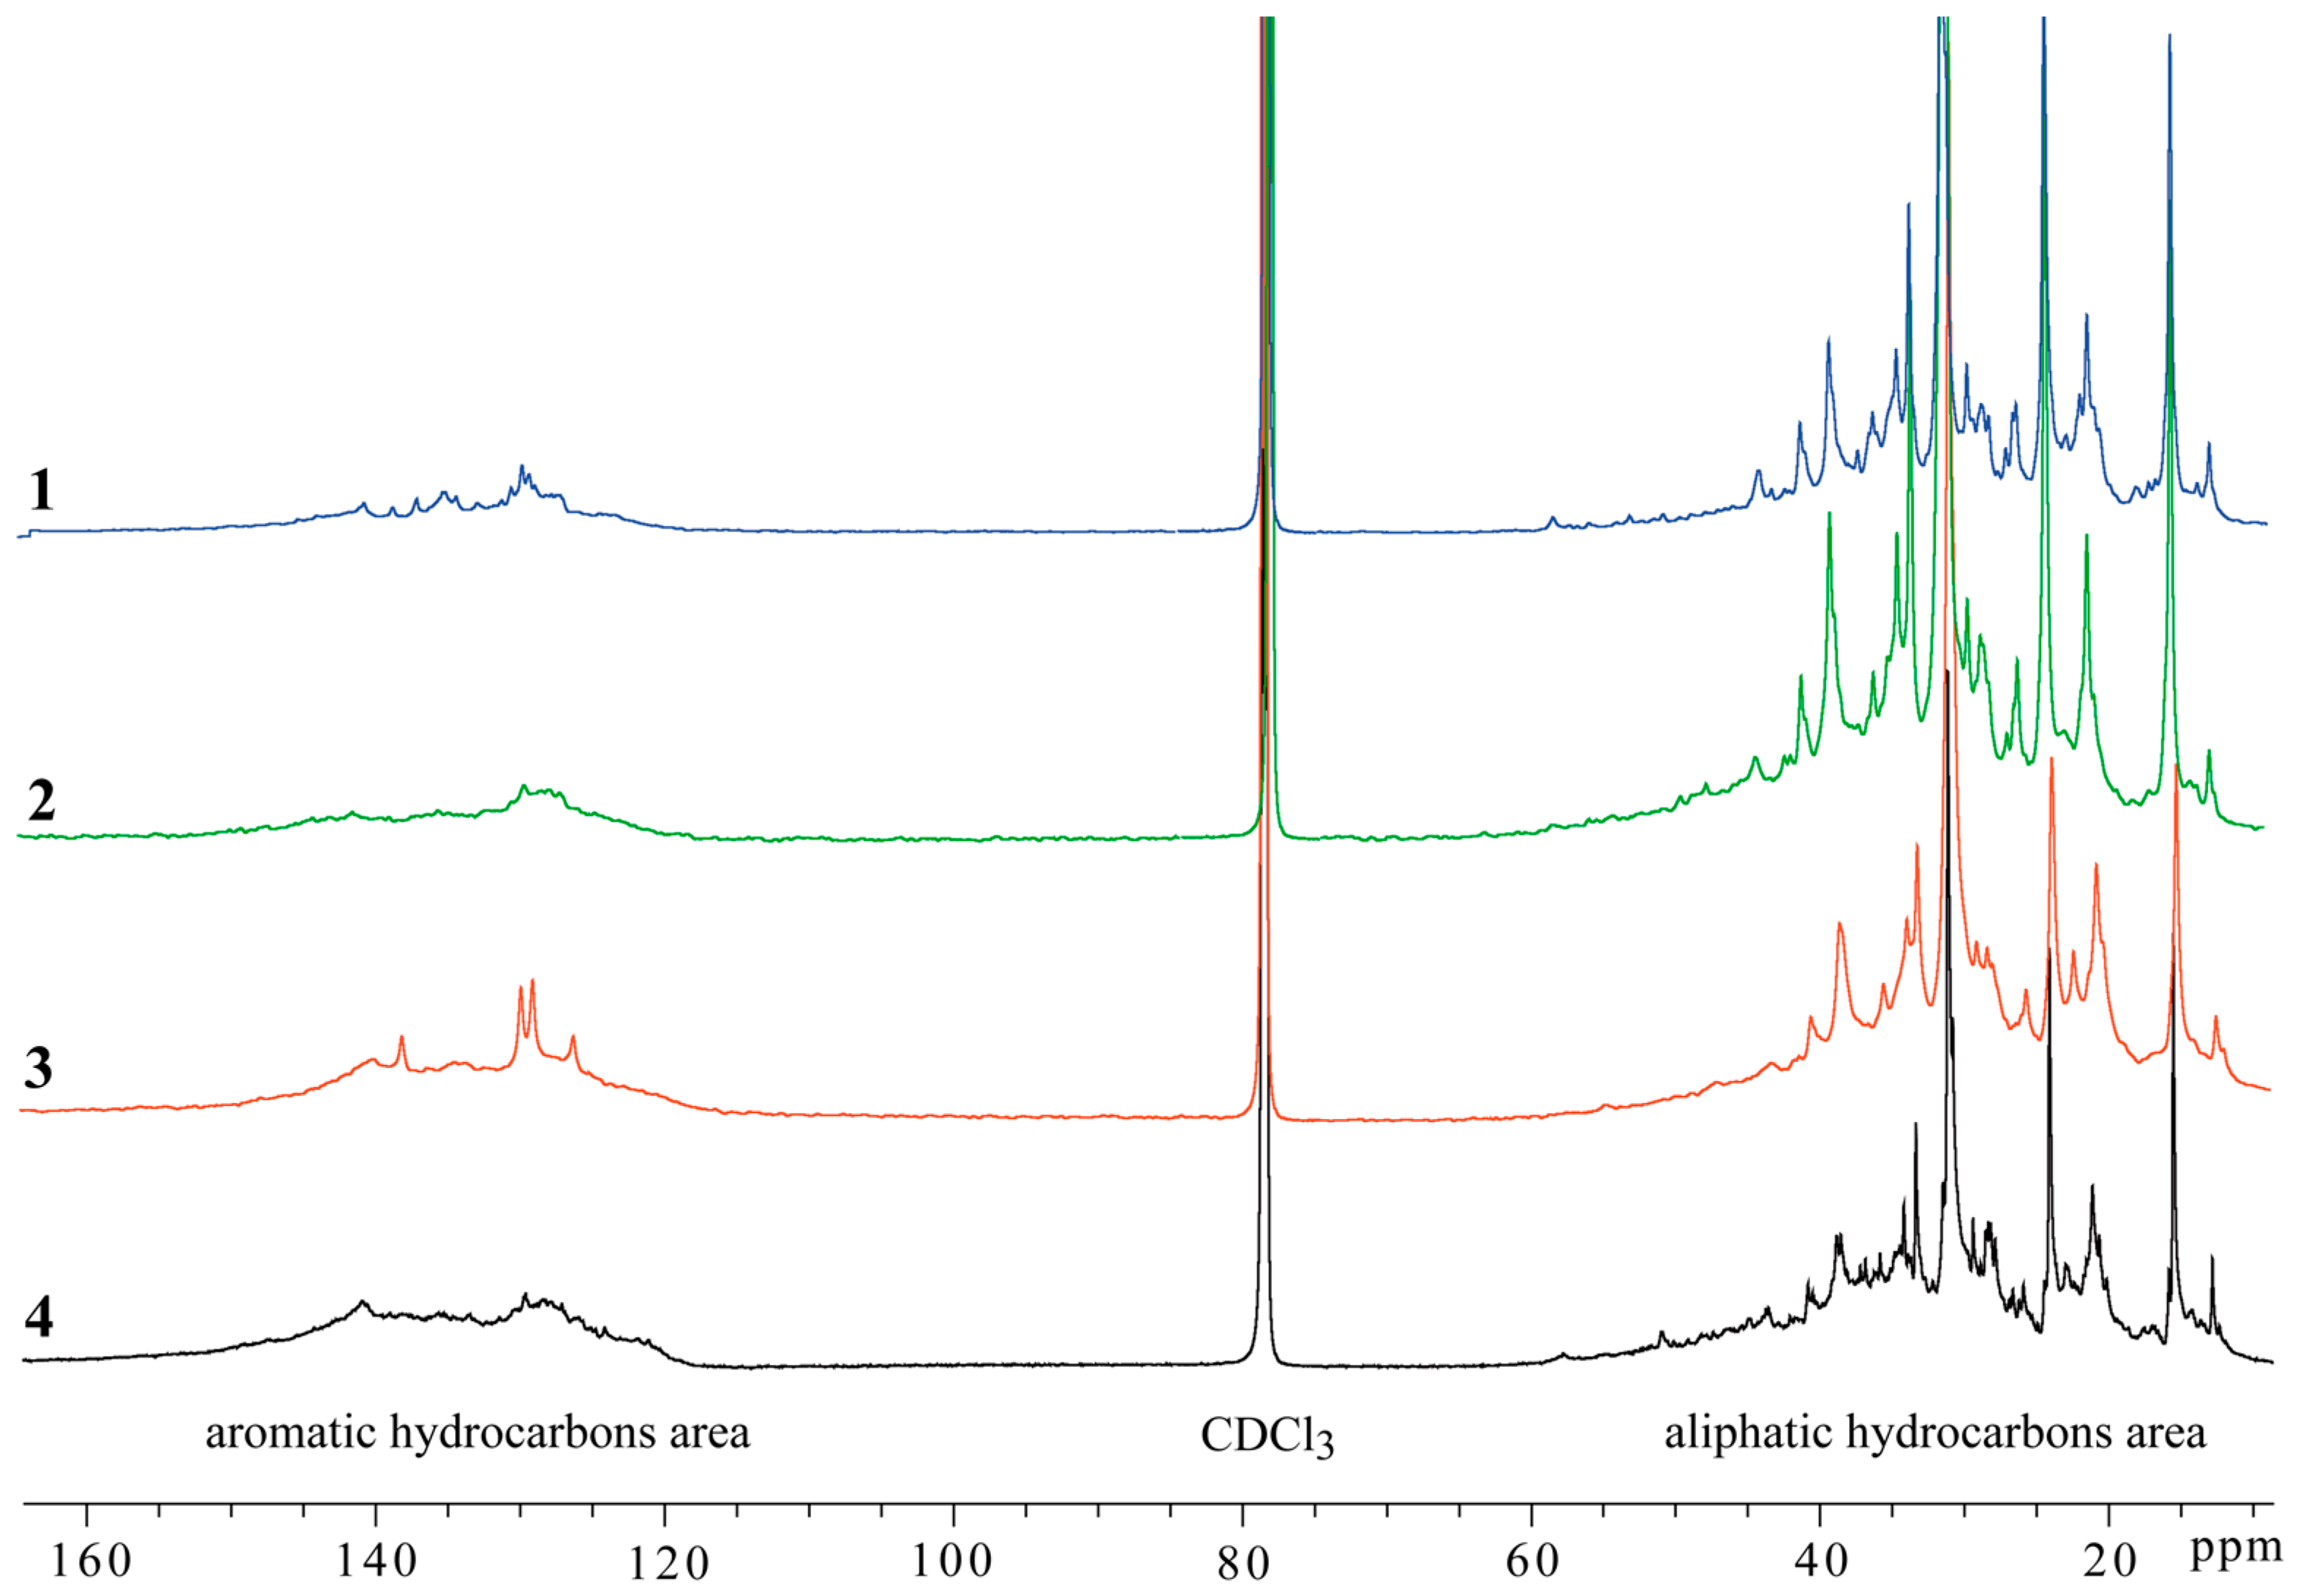
2.2. 13C NMR Spectroscopy
3. Results and Discussion
4. Conclusions
Supplementary Materials
Author Contributions
Funding
Conflicts of Interest
References
- Speight, J. The Chemistry and Technology of Petroleum, 5th ed.; CRC Press: Boca Raton, FL, USA, 2014. [Google Scholar]
- Shukla, A.K. Analytical Characterization Methods for Crude Oil and Related Products; JohnWiley & Sons Ltd.: Hoboken, NJ, USA, 2018. [Google Scholar]
- Speight, J.G. Petroleum asphaltenes: Part 1: Asphaltenes, resins and the structure of petroleum. Oil Gas Sci. Technol. Rev. IFP 2004, 59, 467–477. [Google Scholar] [CrossRef] [Green Version]
- Mamin, G.V.; Gafurov, M.R.; Yusupov, R.V.; Gracheva, I.N.; Ganeeva, Y.M.; Yusupova, T.N.; Orlinskii, S.B. Toward the asphaltene structure by electron paramagnetic resonance relaxation studies at high fields (3.4 T). Energy Fuels 2016, 30, 6942–6946. [Google Scholar] [CrossRef] [Green Version]
- Gafurov, M.; Mamin, G.; Gracheva, I.; Murzakhanov, F.; Ganeeva, Y.; Yusupova, T.; Orlinskii, S. High-Field (3.4 T) ENDOR investigation of asphaltenes in native oil and vanadyl complexes by asphaltene adsorption on alumina surface. Geofluids 2019, 2019, 1–9. [Google Scholar] [CrossRef] [Green Version]
- Gizatullin, B.; Gafurov, M.; Rodionov, A.; Mamin, G.; Mattea, C.; Stapf, S.; Orlinskii, S. Proton–radical interaction in crude oil—A combined NMR and EPR Study. Energy Fuels 2018, 32, 11261–11268. [Google Scholar] [CrossRef]
- Kvalheim, O.M.; Aksnes, D.W.; Brekke, T.; Eide, M.O.; Sletten, E. Crude oil characterization and correlation by principal component analysis of 13C nuclear magnetic resonance spectra. Anal. Chem. 1985, 57, 2858–2864. [Google Scholar] [CrossRef]
- Gao, G.; Cao, J.; Xu, T.; Zhang, H.; Zhang, Y.; Hu, K. Nuclear magnetic resonance spectroscopy of crude oil as proxies for oil source and thermal maturity based on 1H and 13C spectra. Fuel 2020, 271, 117622. [Google Scholar] [CrossRef]
- Netzel, D.A.; Thompson, L.F. Aromatic tertiary carbons as a check of the validity of NMR fossil fuels. Fuel 1986, 65, 597–598. [Google Scholar] [CrossRef]
- Breitmaier, E.; Hass, G.; Voelter, W. Atlas of Carbon-13 NMR Data; Heyden and Son: London, UK, 1975. [Google Scholar]
- Edwards, J.C. A review of applications of NMR spectroscopy in the petroleum industry. In Spectroscopic Analysis of Petroleum Products and Lubricants; Nadkarni, R.A., Ed.; ASTM International: West Conshohocken, PA, USA, 2011; pp. 423–473. [Google Scholar]
- Derome, A.E. Modern NMR Techniques for Chemistry Research; Pergamon Press: Oxford, UK, 1987. [Google Scholar]
- Günther, H. NMR Spectroscopy: Basic Principles, Concepts, and Applications in Chemistry, 3rd ed.; Wiley: Hoboken, NJ, USA, 2013. [Google Scholar]
- Ernst, R.; Bodenhausen, G.; Wokaun, A. Principles of Nuclear Magnetic Resonance in One and Two Dimensions; International Series of Monographs on Chemistry, Book 14; Clarendon Press: Oxford, UK, 1987. [Google Scholar]
- Rule, G.S.; Hitchens, T.K. Fundamentals of Protein NMR Spectroscopy; Springer: Dordrecht, The Netherlands, 2006. [Google Scholar]
- Friedel, R.A. Absorption spectra and magnetic resonance spectra of asphaltene. J. Chem. Phys. 1959, 31, 280–281. [Google Scholar] [CrossRef]
- Clutter, D.R.; Petrakis, L.; Stenger, J.R.L.; Jensen, R.K. Nuclear magnetic resonance spectrometry of petroleum fractions. Carbon-13 and proton nuclear magnetic resonance characterizations in terms of average molecule parameters. Anal. Chem. 1972, 44, 1395–1405. [Google Scholar] [CrossRef]
- Snape, C.E.; Ladner, W.R.; Bartle, K.D. Survey of carbon-13 chemical shifts in aromatic hydrocarbons and its application to coal-derived materials. Anal. Chem. 1979, 51, 2189–2198. [Google Scholar] [CrossRef]
- Sanchez-Minero, F.; Ancheyta, J.; Silva-Oliver, G.; Flores-Valle, S. Predicting SARA composition of crude oil by means of NMR. Fuel 2013, 110, 318–321. [Google Scholar] [CrossRef]
- Kök, M.V.; Varfolomeev, M.A.; Nurgaliev, D.K. Determination of SARA fractions of crude oils by NMR technique. J. Pet. Sci. Eng. 2019, 179, 1–6. [Google Scholar]
- Woods, J.; Kung, J.; Kingston, D.; Kotlyar, L.; Sparks, B.; McCracken, T. Canadian crudes: A comparative study of SARA fractions from a modified HPLC separation technique. Oil Gas Sci. Tech. 2008, 63, 151–163. [Google Scholar] [CrossRef] [Green Version]
- Molina, D.; Uribe, U.N.; Murgich, J. Correlations between SARA fractions and physicochemical properties with 1H NMR spectra of vacuum residues from Colombian crude oils. Fuel 2010, 89, 185–192. [Google Scholar] [CrossRef]
- Hauser, A.; AlHumaidan, F.; Al-Rabiah, H.; Halabi, M.A. Study on thermal cracking of Kuwaiti heavy oil (vacuum residue) and its SARA fractions by NMR spectroscopy. Energy Fuels 2014, 28, 4321–4332. [Google Scholar] [CrossRef]
- Bahramzadeh, S.; Tabarsa, M.; You, S.; Yelithao, K.; Klochkov, V.; Rakhmatullin, I. An arabinogalactan isolated from Boswellia carterii: Purification, structural elucidation and macrophage stimulation via NF-κB and MAPK pathways. J. Funct. Foods 2019, 52, 450–458. [Google Scholar] [CrossRef]
- Scheeder, G.; Weniger, P.; Blumenberg, M. Geochemical implications from direct Rock-Eval pyrolysis of petroleum. Org. Geochem. 2020, 146, 104051. [Google Scholar] [CrossRef]
- Davydov, V.V.; Dudkin, V.I.; Vysoczky, M.G.; Myazin, N.S. Small-size NMR Spectrometer for Express Control of Liquid Media State. Appl. Magn. Reson. 2020, 51, 653–666. [Google Scholar] [CrossRef]
- Rudyk, S. Relationships between SARA fractions of conventional oil, heavy oil, natural bitumen and residues. Fuel 2018, 216, 330–340. [Google Scholar] [CrossRef]
- Holzgrabe, U. Quantitative NMR, methods and applications. In Encyclopedia of Spectroscopy and Spectrometry, 3rd ed.; Lindon, J.C., Tranter, G.E., Koppenaal, D.W., Eds.; Academic Press: New York, NY, USA, 2017; pp. 816–823. [Google Scholar]
- Poveda, J.-C.; Molina, D.-R.; Pantoja-Agreda, E.-F. 1H- and 13C-NMR structural characterization of asphaltenes from Vacuum residua modified by thermal cracking. CtF 2014, 5, 49–60. [Google Scholar] [CrossRef]
- Oliveira Da Silva, E.C.; Neto, A.C.; Valdemar, L.J.; De Castro, E.V.R.; De Menezes, S.M.C. Study of Brazilian asphaltene aggregation by nuclear magnetic resonance spectroscopy. Fuel 2014, 117, 146–151. [Google Scholar] [CrossRef] [Green Version]
- McBeath, A.V.; Smernik, R.J.; Schneider, M.P.W.; Schmidt, M.W.I.; Plant, E.L. Determination of the aromaticity and the degree of aromatic condensation of a thermosequence of wood charcoal using NMR. Org. Geochem. 2011, 42, 1194–1202. [Google Scholar] [CrossRef]
- Fergoug, T.; Bouhadda, Y. Determination of Hassi Messaoud asphaltene aromatic structure from 1H & 13C NMR analysis. Fuel 2014, 115, 521–526. [Google Scholar]
- Lee, S.W.; Glavincevski, B.B. NMR method for determination of aromatics in middle distillate oils. Fuel Process. Technol. 1999, 60, 81–86. [Google Scholar] [CrossRef]
- Gizatullin, B.; Gafurov, M.; Vakhin, A.; Rodionov, A.; Mamin, G.; Orlinskii, S.; Mattea, C.; Stapf, S. Native Vanadyl Complexes in Crude Oil as Polarizing Agents for In Situ Proton Dynamic Nuclear Polarization. Energy Fuels 2019, 33, 10923–10932. [Google Scholar] [CrossRef]
- Alexandrov, A.S.; Archipov, R.V.; Ivanov, A.A.; Gnezdilov, O.I.; Gafurov, M.R.; Skirda, V.D. The low-field pulsed mode dynamic nuclear polarization in the pentavalent chromium complex and crude oils. Appl. Magn. Reson. 2014, 45, 1275–1287. [Google Scholar] [CrossRef]
- Poindexter, E. An Overhauser Effect in Natural Crude Oil. Nature 1958, 182, 1087. [Google Scholar] [CrossRef]
- Peksoz, A.; Almaz, E.; Yalciner, A. The characterization of asphaltene behavior in some aromatic solvents by dynamic nuclear polarization technique. J. Pet. Sci. Eng. 2010, 75, 58–65. [Google Scholar] [CrossRef]
- Chen, J.; Feng, J.; Chen, F.; Zhang, Z.; Chen, L.; Zhang, Z.; Liu, C. Characterizing oils in oil-water mixtures inside porous media by Overhauser dynamic nuclear polarization. Fuel 2019, 257, 116107. [Google Scholar] [CrossRef]
- Corzilius, B. High-Field Dynamic Nuclear Polarization. Annu. Rev. Phys. Chem. 2020, 71, 143–170. [Google Scholar] [CrossRef] [Green Version]
- Rakhmatullin, I.Z.; Efimov, S.V.; Tyurin, V.A.; Al-Muntaser, A.A.; Klimovitskii, A.E.; Varfolomeev, M.A.; Klochkov, V.V. Application of high resolution NMR (1H and 13C) and FTIR spectroscopy for characterization of light and heavy crude oils. J. Pet. Sci. Eng. 2018, 168, 256–262. [Google Scholar] [CrossRef]
- Bissada, K.K.A.; Tan, J.; Szymczyk, E.; Darnell, M.; Mei, M.; Zhou, J. Group-type characterization of crude oil and bitumen. Part I: Enhanced separation and quantification of saturates, aromatics, resins and asphaltenes (SARA). Org. Geochem. 2016, 95, 21–28. [Google Scholar] [CrossRef]
- Rakhmatullin, I.Z.; Efimov, S.V.; Margulis, B.Y.; Klochkov, V.V. Qualitative and quantitative analysis of oil samples extracted from some Bashkortostan and Tatarstan oilfields based on NMR spectroscopy data. J. Pet. Sci. Eng. 2017, 156, 12–18. [Google Scholar] [CrossRef]


| Sample Number 1 | Viscosity, mPa·s | Origin of Oil |
|---|---|---|
| 1, 1s, 1ar, 1r, 1as | 106 | Iraq |
| 2, 2s, 2ar, 2r, 2as | 1430 | Ambar gatur (Turkmenistan) |
| 3, 3s, 3ar, 3r, 3as | 2420 | Ashal’cha (Republic of Tatarstan, Russia) |
| 4, 4s, 4ar, 4r, 4as | 49,700 | Cuba |
| Sample Number | 1 | 2 | 3 | 4 |
|---|---|---|---|---|
| Saturates, % | 59.6 | 73.7 | 26.2 | 31.0 |
| Aromatics, % | 26.7 | 14.3 | 40.6 | 39.2 |
| Resins, % | 12.1 | 9.8 | 28.5 | 14.2 |
| Asphaltenes, % | 1.6 | 2.2 | 4.7 | 15.6 |
| Parameter | Details |
|---|---|
| sample size | 1 g of oil |
| precipitation of asphaltenes (fold amount of n-alkane) | 1:40 heptane |
| time of precipitation | 24 h |
| temperature of precipitation | room temperature |
| filtration paper | 2.5 μm filter |
| asphaltene washing | hot heptane |
| asphaltene extraction | toluene |
| adsorbent | alumina activated at 430 °C |
| saturates elution | 200 mL of heptane |
| aromatics elution | 200 mL of toluene |
| resins elution | 200 mL of 1:1 toluene-isopropyl alcohol |
| solvent removal | rotary evaporator |
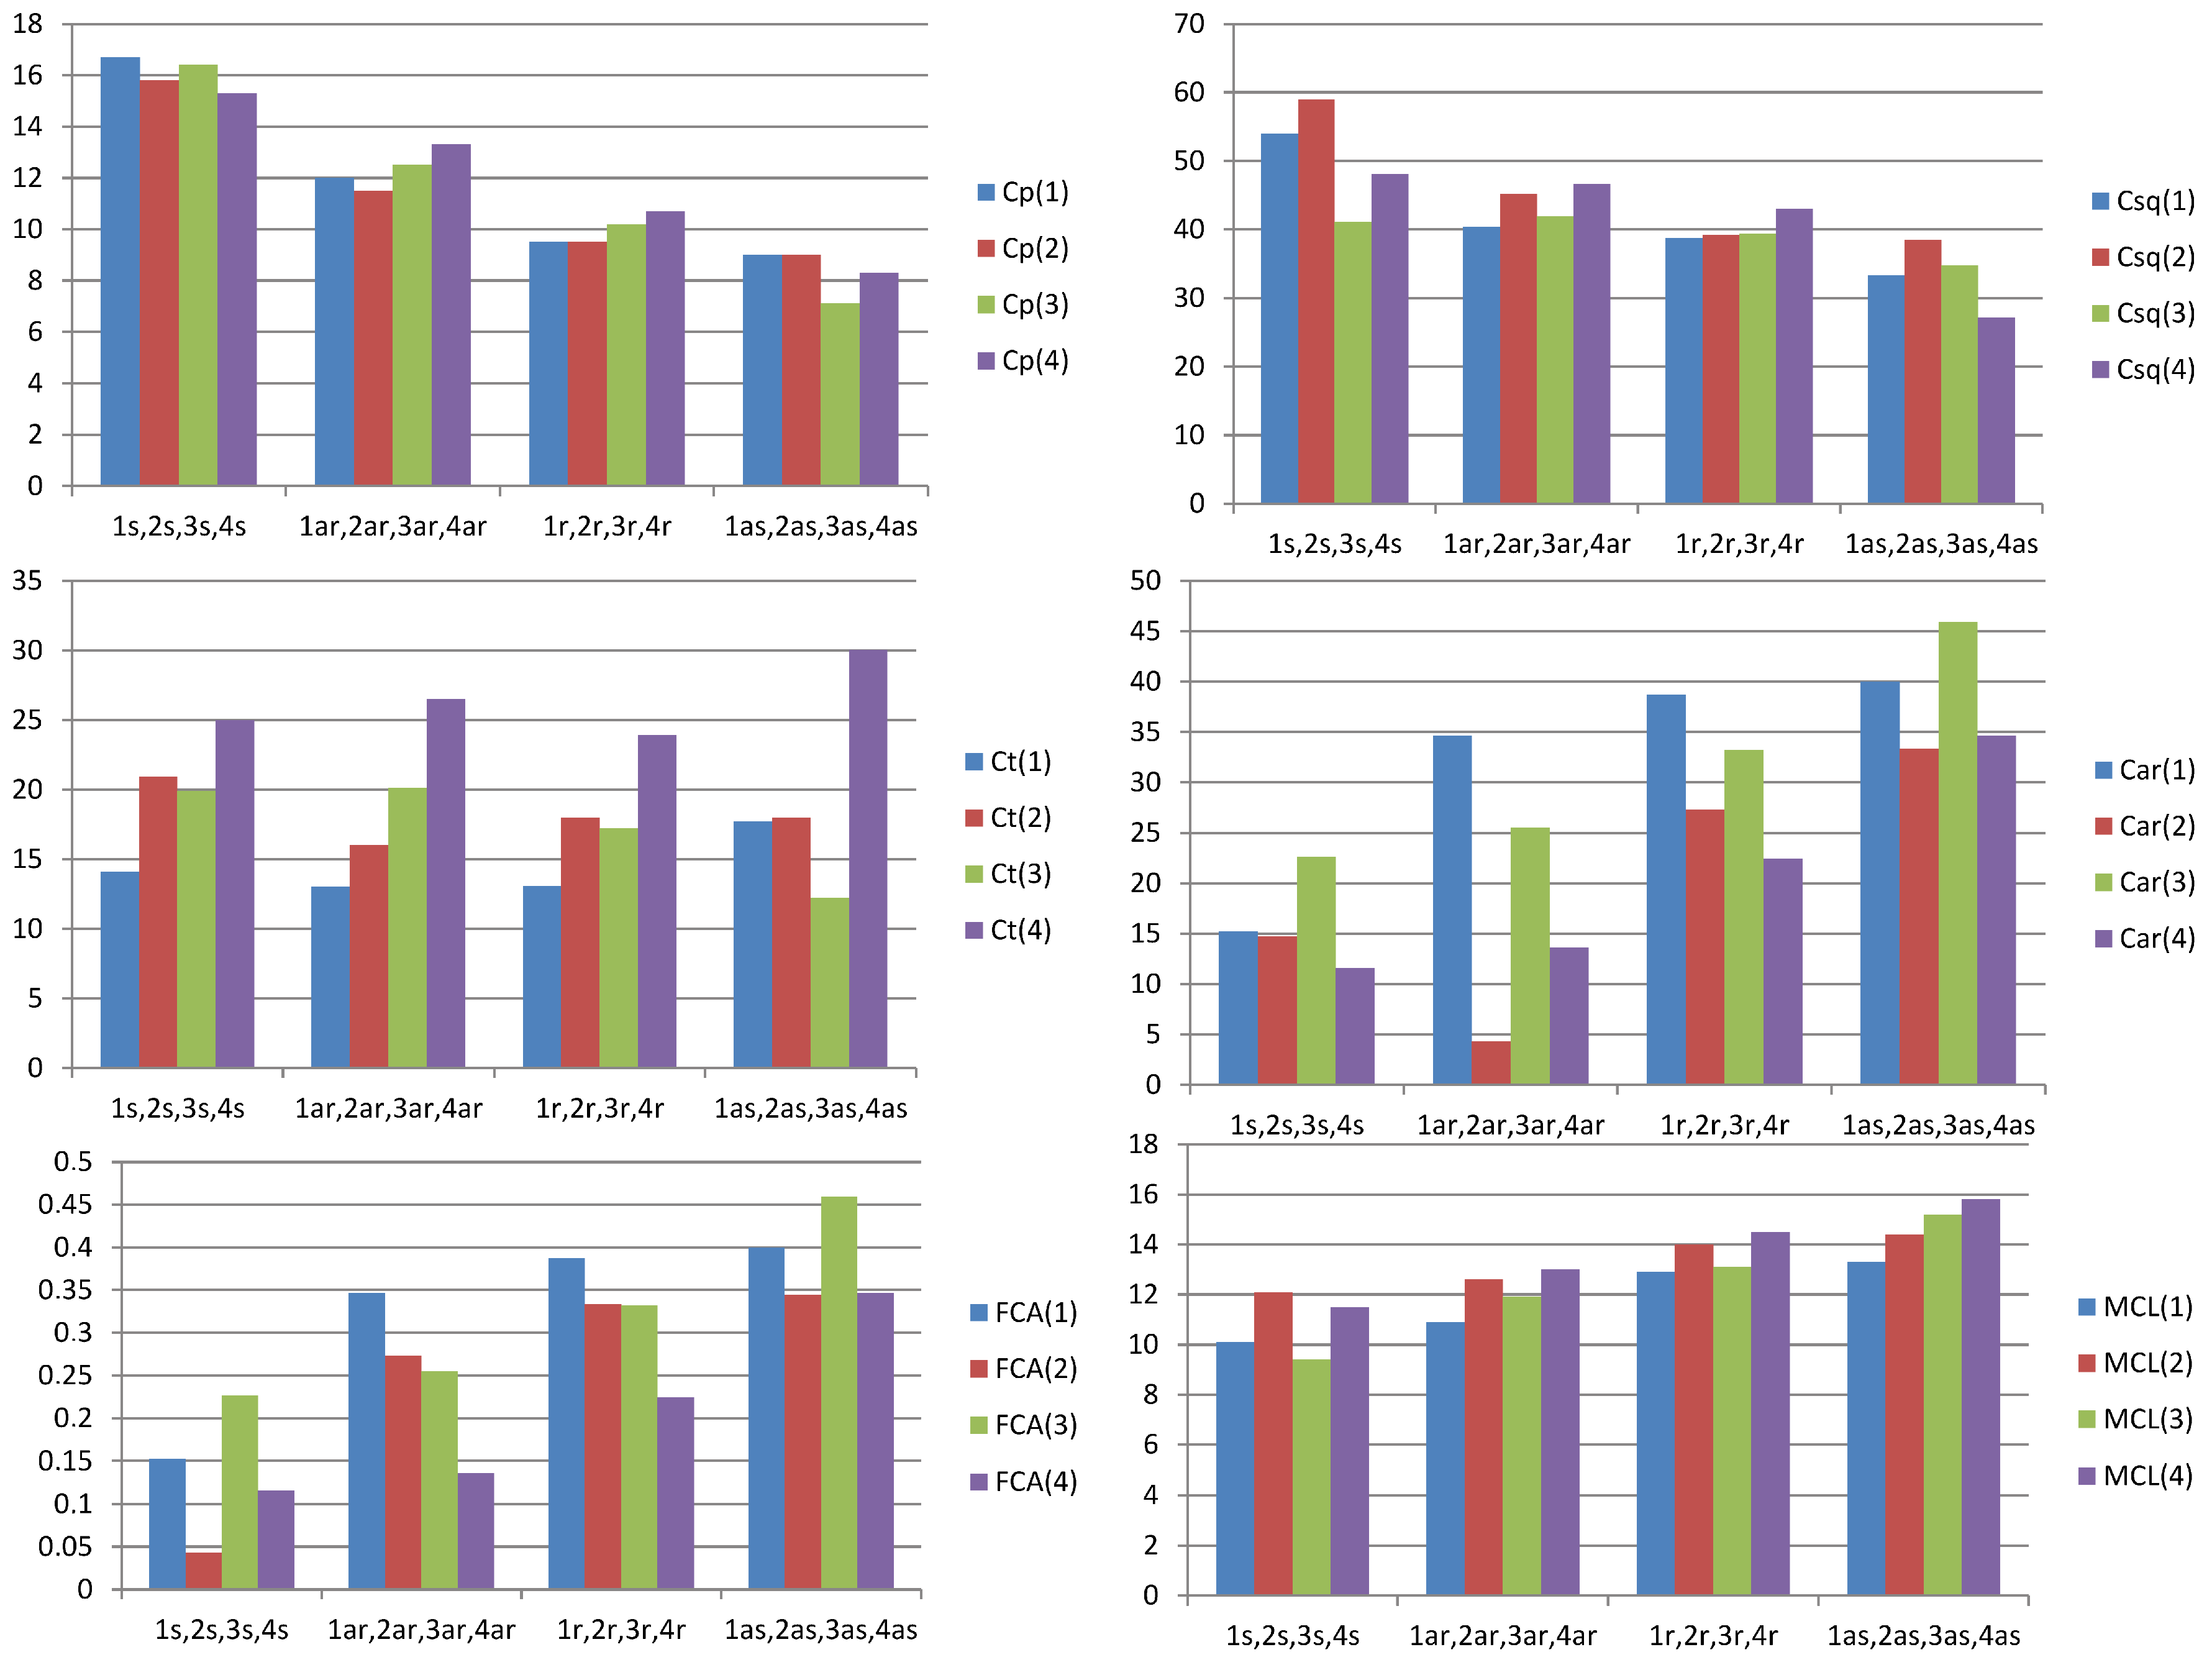
| Sample Number | 1 | 2 | 3 | 4 |
|---|---|---|---|---|
| Cp | 25.8 | 18.8 | 21.6 | 18.8 |
| Csq | 53.0 | 52.6 | 48.9 | 36.6 |
| Ct | 10.0 | 13.9 | 12.8 | 15.1 |
| Car | 12.5 | 14.7 | 19.3 | 27.5 |
| FCA | 0.123 | 0.147 | 0.188 | 0.275 |
| MCL | 6.9 | 9.1 | 7.7 | 7.7 |
| Sample number | 1 | 1s | 1ar | 1r | 1as |
|---|---|---|---|---|---|
| SARA fractions, % | crude oil (100%) | saturated compounds (59.6%) | aromatics (26.7%) | resins (12.1%) | asphaltene fraction (1.6%) |
| Cp | 25.8 | 16.7 | 12.0 | 9.5 | 9.0 |
| Csq | 53.0 | 54.0 | 40.4 | 38.7 | 33.3 |
| Ct | 10.0 | 14.1 | 13.0 | 13.1 | 17.7 |
| Car | 12.5 | 15.2 | 34.6 | 38.7 | 40.0 |
| FCA | 0.123 | 0.152 | 0.346 | 0.387 | 0.400 |
| MCL | 6.9 | 10.1 | 10.9 | 12.9 | 13.3 |
| Sample Number | 2 | 2s | 2ar | 2r | 2as |
|---|---|---|---|---|---|
| SARA fractions, % | crude oil (100%) | saturated compounds (73.7%) | aromatics (14.3%) | resins (9.8%) | asphaltene fraction (2.2%) |
| Cp | 18.8 | 15.8 | 11.5 | 9.5 | 9.1 |
| Csq | 52.6 | 59.0 | 45.2 | 39.2 | 38.5 |
| Ct | 13.9 | 20.9 | 16.0 | 18.0 | 18.0 |
| Car | 14.7 | 4.3 | 27.3 | 33.3 | 34.4 |
| FCA | 0.147 | 0.043 | 0.273 | 0.333 | 0.344 |
| MCL | 9.1 | 12.1 | 12.6 | 14.0 | 14.4 |
| Sample Number | 3 | 3s | 3ar | 3r | 3as |
|---|---|---|---|---|---|
| SARA fractions, % | crude oil (100%) | saturated compounds (26.2%) | aromatics (40.6%) | resins (28.5%) | asphaltene fraction (4.7%) |
| Cp | 21.6 | 16.4 | 12.5 | 10.2 | 7.1 |
| Csq | 48.9 | 41.1 | 41.9 | 39.4 | 34.8 |
| Ct | 12.8 | 19.9 | 20.1 | 17.2 | 12.2 |
| Car | 19.3 | 22.6 | 25.5 | 33.2 | 45.9 |
| FCA | 0.188 | 0.226 | 0.255 | 0.332 | 0.459 |
| MCL | 7.7 | 9.4 | 11.9 | 13.1 | 15.2 |
| Sample Number | 4 | 4s | 4ar | 4r | 4as |
|---|---|---|---|---|---|
| SARA fractions, % | crude oil (100%) | saturated compounds (31.0%) | aromatics (39.2%) | resins (14.2%) | asphaltene fraction (15.6%) |
| Cp | 18.8 | 15.3 | 13.3 | 10.7 | 8.3 |
| Csq | 36.6 | 48.1 | 46.6 | 43.0 | 27.1 |
| Ct | 15.1 | 25.0 | 26.5 | 23.9 | 30.0 |
| Car | 27.5 | 11.6 | 13.6 | 22.4 | 34.6 |
| FCA | 0.275 | 0.116 | 0.136 | 0.224 | 0.346 |
| MCL | 7.7 | 11.5 | 13.0 | 14.5 | 15.8 |
© 2020 by the authors. Licensee MDPI, Basel, Switzerland. This article is an open access article distributed under the terms and conditions of the Creative Commons Attribution (CC BY) license (http://creativecommons.org/licenses/by/4.0/).
Share and Cite
Rakhmatullin, I.; Efimov, S.; Tyurin, V.; Gafurov, M.; Al-Muntaser, A.; Varfolomeev, M.; Klochkov, V. Qualitative and Quantitative Analysis of Heavy Crude Oil Samples and Their SARA Fractions with 13C Nuclear Magnetic Resonance. Processes 2020, 8, 995. https://doi.org/10.3390/pr8080995
Rakhmatullin I, Efimov S, Tyurin V, Gafurov M, Al-Muntaser A, Varfolomeev M, Klochkov V. Qualitative and Quantitative Analysis of Heavy Crude Oil Samples and Their SARA Fractions with 13C Nuclear Magnetic Resonance. Processes. 2020; 8(8):995. https://doi.org/10.3390/pr8080995
Chicago/Turabian StyleRakhmatullin, Ilfat, Sergey Efimov, Vladimir Tyurin, Marat Gafurov, Ameen Al-Muntaser, Mikhail Varfolomeev, and Vladimir Klochkov. 2020. "Qualitative and Quantitative Analysis of Heavy Crude Oil Samples and Their SARA Fractions with 13C Nuclear Magnetic Resonance" Processes 8, no. 8: 995. https://doi.org/10.3390/pr8080995
APA StyleRakhmatullin, I., Efimov, S., Tyurin, V., Gafurov, M., Al-Muntaser, A., Varfolomeev, M., & Klochkov, V. (2020). Qualitative and Quantitative Analysis of Heavy Crude Oil Samples and Their SARA Fractions with 13C Nuclear Magnetic Resonance. Processes, 8(8), 995. https://doi.org/10.3390/pr8080995