4.1. Justification of Model
For the justification of the model, the mesostructure effects on the compression behavior of HMX grains and the HMX/Estane PBX under impact loading were studied. At low pressure, weak shocks are predominated by compressional effects, and shock waves can be defined as a transmission wave front, across which a discontinuous adiabatic jump in state variables occurs [
38]. Consequently, isothermal compression can be approximated by the adiabatic compression process, and the pressure–volume (PV) data can be transferred to pseudo particle velocity
and pseudo shock velocity
in terms of the method of Olinger and Cady et al. [
39]. The Rankine–Hugoniot jump conditions are expressed as follows:
where
and
are the initial pressure and volume of the system, respectively.
P and
V describe the pressure and volume at different compressions, respectively.
The calculated PV curve of HMX at room temperature is illustrated in
Figure 4a and compared with available experimental observations [
40,
41,
42,
43] and numerical simulation results [
44,
45,
46]. It is seen that the calculated results are in good agreement with the experimental data and match those from the molecular dynamics simulation studies by Sewell et al. [
46].
The
us–
up variations of HMX converted from the static PV data using Equations (14) and (15) are plotted in
Figure 4b and also compared with experimental results [
40,
42,
43] and numerical simulation data [
44,
45,
46]. The calculated
us–
up data also show a good agreement with experimental observations. Pseudo particle velocity
and pseudo shock velocity
are related by a linear relation [
47], which is a Hugoniot EOS:
where the constant
c and
s are parameters of a Mie–Grüneisen EOS;
c is related to the bulk wave speed, and
s is a dimensionless coefficient. Curve fitting yields
c = 2.759 and
s = 2.545, which are in good agreement with the experimental values (
c = 2.74 km/s and
s = 2.60) [
40].
Figure 5a shows a PV isotherm of the PBX (95% HMX: 5% Estane) compared with experimental and other previous simulation data [
48,
49,
50,
51,
52]. The authors in [
50] compared Hugoniot data for Estane and the PBX9501 binder, where 2.5% plasticizer is mixed, and the results showed similar changes for the two components. The pressure required for the PBX in this study is close to the experimental data of reference [
48] at the same compression ratio and is slightly higher than the experimental data when the compression ratio is lower than 0.8. Divergence may be generated from different simulation techniques or different loading temperatures.
Figure 5b presents the Hugoniot data of HMX/Estane PBX with experimental and numerical results also shown for comparison. The black solid line in
Figure 5b is a linear fit of the simulation data in this study; the two dash dotted lines are
us–
up linear fits taken from [
49,
52]. The Hugoniot data can be fitted as
us = 2.356
up + 2.71 in this study, which is coincident with
us = 2.3
up + 2.65 given by Gustavsen et al. [
49]. Moreover, simulation data in this study are close to the results from [
50] at low
up (0 <
up < 0.6 km/s). The aforementioned comparisons indicate that results of the MPM mesoscale simulation are reliable and that this model is applicable to develop the equation of state for investigating the pressure–volume variation behaviors of HMX/Estane PBX, as well as microstructure effects on EOS of PBX in mesoscale.
4.2. PV Isotherms and Hugoniot Analysis of HMX/Estane PBX
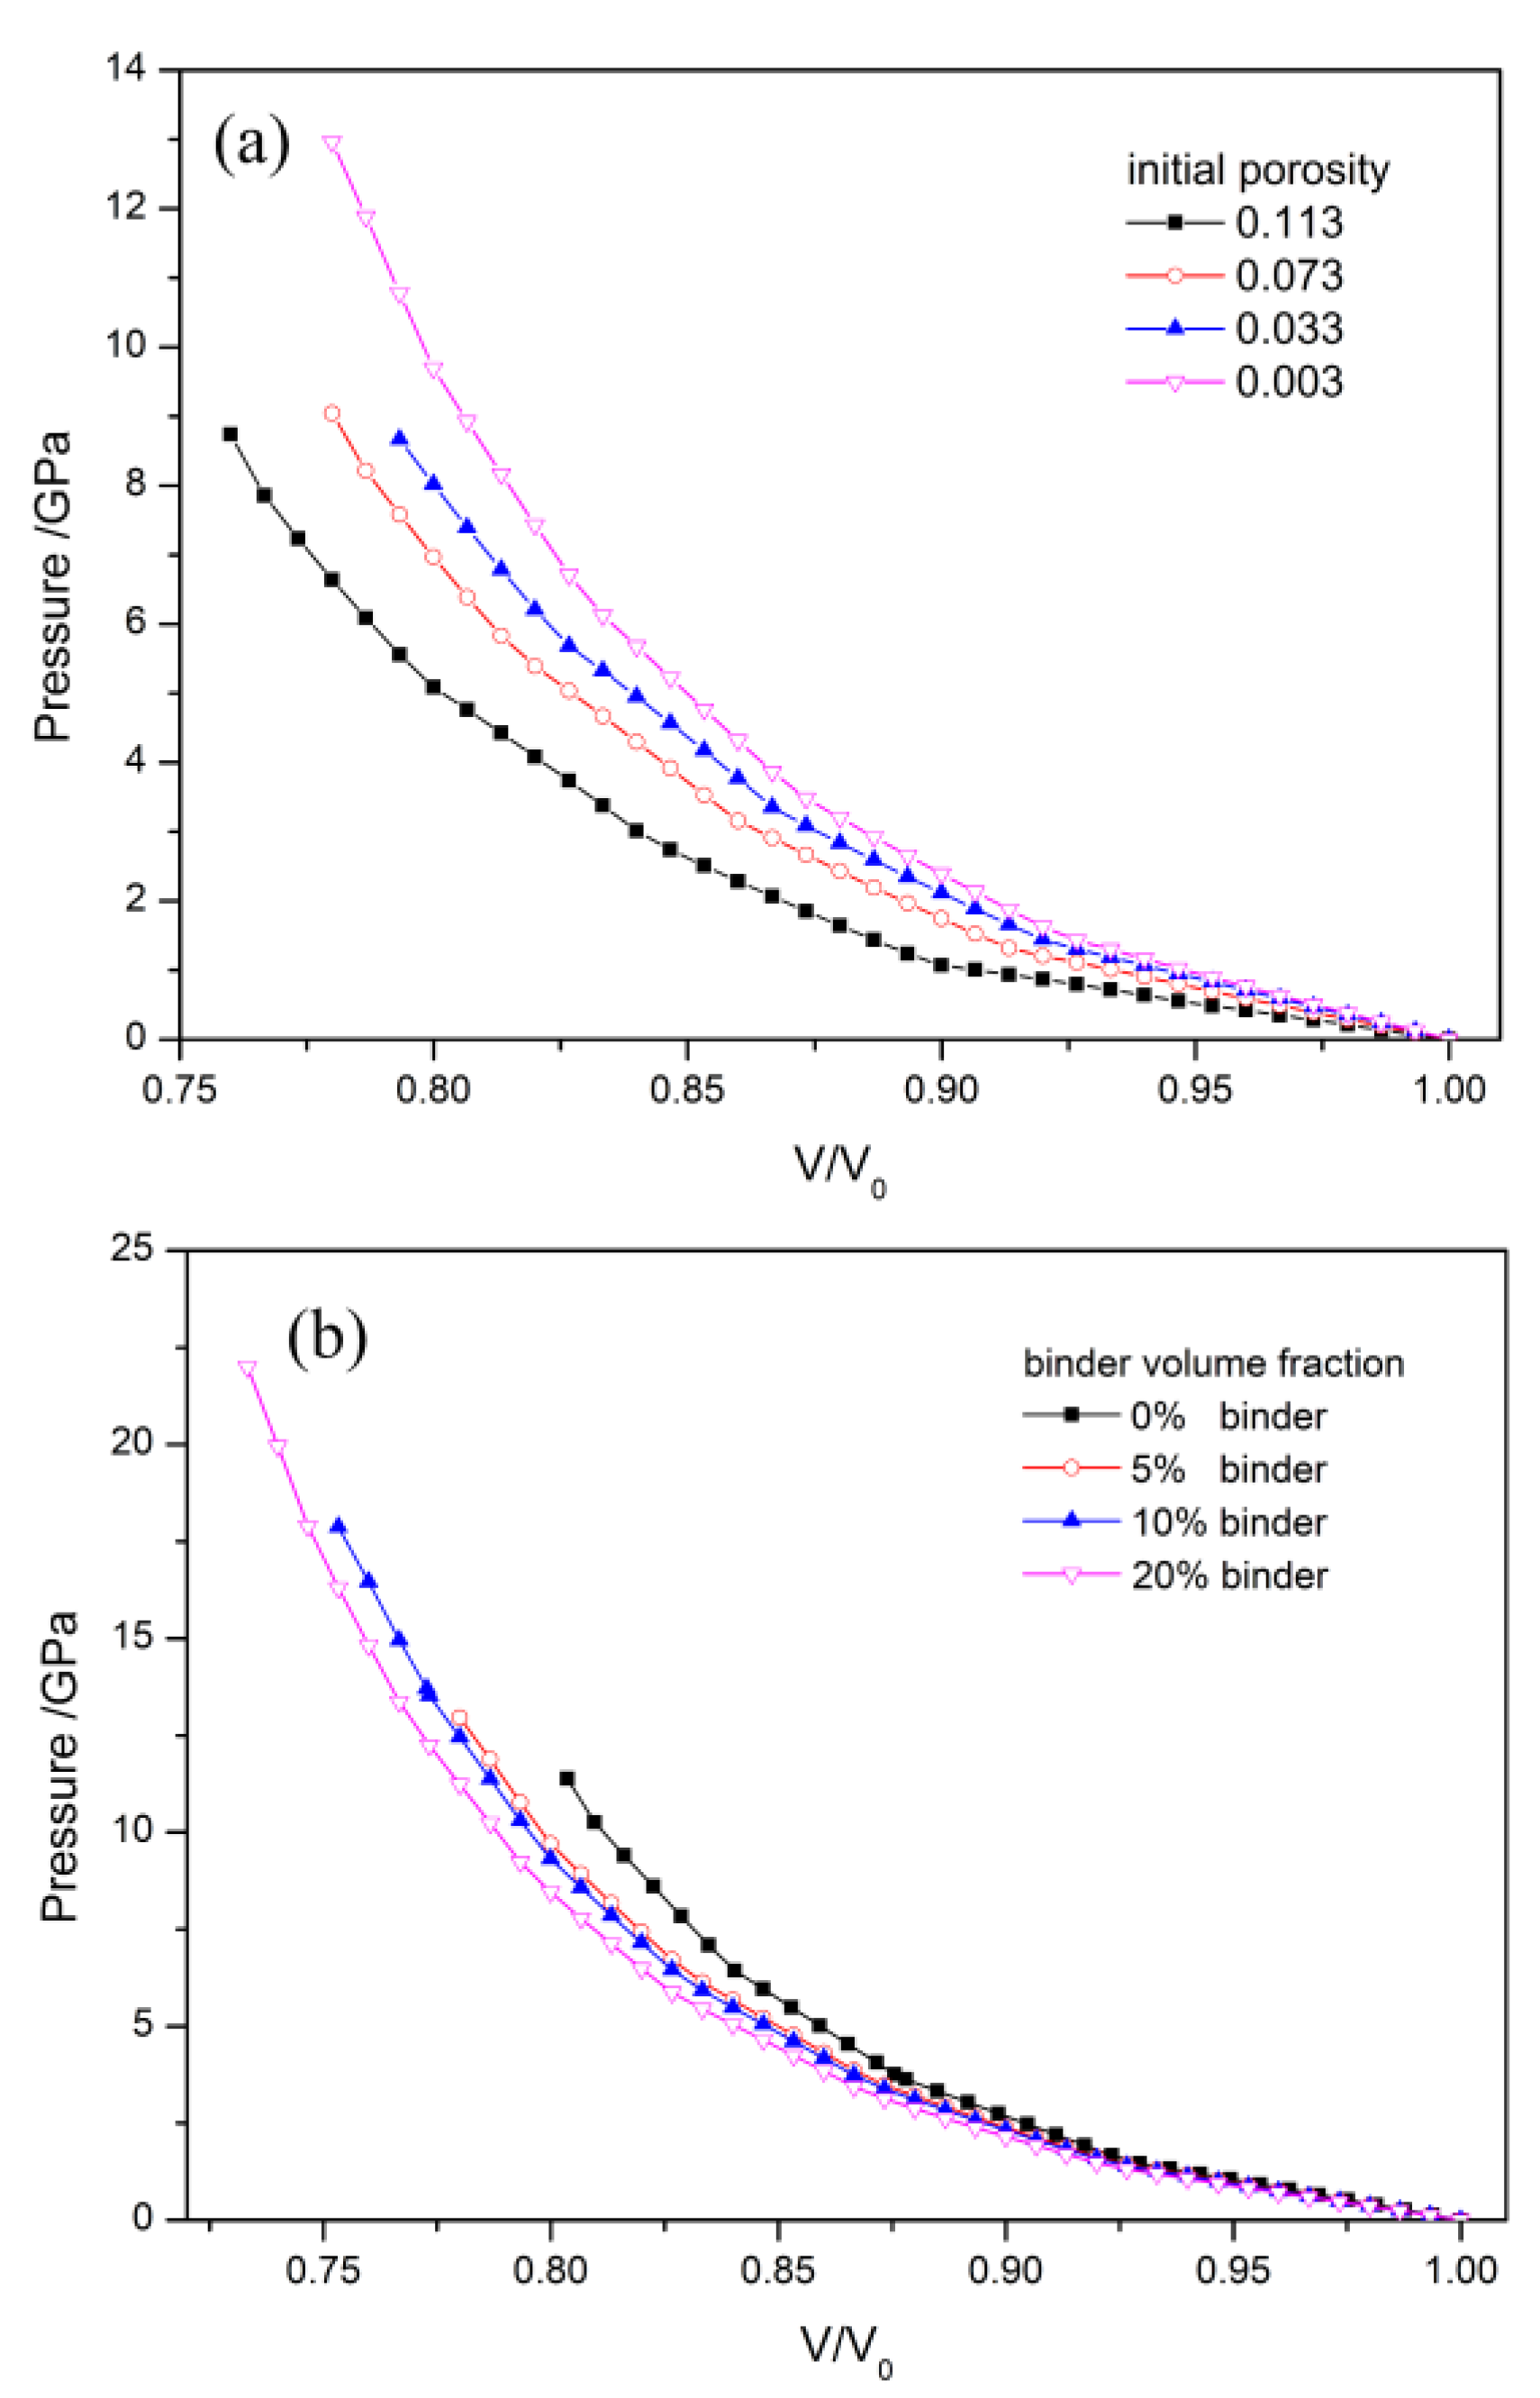
The PV isotherms of HMX/Estane PBX at different porosities and different binder volume fractions are plotted in
Figure 6.
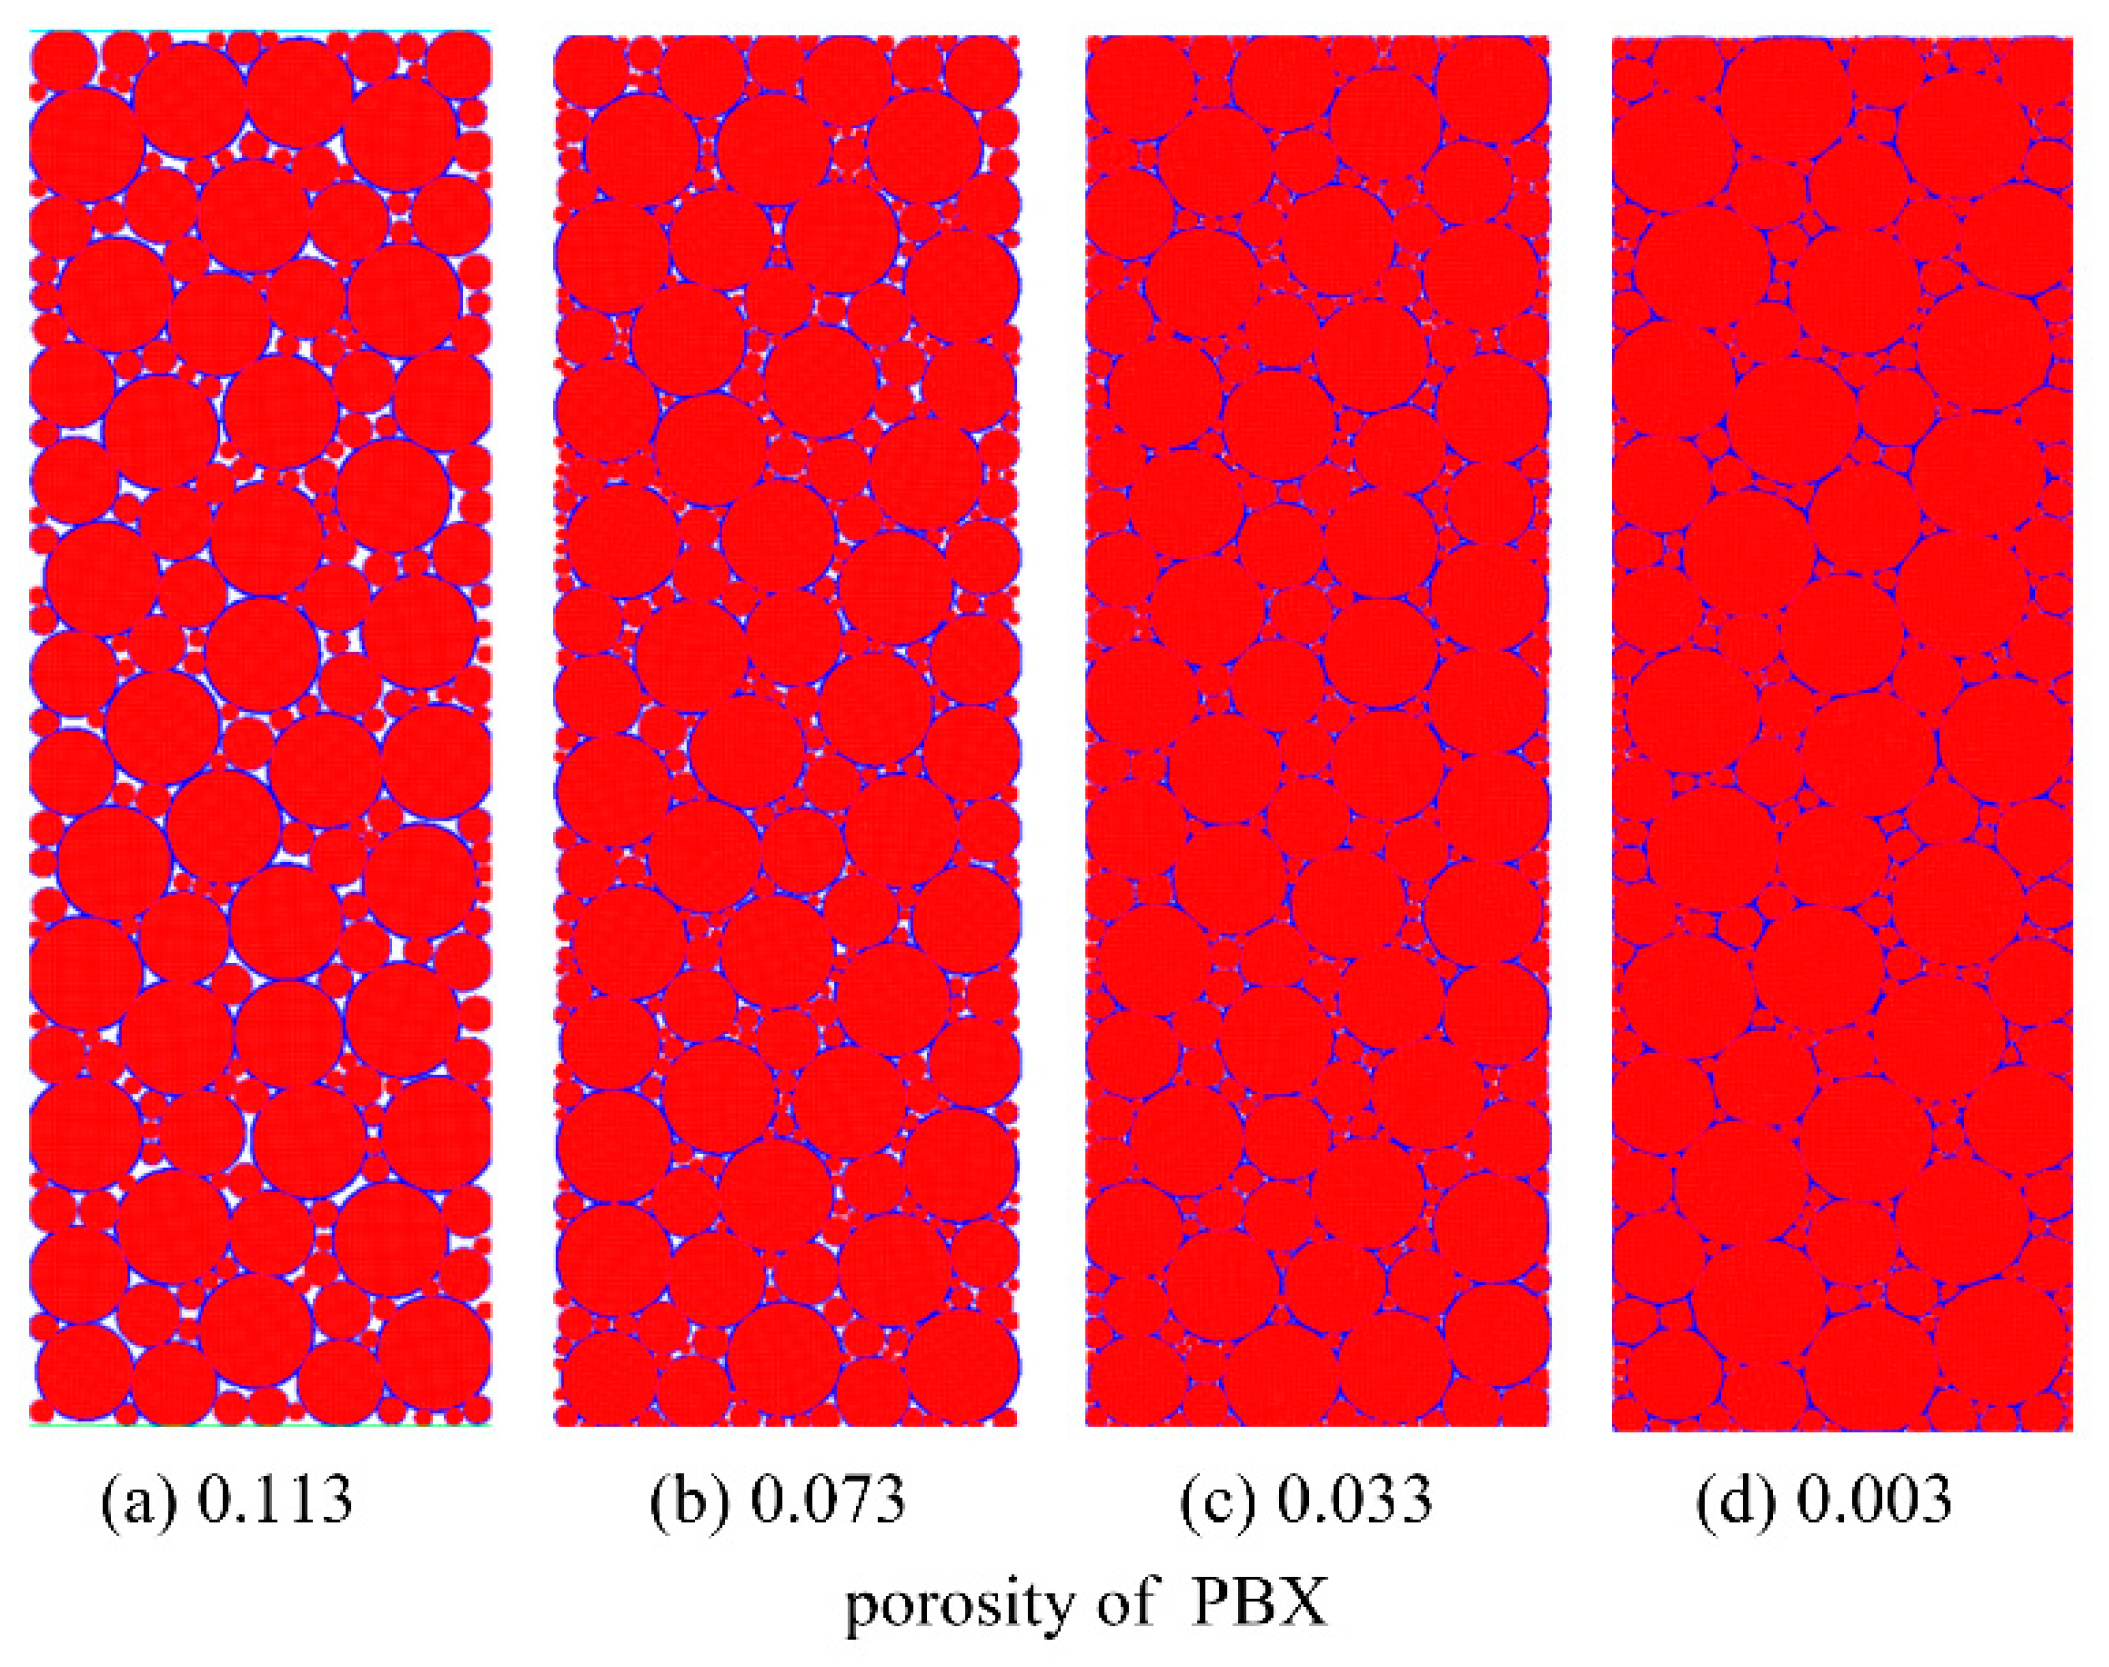
Figure 6a presents the PV data of the PBX at different porosities. The four porosities are 0.113, 0.073, 0.033, and 0.003, and their corresponding packing densities are 1.654, 1.728, 1.803, and 1.864 g/cm
3. Each PV isotherm shows two trends: a linear variation at an early time (high V/V
0), followed by rapid curved growth (low V/V
0). The linear variation is associated with the rearrangement and deformation of particles squeezing out void space. At this stage, a small compression pressure results in a large volumetric change. After void space is removed, the PBX becomes highly compact, and the volume change slows down with the increase in compression pressure. It is seen from
Figure 6a that at the same compression ratio the compression pressure decreases with the increase of porosity. A sample with smaller porosity has a higher packing density and therefore lower compressibility. It requires a large compression pressure for the same compression ratio, as shown in the experimental observation [
3].
Figure 6b shows the PV isotherms of the PBX at different binder volume fractions. The four volume fractions are 0%, 5%, 10%, and 20%, where 0% represents only the HMX component in the model. The PV isotherms show that at the same compression ratio, the compression pressure decreases with the increase in the binder volume fraction. Due to the addition of more binders, the elastic moduli of the PBX decrease, and the PBX becomes more elastoplastic. Bulk modulus, which is a form of elastic modulus and reflects the capacity of PBXs to resist external compression loading, decreases with the increasing binder volume fraction. Consequently, the compression pressure decreases at the same compression ratio. The simulations show that an increase in the porosity or the binder volume fraction in the PBX sample decreases in the compression pressure at the same compression ratio. Furthermore, comparisons between the curves of porosity and binder volume fraction suggest that porosity has a greater influence on compression pressure than binder volume fraction.
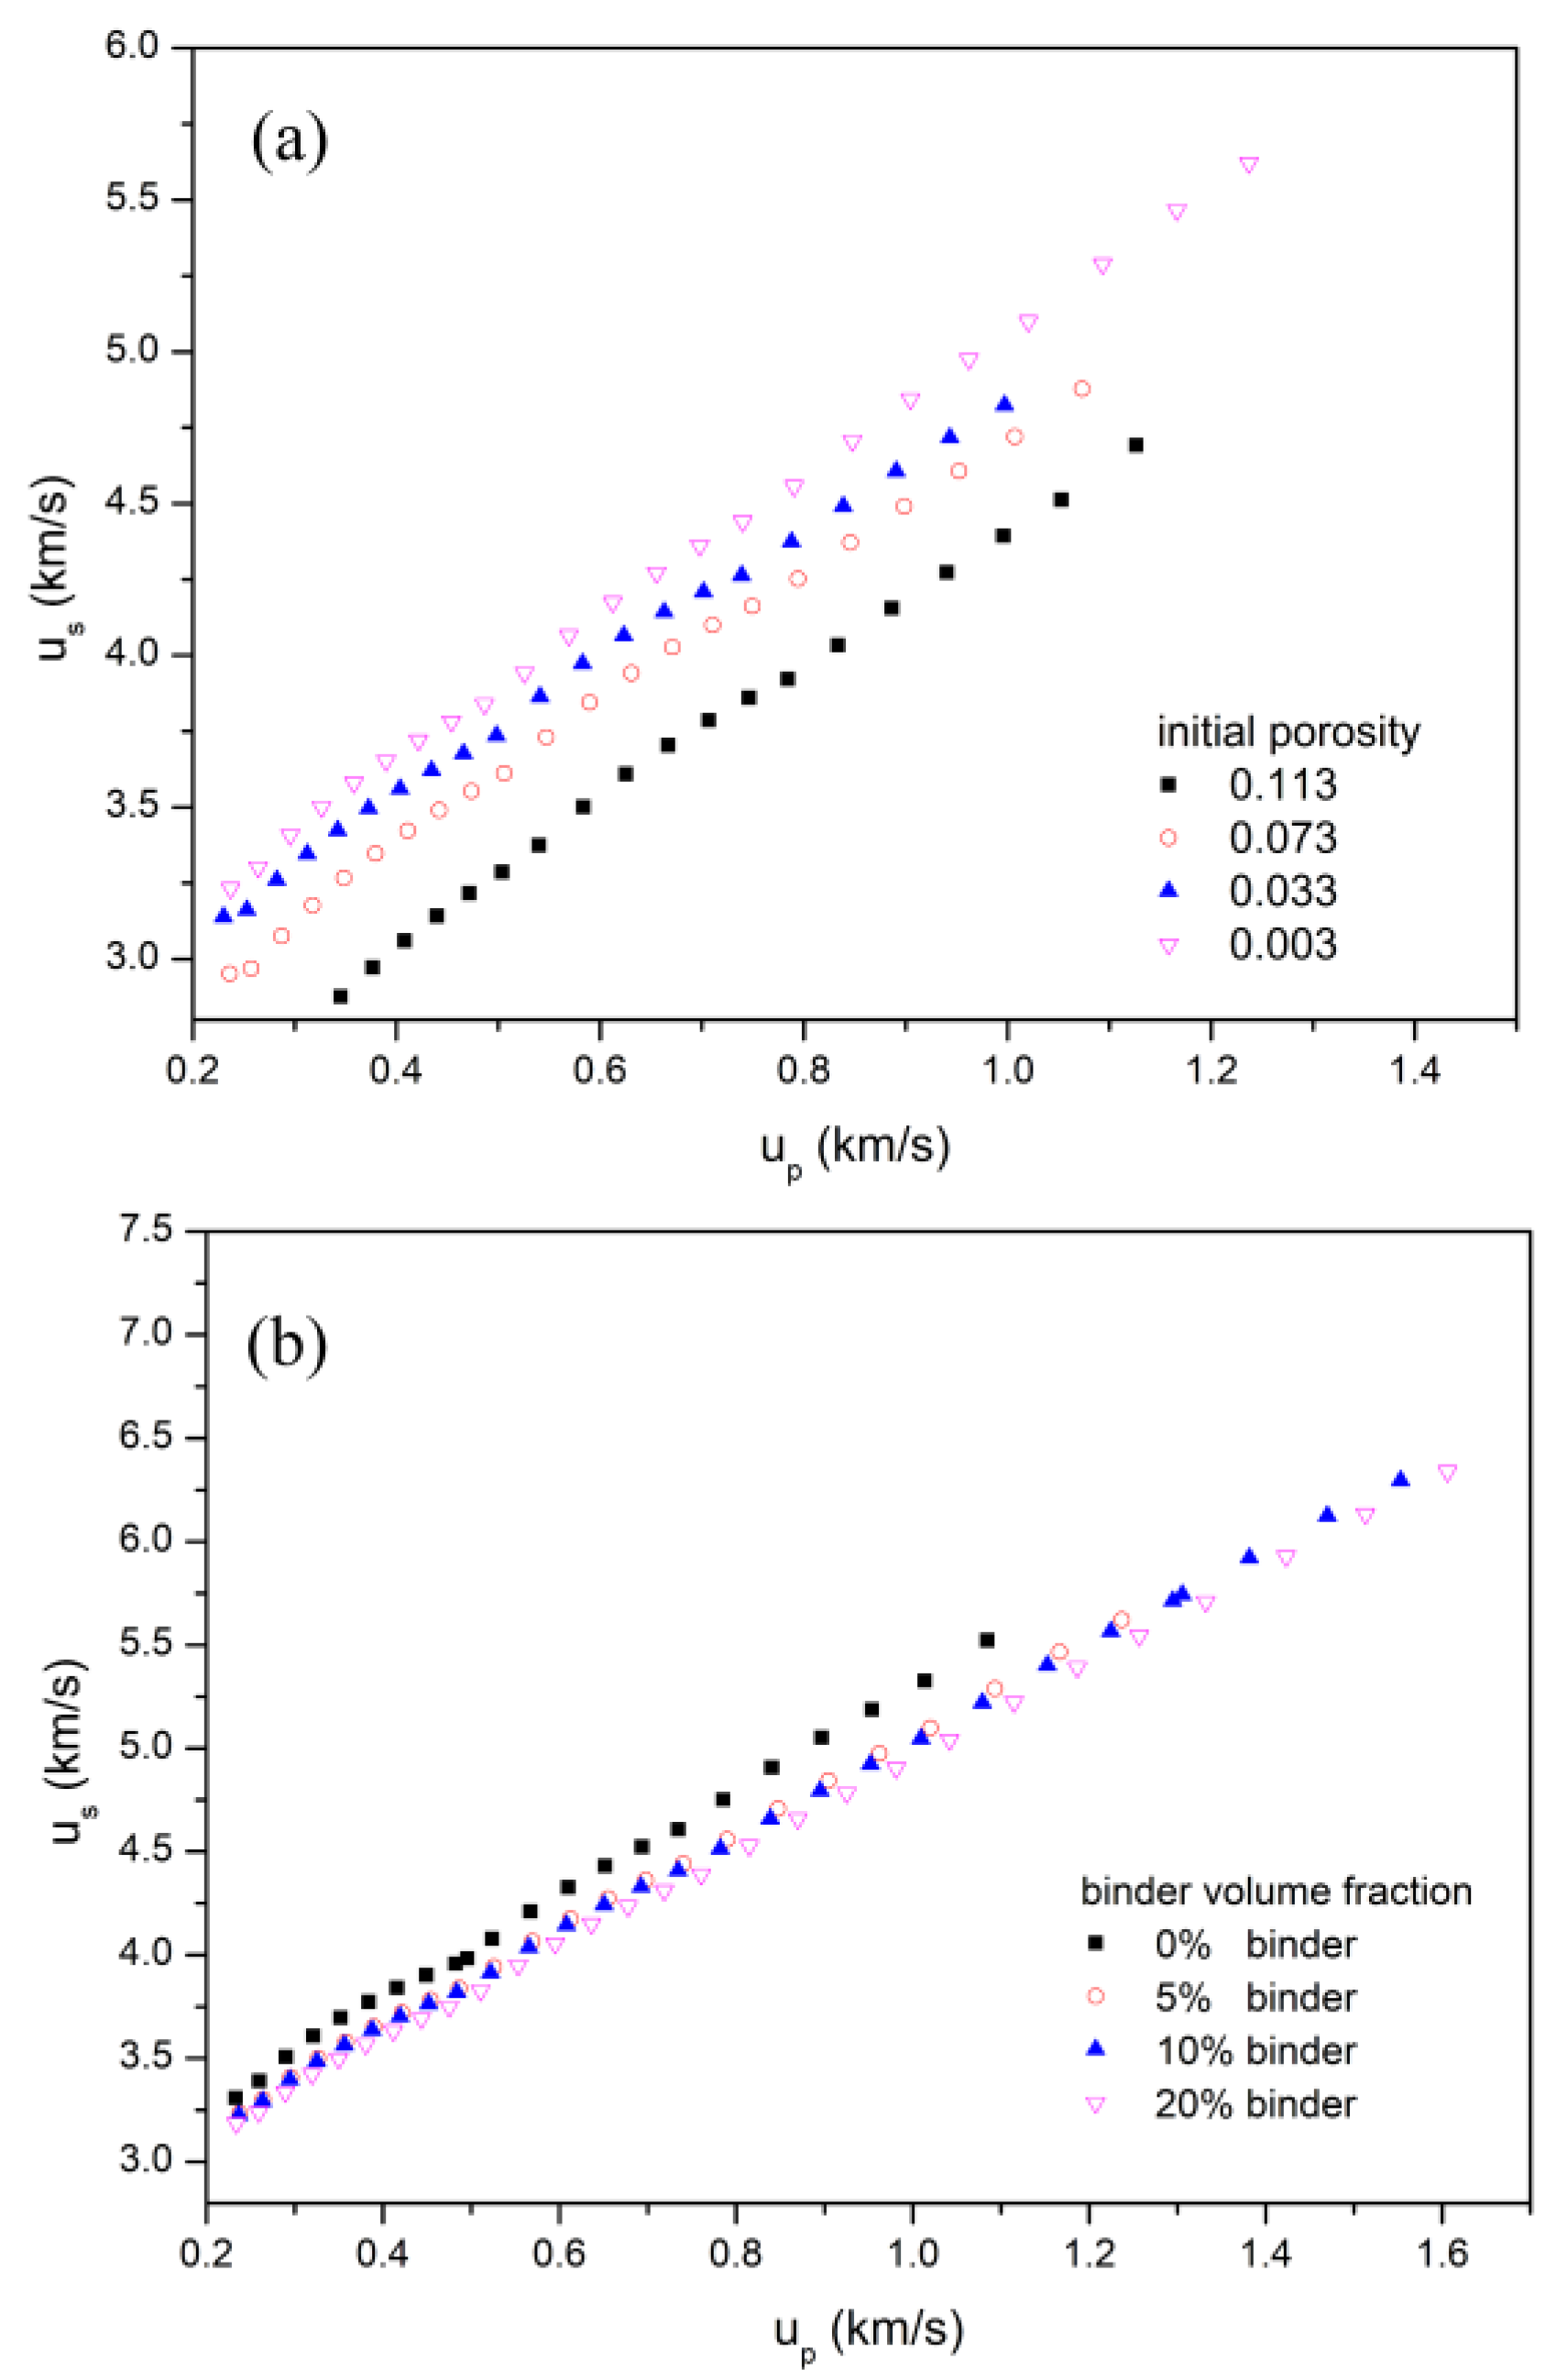
The Hugoniot data derived from the PV data of the PBX at different porosities and different binder volume fractions are plotted in
Figure 7a,b, respectively.
Figure 7a shows the Hugoniot data of the PBX at different porosities of 0.113, 0.073, 0.033, and 0.003, the corresponding packing densities of which are 1.654, 1.728, 1.803, and 1.864 g/cm
3, respectively. The linear fitted parameters of the Hugoniot data are listed in
Table 2. It is seen from
Table 2 that
decreases gradually with increasing porosity. However, no significant changes are observed for
when porosity increases. Experimental work by Gustavsen et al. [
49] showed a substantial difference of 0.18 km/s in the parameter
c of the calculated Hugoniots for PBX 9501 at typical densities (range from 1.80 to 1.837 g/cm
3) and at the theoretical maximum density (TMD = 1.86 g/cm
3).
Figure 7b shows the Hugoniot data of the PBX at the binder volume fractions of 0%, 5%, 10%, and 20%. The parameters
s and
c obtained from the linear curve fitting using Equation (16) are presented in
Table 3. It is seen that with the increase of binder volume fraction, the slope of the
us–
up curve, namely the dimensionless parameter
s of the Mie–Grüneisen EOS, also decreases. On the other hand, the parameter
c does not have a great decrease.
Table 3 suggests that mixing a small content of the binder with HMX particles reduces the parameters
c and
s of the EOS obviously, and further addition of the binder has little effect on the parameters’ values. Experimental shock loading analyses of the PBX [
51] reveal that for the PBX with the amount of the binder beyond a threshold value, the binder’s properties rather than the binder’s volume fraction exert a measurable influence on the shock sensitivity of the PBX. The authors in [
53] also reported that the EOS and constitutive relation of the PBX mainly depend on the properties of the binder (such as density, elastic modulus, etc.), but this has limited dependence on the binder volume fraction. This is consistent with the simulation results.
Simulated Hugoniot data for the PBX suggest that porosity and binder volume fraction both affect the equation of state under impact loading but in different ways. The porosity mainly affects parameter c, in that an increase in porosity leads to a decrease in c. However, the binder volume fraction mostly affects parameter s: An increase in binder volume fraction gives rise to a decrease in s. Therefore, the EOS of PBXs depends on both microstructures, such as porosity and mass ratio, of the HMX/binder.
4.3. Equation of State (EOS) Study
The isothermal compression simulations show that porosity and binder volume fraction have significant effects on the PV isotherms and Hugoniot data. Based on the PV variations obtained from the MPM mesoscale simulations, an effective EOS that can be used to study the PV isothermal properties of the PBX as well as porosity and binder volume fraction effective factors is obtained in the following procedures.
Normalized compression pressure
can be obtained as follows:
where
P is the compression pressure of a system and
is the pressure of a system when the compression ratio
= 0.80. The PV isotherms of the PBX at different porosities and different binder volume fractions are normalized and plotted in
Figure 8a,b, respectively. The normalized PV curves at different porosities are basically coincident, and the same can be said for different binder volume fractions. This allows the EOS fitting to be performed at any one of the four porosities and binder volume fractions.
The third-order Birch–Murnaghan EOS [
54] is used to analyze the compression curves for the PBX. The equation is as follows:
where
and
respectively refer to the zero-pressure isothermal bulk modulus and its pressure derivative with
,
is zero-pressure volume, and
V is the volume of the PBX under compression loading.
Based on Equation (18), the zero-pressure bulk modulus changes with the normalized pressure. One set of the normalized PV data is fitted to Equation (18) as shown in
Figure 8. The parameters are found to be
= 0.8765 and
= 23.27, where
is the normalized zero-pressure bulk modulus and
is the corresponding pressure derivative.
When the compression ratio
= 0.80, the relation between compression pressure and porosity is represented as Equation (19); also shown in Equation (20) is the relation between compression pressure and binder volume fraction.
where
and
are the reference porosity and reference binder volume fraction, taking the values of 0.003and 5%, respectively.
is the pressure at the reference porosity, and
refers to porosity effective factor.
is the pressure at the reference binder volume fraction, and
refers to the binder volume fraction effective factor. Each porosity or binder volume fraction has its corresponding reference pressure
, as listed in
Table 4 and
Table 5 for the four porosities and four binder volume fractions.
= 9.668 GPa and
= 0.0168; these values are obtained by fitting the data in
Table 4 into Equation (19). The values of
= 10.02 GPa and
= 0.0724 are obtained by fitting the data in
Table 5 into Equation (20).
Based on Equation (17), the relations among the parameters
,
, and
can be expressed as:
The parameters in the Equations (18) to (23) obtained by fitting the corresponding variables with porosity and binder volume fraction effective factors are given in
Table 6.
Using
Table 6, the zero-pressure isothermal bulk modulus and its pressure derivative with porosity,
and
, are as follows:
The zero-pressure isothermal bulk modulus and its pressure derivative with binder volume fraction,
and
, are as follows:
where
and
are respectively the specific values of porosity and the binder volume fraction.
Similar relationships between effective factors and the parameters
c and
s in the
us–
up plane of the PBX can be expressed as:
where
and
are the reference porosity and reference binder volume fraction, taking the values of 0.003 and 5% respectively;
and
are the parameters fitting to the
us–
up curve at the reference porosity;
and
refer to porosity effective factors. Here,
and
are the parameters fitting to the
us–
up curve at the reference binder volume fraction, and
and
refer to the porosity effective factors. The parameters obtained by fitting the data in
Table 2 and
Table 3 to Equations (26) and (27) are given in
Table 7.
It is seen in
Table 7 that
, indicating that porosity has a greater influence on parameter
c, i.e., the bulk wave speed of PBX, than the binder volume fraction. Here,
c plays an important role in shock wave propagation. Comparisons with the parameters obtained from the effective factors of porosity and binder volume fraction suggest that porosity has a greater influence on Hugoniot data. Porosity is related to pores in a compressed system, and the authors in [
55] found that density heterogeneity is always located at the parts where pores exist. These locations may become the failure zones for the existence of microcracks.
The pressure–volume data were used to determine certain thermodynamic parameters (bulk modulus, first pressure derivative of the bulk modulus) of the Birch–Murnaghan EOS, which can demonstrate the suitability of an EOS at different pressures, especially at high pressure. Hugoniot data derived from isothermal curves will provide quantitative measurements for shock parameters. Therefore, the effective EOS fitted in this research can be used to predict some thermodynamic and mechanical properties, such as the initiation process of the PBX under extreme conditions.
4.4. Bulk Modulus and Its First-Order Pressure Derivatives
The bulk modulus is given as
for different pressure, so the expression for bulk modulus from Equation (18) comes out as:
The corresponding expression for the first-order pressure derivative of the bulk modulus
obtained from (28) comes out as:
where
and
are respectively the zero-pressure bulk modulus and its pressure derivative. Variations of the isothermal bulk modulus
and its pressure derivative
with pressure for the PBX with 0.003 porosity and 5% binder volume fraction by using the Birch–Murnaghan EOS are shown in
Figure 9a,b, respectively.
Figure 9 shows that with the increase in pressure,
increases continuously, while
decreases progressively with the increase of pressure and gradually becomes asymptotic. Stacey et al. [
56] suggested a few basic criteria of an EOS for its validity and applicability. These are as follows:
In the limit of infinite pressure, V/V0 → 0.
With the increase in pressure, the isothermal bulk modulus increases continuously, and in the limit of infinite pressure, → ∞
must decrease progressively with the increase in pressure, and remains greater than 5/3 in the limit of infinite pressure.
The results of this study show that the effective EOS derived from mesoscale simulations satisfies the above three criteria based on thermodynamic relations.


