Article

Comparison of Two Different Designs of a Scraped Surface Crystallizer for Desalination Effect and Hydraulic and Thermodynamic Numbers

1
Center for Mass Spectrometry and Optical Spectroscopy, Mannheim University of Applied Sciences, Paul-Wittsack-Straße 10, 68163 Mannheim, Germany
2
Chair of Brewing Science, Department of Food Technology and Food Chemistry, Technische Universität Berlin, Seestraße 13, 13353 Berlin, Germany
*
Author to whom correspondence should be addressed.
Processes 2020, 8(8), 971; https://doi.org/10.3390/pr8080971
Submission received: 10 July 2020 / Revised: 3 August 2020 / Accepted: 7 August 2020 / Published: 12 August 2020
(This article belongs to the Special Issue Design, Control and Optimization of Desalination Processes)

Abstract

:
The design of a desalination plant is most important if the desired product purity has to be as high as possible. This is also true for freeze crystallization plants. A correct solid-to-liquid ratio has to be ensured when pressing is used as a post-treatment. Thus, the dependence of the overall plant design on the achieved ice quality but also on different hydraulic and thermodynamic numbers is important. In this research, a scraped screw crystallizer plant is presented and examined for two different screw designs. Experiments with a low initial concentration, as for the usage to desalinate groundwater to gain it as process water, were conducted. Furthermore, solutions with high initial concentrations simulating seawater to produce potable water were used as another set of test solutions. The findings showed that neither of the screw designs is more favorable than the other, but it is important to have a plant design fitting the existing parameters on site.

1. Introduction

Desalination is one of the most important future technologies for guaranteeing a steady supply of potable water. Most processes are based on either thermal desalination in case of evaporation or reverse osmosis. [1] However, freeze desalination can basically be used in the same way as other technologies but has the advantage of an easier combination with renewable energies, an adjustable scale, and the lack of necessary chemicals [1,2,3,4]. Despite the missing practical realization, freeze desalination can still be a promising technology for the future. Further investigations are being performed and more knowledge is being gained to improve the technology for a more feasible process. [5] Nevertheless, a lot of research has still to be done in order to find a possibility to crystallize seawater with the aim of desalinating and further treating it so that potable water can be produced economically. Many researchers work with washing as a chosen technology to clean the still-contaminated ice but have to live with the disadvantage of using the product and consequently losing it during this process step [6,7,8,9,10,11]. Another method would be centrifuging the ice mass, but because of the non-Darcy effect, the ice has to be crushed and heated at least to the point of melting in order to achieve the best separation of the salty solution and clean ice [12]. Pressing, thereby, can be a potentially better way, but it is technologically hard to realize within a continuously operating plant, especially for a possible melting product. For small plants, a screw conveyor combined with a pressing cone is a possibility [13,14]. However, changes of the screw conveyor can influence the overall results and lead to some optimizations of the process [15]. This paper gives further information on the topic of freeze desalination performed with a scraped surface crystallizer equipped with a screw conveyor and pressing cone. The already-published experimental plants are therefore further compared with results and numbers, which have not yet been published. Thus, these results offer further insights into the advantages of the one or the other screw design and shall help in the design of future freeze desalination plants.

2. Materials and Methods

2.1. Reagents and Sample Analysis

As a test solution with high concentration, sodium chloride with water was used to simulate seawater. Furthermore, a solution prepared with tap water from Mannheim, Germany—which has a high concentration of carbonates—and ammonium nitrate, manganese sulfate, and urea was prepared to simulate a contaminated water source with a low ion concentration for later usage as process water. Thereby, all chemicals were purchased from Sigma Aldrich, Darmstadt, Hesse, Germany. The different concentrations of the test solutions are shown in Table 1. All samples were prepared, tested, and repeated as described in previously published papers [13,14,15]. This is also applicable for the analysis of the different solutions using either a conductivity meter or a photometer [13,14,15]. The crystal area for each crystal of a sample was measured using a self-made cooling chamber together with a camera and the ImageJ software from the National Institutes of Health, MD, Maryland, USA [16], and as also described in previous papers [13,14,15].

2.2. Data Analysis

The removal efficiency (R) is calculated using the initial concentration (cFeed) and the concentration of the desalted ice (cIce) (Equation (1)).
R = (1 − cIce/cFeed) × 100%
Furthermore, the heat flow (Q) and the heat transition coefficient (h) were calculated from data measured during the experiments. Those data were the temperatures of the solution and the cooling liquid as well as the corresponding mass flows along with the properties of these solutions. All of these can also be looked up in the papers [13,14,15]. In the text, some statements refer to the heat transition coefficient and some, to the heat transfer coefficient. Besides, it is always highlighted which number is meant; it helps to know what it means. The heat transfer coefficient refers to the thermodynamic number influencing the heat transfer from liquid to solid at one special transfer regime, for example. The heat transition coefficient, thereby, is composed of several heat transfer coefficients providing information about the overall transfer regime.

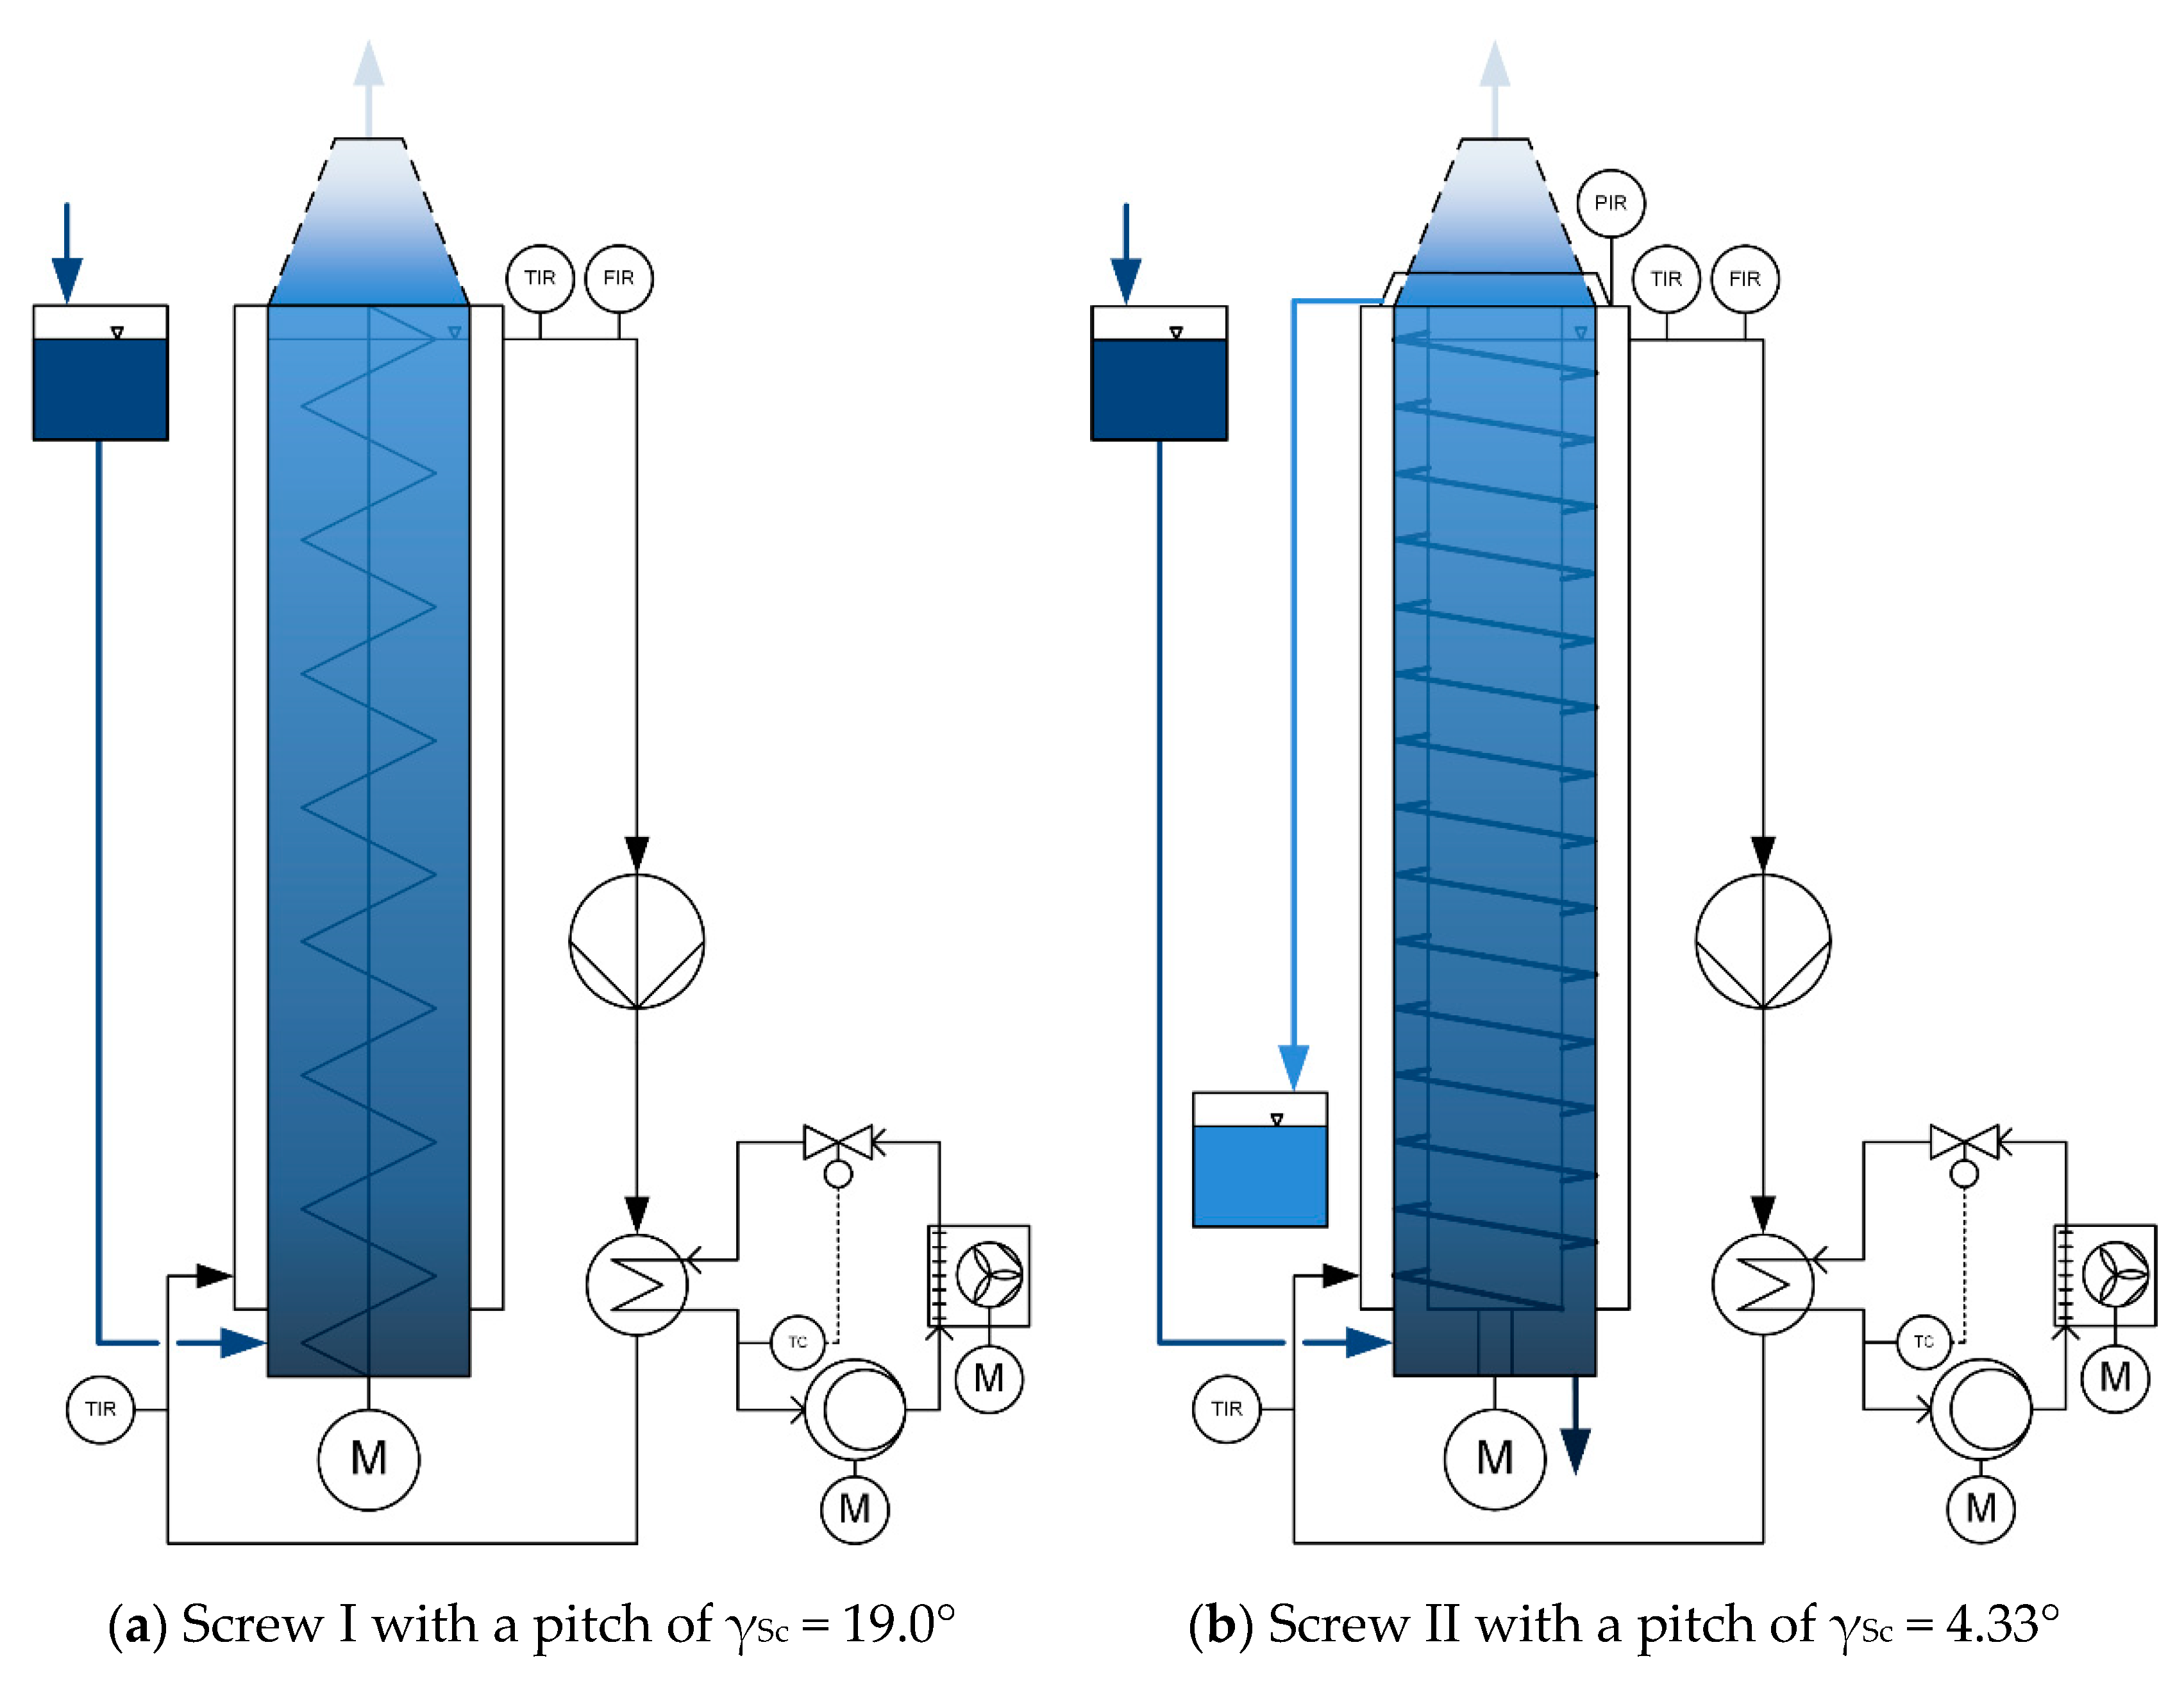
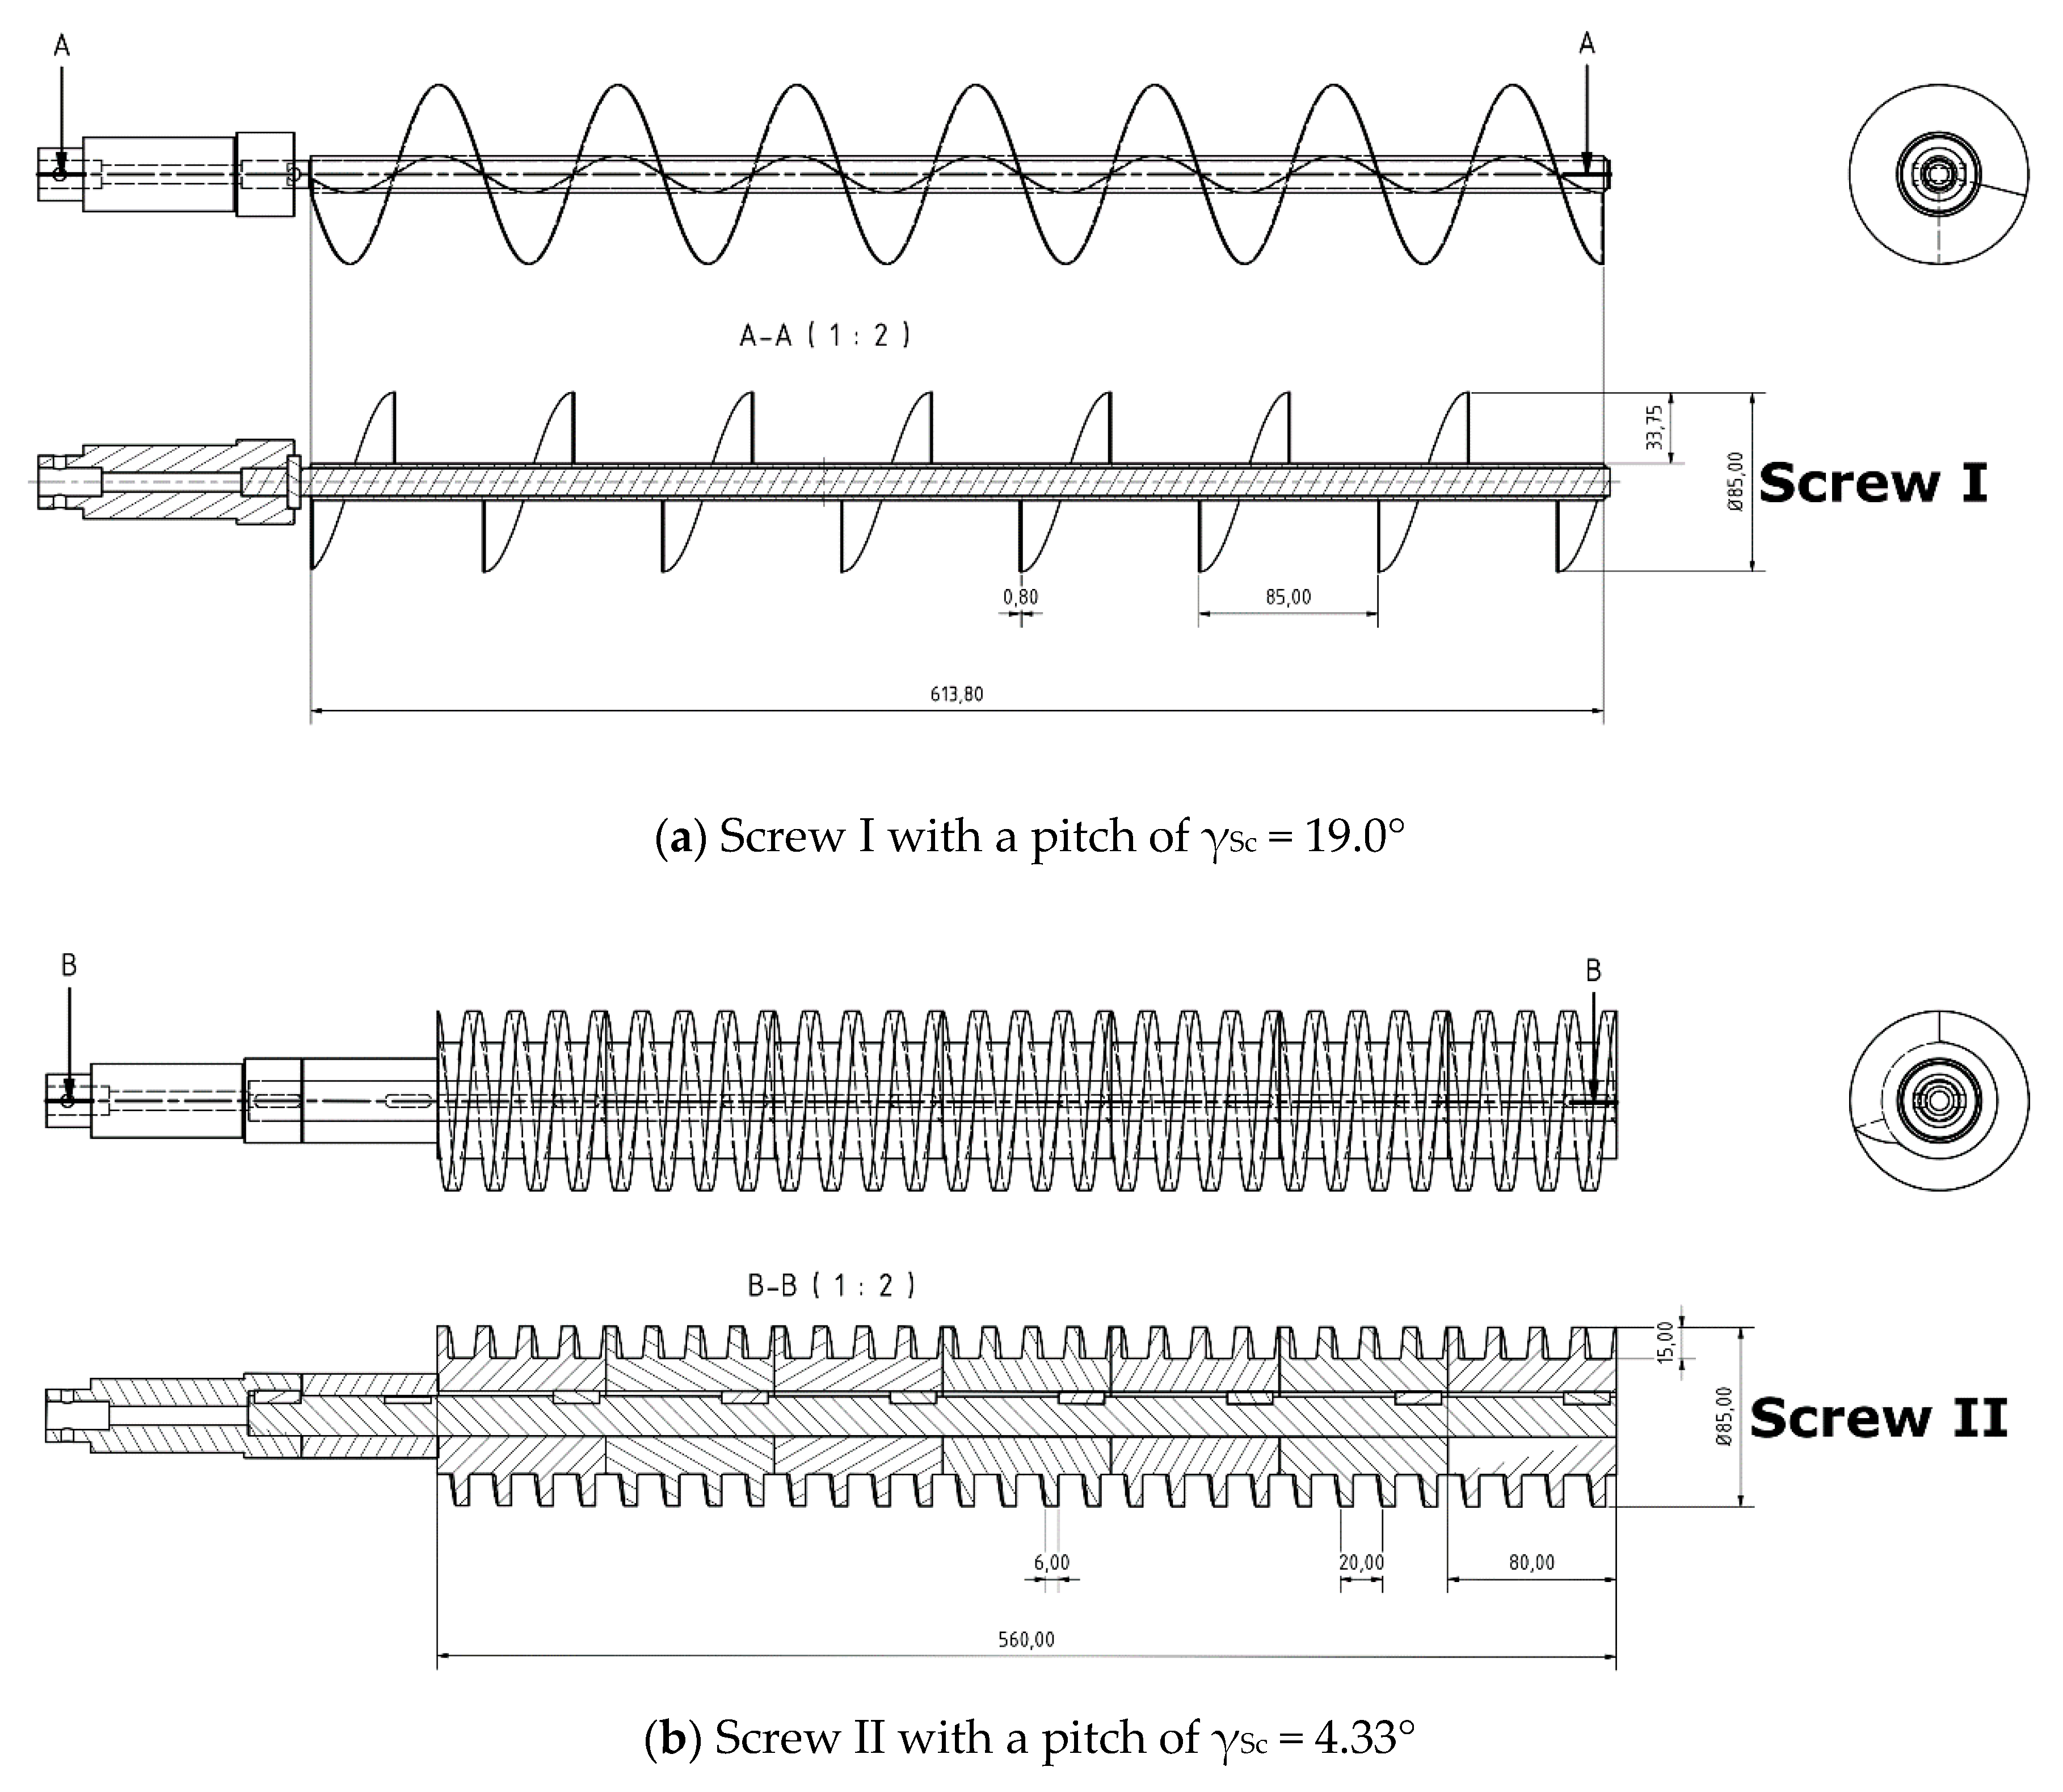
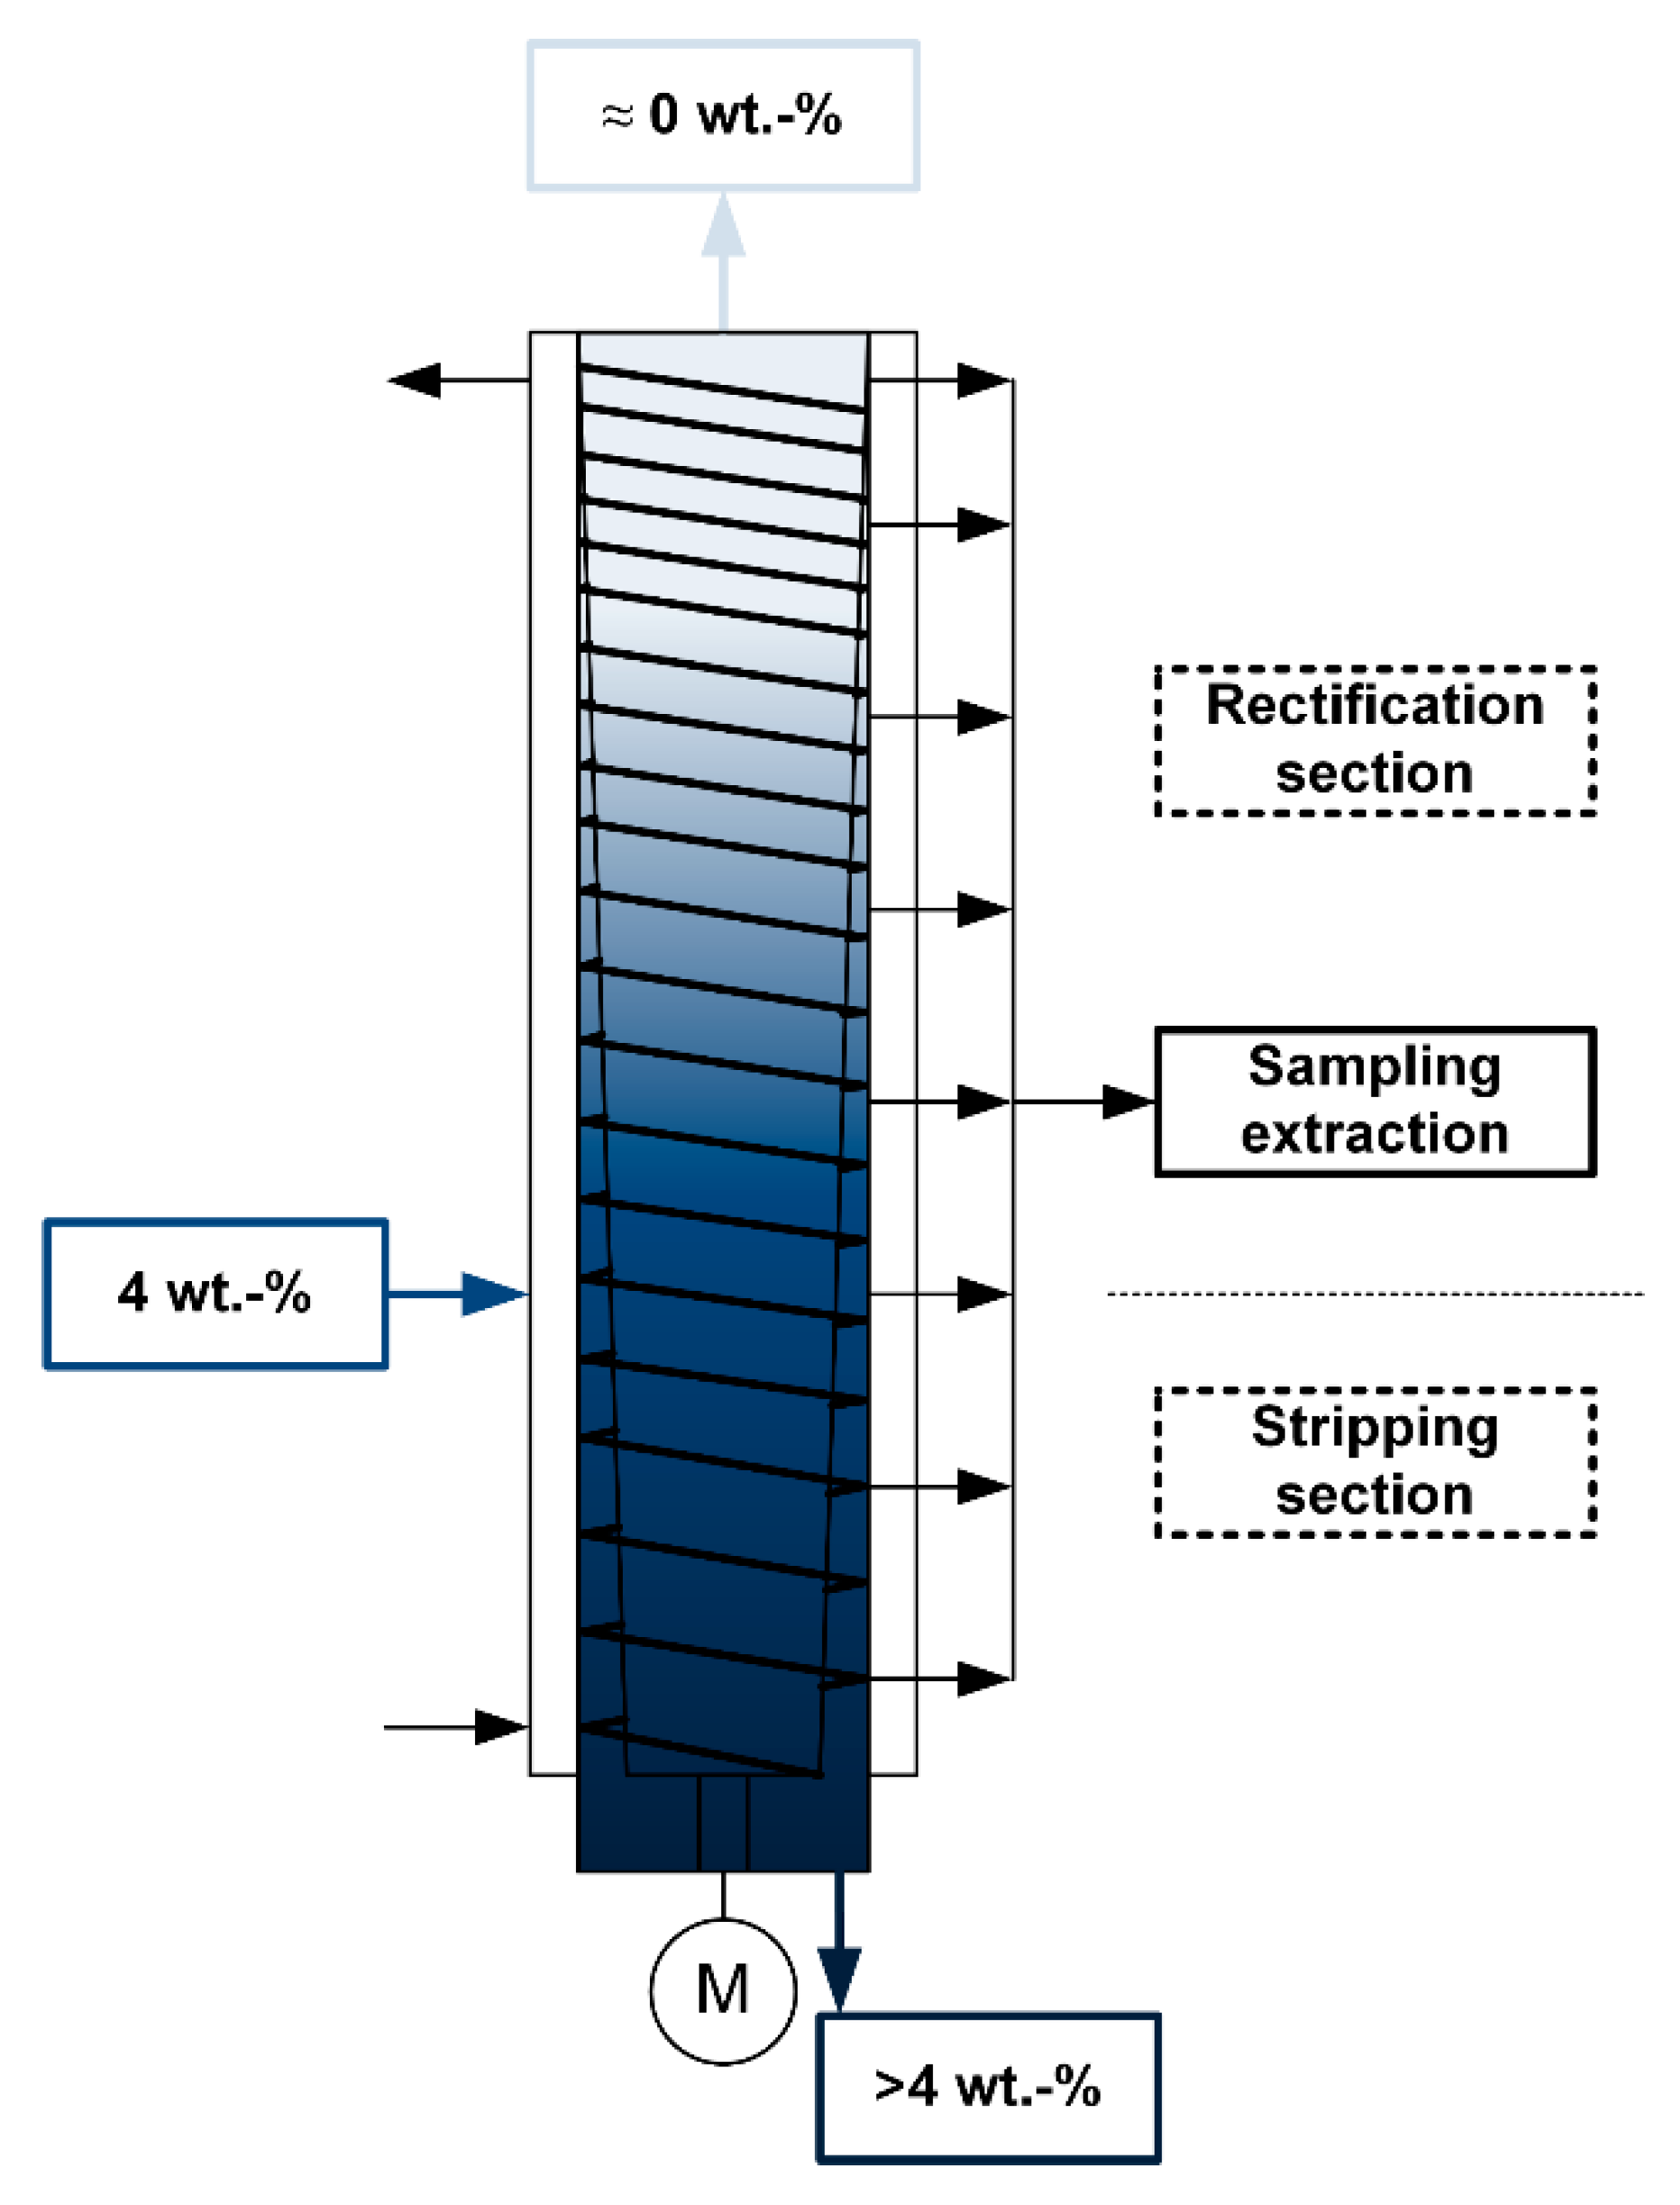
2.3. Experimental Setup

The test plant is based on a scraped surface crystallizer, where a screw works as a scratcher to remove ice from the cooling surface as well as to transport it to the cone where the liquid concentration is separated from the solid ice. This principle is based on basic research describing pressing as a post-treatment for an ice/water mixture produced from seawater through cooling crystallization [17]. However, the initially developed test plant can be seen in Figure 1a. A double-walled vessel equipped with a screw with a pitch of 19.0° and connected to a cooling system was installed and tested. After several tests with seawater with a high salt concentration and a simulated solution with a low ion concentration and with different cooling temperatures and rotational speeds of the screw, the test plant was modified. For this, a new screw, with a pitch of 4.33°, and a pressing force sensor were installed (Figure 1b). Furthermore, a collector for the concentrate leaving the pressing cone was attached to the plant. The new setup was then used to desalinate the simulated seawater with a high initial concentration. The desalination of a solution with low salt concentration was not feasible because of the higher hardness of the ice and the insufficient power of the gear motor.
The construction design of the two different screws can be seen in Figure 2. The upper screw (Screw I) is the one with the higher pitch and thinner flights. This one is usually used for the vertical transport of powder-like materials. The lower screw (Screw II) is the one with the lower pitch and with thicker flights leaving less space between the flights. Furthermore, the upper screw is made out of one piece where the flights are welded to the shaft. The flights of the screw with the lower pitch were turned out of the material, which was divided into several pieces because of the dimensions of the lathe. Each part was fixed to the shaft via a keyway and key. The shaft was then fixed to a shaft support—in case of the upper screw, via a stainless steel pin, and in case of the lower screw, via a keyway and key. The shaft support was connected to several bearings and, finally, to the gear motor via pins [13,14,15].

3. Experimental Results and Discussion

Both setups were described and tested, and some of the results have already been published in papers [13,14,15]. Nevertheless, a comparison of the results for the different screws has not been published yet. Parameters such as the ice crystal area of the pressed and unpressed ice depending on the cooling temperature or the rotational speed of the screw are important to know. Furthermore, a dependence of the removal efficiency on the used screw and the corresponding heat flow and heat transition coefficient is of great interest for further research in this field.

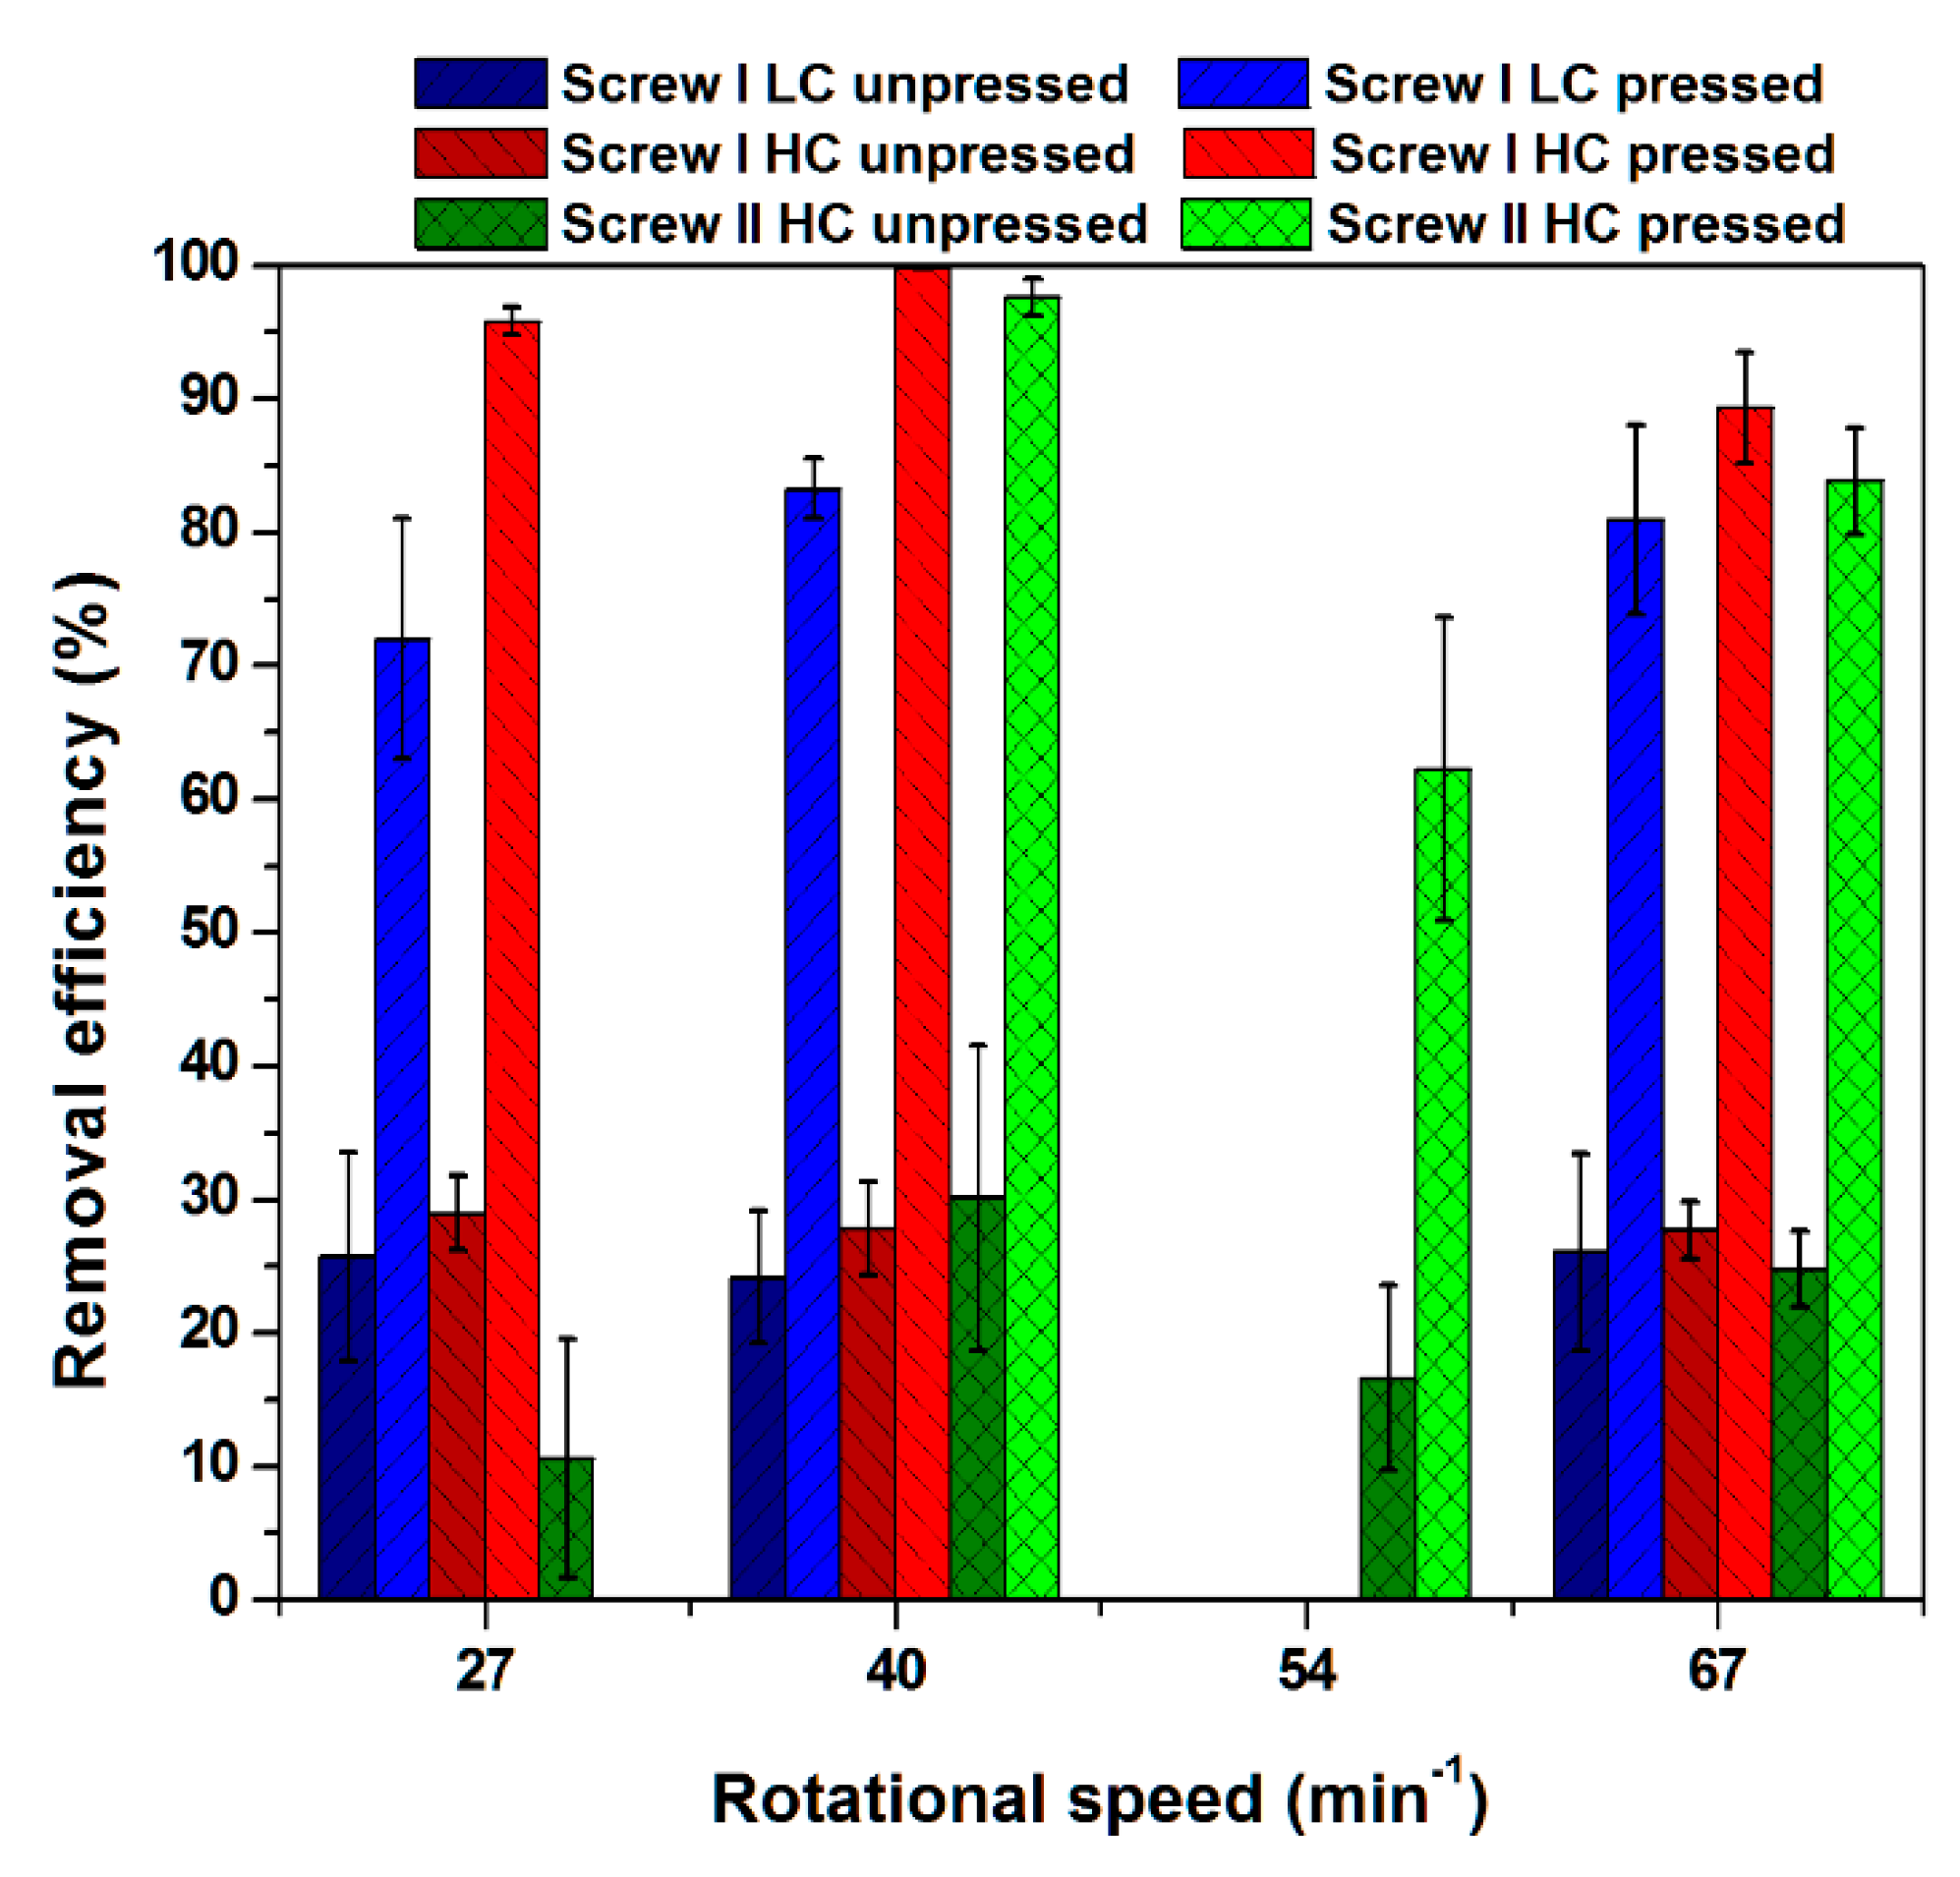
3.1. Removal Efficiency

The removal efficiencies of Screw I and II for pressed and unpressed ice for experiments with high and low ion concentrations depending on the cooling temperature are shown in Figure 3. Because of the different screw designs, the experiments could not always be performed at the same cooling temperatures. Some operational conditions had too-hard conditions leading to a halt of the motor. This was the case for cooling temperatures below −10 °C for Screw II for high initial concentrations and for Screw I for low initial concentrations. Nevertheless, it is apparent that the best results in terms of removal efficiency were feasible under mild conditions. However, mild conditions mean high cooling temperatures of around −4 to −7 °C. Decreasing the temperature led to a less efficient process with lower removal efficiencies. This is due to the increased ice growth and hardness of the ice and subsequent less efficient pressing within the cone. As for the operational conditions different from the specifications that led to the design of the cone, the results differ quite substantially. That means that the cone should have been more tapered to achieve the same efficiencies. However, it has to be mentioned that the experiments were performed at different rotational speeds. For Screw I, a speed of 40 min−1 was set, and for Screw II, a speed of 67 min−1 was set, due to a more stable process for the particular screw design.
Changing the rotational speed at similar cooling temperatures led to a different behavior with a larger effect on the removal efficiency (Figure 4). Screw I with low initial concentrations showed a low removal efficiency at slow rotational speeds. Furthermore, the removal efficiency was always lower than that for the same screw with high initial concentrations. Besides at the lowest rotational speed, where no pressed ice could be gained, Screw II also showed better results than at the low initial concentrations. The best results were achieved at 40 min−1, which, again, was the basic specification of the plant design. This shows, again, that such a design can only be used when conditions are well known or are adjustable to fit the correct parameters, such as the initial concentration and mass flow. The missing datapoints at a rotational speed of 54 min−1 are due to a later change of the plant allowing more step sizes of the gear motor.

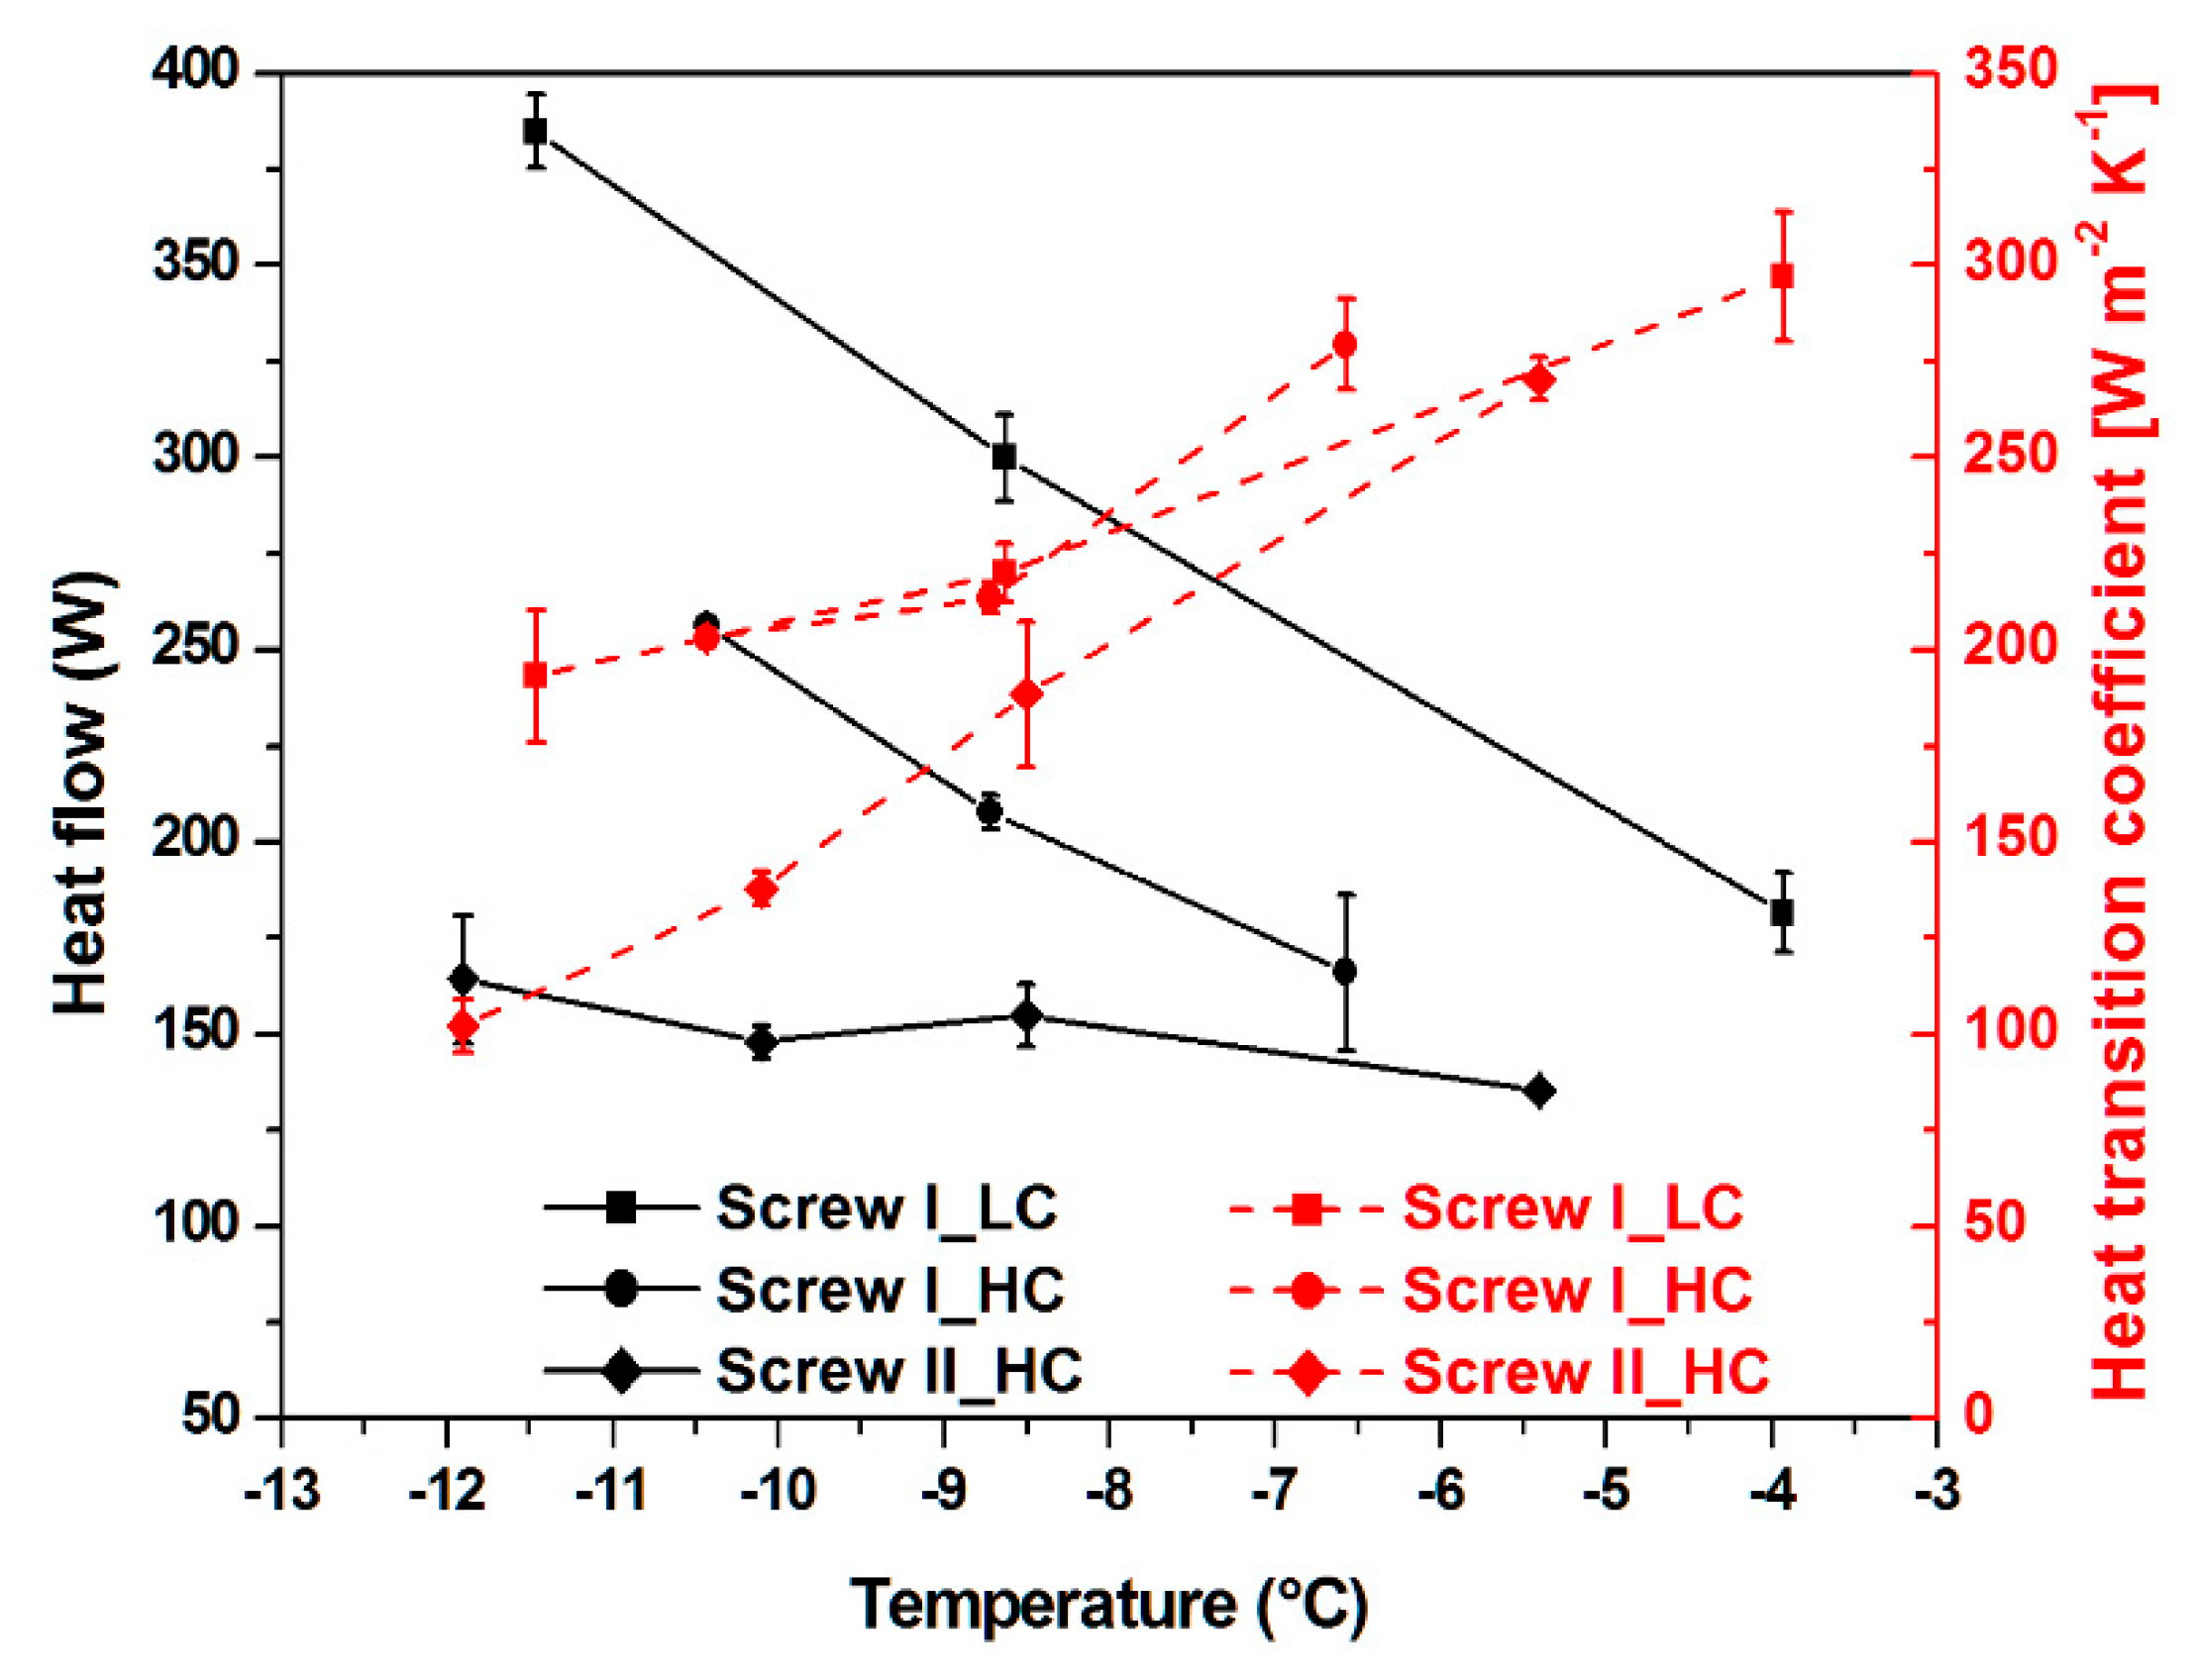
3.2. Heat Flow and Heat Transition Coefficient
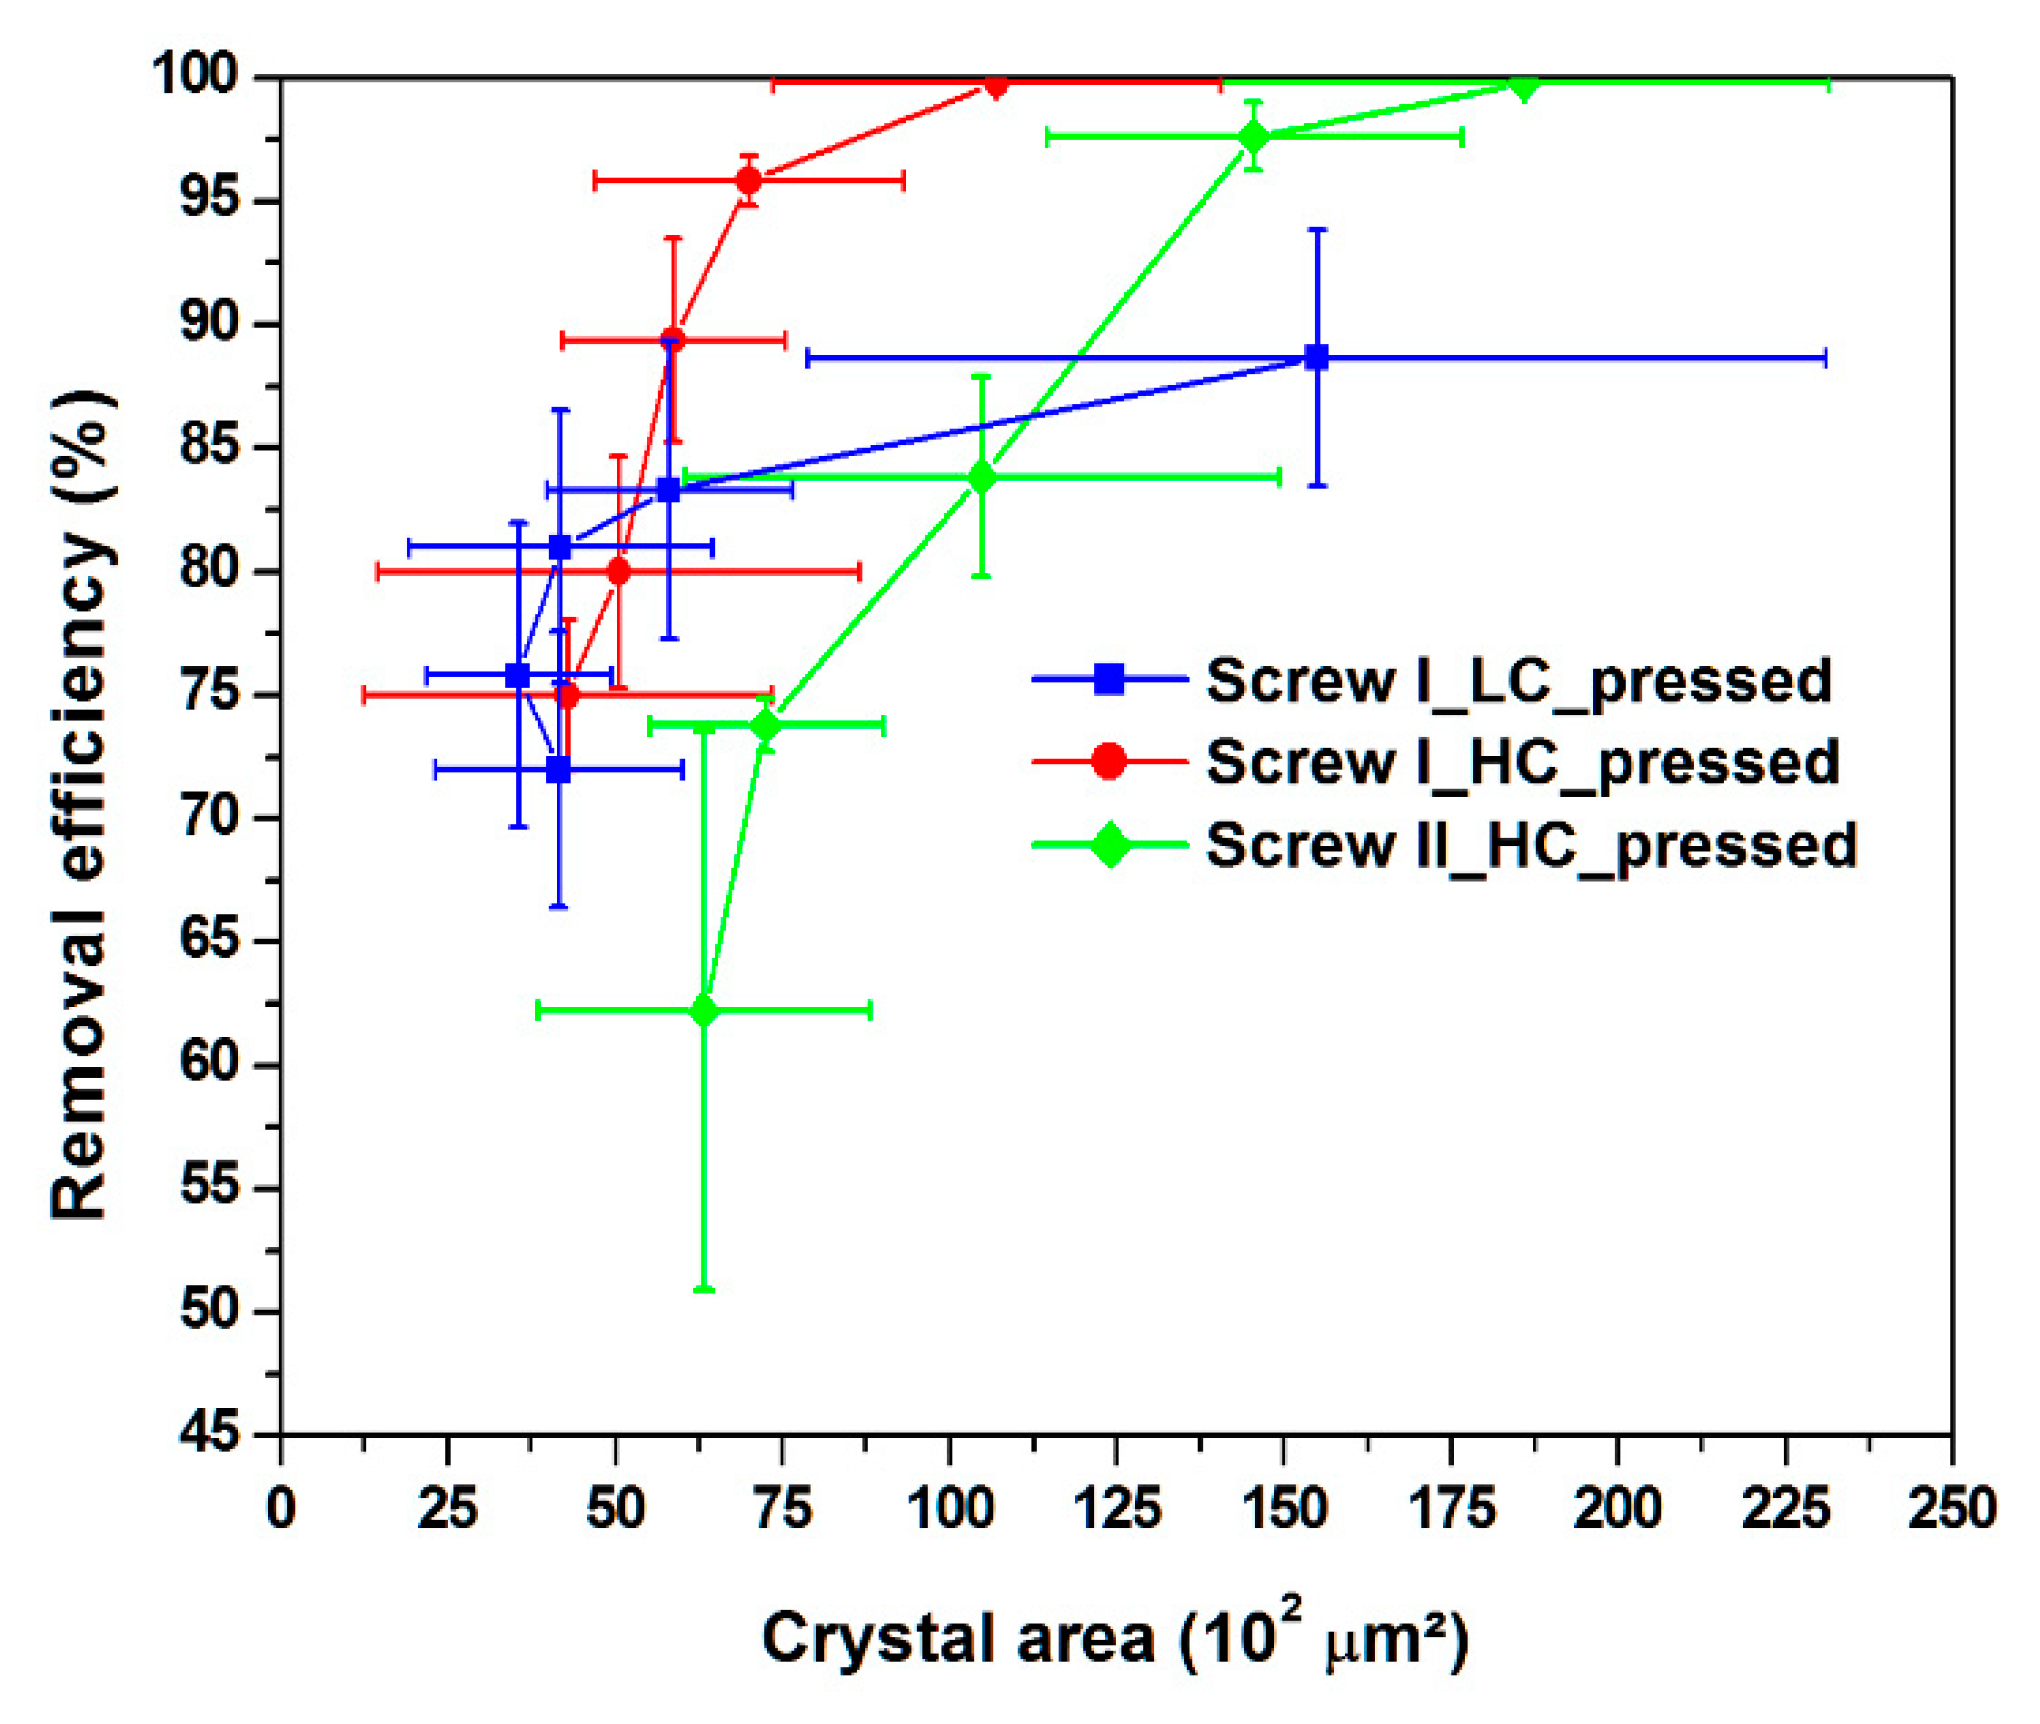
Comparing the results of the determination of the heat flow as well as of the heat transition coefficient shows a more different dependence on the temperature than for the removal efficiency (Figure 5). Thereby, the highest heat flows were measured for Screw I for low initial concentrations. Nevertheless, the heat flows for Screw I for high initial concentrations were also higher than those for Screw II. The difference between low and high initial concentrations is mainly attributable to the different physical properties of each solution, especially to the melting point, which changes the logarithmic mean temperature difference and thus the heat flow. This means that the logarithmic mean temperature of the solution with a low initial concentration is 4.4 K higher than that of the solution with a high initial concentration. The biggest difference between the results is visible for the high initial concentrations. This is because the diameter of Screw II is almost the same as that of the crystallizer, leaving only a rather small gap in between, and because the pitch of Screw I is somewhat higher. Overall, this lowers the possible turbulence within the crystallizer and, thus, the heat transfer coefficient and the heat transition coefficient, respectively. In total, the heat transition coefficient decreases with lower temperatures, which would be caused by additional ice inhibiting the inner heat transfer.
The dependence of the heat flow and the heat transition coefficient of the particular screw on the rotational speed is shown in Figure 6. It can be seen that with an increasing speed, no experiment shows a gain in heat transition. That is probably caused by an already-high turbulence within the crystallizer so that a further increase does not improve the heat transfer coefficient anymore. Calculating the scraper Reynolds number for the carrier fluid (Equation (2)) and comparing it to the results from Penney and Bell [18], which found out that a number higher than 400 belongs to the turbulent area, shows that all the Reynolds numbers are somewhat higher as this limit (1554 < ReSc,Screw I,LC < 3857; 1382 < ReSc,Screw I,HC < 3430; 2162 < ReSc,Screw II,HC < 3913).
ReSc = n × dSc2 × φll
For Screw I, the increase led to a lowering of the value, which can be explained by a collapse of the axial conveying speed. Screw I has, for low initial concentrations, again, the highest heat flow, caused by the larger temperature difference as already mentioned. Besides in the experiment with 27 min−1, the heat flows and the heat transition coefficients for Screws I and II for high initial concentrations are relatively similar.
The higher turbulence caused by Screw I is also shown by the calculation of the axial or vertical conveying speed, which can be calculated using Schein’s equation [19] (Equation (3)). Thereby, the conveying speed for the experiment with 40 min−1 was 9 × 10⁻³ m s−1 for Screw I and 2 × 10⁻³ m s−1 for Screw II for high initial concentrations.
uax = (n × rSc) × tan(γSc)
The calculated Reynolds number (Equation (4)) and the transposed calculation of the Nusselt number (Equation (5)) are shown in Figure 7, which is a double logarithmic diagram. Thereby, the Reynolds number is calculated as suggested by Gaddis [20] and the Nusselt number, as suggested by Stein [21,22]. This procedure is usually used to determine the exponent of the Reynolds number of an unknown Nusselt correlation, which would be the gradient of the linear balancing function.
ReS = n × dSc2 × φmm
Nu = ReS × Pr1/3 × (ηf,mW,m)0.14
It can be seen that the numbers for Screw I have a negative gradient, so the values decrease with increasing Reynolds numbers. This is a significant indication for the behavior of Screw I leading to a collapse of the axial conveying speed at high rotational speeds and is based on the design of the screw. The lower gap between Screw II and the crystallizer surface, and the lower pitch prevent the same behavior for the other screw. Nevertheless, those numbers are only an indication and the calculated exponent cannot be used for further calculations. This is also apparent given the low coefficient of determination.

3.3. Crystal Area

The crystal areas for the experiments with varying cooling temperatures are shown in Figure 8. The overall profile looks similar for both screws and both concentrations. Only the crystal areas of the unpressed ice for Screw I for low initial concentrations are slightly higher. This is caused by different kinds of crystallization. For high concentrations, suspension crystallization causing a particle shower is usually observed, whereas for low concentrations, typical static freezing on the cooling surface is expected, which leads to a stable ice layer being scratched away by the screw. The crystal area for Screw II of the pressed ice is higher than that for Screw I, but all have a similar dependence on the cooling temperature. This is caused by a higher supersaturation at lower temperatures causing a fast crystallization of lots of small crystals.
The results for the crystal area for the experiments with the variation of the rotational speed of the screw are similar in profile to the ones obtained by varying the cooling temperature (Figure 9). Again, the unpressed crystals for Screw I for low initial concentrations show the largest area, whereas both test series with high initial concentrations show smaller areas. Furthermore, the overall profile looks similar, besides for the pressed ice of Screw II. This is due to an unsuccessful separation of ice and brine within the cone caused by a high proportion of ice particles in solution. This did not happen for the other tests, where a better separation took place and, thus, larger crystals were obtained.
The mean crystal sizes and areas are also shown in Table 2. Thereby, the values differ less for the unpressed crystals compared to the pressed ones. This means that the biggest change to larger crystals happens within the cone. Furthermore, the pressed crystals for Screw II are considerably larger, which is caused by a slower conveying speed and thus a better separation of liquid and solid and, consequently, better densification. A comparison with research literature shows that Wang [23] achieved crystal sizes of around 0.5–1.5 mm. This means that the ice particles obtained in this research are somewhat smaller, which is caused by the larger shear rate through the screws.
The correlations between crystal area and removal efficiency are shown in Figure 10. It can be seen that there is a clear relation between crystal size and purity. However, with Screw II, larger crystals are obtained or are necessary in order to achieve the same removal efficiency as with Screw I. Furthermore, a lower salt concentration within or around the ice is connected to a growing step size in the crystal area.

4. Research Proposal

For future investigations, a modification as shown in Figure 11 could be used to produce ice with a high purity but without a pressing cone. Furthermore, this design could help to overcome the dependency on the on-site parameters of the water source. The overall functionality is comparable to a rectification column with a feed supplied between the “stripping” and “rectification” section. The coolant with a low temperature is in contact with the solution at the bottom of the column where, also, the solution with a high salt concentration and thus low melting point is located. Through the multivariate pressing, the salt is expelled and concentrated in the surrounding liquid. With transportation upwards, the ice partially melts because of the feed with a higher temperature and higher salt concentration. However, in the rectification section, the solution is crystallized again and then further purified by the screw with increasing shaft and decreasing pitch. The consequence would be a simpler design and better control of ice purity by varying the coolant temperature. The design is thereby only a suggestion and is based on the results achieved by several experiments with a scraped screw crystallizer and a tapering cone, which is basically similar to a multivariate screw in terms of the separation effect.

5. Conclusions

In this research, a comparison between two different scraper designs of a scraped surface crystallizer was carried out. Differences in the achieved removal efficiency for solutions with low and high initial concentrations were compared. Furthermore, the heat flow, heat transition coefficients, and the crystal sizes are presented. All experiments were performed for different cooling temperatures or rotational speeds in order to consider different dependencies.
Overall, the results showed that a good desalination effect could be achieved for low and high initial concentrations for both screw designs. Whereas the dependence on the cooling temperature showed no substantial differences, the experiments with the change in rotational speeds showed that this kind of desalination plant operates at its best when the parameters of the experiment fit those used for the basic design. Changing these parameters led to a different ice solution composition or conveying speed, leading to a lower separation within the cone. Thereby, the overall removal efficiency of Screw I with a pitch of 19.0° for high initial concentrations was around 26.4% to 29.0% for the unpressed ice and around 75.0% to 99.8% for the pressed ice. The removal efficiency averaged for all ions for a low initial concentration for Screw I was around 24.1% to 28.6% for the unpressed ice and around 72.0% to 88.6% for the pressed ice. Furthermore, the removal efficiency for Screw II with a pitch of 4.33° for high initial concentrations was around 10.6% to 32.4% for the unpressed ice and around 62.2% to 99.8% for the pressed ice.
The heat flows and heat transition coefficients of Screw I are higher than those of Screw II. This is due to the smaller gap between Screw II and the crystallizer surface and the lower pitch of the screw leading to lower inner turbulence and, thus, to a lower heat transfer coefficient and heat transition. This statement is confirmed by the axial conveying speed, which is lower for Screw II, and by the dependence of the Reynolds number of each test series on the Nusselt number.
Comparing the crystal sizes and areas for all the tests showed a significant dependence of the removal efficiency on the compression within the cone. When the pressing and the composition are favorable, the removal efficiency is high, which means the salt concentration of the product is low, so potable water can be achieved.
Overall, it seems that with Screw II, better results could be achieved, but the plant design was more vulnerable to disturbances caused by a hard ice layer. Therefore, a gear motor with more power should have a positive influence on the ice generation even at low temperatures, allowing more adjustments of parameters. For example, the results could be improved by decreasing the cooling temperature and compensating the lower removal efficiency by lowering the rotational speed to improve the pressing and separation time within the cone.

Author Contributions

Conceptualization, L.E., D.W., T.K., and M.R.; data curation, L.E.; funding acquisition, F.-J.M. and M.R.; investigation, L.E. and D.W.; methodology, T.K., F.-J.M., and M.R.; project administration, L.E., T.K., F.-J.M., and M.R.; supervision, L.E., F.-J.M., and M.R.; validation, L.E.; visualization, L.E.; writing—original draft, L.E.; writing—review and editing, D.W. and M.R. All authors have read and agreed to the published version of the manuscript.

Funding

This research was funded by the German Federal Ministry for Economic Affairs and Energy (AiF Project GmbH, Funding Code KF 2035726 SA3). The open access publication was partially funded by the Ministry of Science, Research and Arts Baden-Württemberg.

Conflicts of Interest

The authors declare no conflict of interest.

References

  1. Cipollina, A.; Micale, G.; Rizzuti, L. Seawater Desalination for Freshwater Production. In Seawater Desalination; Springer: Berlin/Heidelberg, Germany, 2009; ISBN 978-3-642-01149-8. [Google Scholar]
  2. Karagiannis, I.C.; Soldatos, P.G. Water desalination cost literature: Review and assessment. Desalination 2008, 223, 448–456. [Google Scholar] [CrossRef]
  3. Marrero, G.A.; Ramos-Real, F.J. Electricity generation cost in isolated system: The complementarities of natural gas and renewables in the Canary Islands. Renew. Sustain. Energy Rev. 2010, 14, 2808–2818. [Google Scholar] [CrossRef] [Green Version]
  4. Balaji, R.; Bartram, J.; Coates, D.; Connor, R.; Harding, J.; Hellmuth, M.; Leclerc, L.; Pangare, V.; Shields, J.G. Beyond demand: Water’s Social and Environmental Benefits. In Managing Water under Uncertainty and Risk; United Nations Educational, Scientific and Cultural Organization: Paris, France, 2012; Volume 1, pp. 1–407. ISBN 9789231042355. [Google Scholar]
  5. Erlbeck, L.; Nessel, R.; Illner, F.; Müller, W.; Kunz, T.; Schuchmann, H.; Rädle, M.; Methner, F.-J. Commercial feasibility of a new freeze crystallization plant for small-scale potable water production. Desalin. Water Treat. 2018, 105, 23–34. [Google Scholar] [CrossRef]
  6. Gao, W.; Shao, Y. Freeze concentration for removal of pharmaceutically active compounds in water. Desalination 2009, 249, 398–402. [Google Scholar] [CrossRef]
  7. Hirata, T.; Matsuzaki, Y.; Ishikawa, M. Ice formation of aqueous solution and its removal phenomena on vertical cooled plate. Heat Mass Transf. 2003, 40, 829–834. [Google Scholar] [CrossRef]
  8. Okawa, S.; Ito, T.; Saito, A. Effect of crystal orientation on freeze concentration of solutions. Int. J. Refrig. 2009, 32, 246–252. [Google Scholar] [CrossRef]
  9. Qin, F.G.F.; Chen, X.D.; Premathilaka, S.; Free, K. Experimental study of wash columns used for separating ice from ice-slurry. Desalination 2008, 218, 223–228. [Google Scholar] [CrossRef]
  10. Shirai, Y.; Wakisaka, M.; Miyawaki, O.; Sakashita, S. Effect of seed ice on formation of tube ice with high purity for a freeze wastewater treatment system with a bubble-flow circulator. Water Res. 1999, 33, 1325–1329. [Google Scholar]
  11. Wakisaka, M.; Shirai, Y.; Sakashita, S. Ice crystallization in a pilot-scale freeze wastewater treatment system. Chem. Eng. Process. 2001, 40, 201–208. [Google Scholar] [CrossRef]
  12. Qin, F.G.G.; Yang, M.L.; Yang, X.X. Experimental and thermal analysis of washing the packed ice bed in wash columns. AIChE J. 2009, 55, 2835–2847. [Google Scholar] [CrossRef]
  13. Erlbeck, L.; Wössner, D.; Kunz, T.; Rädle, M.; Methner, F.-J. Investigation of freeze crystallization and ice pressing in a semi-batch process for the development of a novel single-step desalination plant. Desalination 2018, 448, 76–86. [Google Scholar] [CrossRef]
  14. Erlbeck, L.; Wössner, D.; Kunz, T.; Rädle, M.; Methner, F.-J. Investigating Freeze Crystallization as Promising Next-generation Water Purification Technology for the Brewing Industry. Brew. Sci. 2018, 71, 56–67. [Google Scholar] [CrossRef]
  15. Erlbeck, L.; Wössner, D.; Schlachter, K.; Kunz, T.; Methner, F.-J.; Rädle, M. Investigation of a novel Scraped Surface Crystallizer with included ice-pressing section as new purification technology. Sep. Purif. Technol. 2019, 228, 1–10. [Google Scholar] [CrossRef]
  16. National Institutes of Health: ImageJ. 2017. Available online: https://imagej.nih.gov/ij/ (accessed on 30 July 2020).
  17. Erlbeck, L.; Rädle, M.; Nessel, R.; Illner, F.; Müller, W.; Rudolph, K.; Kunz, T.; Methner, F.-J. Investigation of the depletion of ions through freeze desalination. Desalination 2017, 407, 93–102. [Google Scholar] [CrossRef]
  18. Penney, W.R.; Bell, K.J. Close-clearance agitators. Ind. Eng. Chem. 1967, 59, 47–54. [Google Scholar] [CrossRef]
  19. Schein, C. Zum Kontinuierlichen Trennpressen Biogener Feststoffe in Schneckengeometrien am Beispiel Geschälter Rapssaat. 2003. Available online: https://duepublico2.uni-due.de/receive/duepublico_mods_00010993 (accessed on 15 May 2020).
  20. Gaddis, E.S. Wärmeübertragung und Leistungsaufnahme in Rührkesseln. In VDI-Wärmeatlas; Springer: Berlin/Heidelberg, Germany, 2013; pp. 1621–1653. [Google Scholar]
  21. Stein, W.A.; Müller, W. Wärmeübergang auf der Innenseite eines Rührbehälters (Teil 1). Eng. Res. 1992, 58, 87–95. [Google Scholar] [CrossRef]
  22. Stein, W.A. Rührleistung und Wärmeübergang auf der Innenseite eines Rührbehälters mit verschiedenen Wendel-Rührern. Eng. Res. 1993, 59, 165–172. [Google Scholar] [CrossRef]
  23. Wang, P.; Chung, T.S. A conceptual demonstration of freeze desalination-membrane distillation (FD-MD) hybrid desalination process utilizing liquefied natural gas (LNG) cold energy. Water Res. 2012, 46, 4037–4052. [Google Scholar] [CrossRef] [PubMed]
Figure 1. Schematic flowchart of the test plants; (a) Screw I with a pitch of γSc = 19.0°; (b) Screw II with a pitch of γSc = 4.33°.
Processes 08 00971 g001
Figure 2. Technical and sectional drawing of the used screw designs (dimensions in mm); (a) Screw I with a pitch of γSc = 19.0°; (b) Screw II with a pitch of γSc = 4.33°.
Processes 08 00971 g002
Figure 3. Removal efficiency for unpressed and pressed ice of Screw I and II with solutions with high and low initial concentrations depending on the cooling temperature (nI,LC,HC = 40 min−1; nII,HC = 67 min−1).
Processes 08 00971 g003
Figure 4. Removal efficiency of unpressed and pressed ice of Screw I and II with solutions with high and low initial concentrations depending on the rotational speed (ϑI,LC = −8.7 °C; ϑI,HC = −7.0 °C; ϑII,HC = −8.5 °C).
Processes 08 00971 g004
Figure 5. Heat flow and heat transition coefficient of Screws I and II with solutions with high and low initial concentrations depending on the cooling temperature (nI,LC,HC = 40 min−1; nII,HC = 67 min−1).
Processes 08 00971 g005
Figure 6. Heat flow and heat transition coefficient of Screws I and II with solutions with high and low initial concentrations depending on the rotational speed (ϑI,LC = −8.7 °C; ϑI,HC = −7.0 °C; ϑII,HC = −8.5 °C).
Processes 08 00971 g006
Figure 7. Double logarithmic diagram of scraper Reynolds number and typical Nusselt correlation.
Processes 08 00971 g007
Figure 8. Crystal area of unpressed and pressed ice of Screws I and II with solutions with high and low initial concentrations depending on the cooling temperature (nI,LC,HC = 40 min−1; nII;HC = 67 min−1).
Processes 08 00971 g008
Figure 9. Crystal area of unpressed and pressed ice of Screws I and II with solutions with high and low initial concentrations depending on the cooling temperature (ϑI,LC = −8.7 °C; ϑI,HC = −7.0 °C; ϑII,HC = −8.5 °C).
Processes 08 00971 g009
Figure 10. Comparison of the removal efficiency of the pressed ice of all experiments.
Processes 08 00971 g010
Figure 11. Schematic flowchart of a test plant with multivariate pressing and “stripping” and “rectification” section.
Processes 08 00971 g011
Table 1. Mean concentrations of the test solutions used in the different experiments.
Low Concentration
(mgL−1)
High Concentration
(wt. %)
Sodium chloride-4.0
Residual alkalinity16.9-
Nitrate120.0-
Manganese0.255-
Total carbon88.2-
Total organic carbon27.6-
Table 2. Comparison of the mean crystal sizes and areas of all experiments.
Experimentsδunpressed
(μm)
δpressed
(μm)
Aunpressed
(102 μm2)
Apressed
(102 μm2)
Screw I LC60.8 ± 14.277.9 ± 26.738.5 ± 8.566.5 ± 26.1
Screw I HC49.5 ± 4.3080.1 ± 14.724.7 ± 4.865.9 ± 7.9
Screw II HC55.2 ± 12.2116.8 ± 38.921.6 ± 2.6114.5 ± 12.2

