As-Synthesized Oleic Amido Propyl Betaine Surfactant Mixture and the Effect on the Crude Oil–Seawater Interfacial Tension

 , , ,
, , ,
Abstract
:
1. Introduction
2. Materials and Methods
2.1. Materials Used
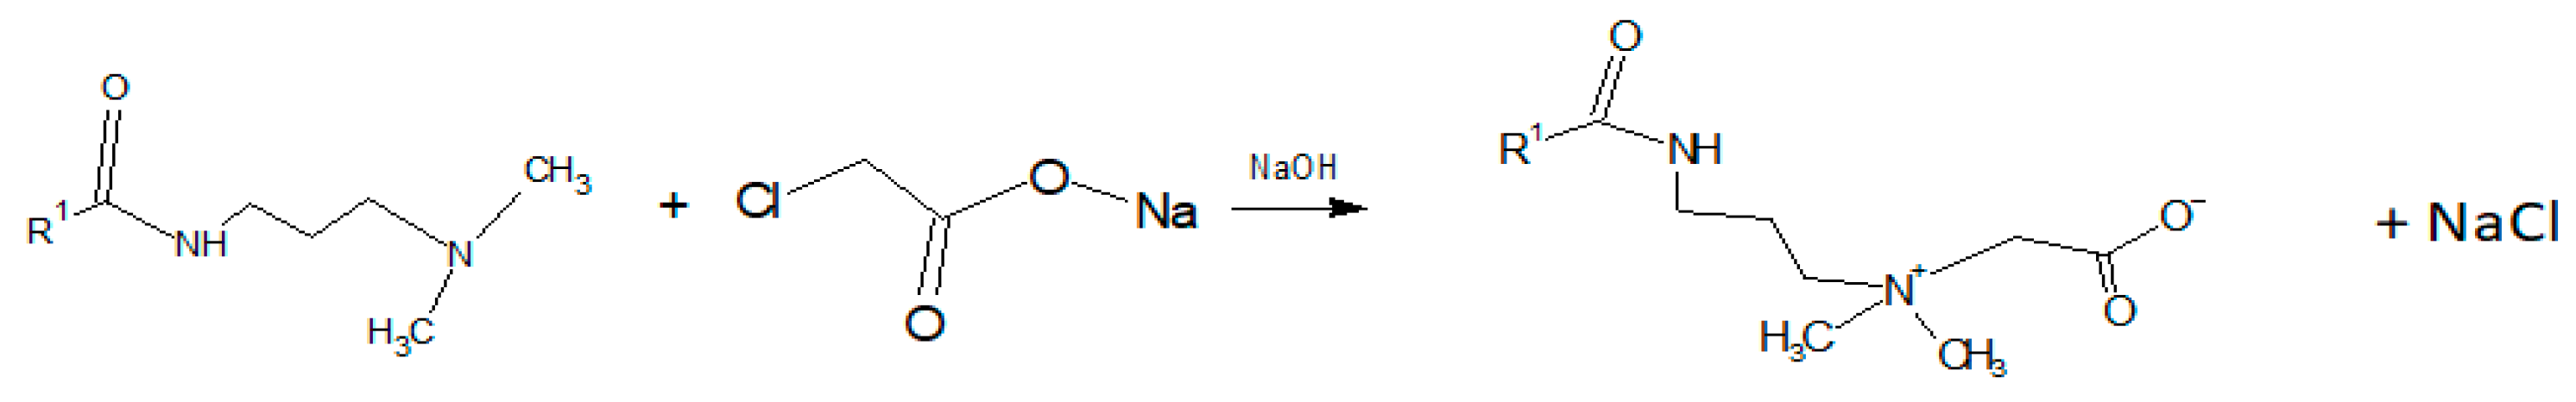
2.2. Synthesis of Surfactant
2.3. High Performance Liquid Chromatography (HPLC)
2.4. Fourier Transform Infra-Red Spectroscopy Analysis
2.5. Hyphenated Thermogravimetry-Infra-Red (TG-IR) Analysis
2.6. Surface Tension Analysis and Critical Micelle Concentration (CMC) Analysis
2.7. Interfacial Tension (IFT) Analysis
3. Results and Discussion
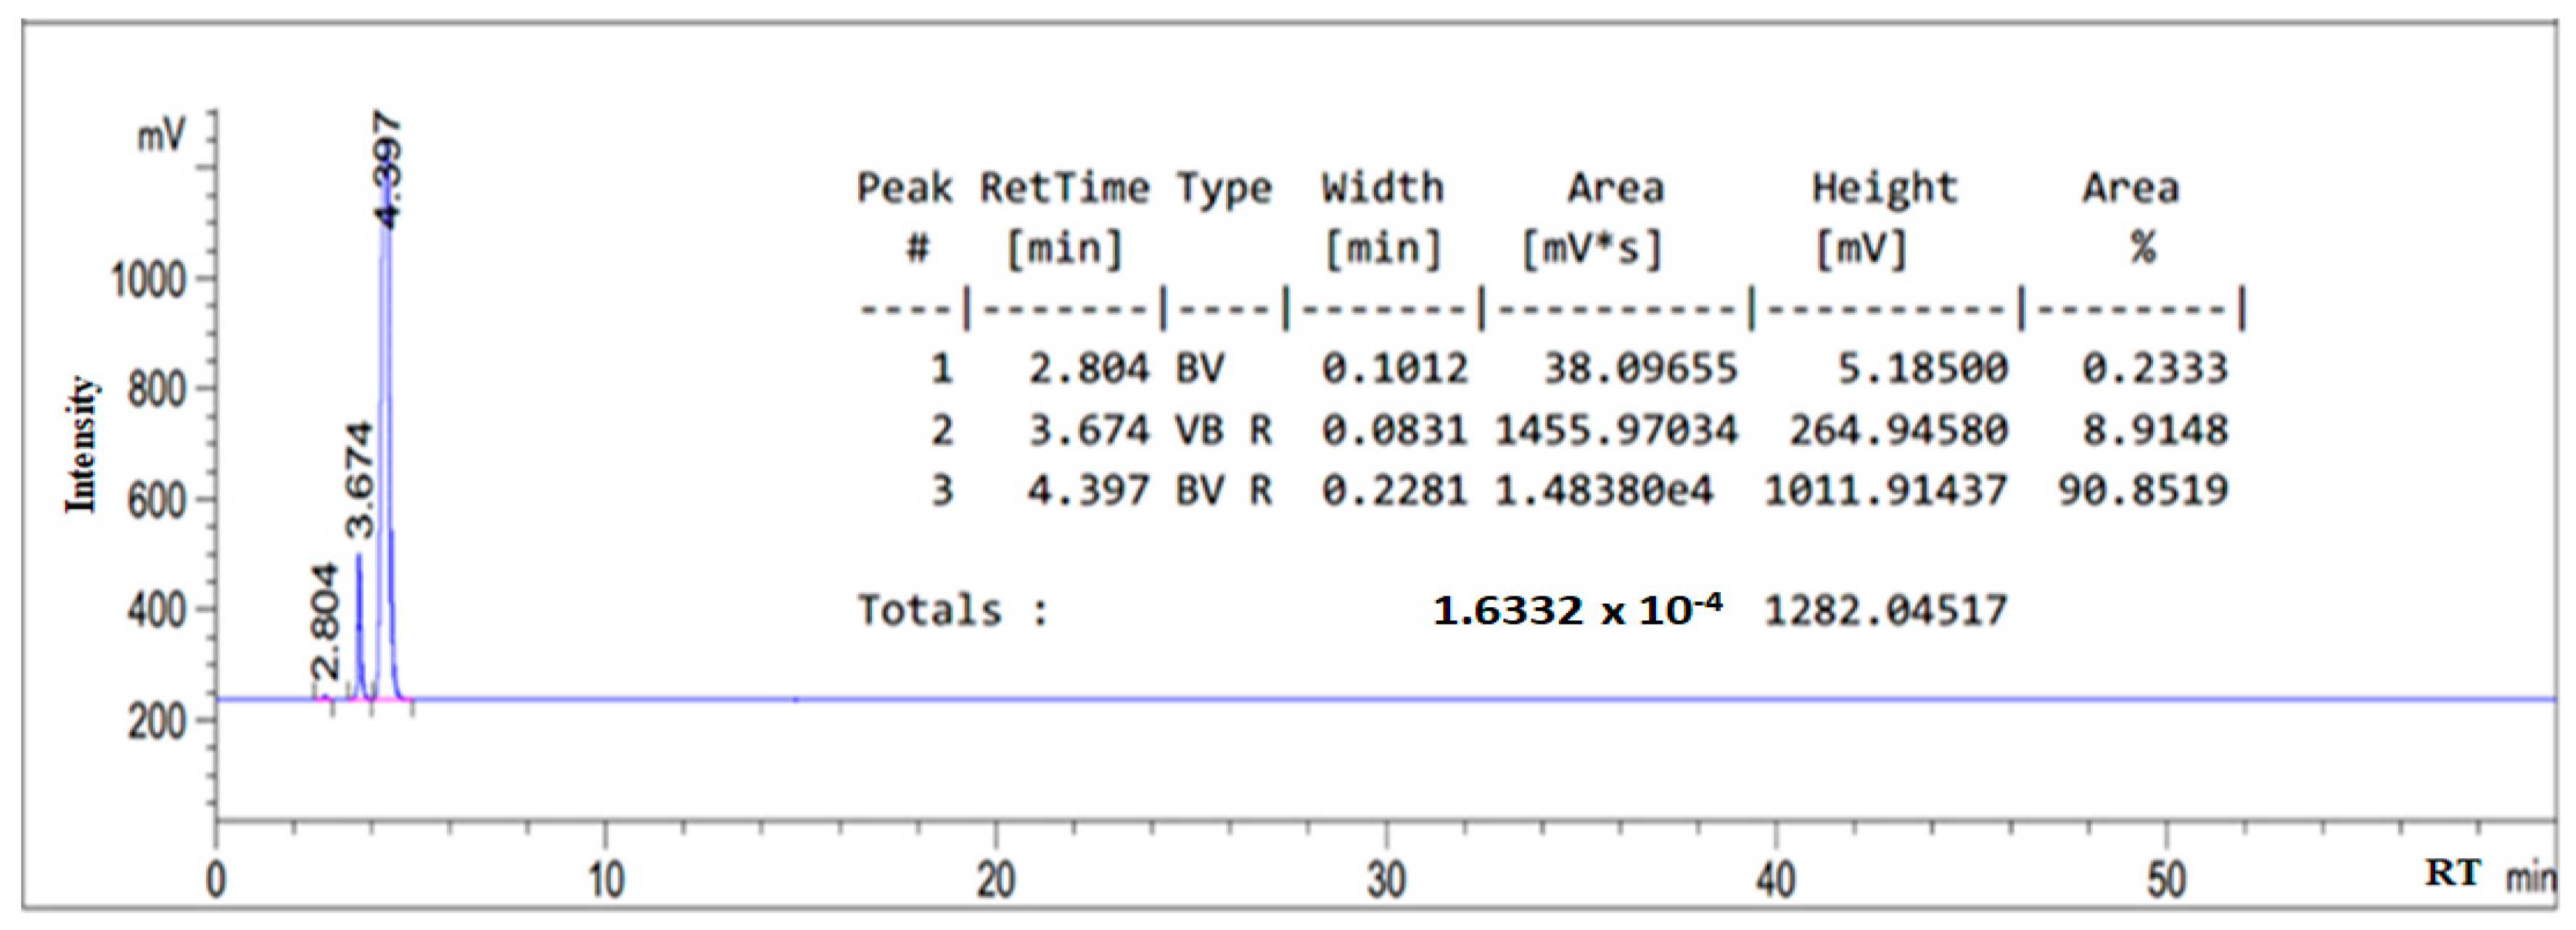
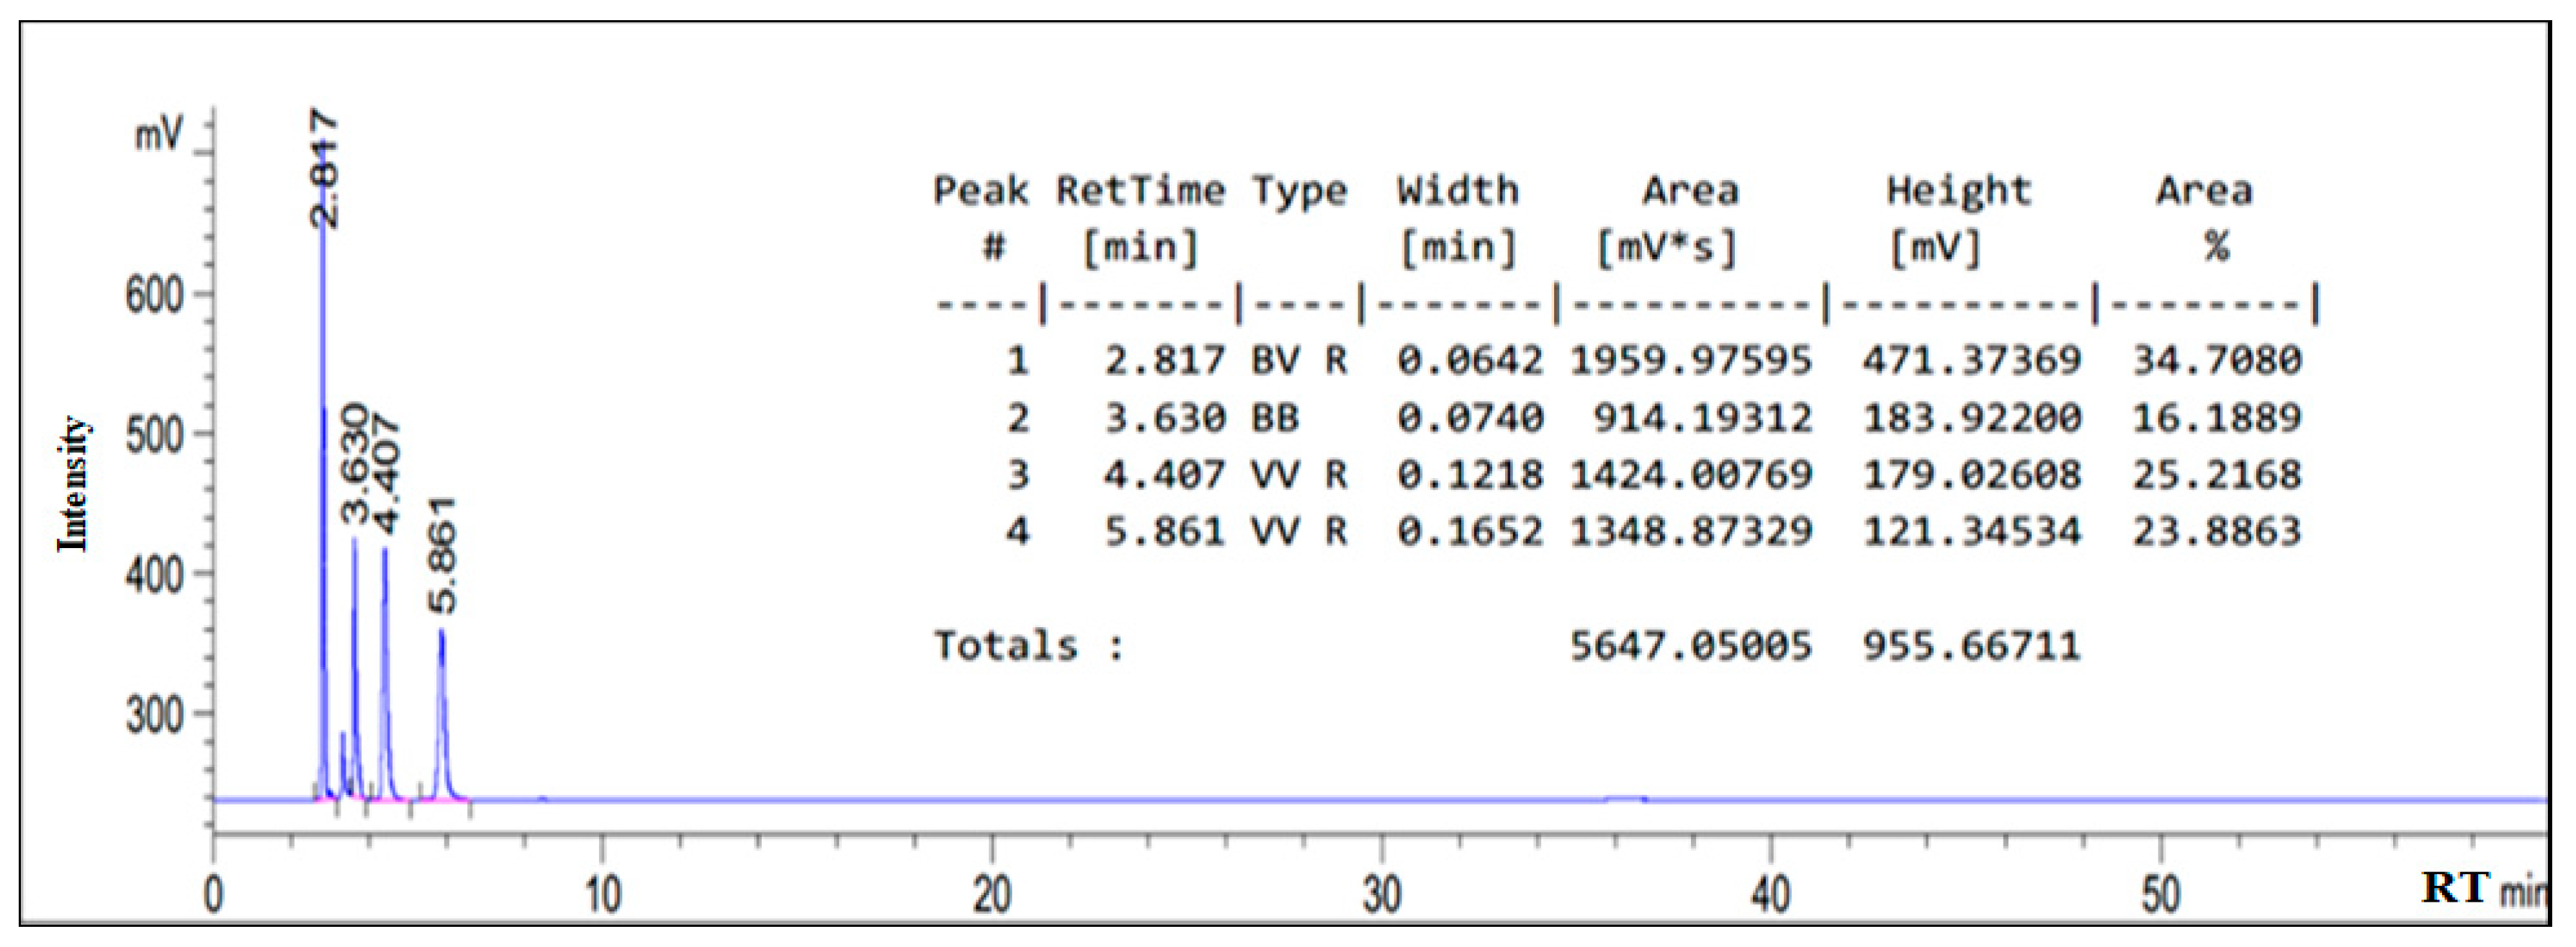
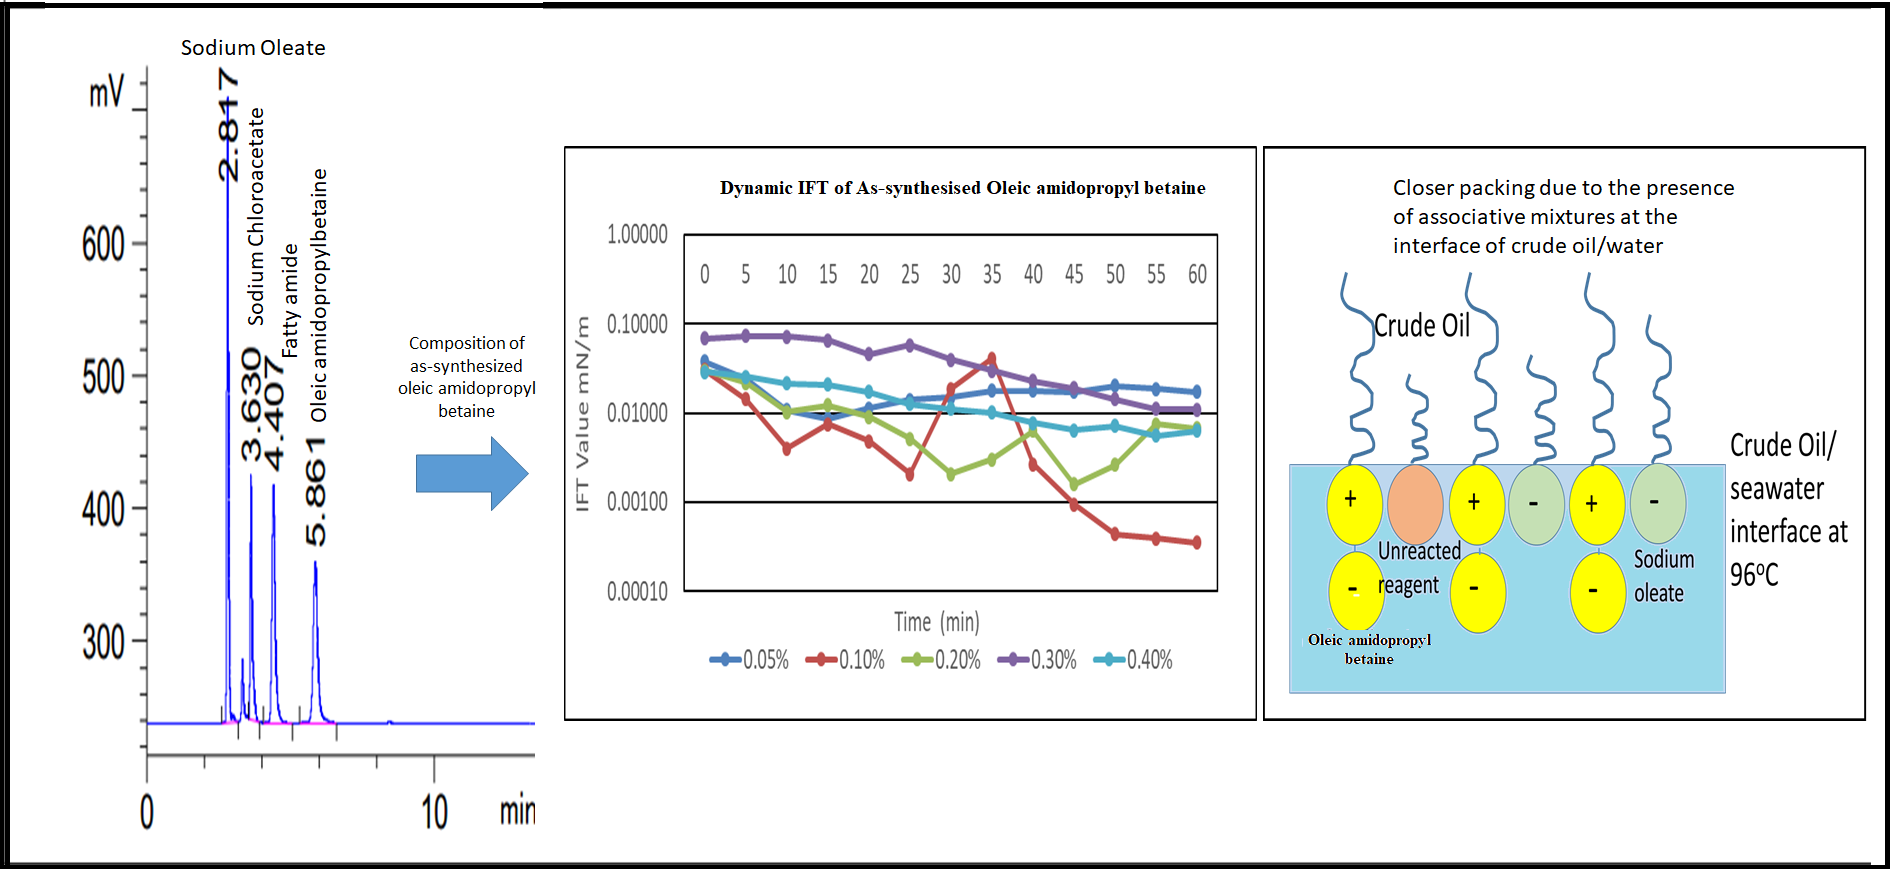
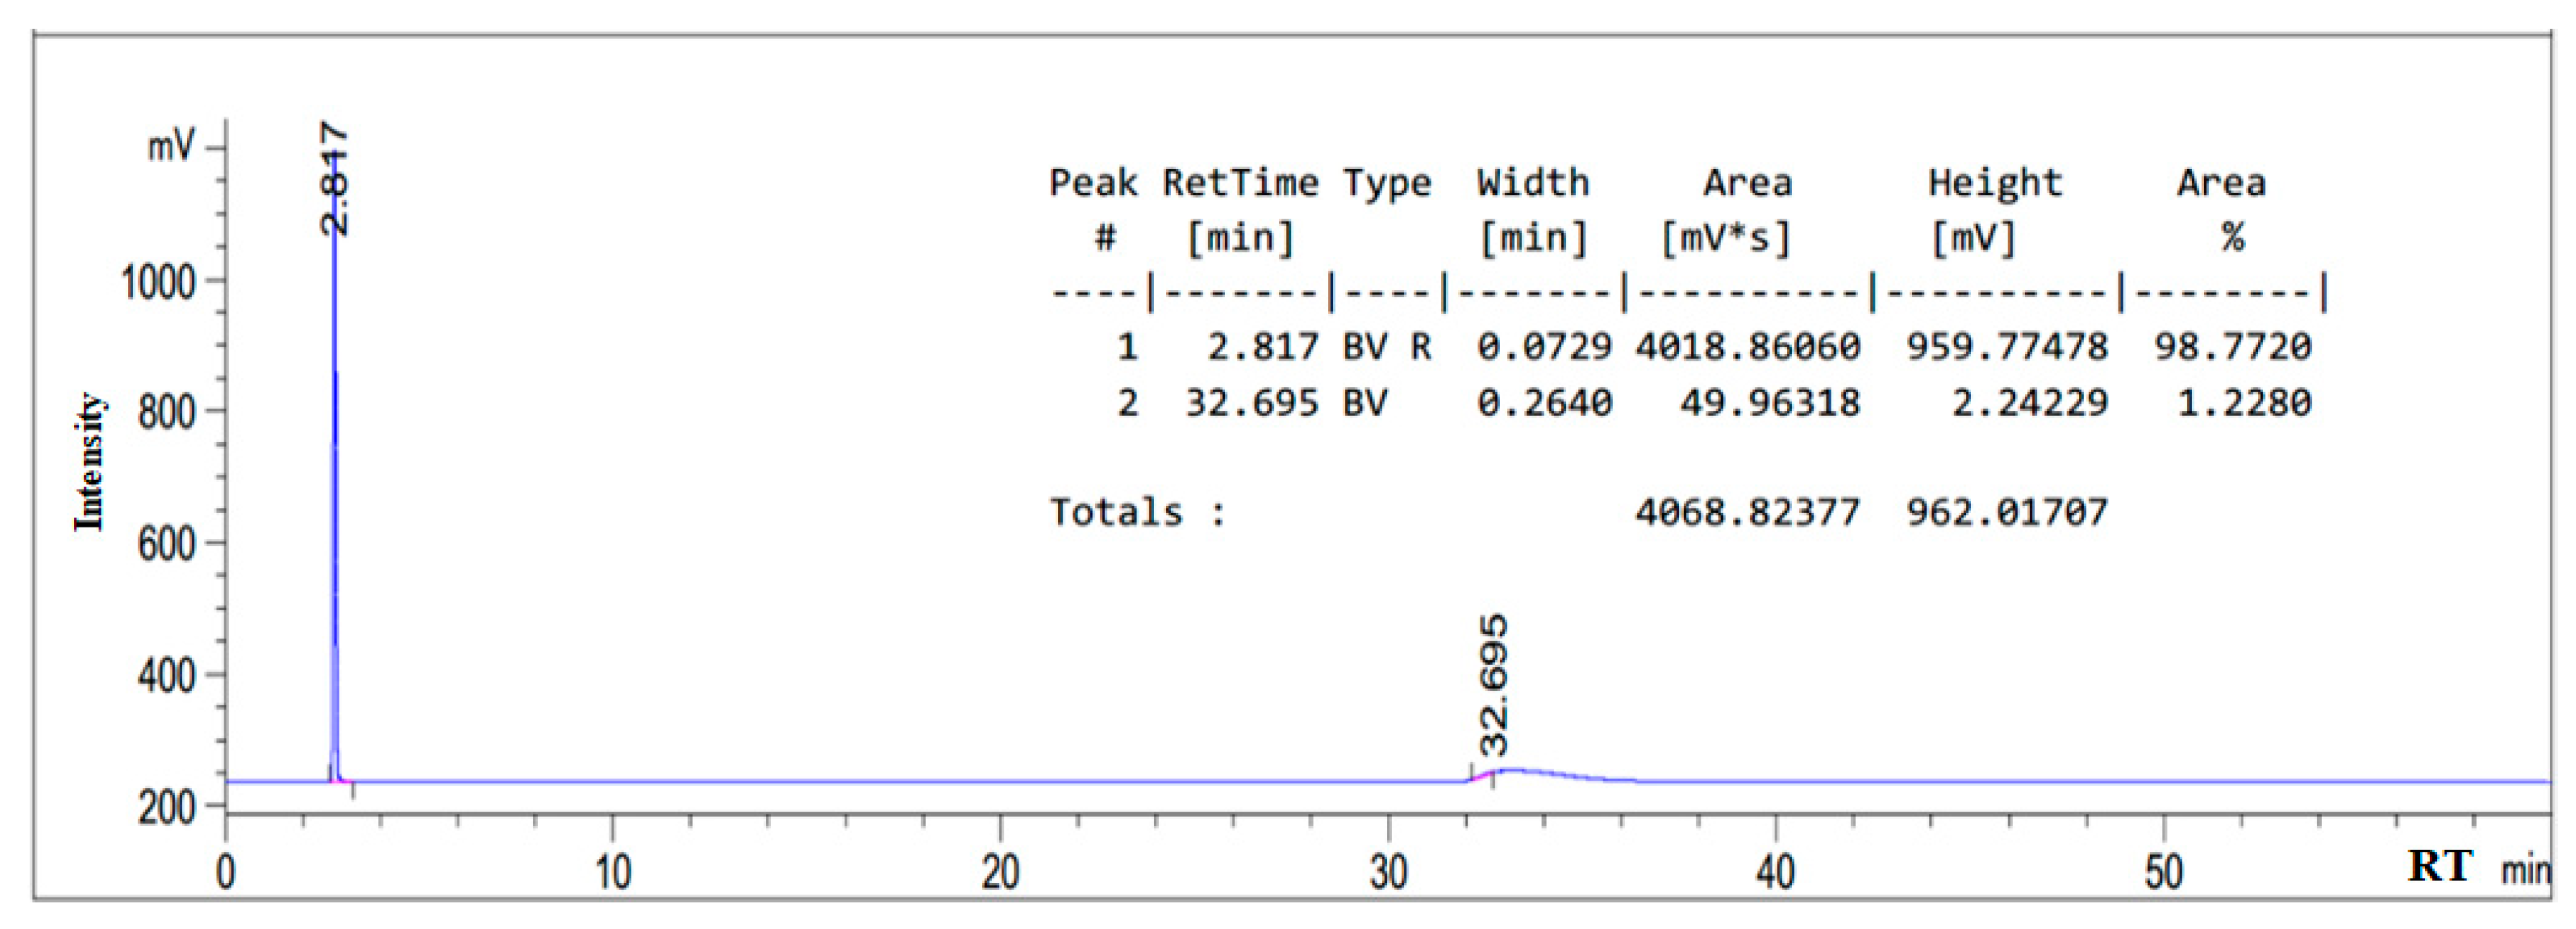
3.1. HPLC Chromatogram of as-Synthesized Surfactant
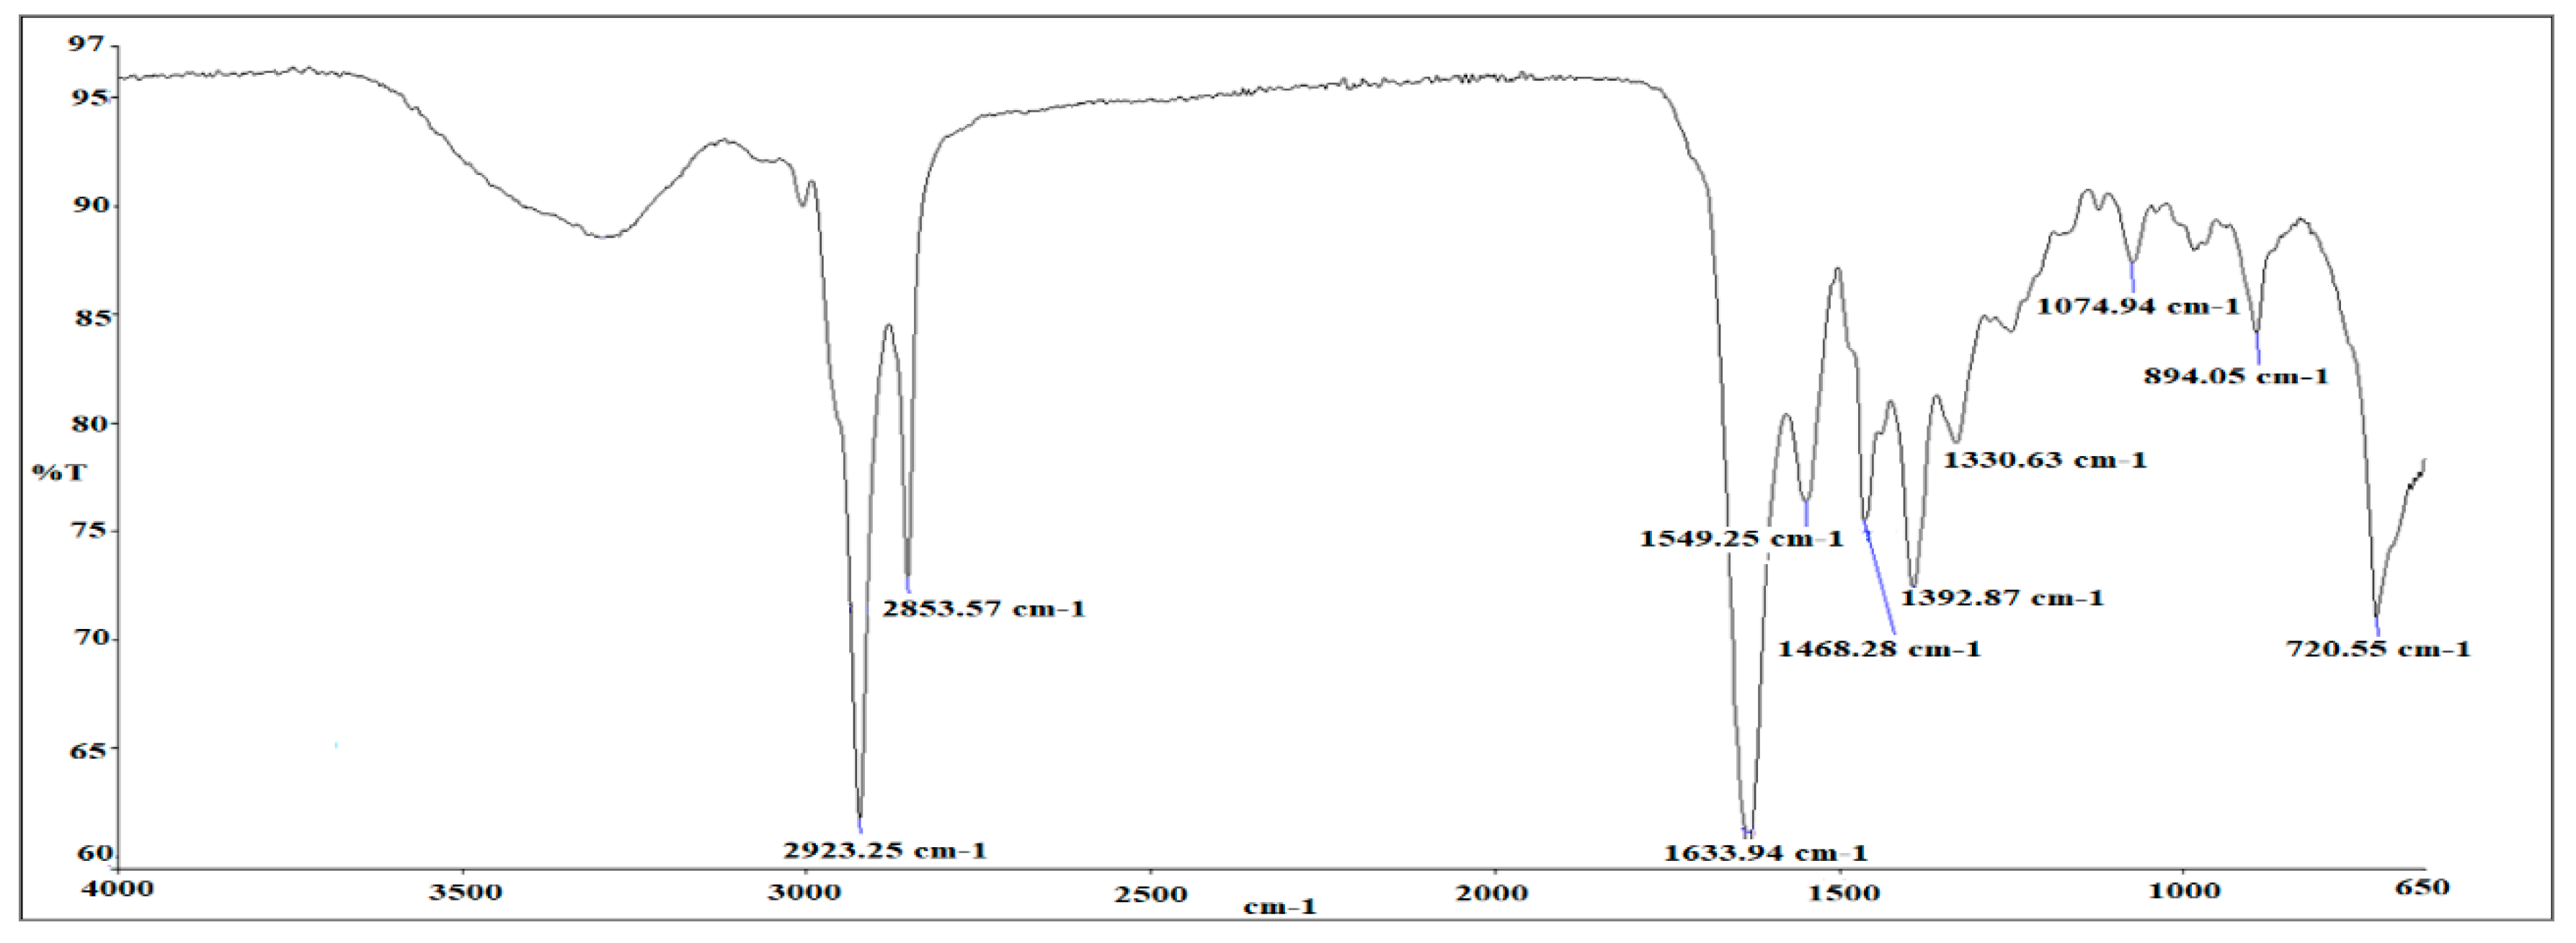
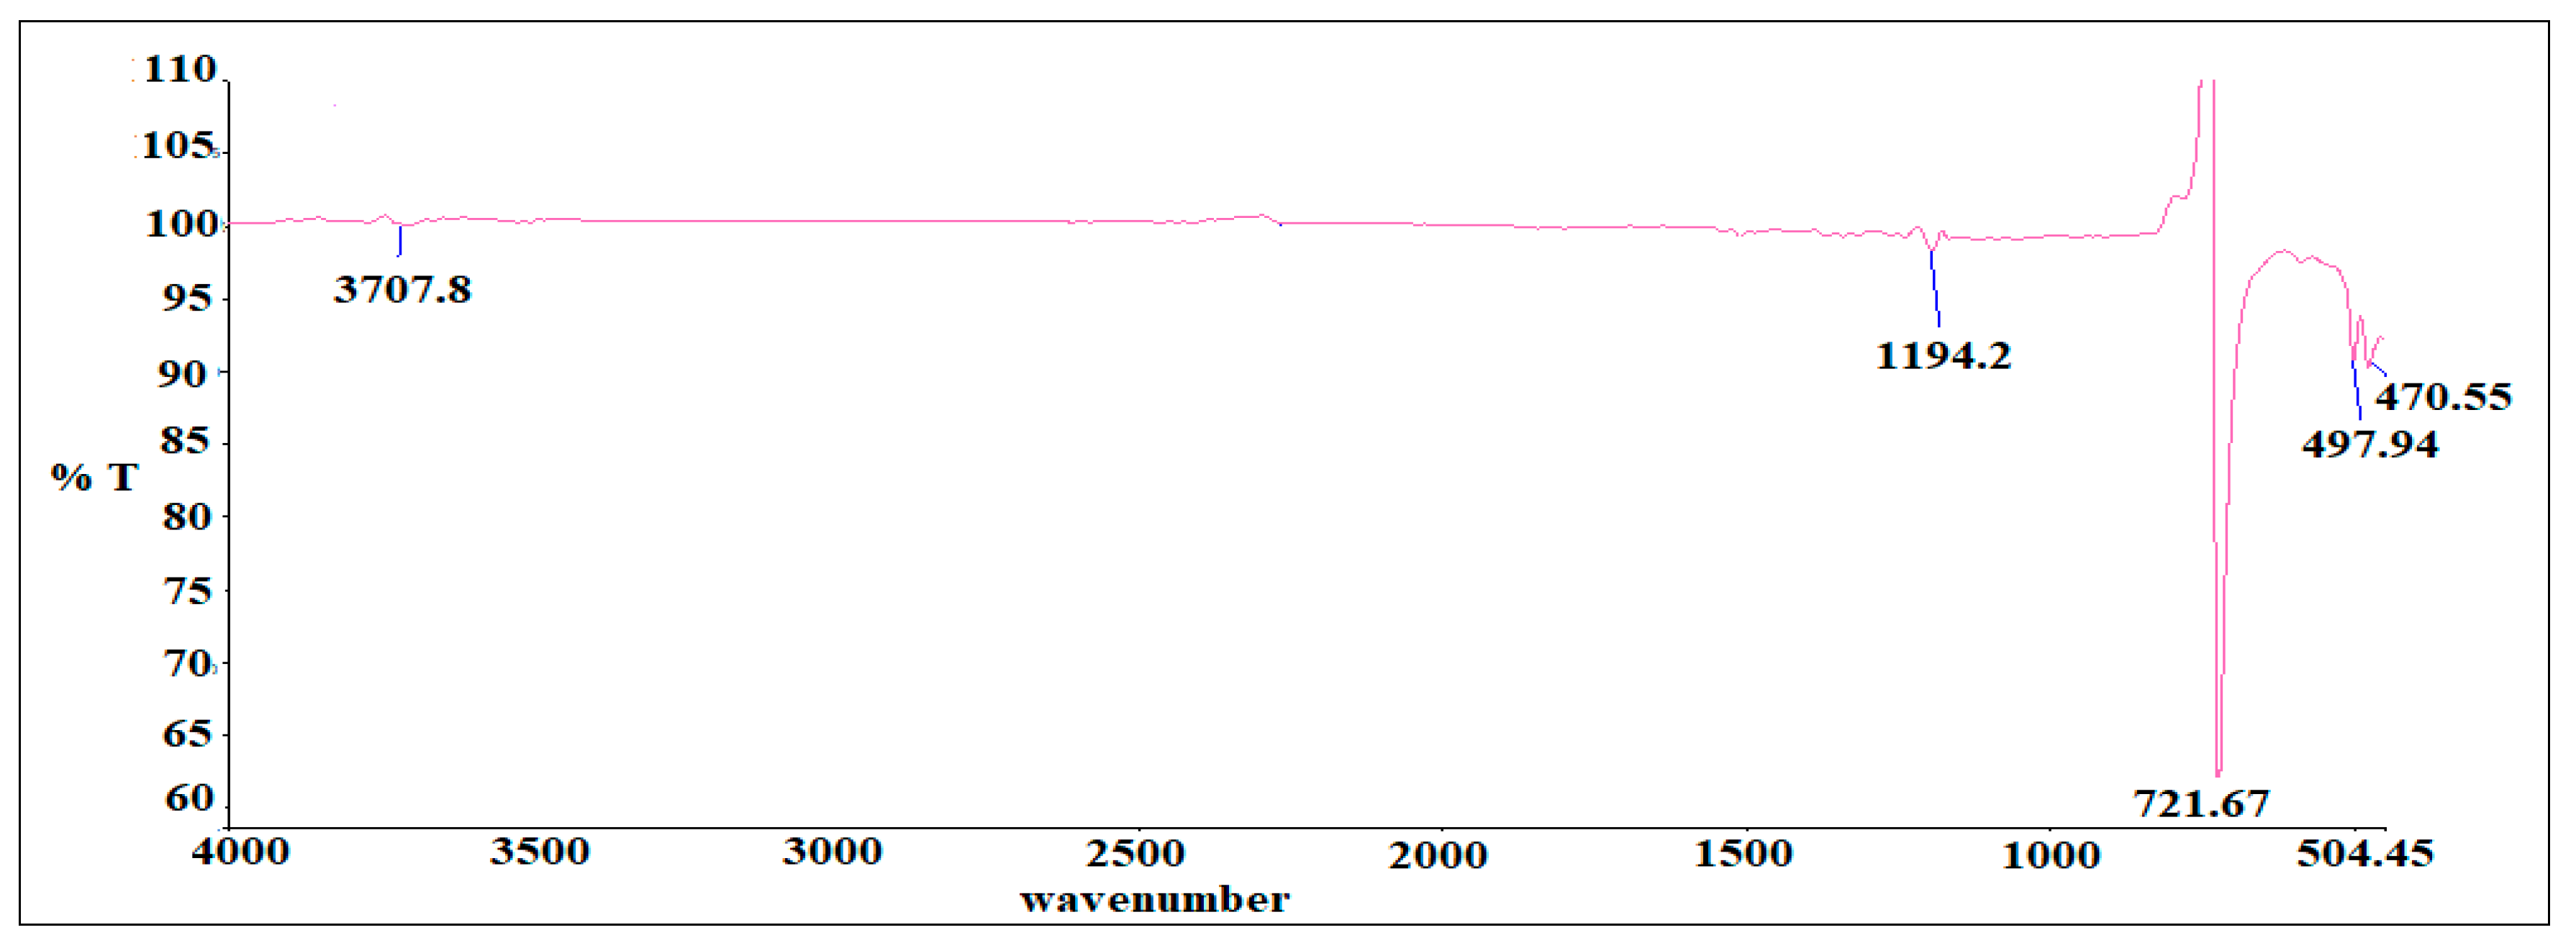
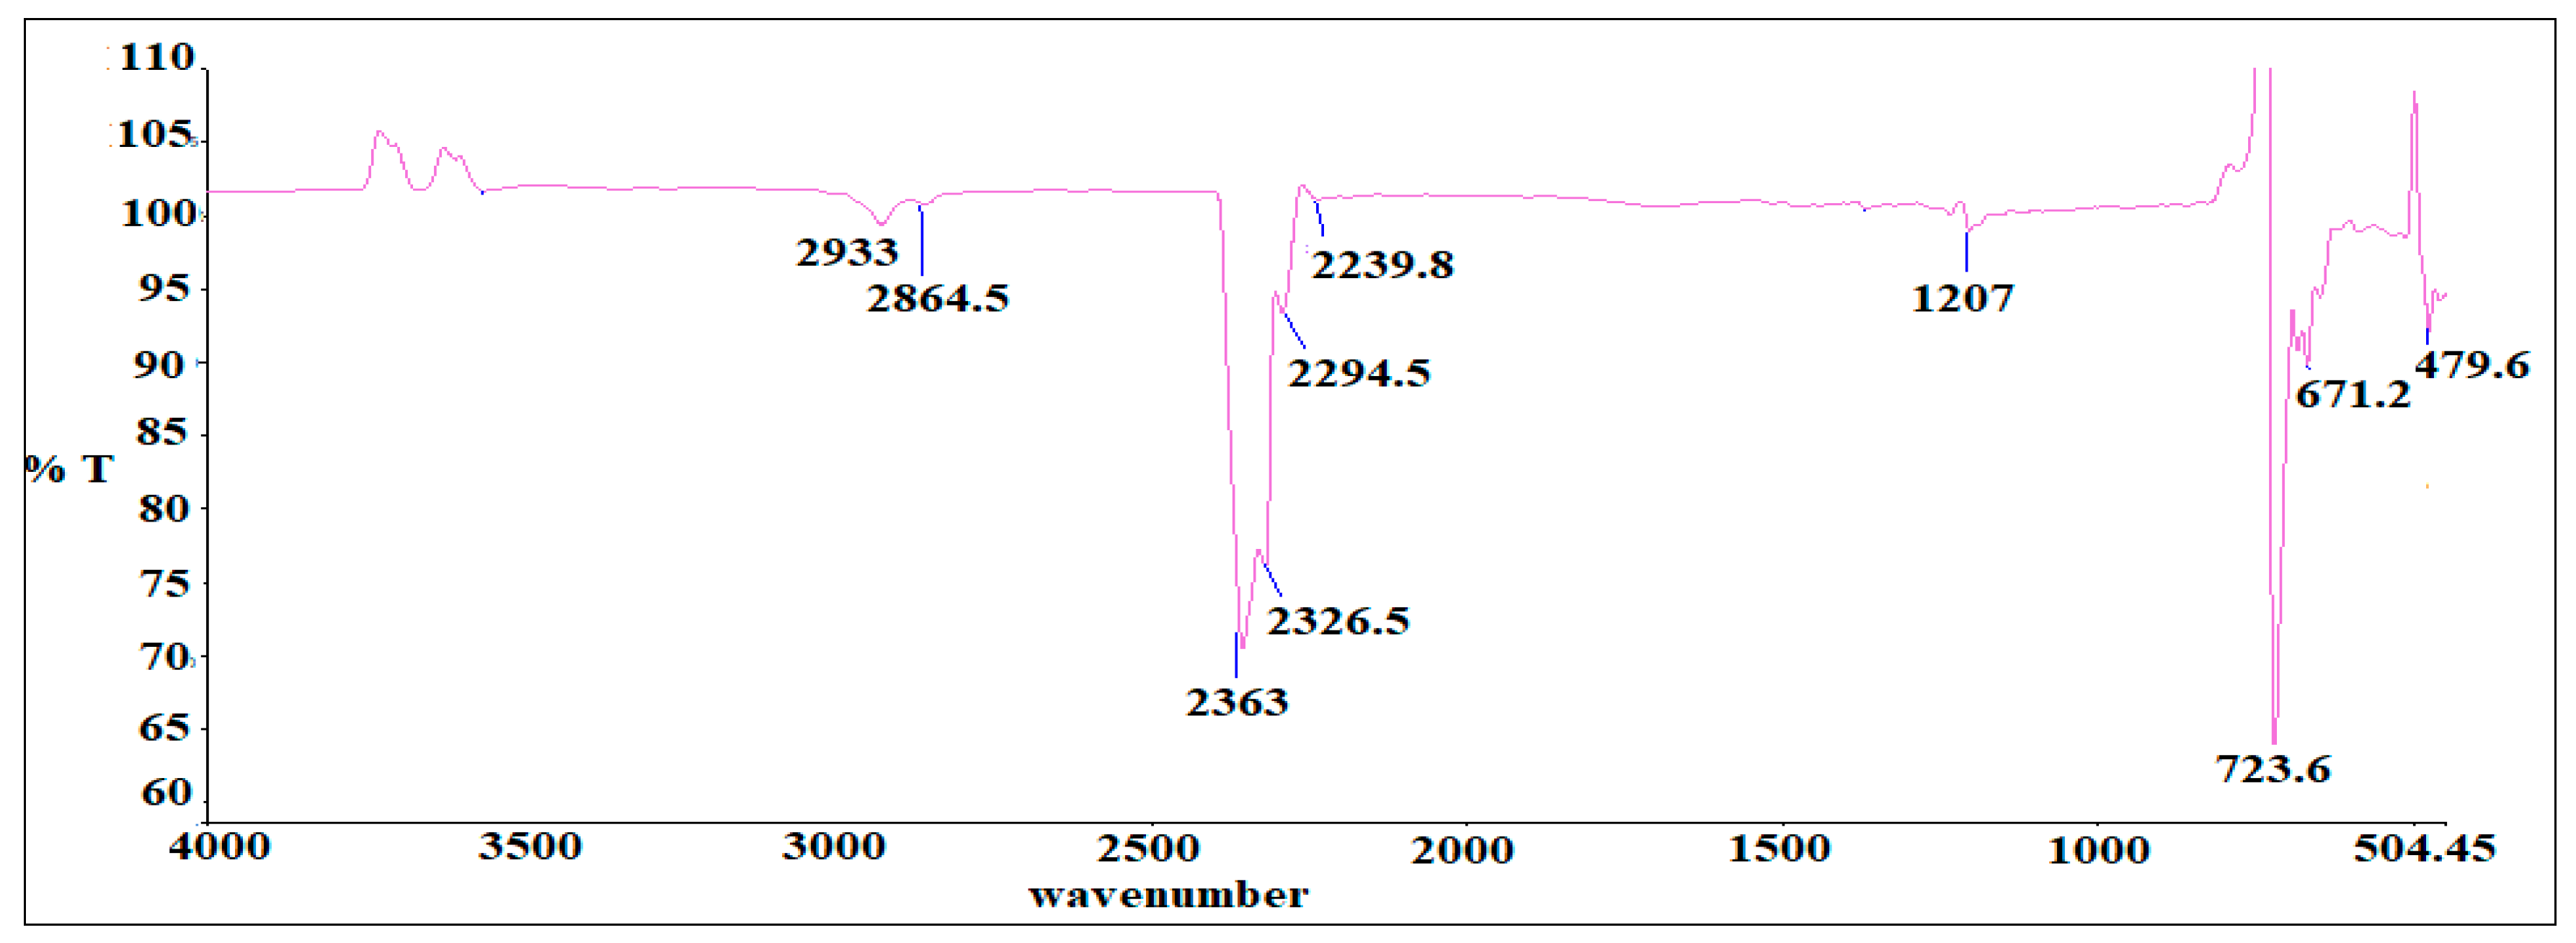
3.2. FTIR Analysis of as-Synthesized Surfactant
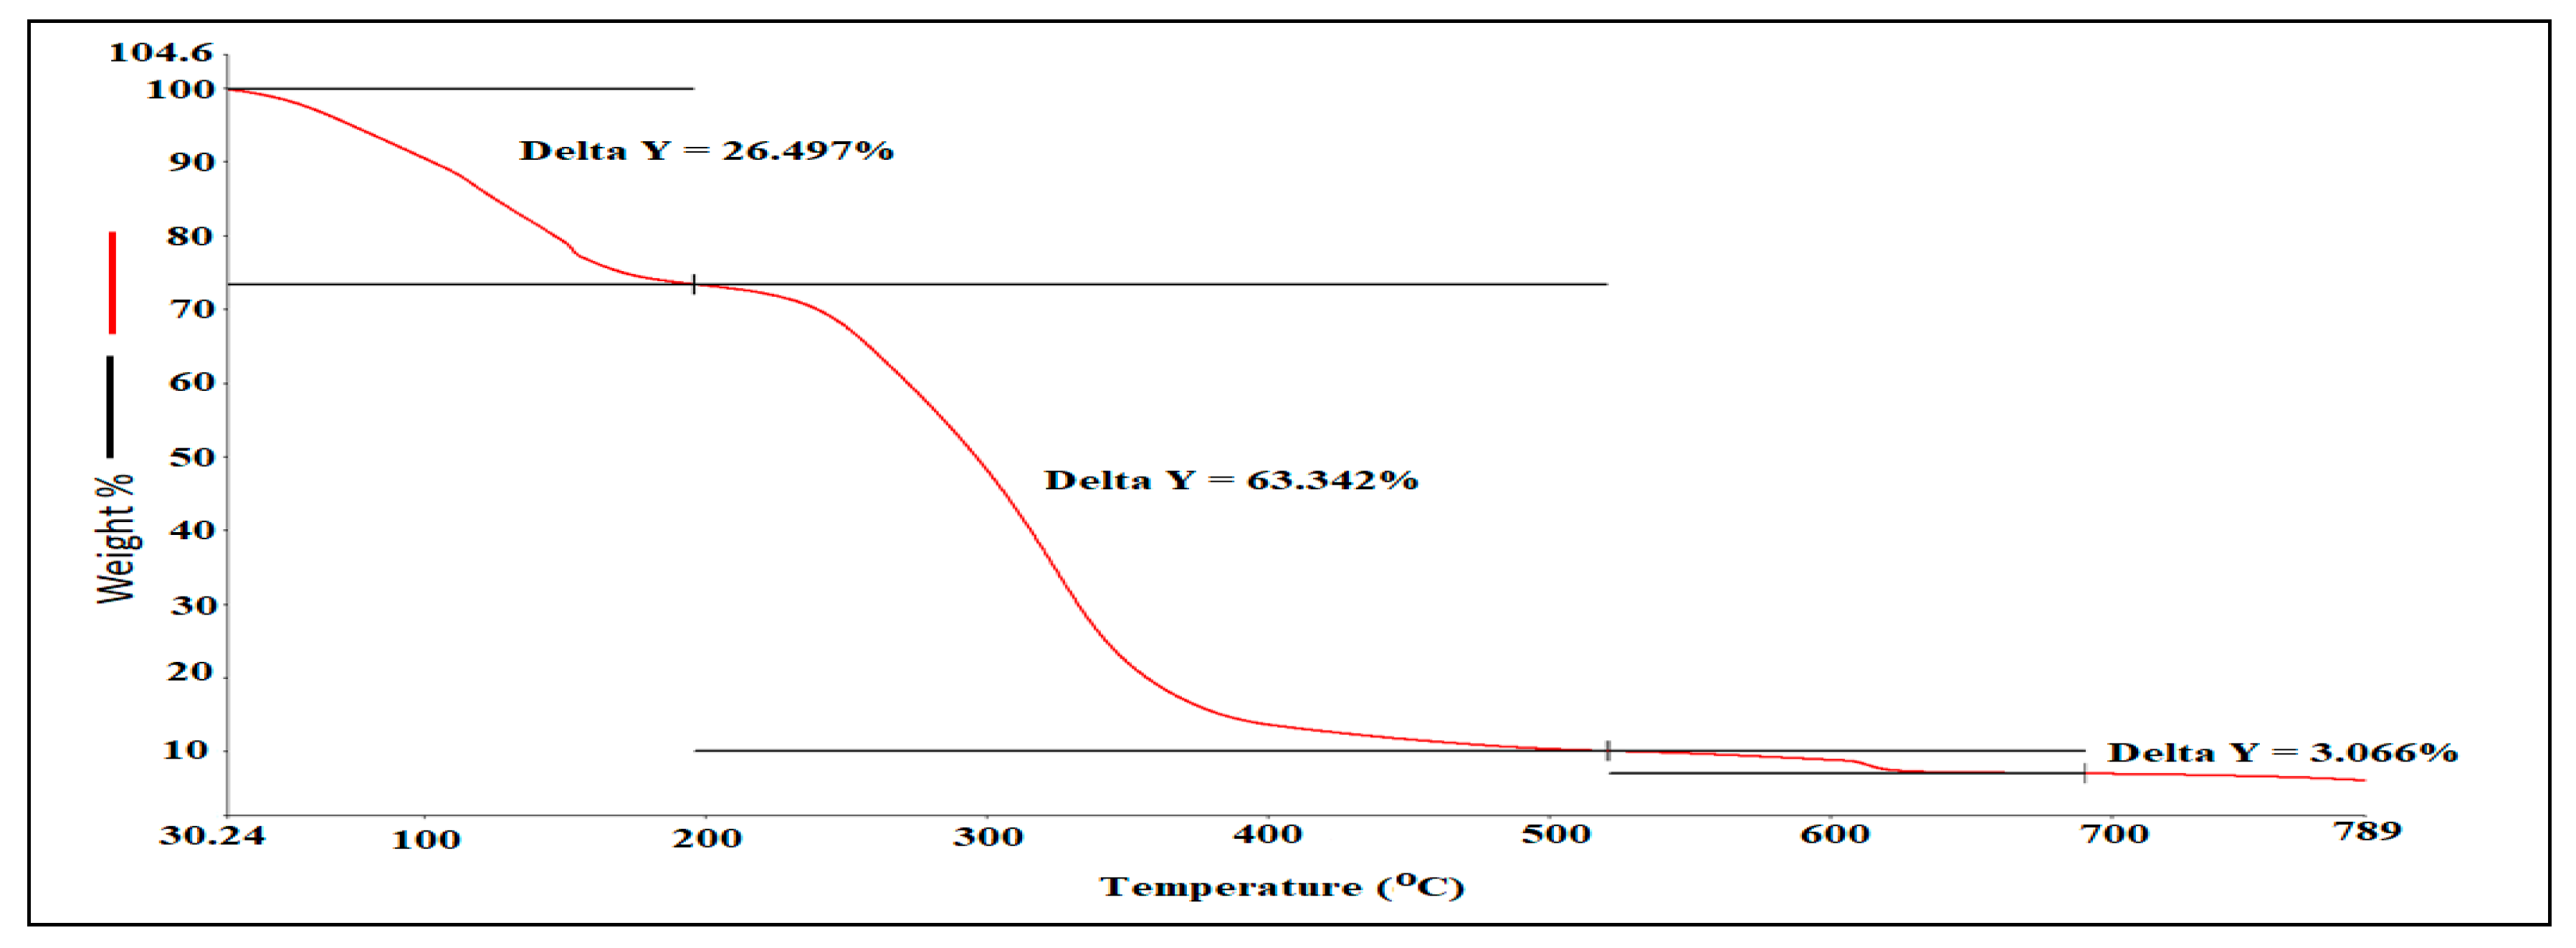
3.3. Hyphenated TGA-IR-Method
3.4. Determination of Surface Tension
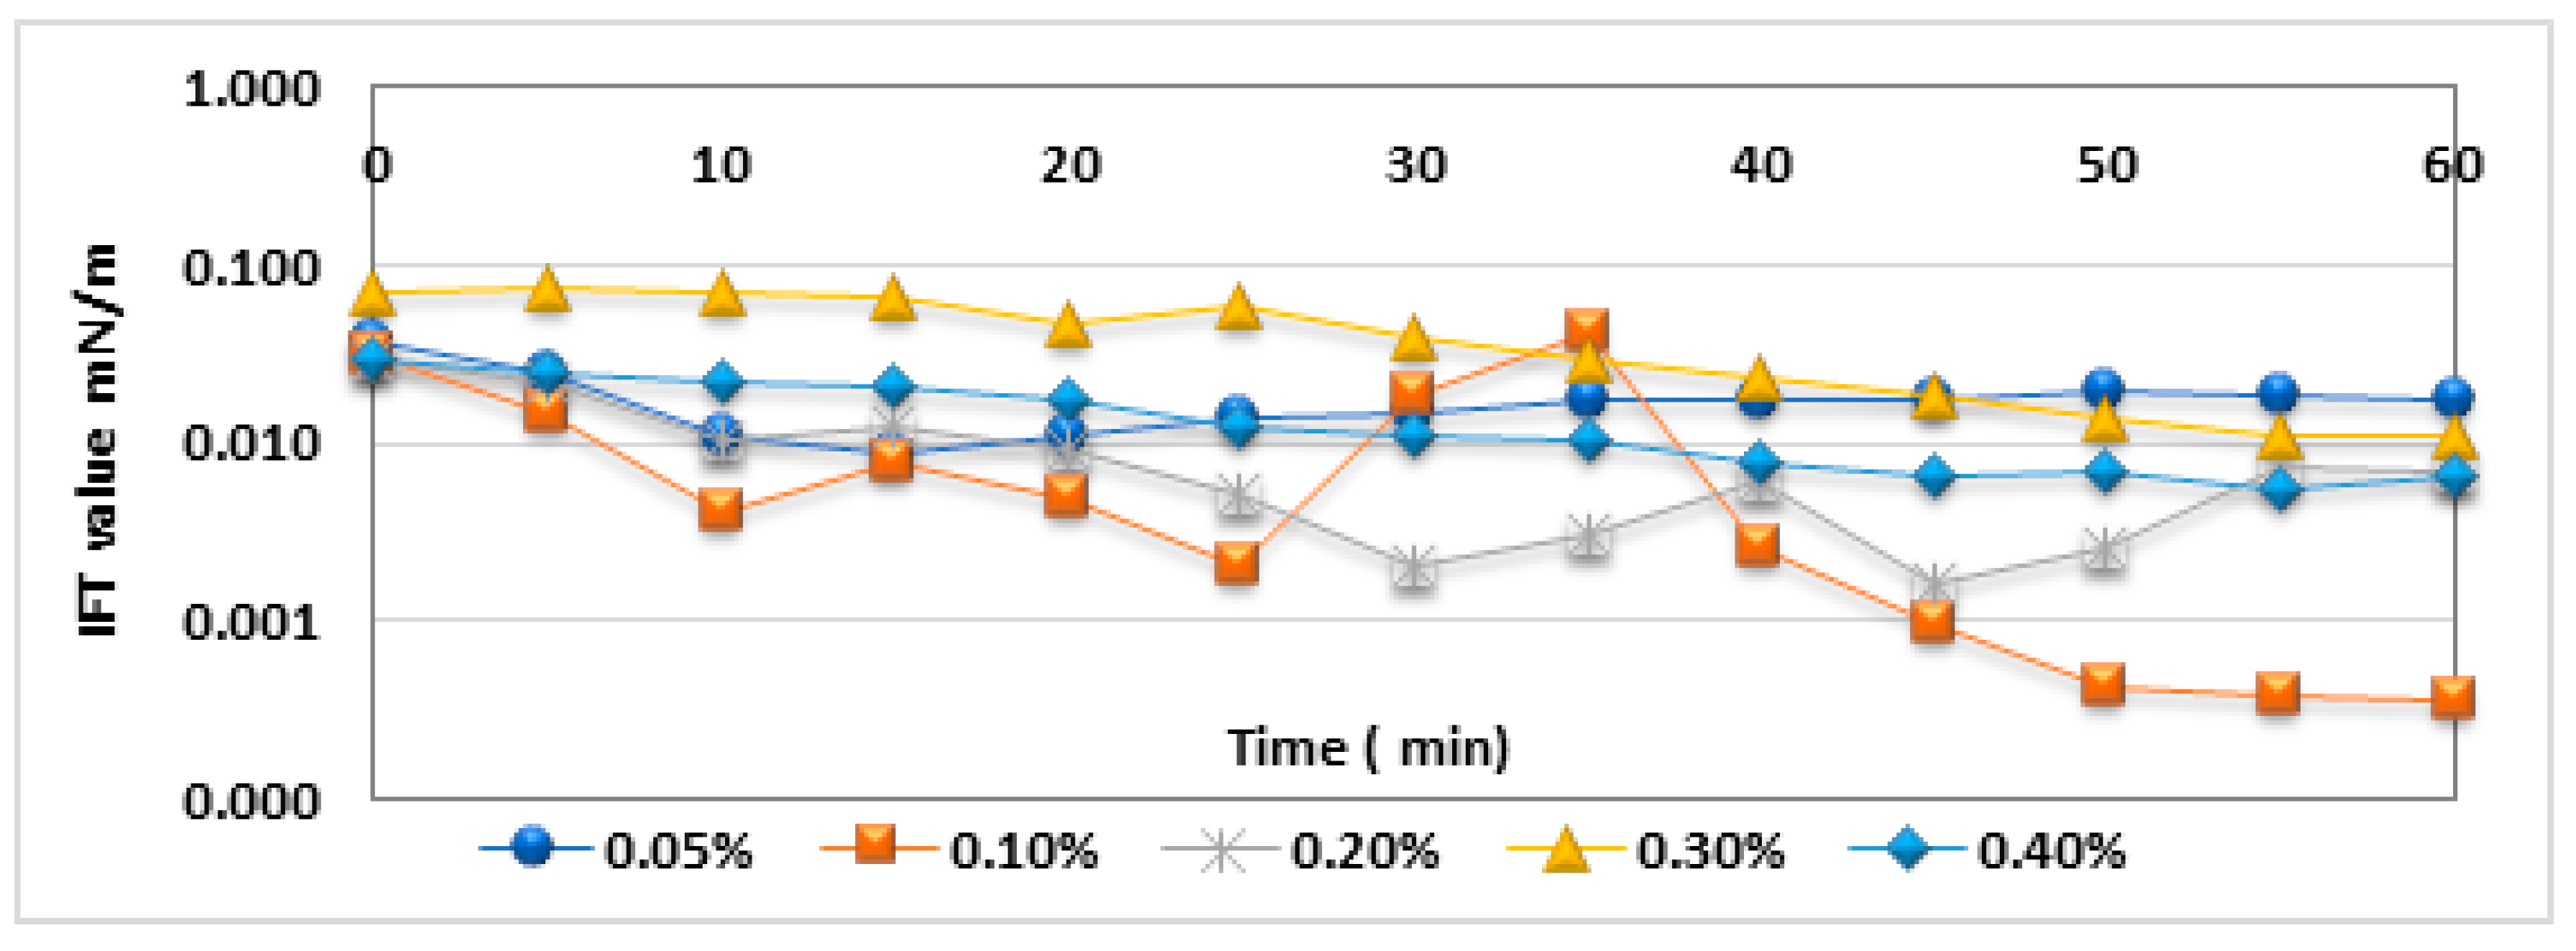
3.5. Dynamic Interfacial Tension (IFT) Analysis in Seawater
4. Conclusions
Author Contributions
Funding
Acknowledgments
Conflicts of Interest
Appendix A

References
- Babu, K.; Maurya, N.K.; Mandal, A.; Saxena, V.K. Synthesis and characterization of sodium methyl ester sulfonate for chemically-enhanced oil recovery. Braz. J. Chem. Eng. 2015, 32, 795–803. [Google Scholar] [CrossRef] [Green Version]
- Bataweel, A. Enhanced Oil Recovery in High Salinity High Temperature Reservoir by Chemical Flooding Enhanced Oil Recovery in High Salinity High; Texas A&M University Libraries: Killeen, TX, USA, 2011. [Google Scholar]
- Shuyan, C.; Hongjuan, L.; Hong, S.; Xiang, Y.; Gehua, W.; Yujie, Z.; Jianan, Z. Synthesis and physiochemical performance evaluation of novel sulphobetaine zwitterionic surfactants from lignin for enhanced oil recovery. J. Mol. Liq. 2018, 249, 73–82. [Google Scholar] [CrossRef]
- Diamant, H.; David, A. Kinetics of surfactant adsorption at fluid-fluid interfaces. J. Phys. Chem. 1996, 100, 13732–13742. [Google Scholar] [CrossRef] [Green Version]
- Eastoe, J.; Rico, F.T. Colloidal foundations of nanoscience. In Surfactants and Nanoscience; Elsevier, B.V.: Amsterdam, The Netherlands, 2014. [Google Scholar] [CrossRef]
- El-Hefian, E.A.; Abdul, H.Y. Investigation on some properties of SDS solutions. Aust. J. Basic Appl. Sci. 2011, 5, 1221–1227. [Google Scholar]
- Feng, D. Synthesis and surface activities of amidobetaine surfactants with ultra-long unsaturated hydrophobic chains. J. Surfactants Deterg. 2012, 15, 657–661. [Google Scholar] [CrossRef]
- Salager, J.L.; Forgiarini, A.M.; Márquez, L.; Manchego, L.; Bullón, J. How to attain an ultralow interfacial tension and a three-phase behavior with a surfactant formulation for enhanced oil recovery: A review. Part 2. Performance improvement trends from winsor’s premise to currently proposed inter- and intra-molecular. J. Surfactants Detergents 2013, 16, 631–663. [Google Scholar] [CrossRef] [PubMed] [Green Version]
- Fu, L.; Wang, Z.; Li, X.; Zhang, L. Surface properties, micellar molecular interaction, and physical properties for binary systems of sodium oleate with three anionic surfactants. J. Dispers. Sci. Technol. 2017, 38, 712–720. [Google Scholar] [CrossRef]
- Lomax, E.G. Amphoteric Surfactants, 2nd ed.; Marcel Dekker Inc.: New York, NY, USA, 1996. [Google Scholar]
- Gogoi, S.B. Adsorption-desorption of surfactant for enhanced oil recovery. Transp. Porous Media 2011, 90, 589–604. [Google Scholar] [CrossRef]
- Hutin, A. Dynamic Adsorption of Surfactants at Air/Water Interface; Linkedin: Sunnyvale, CA, USA, 2019. [Google Scholar]
- Ping, J.; Na, L.; Jijiang, G.; Guicai, Z.; Yang, W.; Lifeng, C.; Lei, Z. Efficiency of a sulfobetaine-type surfactant on lowering IFT at crude oil-formation water interface. Colloids Surf. A: Physicochem. Eng. Asp. 2014, 443, 141–148. [Google Scholar]
- Kedar, V.; Sunil, S.B. Effect of salinity on the ift between aqueous surfactant solution and crude oil. Pet. Sci. Technol. 2018, 36, 835–842. [Google Scholar] [CrossRef]
- Jun, L.; Pathma, J.; Liyanage, S.S.; Stephanie, A.; Gayani, P.; Arachchilage, D.H.K.; Christopher, B.; Upali, W.; Gary, A.P. New surfactant developments for chemical enhanced oil recovery. J. Pet. Sci. Eng. 2014, 120, 94–101. [Google Scholar] [CrossRef]
- Ouellette, R.J.; David, R.J. Amines and amides. Princ. Org. Chem. 2015, 315–342. [Google Scholar]
- Rosen, M.J. Ultralow interfacial tension for enhanced oil recovery at very low surfactant concentrations. Langmuir 2015, 21, 3749–3756. [Google Scholar] [CrossRef] [PubMed]
- Theodorou, V.; Georgios, P.; Konstantinos, S. A mild alkaline hydrolysis of N- and N, N-substituted amides and nitriles. Arch. Org. Chem. 2015, 2015, 101–112. [Google Scholar]
- Wang, D.; Liu, C.; Wu, W.; Wang, G. Novel surfactants that attain ultra-low interfacial tension between oil and high salinity formation water without adding alkali, salts, co-surfactants, alcohols and solvents. In Proceedings of the SPE EOR Conference at Oil and Gas West Asia, Muscat, Oman, 11–13 April 2010. [Google Scholar]
- Shi-Fa, W.; Takeshi, F.; Zhi, C. Synthesis of new betaine-type amphoteric surfactants from tall oil fatty acid. J. Wood Sci. 2002, 48, 419–424. [Google Scholar]
- Garing, C.; Voltolini, M.; Ajo-Franklin, J.B.; Benson, S.M. Pore-scale Evolution of Trapped CO2 at Early Stages Following Imbibition Using Micro-CT Imaging. Energy Procedia 2017, 114, 4872–4878. [Google Scholar] [CrossRef]
- Weers, J.G.; James, F.R.; Frank, U.A.; Charles, C. Effect of the intramolecular charge separation distance the solution properties of betaines and sulfobetaines. Langmuir 1991, 7, 854–867. [Google Scholar] [CrossRef]
- Yeming, X.; Xiaoxu, Z.; Huanxia, Z.; Wen, C. Synthesis, characterization, and surface-active properties of carboxylbetaine and sulfobetaine surfactants based on vegetable oil. J. Surfactants Deterg. 2018, 22, 103–114. [Google Scholar]
- Yarveicy, H.; Ali, H. Effect of amphoteric surfactant on phase behavior of hydrocarbon-electrolyte-water system-an application in enhanced oil recovery. J. Dispers. Sci. Technol. 2018, 39, 522–530. [Google Scholar] [CrossRef]


| Time | A% | B% | C% | D% | Flow (mL/min) | Max Pressure Limit (Bar) |
|---|---|---|---|---|---|---|
| 0 | 0.00 | 65.00 | 35.00 | 0.00 | 1.00 | 400.00 |
| 2 | 0.00 | 52.00 | 48.00 | 0.00 | 1.00 | 400.00 |
| 6 | 0.00 | 55.00 | 45.00 | 0.00 | 1.00 | 400.00 |
| 10 | 0.00 | 50.00 | 50.00 | 0.00 | 1.00 | 400.00 |
| 30 | 0.00 | 45.00 | 55.00 | 0.00 | 1.00 | 400.00 |
| 40 | 0.00 | 55.00 | 45.00 | 0.00 | 1.00 | 400.00 |
| 60 | 0.00 | 65.00 | 35.00 | 0.00 | 1.00 | 400.00 |
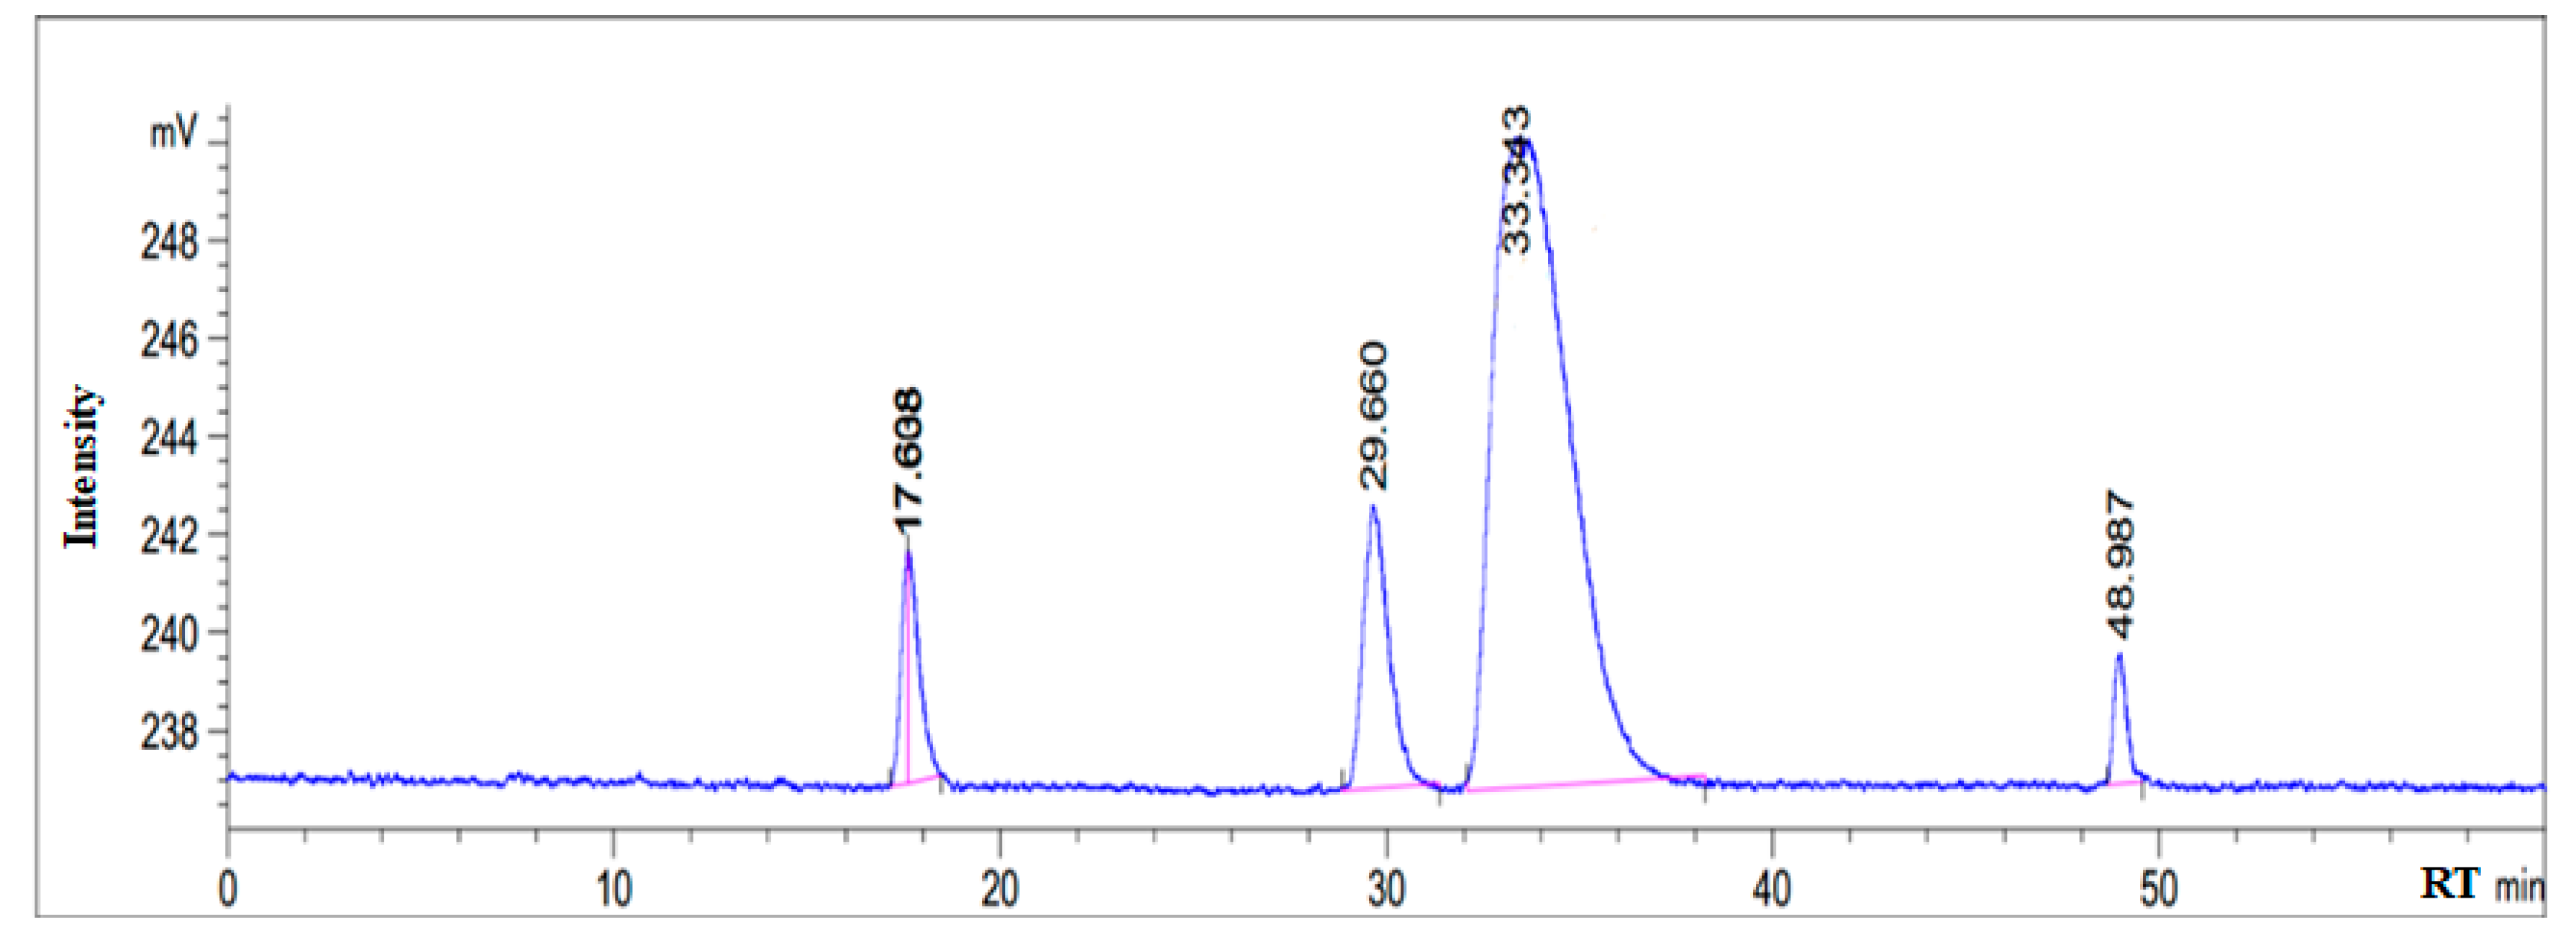
| Fatty Acids | Retention Time | % Area |
|---|---|---|
| C18 & below | 17.638 | 3.968 |
| C18:1 | 33.343 | 79.25 |
| C18:2 | 29.660 | 11.498 |
| others | 48.987 | 2.63 |
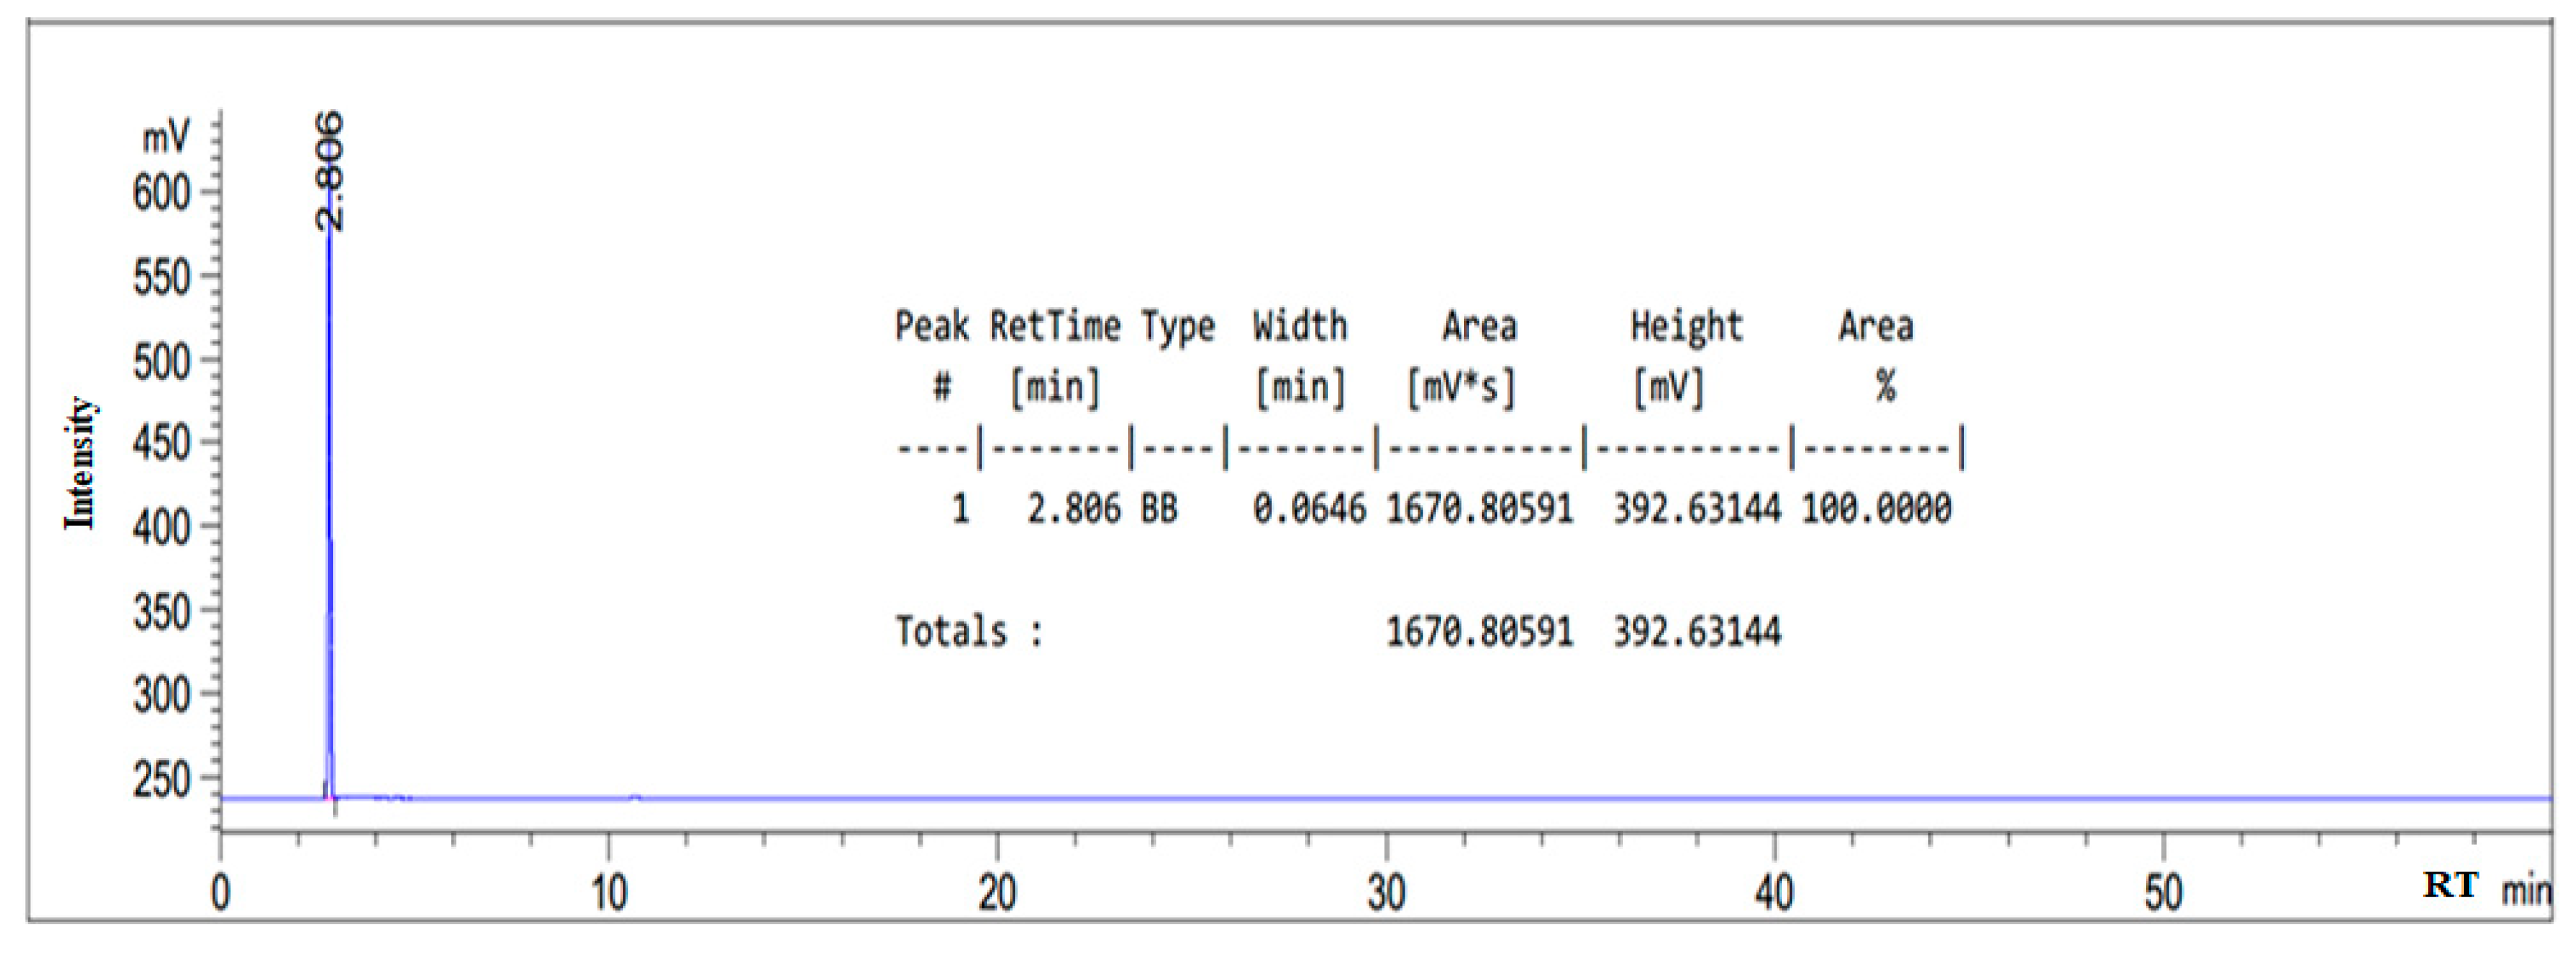
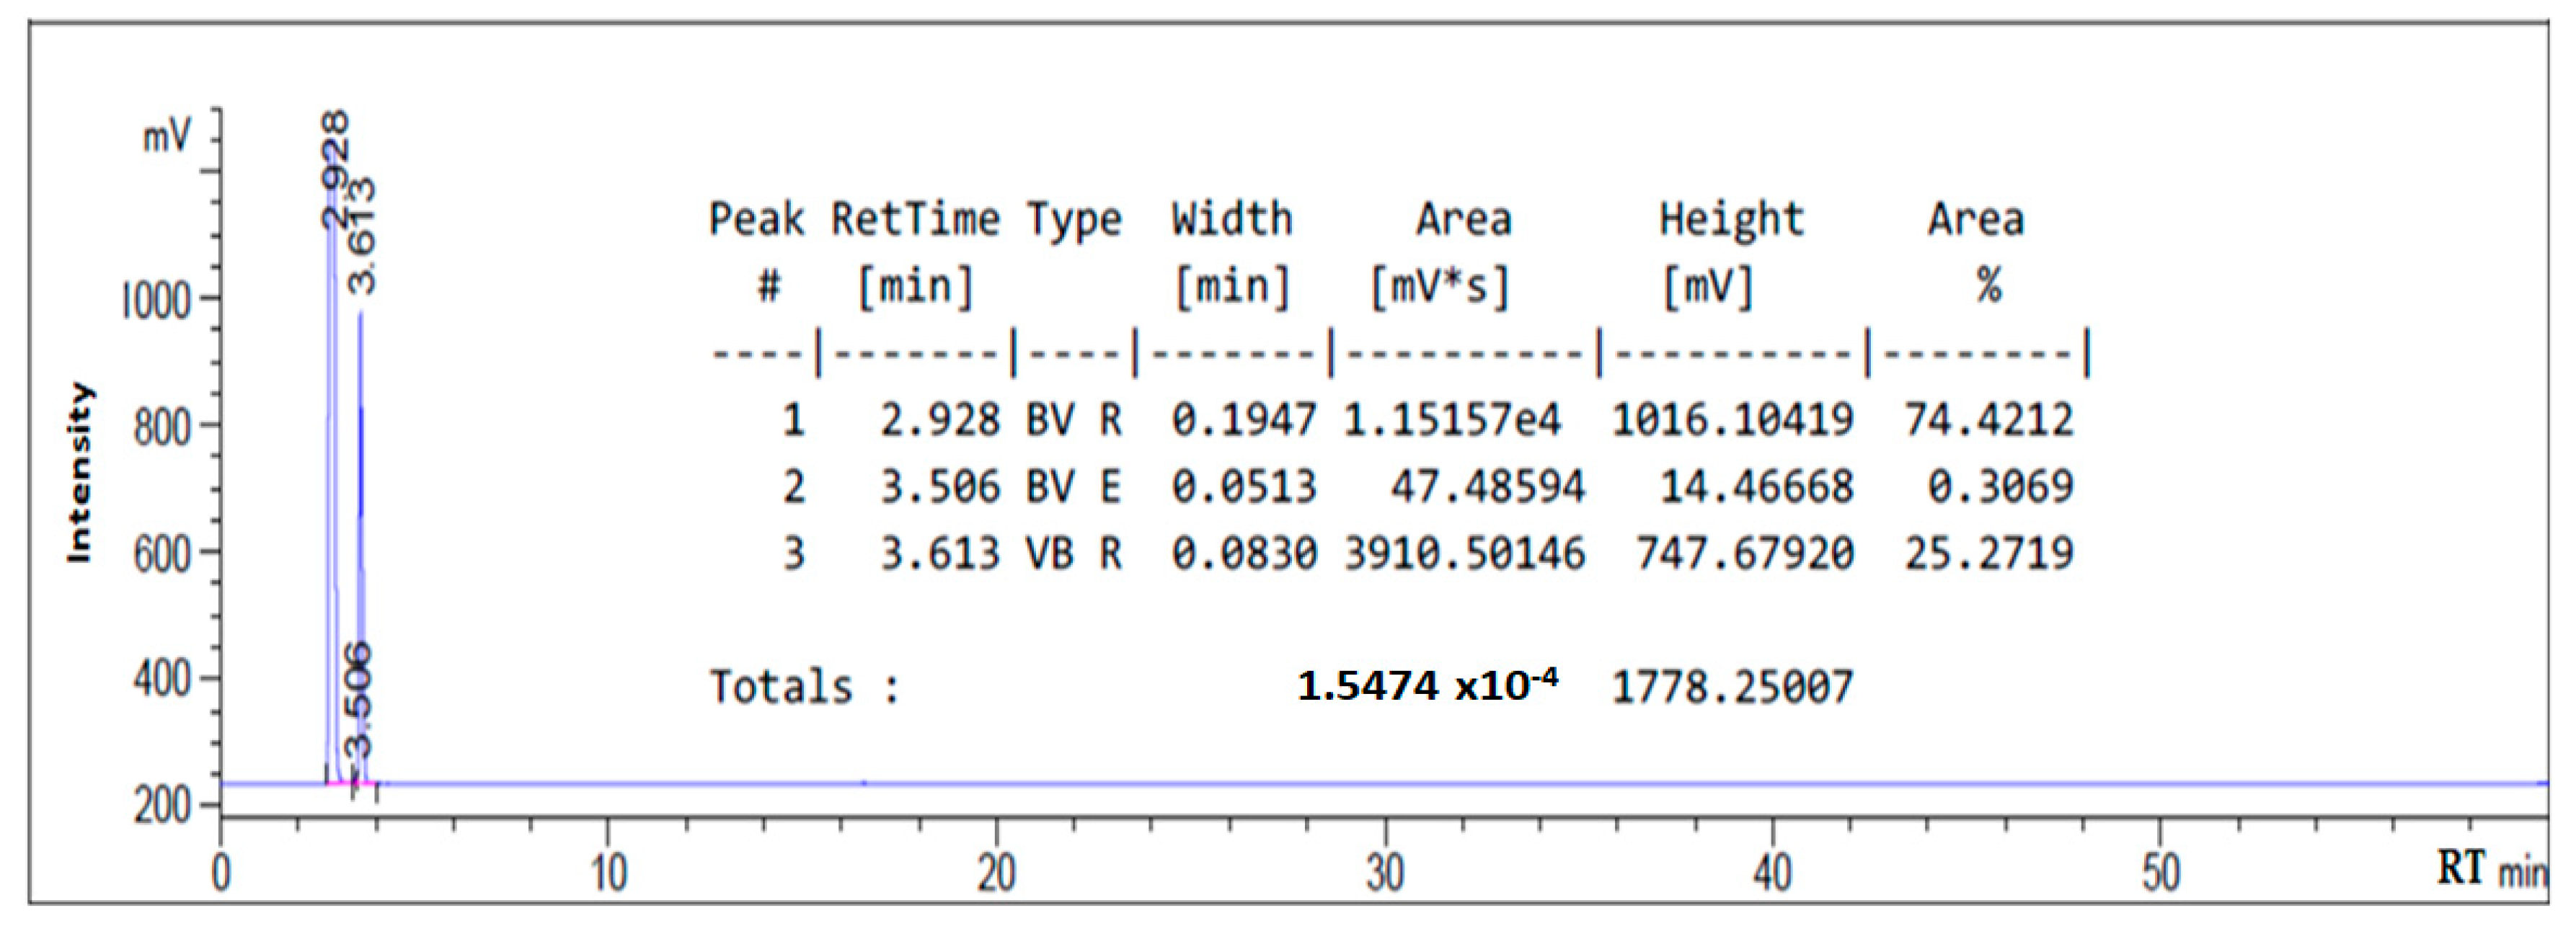
| Composition | Retention Time (min) |
|---|---|
| Oleic amido betaine | 5.669 |
| Fatty amide | 4.407 |
| Sodium oleate | 2.817 |
| Sodium chloroacetate | 3.630 |
| Mass Loss (%) | Temperature (°C) |
|---|---|
| 26.46 | 30–201.2 |
| 63.43 | 210–520.5 |
| 3.066 | 520–690 |
© 2020 by the authors. Licensee MDPI, Basel, Switzerland. This article is an open access article distributed under the terms and conditions of the Creative Commons Attribution (CC BY) license (http://creativecommons.org/licenses/by/4.0/).
Share and Cite
Ahmad Wazir, N.; Ramli, A.; Yusof, N.M.; Saphanuchart, W.; S. Majanun, E. As-Synthesized Oleic Amido Propyl Betaine Surfactant Mixture and the Effect on the Crude Oil–Seawater Interfacial Tension. Processes 2020, 8, 965. https://doi.org/10.3390/pr8080965
Ahmad Wazir N, Ramli A, Yusof NM, Saphanuchart W, S. Majanun E. As-Synthesized Oleic Amido Propyl Betaine Surfactant Mixture and the Effect on the Crude Oil–Seawater Interfacial Tension. Processes. 2020; 8(8):965. https://doi.org/10.3390/pr8080965
Chicago/Turabian StyleAhmad Wazir, Norhidayah, Anita Ramli, Nurida M. Yusof, Wasan Saphanuchart, and Emily S. Majanun. 2020. "As-Synthesized Oleic Amido Propyl Betaine Surfactant Mixture and the Effect on the Crude Oil–Seawater Interfacial Tension" Processes 8, no. 8: 965. https://doi.org/10.3390/pr8080965
APA StyleAhmad Wazir, N., Ramli, A., Yusof, N. M., Saphanuchart, W., & S. Majanun, E. (2020). As-Synthesized Oleic Amido Propyl Betaine Surfactant Mixture and the Effect on the Crude Oil–Seawater Interfacial Tension. Processes, 8(8), 965. https://doi.org/10.3390/pr8080965