Article

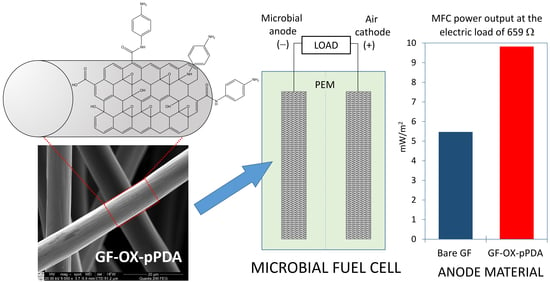
Enhanced Performance of Microbial Fuel Cells with Anodes from Ethylenediamine and Phenylenediamine Modified Graphite Felt

by
Egidijus Griškonis
1,
Arminas Ilginis
1,
Ilona Jonuškienė
2,
Laurencas Raslavičius
3,
Rolandas Jonynas
4 and
Kristina Kantminienė
1,*
1
Department of Physical and Inorganic Chemistry, Faculty of Chemical Technology, Kaunas University of Technology, Radvilėnų pl. 19, 50254 Kaunas, Lithuania
2
Department of Organic Chemistry, Faculty of Chemical Technology, Kaunas University of Technology, Radvilėnų pl. 19, 50254 Kaunas, Lithuania
3
Department of Transport Engineering, Faculty of Mechanical Engineering and Design, Kaunas University of Technology, Studentų g. 56, 51424 Kaunas, Lithuania
4
Department of Energy, Faculty of Mechanical Engineering and Design, Kaunas University of Technology, Studentų g. 56, 51424 Kaunas, Lithuania
*
Author to whom correspondence should be addressed.
Processes 2020, 8(8), 939; https://doi.org/10.3390/pr8080939
Submission received: 15 July 2020 / Revised: 28 July 2020 / Accepted: 2 August 2020 / Published: 5 August 2020
(This article belongs to the Special Issue Electrochemical Energy Conversion and Storage Processes)

Abstract

:
A microbial fuel cell (MFC) is a promising renewable energy option, which enables the effective and sustainable harvesting of electrical power due to bacterial activity and, at the same time, can also treat wastewater and utilise organic wastes or renewable biomass. However, the practical implementation of MFCs is limited and, therefore, it is important to improve their performance before they can be scaled up. The surface modification of anode material is one way to improve MFC performance by enhancing bacterial cell adhesion, cell viability and extracellular electron transfer. The modification of graphite felt (GF), used as an anode in MFCs, by electrochemical oxidation followed by the treatment with ethylenediamine or p-phenylenediamine in one-step short duration reactions with the aim of introducing amino groups on the surface of GF led to the enhancement of the overall performance characteristics of MFCs. The MFC with the anode from GF modified with p-phenylenediamine provided approx. 32% higher voltage than the control MFC with a bare GF anode, when electric circuits of the investigated MFCs were loaded with resistors of 659 Ω. Its surface power density was higher by approx. 1.75 times than that of the control. Decreasing temperature down to 0 °C resulted in just an approx. 30% reduction in voltage generated by the MFC with the anode from GF modified with p-phenylenediamine.

Graphical Abstract

1. Introduction

Expectations of contemporary society for sustainable energy production and wastewater reclamation or effluent‘s return to the water cycle with minimal environmental issues have evolved over time [1]. Thus, wastewater treatment is seen as a sustainable process if sustainable innovations and technologies can be adopted. Among these technical innovations and progressive developments, microbial fuel cells (MFCs) as an emerging technology that may serve customers in a variety of industry sectors are bringing new opportunities. MFCs provide a new technology that can act as pollutant removal devices by using microorganisms available in wastewater as catalysts to oxidize substrates and produce much needed electricity. MFC technologies have unique features and abilities to solve energy and environmental issues [2]. Electricity generation, effective and efficient harvesting of practically usable power for distributed power systems, still remains a critical milestone and a key challenge for further MFCs development and their successful deployment [3]. The MFCs have had—and still have—poor stability, high costs, and a low output of generated power for practical application. Nevertheless, during the most recent couple of decades, they have been a target of global-scale research. In general, the microbial fuel cell research is a highly new cross-discipline involving [4]: power electronics (application of the charge pumps, off-the-shelf capacitors, rechargeable batteries, etc.) [3], environmental engineering [3,4,5], biochemistry [4], circuitry [3], programing [3], bioelectrochemistry [4,6], microbiology [4,7,8,9], robotics [3,10], molecular biology [4], and materials science [4,11,12,13,14,15]. Despite the inherent simplicity of MFCs and their environmentally friendly nature, the anode is a crucial component of the whole system, both functionally and structurally. An ideal anodic material usually encompasses four major properties, the compatibility of which is affected by a combination of several reasons: low price and high biocompatibility, conductivity, and chemical stability. However, compatibility problems arise even when the anodic material selection and design is supposedly proper. It is a major reason underlying the low efficiency in different microbial fuel cell prototypes and is still a primary setback for its practical applications.
Recently, some active measures among the researchers worldwide have been taken to improve the performance of electrodes, including their surface modifications and architecture design. Various macroporous carbons of different pore sizes, containing one-dimensionally (contain channels that do not interconnect with each other), two-dimensionally (interconnection of pores in only one direction) and three-dimensionally (interconnection of pores in two crystallographic directions) connected voids were developed for anodes in MFCs, such as reticulated vitreous carbon, graphite felt, electrospun carbon fiber materials, carbon paper, carbon fiber cloth fabrics, carbon rods, carbon nanotubes, activated carbon, carbon materials derived from natural biomasses, activated carbon fibers, carbon fiber mesh, graphite fiber brush, and layered corrugated carbon [16]. Graphite felt (GF) or carbon felt is a fiber fabric that is much thicker than materials such as carbon paper, graphite plates or sheets, and carbon cloth [17]. Most MFC studies involving the materials like bare GF only focus on maximizing power densities on a volume basis, resulting in difficulties in quantitative comparisons among different materials [17]. The loose texture of bare GF confers more space for bacterial growth than other carbon materials having plane structure, but the bacterial growth is restricted by the mass transfer of substrate and products on its surface [17]. Surface modification of graphite-based anode materials could enhance bacterial cell adhesion, cell viability and facilitate extracellular electron transfer [14]. C-, N-, O-, and S-containing functional groups have been frequently investigated in anode surface modification with the purpose to enhance bacterial attachment [18]. The carbon-based material surface containing nitrogen-functional groups is more prone to absorb negatively charged bacteria, such as Gram-negative Shewanella putrefaciens, due to its increasing N/C ratio and positive charge on the surface leading to more favourable electron transfer and improved anode biocompatibility [19]. Anode surface modification with hydrophilic substances has been demonstrated to enhance bacterial affinity and thus promote power output [12]. It has been shown that the combined effect of the usage of phosphate buffer and the introduction of hydrophilic amino groups via the treatment of carbon cloth electrode with ammonia increased MFC power generation by 48% [20].
Therefore, the reported research involves modification of bare GF with ethylenediamine (EDA) and p-phenylenediamine (pPDA) in order to introduce N-containing amino groups onto the surface of GF and thus improve overall performance characteristics of the microbial fuel cell. The obtained results could provide theoretical and practical support for improving the production capacity of bio-electrochemical systems.

2. Materials and Methods

2.1. General Conditions

All chemicals were of analytical or biochemical grade and were purchased from Sigma-Aldrich, St. Louis, MO, USA; Eurochemicals, Vilnius, Lithuania; Carl Roth GmbH + Co. KG, Karlsruhe, Germany; and TCI Europe N.V., Zwijndrecht, Belgium. All microbial experiments were performed under strictly sterile conditions.

2.2. Electrodes

Investigation of MFC was carried out with the three types of anodes:
  • Bare graphite felt (GF) as a control;
  • GF modified with ethylenediamine (EDA);
  • GF modified with p-phenylenediamine (pPDA).
Polyacrylonitrile-based graphite felt AvCarb G200 (Fuel Cell Store, College Station, TX, USA) with the dimensions of 7 × 7 × 0.65 cm (length × width × thickness) was used for all MFC electrodes (cathodes and anodes). Before any wet processing, GF samples were wetted with 10% (v/v) aqueous propan-2-ol solution and washed well with distilled water. Thus, treated GF samples, while still wet, were placed into MFCs as cathodes and a control anode (bare GF).

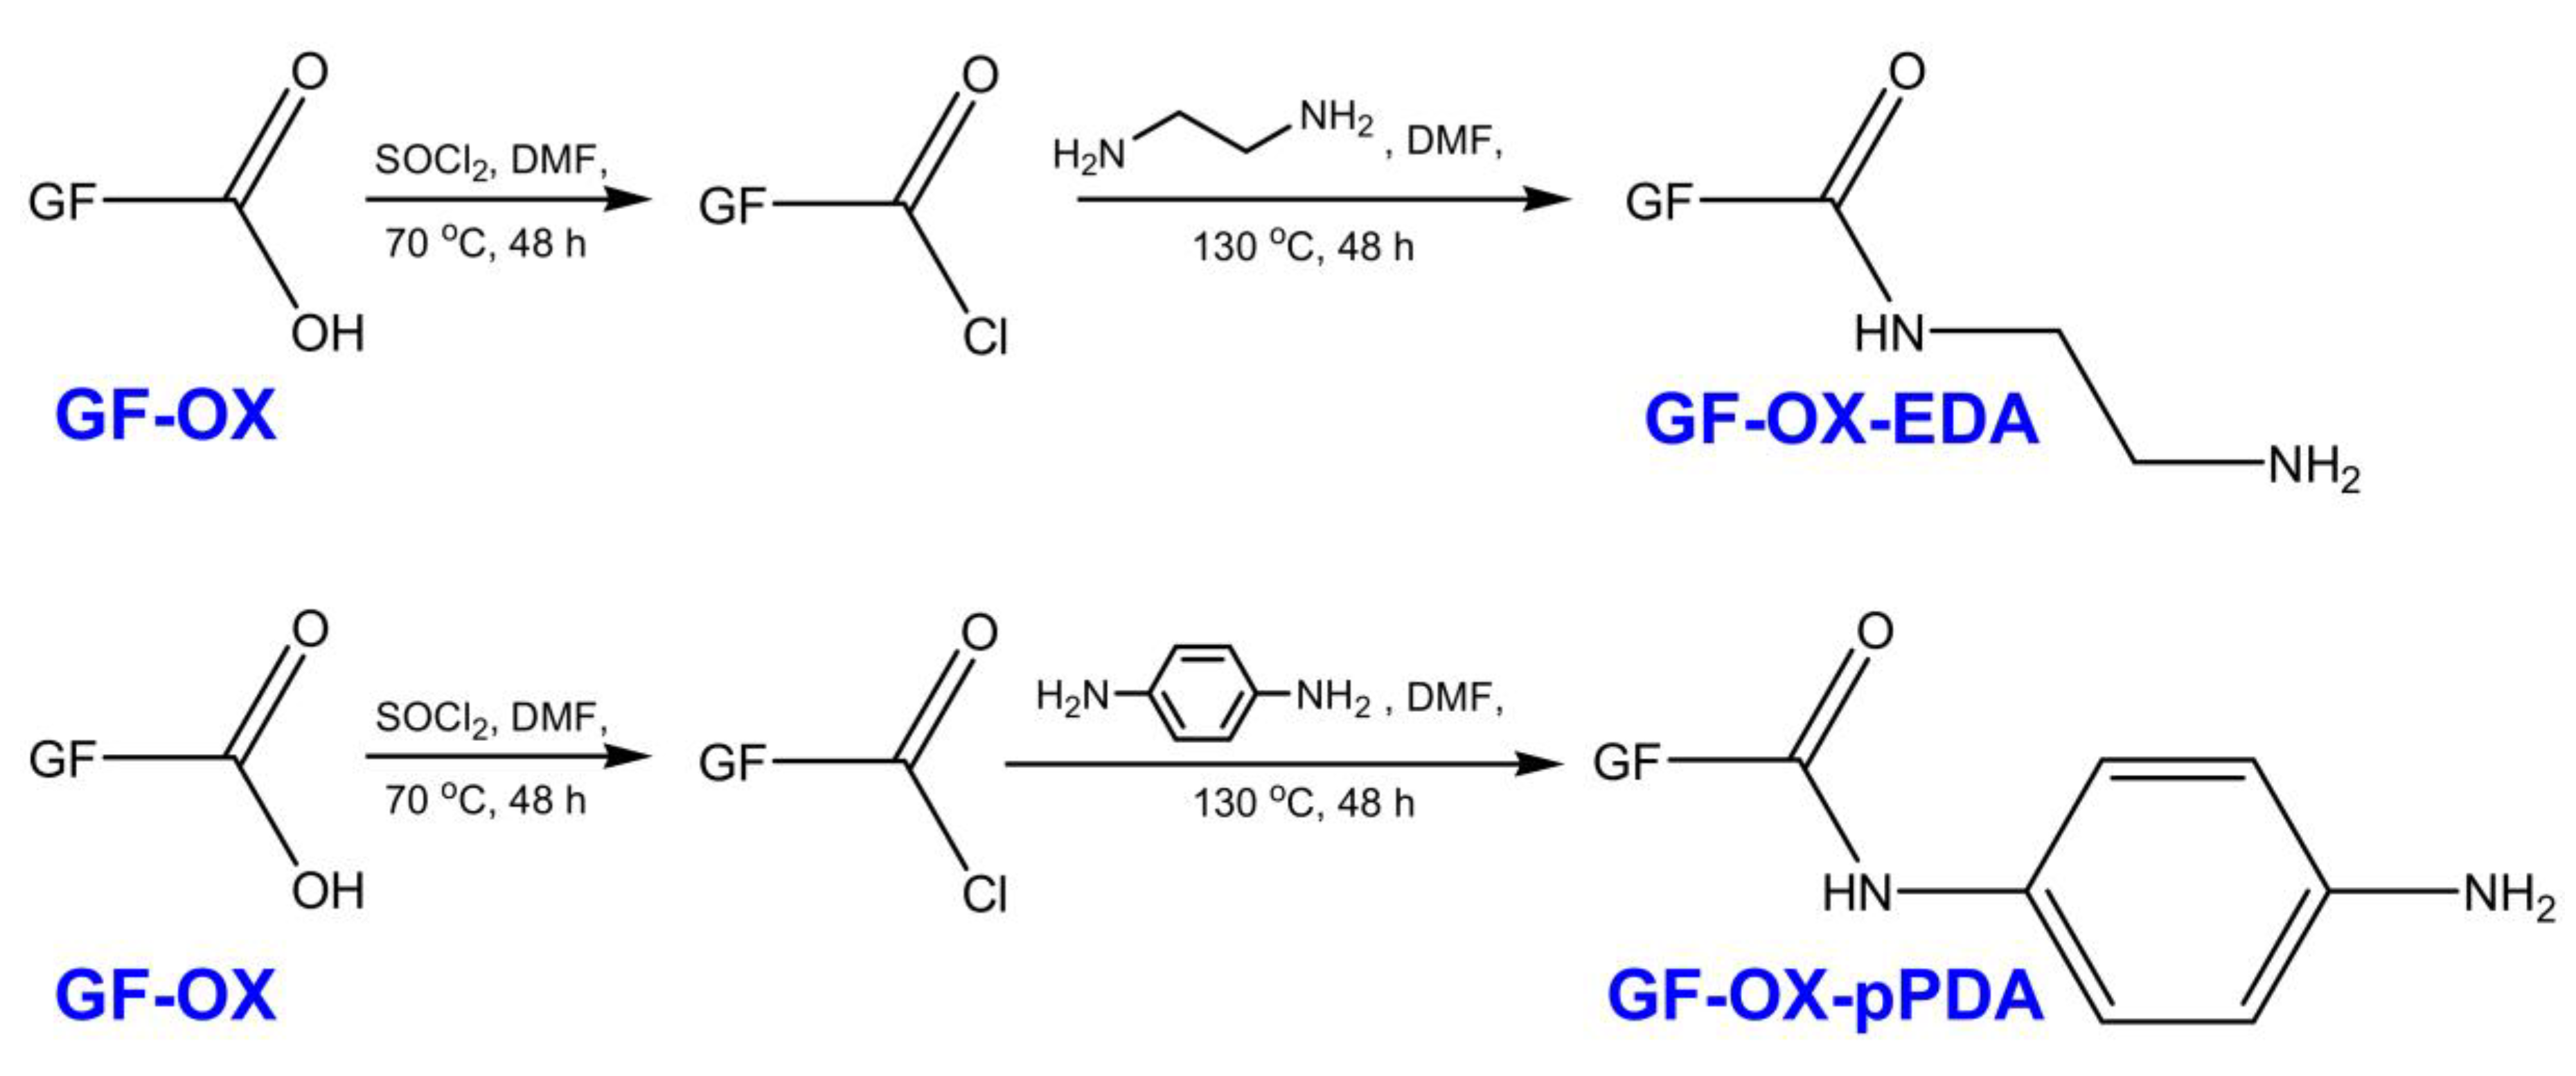
2.3. Anode Material Treatment

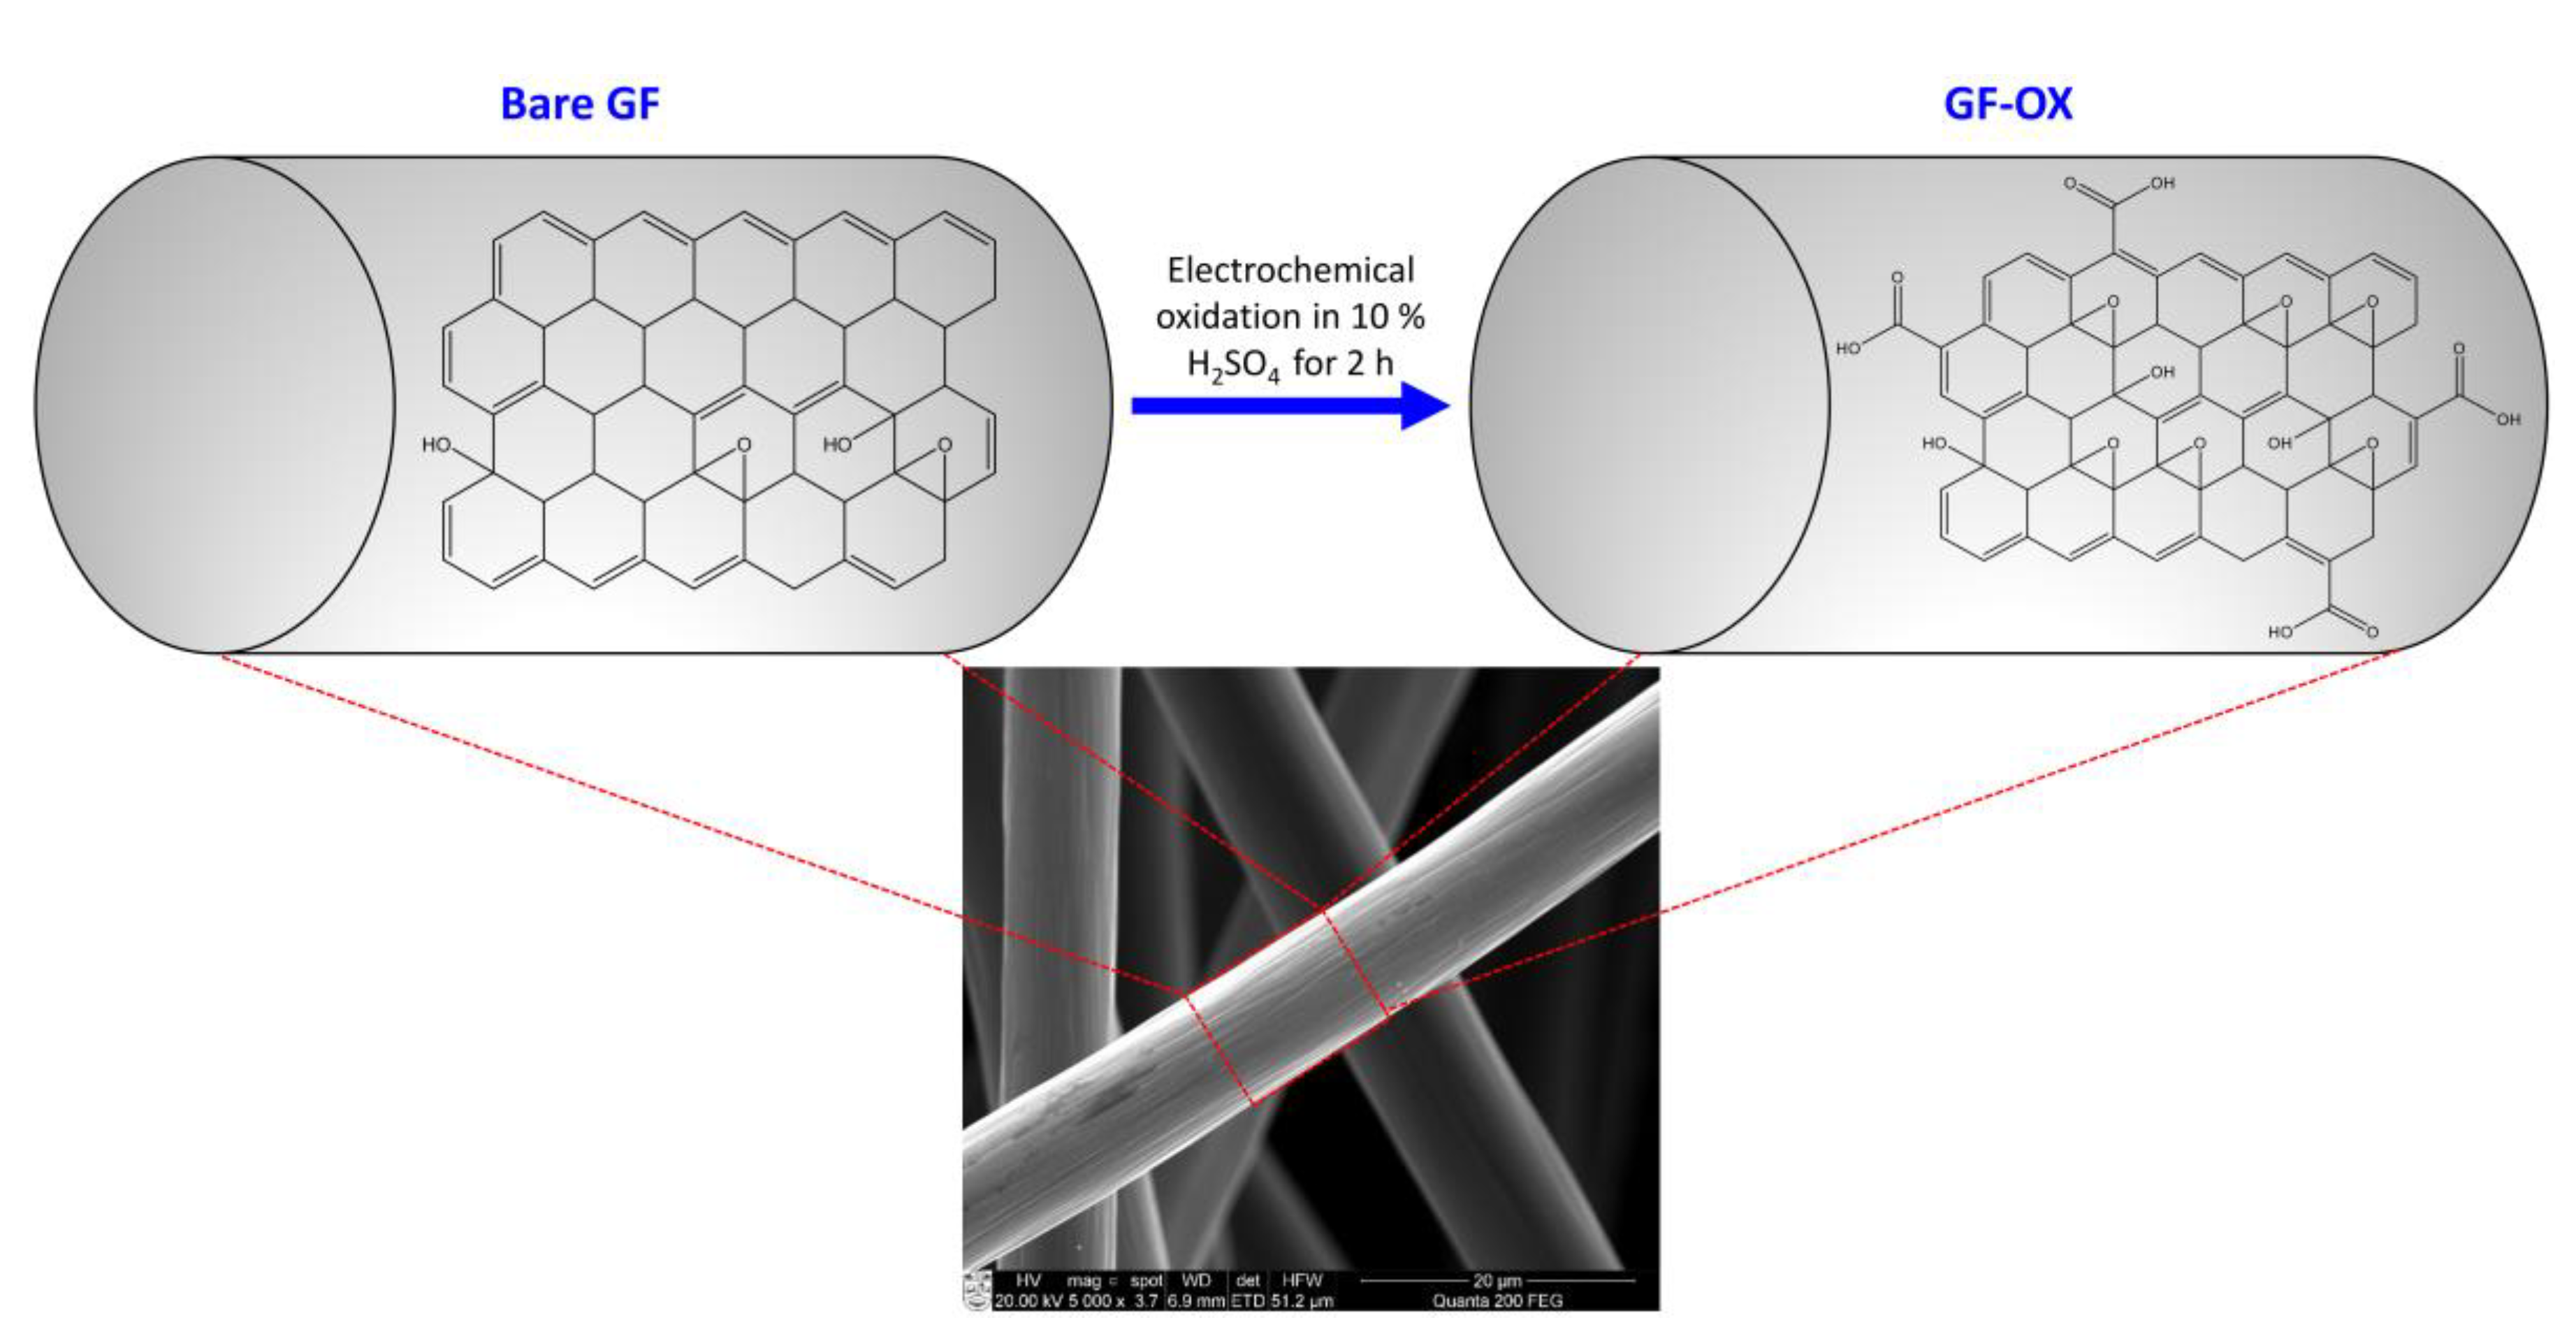
2.3.1. Electrochemical Oxidation of GF

First (before modification with diamines), GF was electrochemically oxidized for 2 h in a flow-through reactor with the network of interdigitate channels, through which 10% aqueous H2SO4 solution was circulated continuously at a 50 mL/min rate. The flow direction of the solution was reversed every 10 min. The GF electrode being electrochemically oxidized was polarized positively (as an anode), whereas another GF electrode was polarized negatively (as an auxiliary cathode). Electrodes were separated by a proton-exchange membrane (PEM) Nafion®NRE-212 (Fuel Cell Store, College Station, TX, USA). Potential difference between GF anode, which was being electrochemically oxidized, and the auxiliary cathode was changed in square waves from 0 to 3.5 V. The impulse period was 2 s with a duty cycle of 50%, i.e., t(on) = t(off) = 1 s. Electrochemically oxidized GF (GF-OX) was thoroughly washed with distilled water until a neutral medium of rinsing water was obtained. The GF-OX was then dried at 80 °C for 6 h. The hydrophilicity of dried GF-OX was tested by placing a drop of distilled water on a surface of the sample.

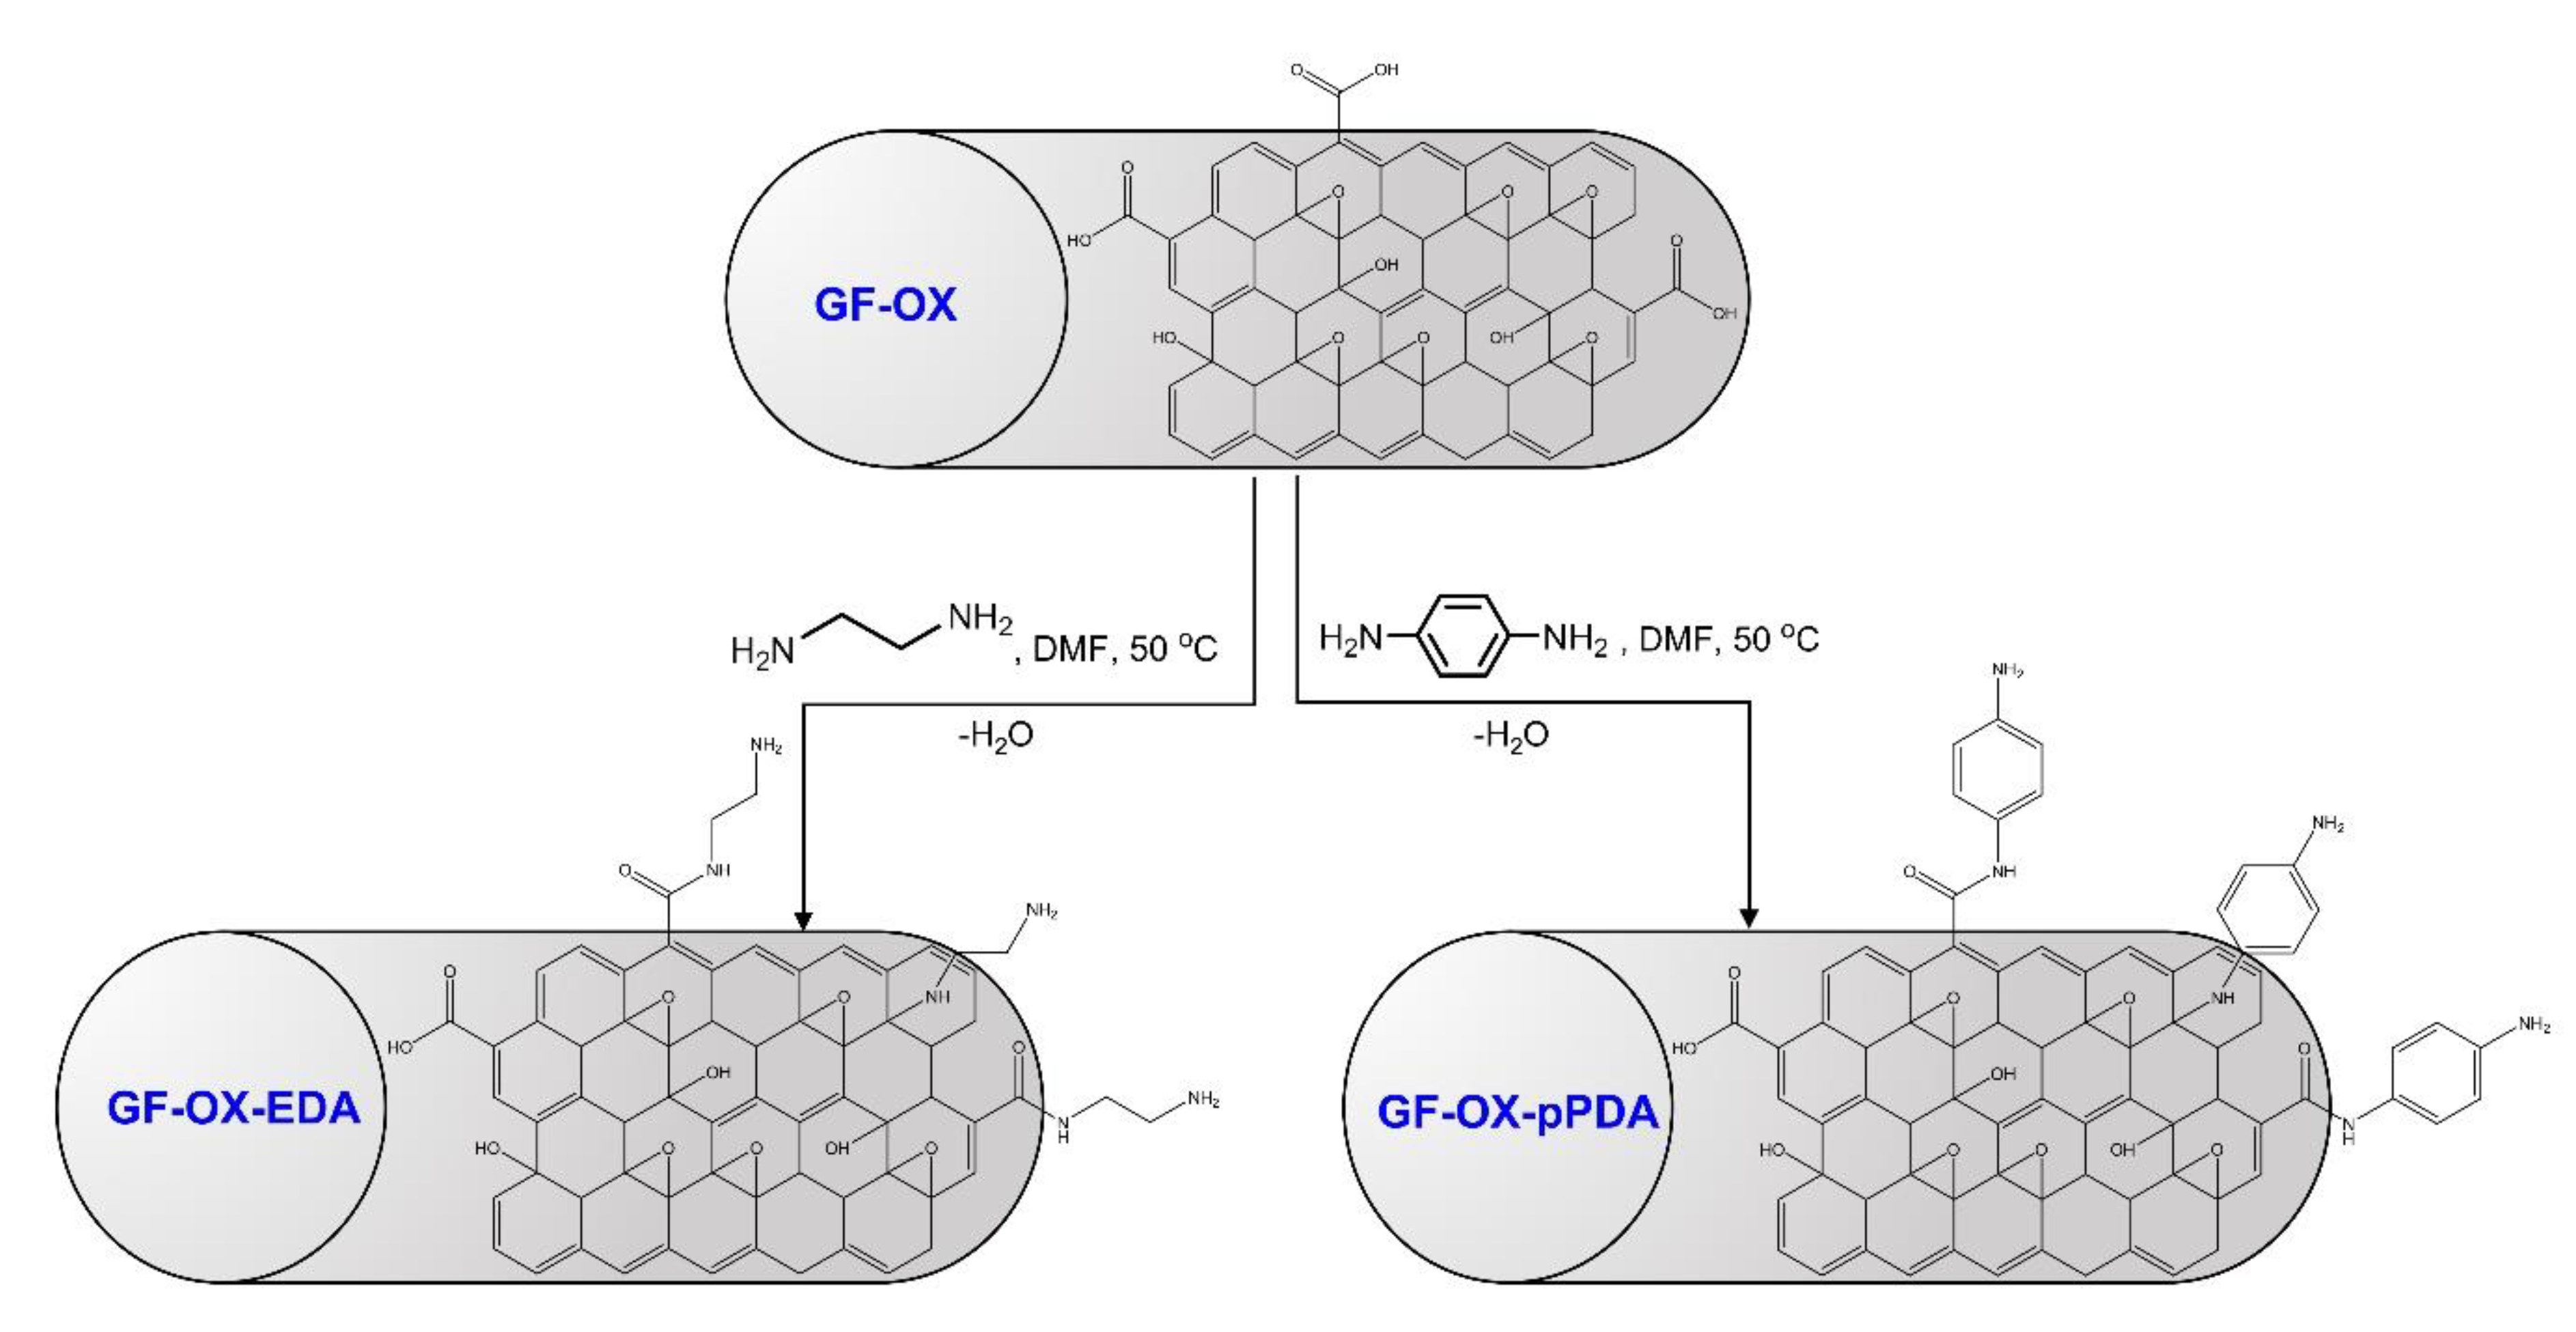
2.3.2. Treatment with Ethylenediamine (Ethane-1,2-Diamine or EDA)

Method A. For direct treatment with EDA, a GF-OX sample was put into a mixture solution containing 70 mL of EDA and 35 mL of N,N-dimethylformamide (DMF) and kept at 50 °C for 3 h. The sample was washed with ethanol and water, and dried at 80 °C overnight.
Method B. A GF-OX sample was put into a mixture solution containing 100 mL of SOCl2 and 5 mL of N,N-dimethylformamide (DMF) and was heated at 70 °C for 48 h. The sample was washed with tetrahydrofuran (THF) and dried at 80 °C overnight. Afterwards, it was put into a mixture solution containing 100 mL of EDA and 25 mL of DMF and heated at a reflux temperature of the mixture (130 °C) for 48 h. The sample was washed with ethanol and water, and dried at 80 °C overnight [21].
Electrochemically oxidized graphite felt, treated with EDA, is hereinafter referred to as GF-OX-EDA.

2.3.3. Treatment with p-Phenylenediamine (Benzene-1,4-Diamine or pPDA)

Method A. For direct treatment with pPDA, a GF-OX sample was put into a solution of 100 mL of DMF and 20 g of pPDA and was kept at 50 °C for 3 h. The sample was washed with ethanol and water, and dried at 80 °C overnight.
Method B. A GF-OX sample was put into a mixture solution containing 100 mL of SOCl2 and 5 mL of DMF and was heated at 70 °C for 48 h. The sample was washed with THF and dried at 80 °C overnight. Afterwards, it was put into a solution containing 100 mL of DMF and 20 g of pPDA and heated at reflux temperature of the mixture (130 °C) for 48 h. The sample was washed with ethanol and water, and dried at 80 °C overnight.
Electrochemically oxidized graphite felt, treated with pPDA, is hereinafter referred to as GF-OX-pPDA.

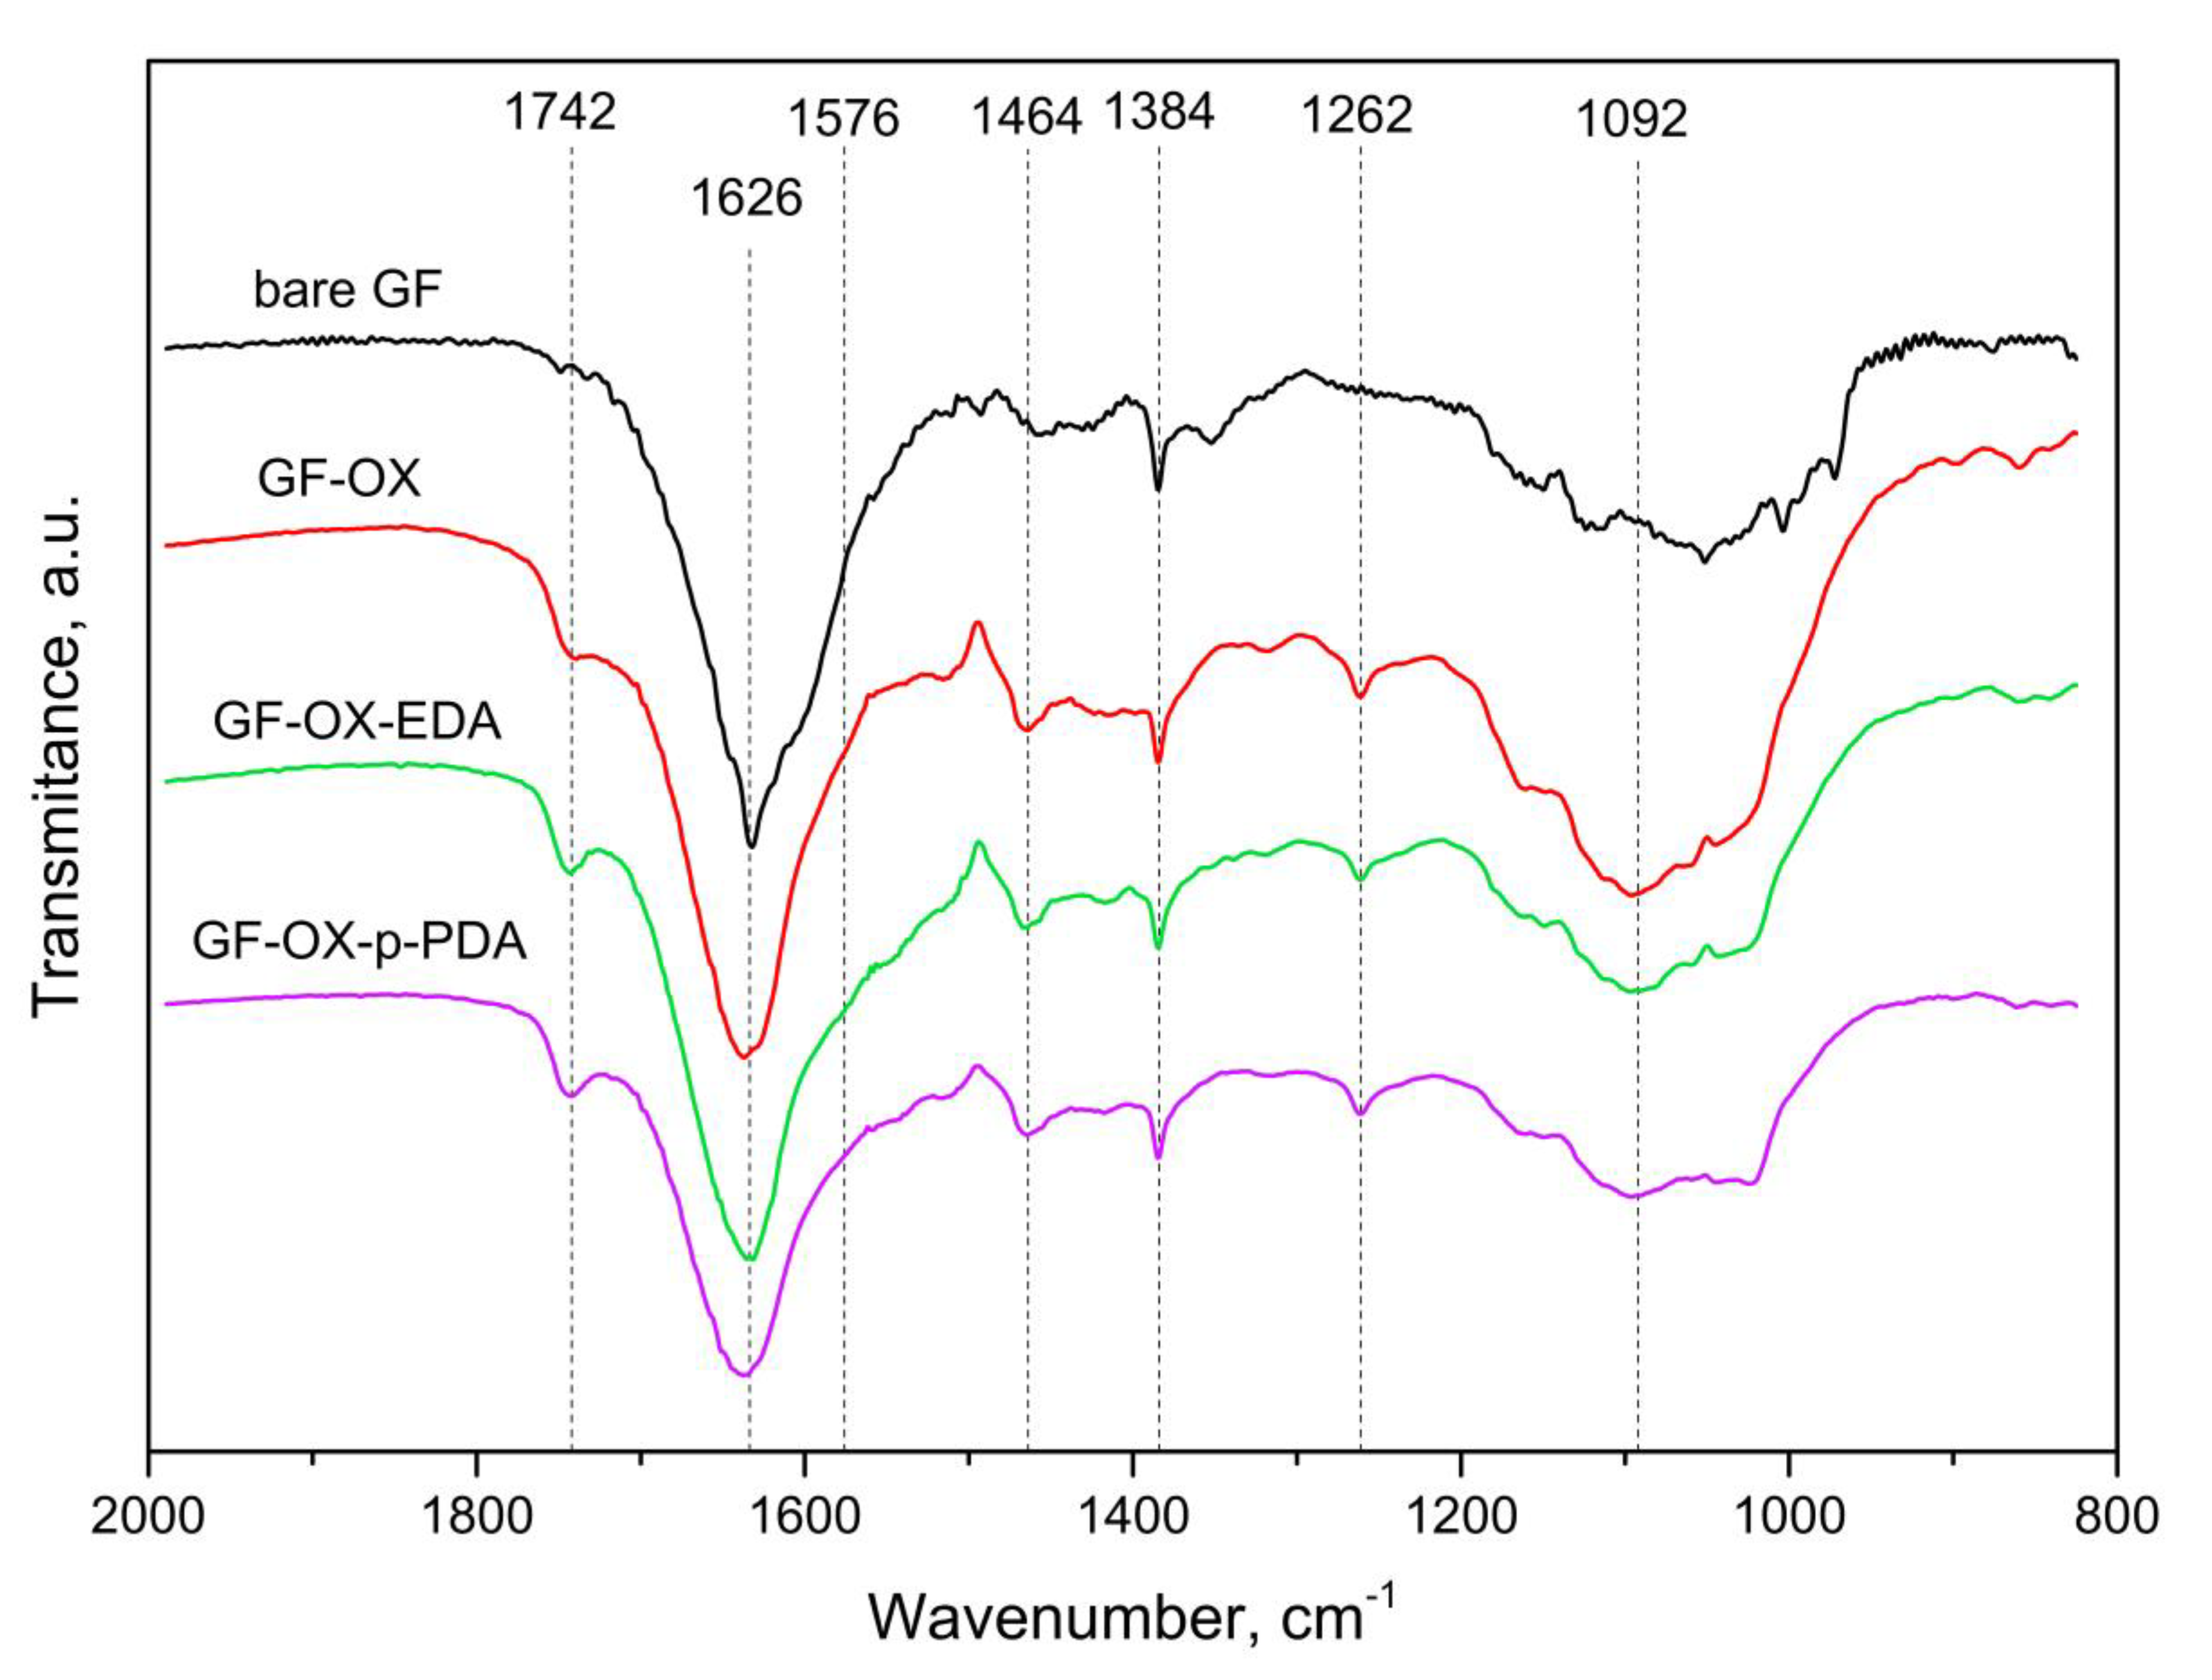
2.4. Characterization of Electrode Materials

Qualitative and quantitative chemical composition of the surface of bare and modified GF electrode filaments were investigated by Fourier-Transform Infrared (FT-IR) spectroscopy, Scanning Electron Microscopy (SEM) and Energy Dispersive X-Ray (EDX) analysis. The FT-IR spectra (ν, cm−1) of the samples were recorded on a Spectrum GX FT-IR spectrometer (Perkin-Elmer, Waltham, MA, USA) with additional equipment for the measurement in horizontal attenuated total reflection (HATR) mode. The FT-IR spectra were recorded at room temperature in the wavenumber range of 4000–800 cm−1 with a resolution of 1 cm−1. Each spectrum was averaged from 16 scans at a scan rate of 0.2 cm∙s−1. Surface morphology and elemental composition of the samples were investigated with a high-resolution scanning electron microscope Hitachi S-3400N (Hitachi, Ltd., Tokyo, Japan) equipped with EDX detector Bruker X Flash Quad 5040 (Bruker AXS GmbH, Karlsruhe, Germany).

2.5. Cell Cultures and Media

Shewanella putrefaciens wild-type NCTC (The National Collection of Type Cultures) 10695 [22] (DSM No.: 1818, DSMZ—German Collection of Microorganisms and Cell Cultures GmbH, Braunschweig, Germany) were used as exoelectrogens in the MFCs. Sterilized LB broth [23] and minimal medium [24] (18 mmol/L sodium DL-lactate, PIPES buffer 15.1 g∙L−1, NaOH 3.0 g∙L−1, NH4Cl 1.5 g∙L−1, KCl 0.1 g∙L−1, NaCl 5.8 g∙L−1, NaH2PO4∙H2O 0.6 g∙L−1, Wolfe’s mineral solution 10 mL∙L−1 (ATTC, Manassas, VA, USA), Wolfe’s vitamin solution 10 mL × L−1 (ATTC, Manassas, VA, USA), L-glutamic acid 2 g∙L−1, L-arginine g∙L−1, serine g∙L−1) were used for liquid culture preparation and LB Agar (Sigma-Aldrich, St. Louis, MO, USA) plates were used for culture maintenance. Single colonies on LB Agar plates freshly streaked from a frozen glycerol stock culture of S. putrefaciens were transferred to 15 mL of LB broth and incubated aerobically at room temperature while shaking at 100 rpm (ES-20 Compact Shaker-Incubator, Grant Instruments, Cambridge, UK) for 48 h. Afterwards, 15 mL of culture were spun down at 3000 rpm during 10 min (Hettich Universal 320R, Andreas Hettich GmbH & Co, Tuttlingen, Germany). The pellet was resuspended in 15 mL of minimal media and transferred to a sterile Erlenmeyer flask with 185 mL of minimal media for 72 h of cultivation using the same conditions. Finally, 200 mL of media were centrifuged at 3000 rpm during 10 min; the pellet was resuspended in 15 mL of minimal media and injected in the microbial fuel cell.

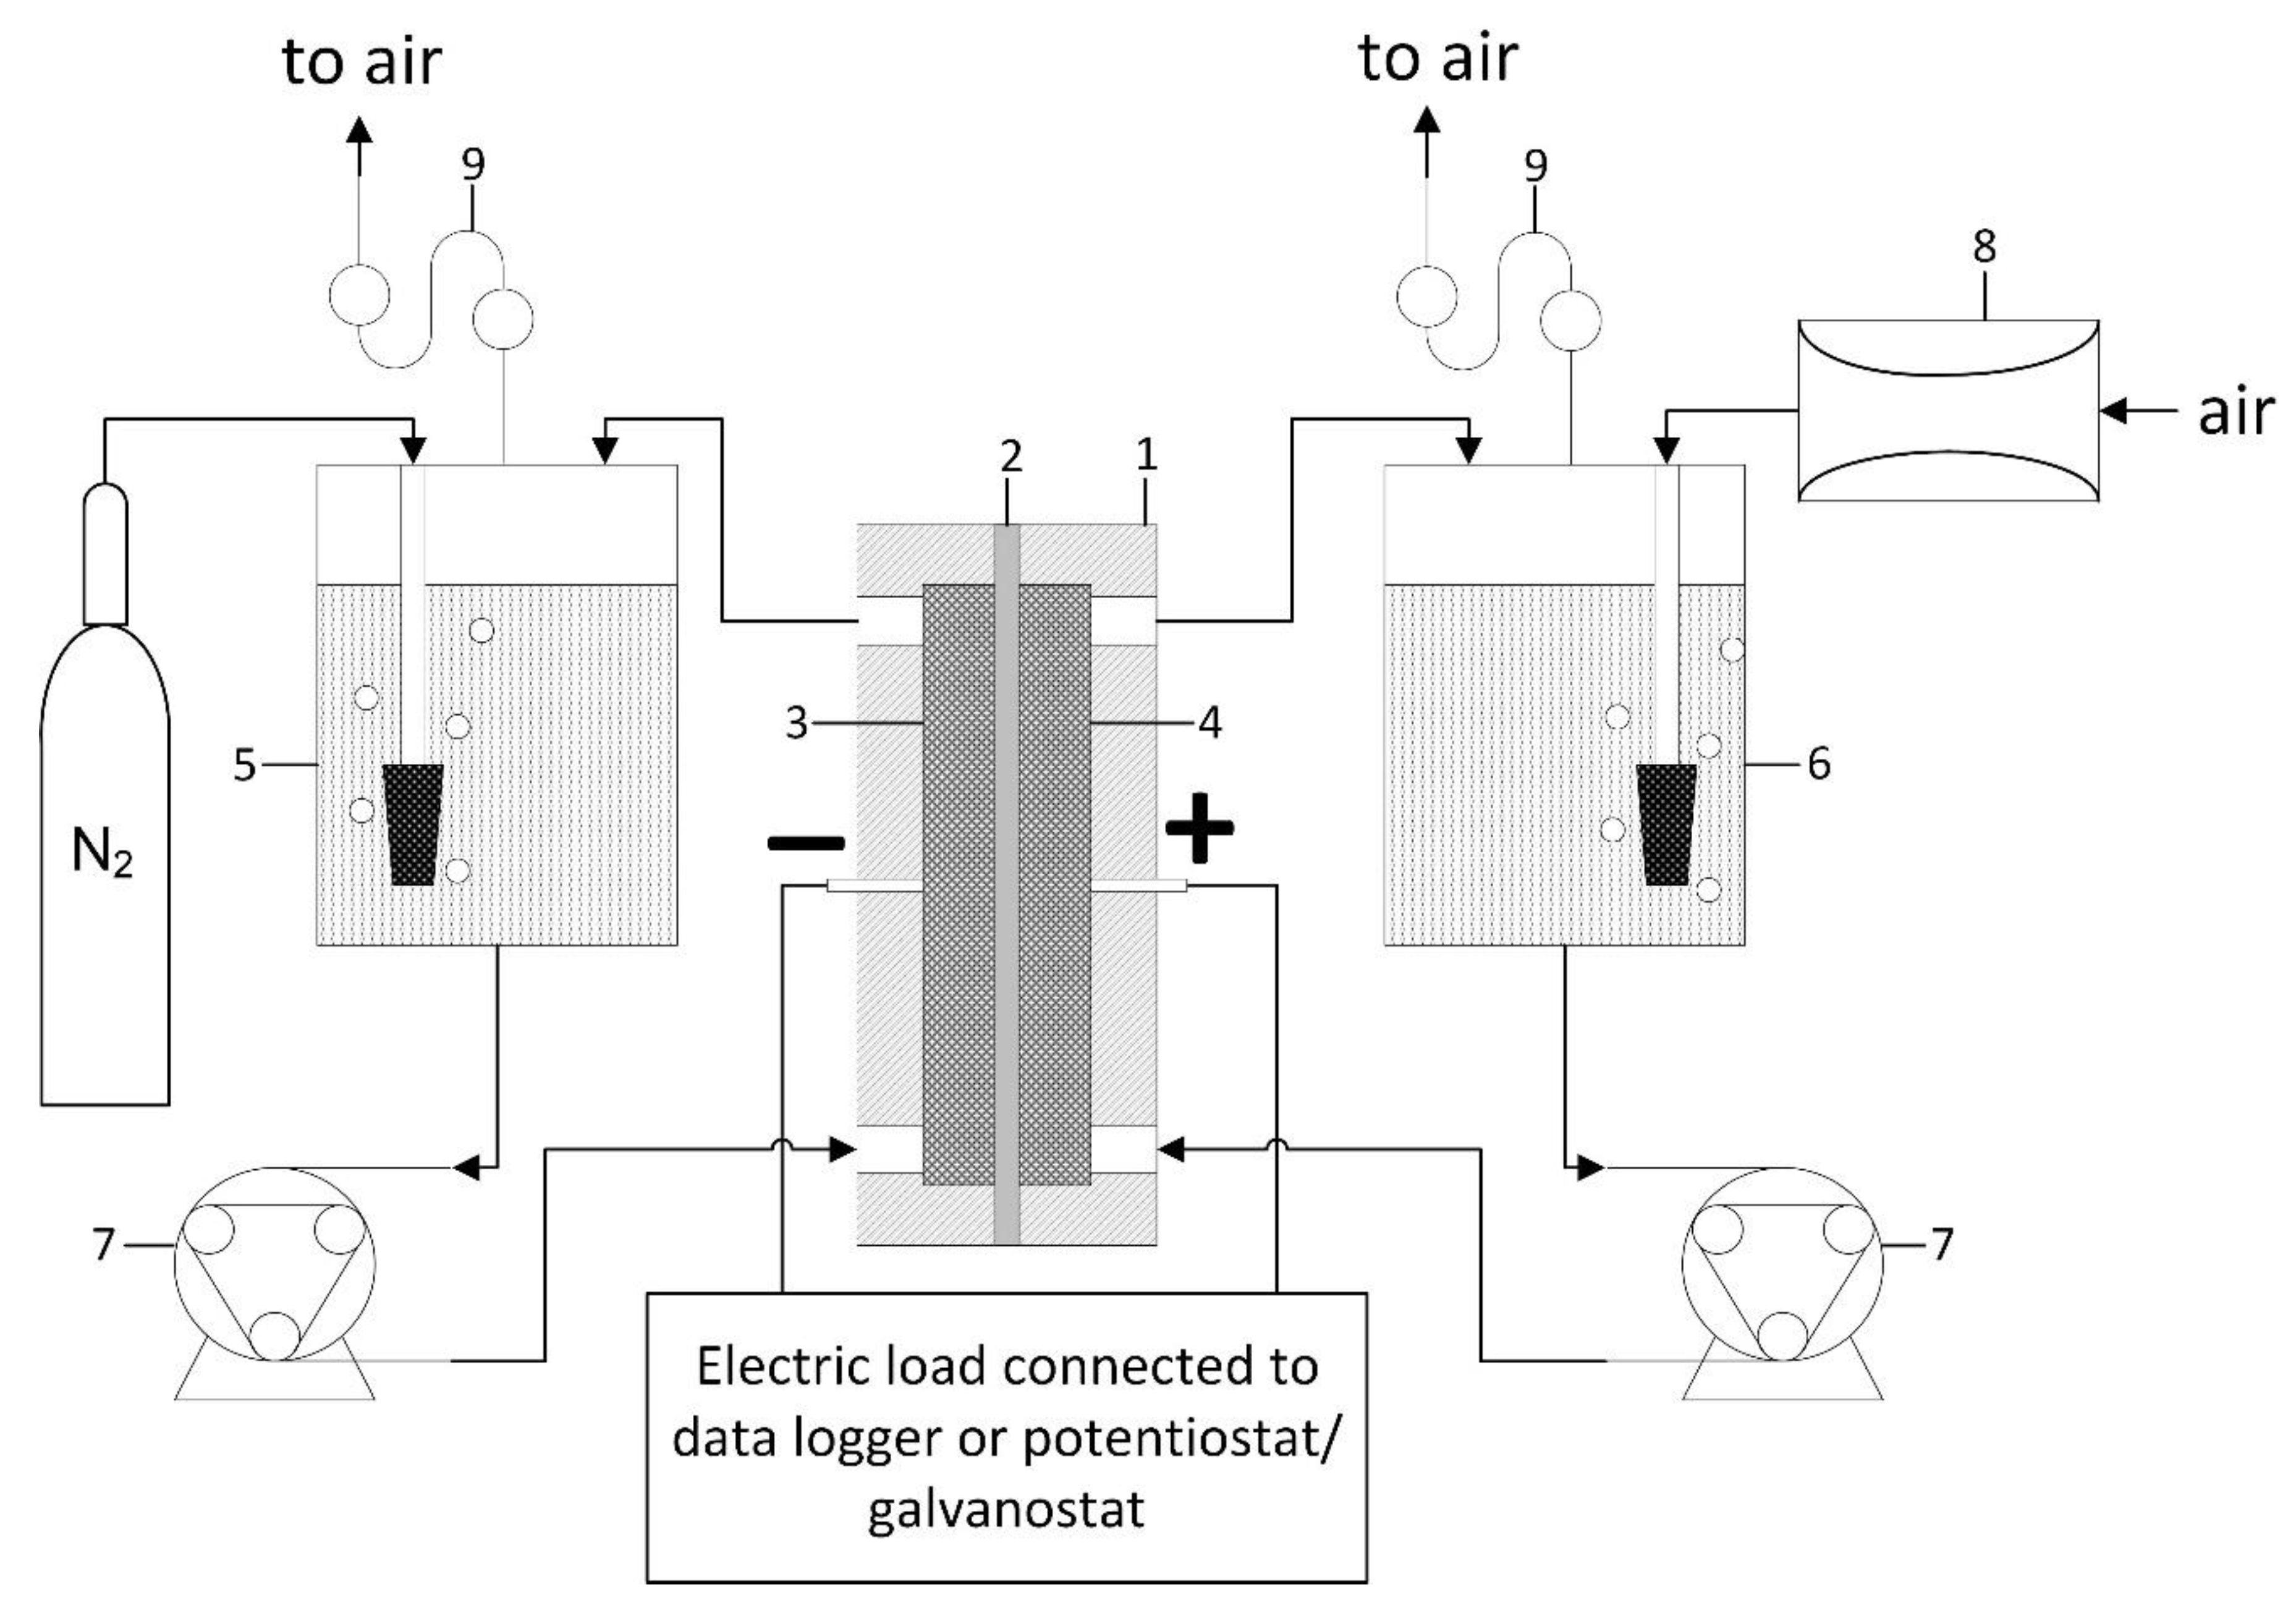
2.6. MFC Design and Operation

Three two-chamber MFCs (approx. 32 mL volume of anode and cathode chambers with the network of interdigitate channels, separated by a 10 × 10 cm size PEM Nafion®NRE-212 (Fuel Cell Store, College Station, TX, USA) were constructed and used to investigate operation performance of the MFCs by using bare GF and surface modified anodes. All MFCs were operated in batch mode using minimal medium as an anolyte with aqueous 60% (v/v) sodium DL-lactate added to maintain its concentration in the medium at 18 mmol/L. Anolyte, supplied from the anolyte reservoir, was circulated by means of a peristaltic pump (BS100-1AQ, Fluid Technology Co., Ltd., Baoding, China) at 6.25 mL∙min−1 rate under anaerobic conditions provided by constant flow of nitrogen in the anode part of the system. In all MFCs, cathodes were made of bare GF and phosphate-buffered saline (PBS, pH 7.2), supplied from catholyte reservoir and aerated with air, was used as a catholyte, which was circulated by means of a peristaltic pump at 18.18 mL∙ min−1 rate. The short-term operation of MFCs under different loads of the electric circuit was investigated by using the potentiostat-galvanostat SP-150 (BioLogic Sciences Instruments, Seyssinet-Pariset, France) connected directly to each MFC. The resistance of electric circuit was changed from 15 Ω to 2000 Ω programmatically by controlling the current such that the ratio voltage/current kept constant.
Open circuit potential (OCP) and chronoamperometric (CA) measurements of bare GF cathode in aerated and deaerated PBS (aeration with air or passing of N2 gas, respectively, at the rate of ~0.5 dm3/min for 2 h before and throughout the experiment) were performed in a standard three-electrode electrochemical cell using potentiostat/galvanostat SP-150 (BioLogic Sciences Instruments, Seyssinet-Pariset, France) interfaced with the EC-Lab v10.39 software. In an electrochemical cell, a bare GF cylinder with the dimensions of 6 × 6.5 mm (diameter × thickness) mounted in a special Plexiglas holder was used as a working electrode, which investigated surface area of 12.5 mm2 was obtained by the 4 mm diameter hole in the clamping plate of the holder. A rectangular Pt plate with a surface area of approx. 10 cm2 and an Ag/AgCl electrode filled with saturated aqueous KCl solution (E vs. SHE = 0.197 V) were used as counter and reference electrodes, respectively.
The long-term performance of MFCs was investigated by connecting a passive electric load to each of them, i.e., a voltage divider consisting of 620 and 39 Ω resistors connected in series. The total electric load was 659 Ω. The voltage variation over time was measured across the 39 Ω resistor by using data logger USB TC-08 (Pico Technology Ltd., St Neots, UK) connected to the personal computer for data collection. The actual values of voltage and current generated by each MFC were calculated by applying Ohm’s law for a part of the circuit.
In order to study the operation of MFCs at lower than room temperatures, all MFCs were placed in a refrigerator, in which temperature was controlled by the electronic thermostat PCR-110 (Honeywell, Charlotte, NC, USA). In the refrigerator, the temperature of all MFCs was lowered from room temperature (20 ± 1 °C) down to 0 °C in approx. 5 °C increments.

3. Results and Discussion

3.1. Anode Material Treatment

Initially, as a preparation for electrochemical oxidation, bare GF samples were wetted with 10% (v/v) aqueous propan-2-ol solution, which has a lower surface tension than pure water to wet the surface of GF filaments. Propan-2-ol displaced absorbed air gas from the surface of GF filaments and interfilamental cavities, molecules of propan-2-ol and water absorbed instead and thus made GF wettable, i.e., temporarily hydrophilic. Washed well with distilled water and still wet bare GF was oxidized electrochemically in H2SO4 solution under flow-through mode with the aim of introducing oxygen-containing functional groups (mainly, carboxylic and epoxy groups), which later would participate in the reaction with organic diamines and form amide -CO-NH- and ≡C-NH- bonds on the surface of GF. Schematic representation of electrochemical oxidation of bare GF is provided in Figure 1.
As seen from the EDX analysis results (Table 1), long-term (2 h) electrochemical oxidation resulted, as expected, in a significant increase in oxygen atomic concentration (from 1.0% to 18.8%) on the filament surface of GF-OX, whereas the concentration of carbon and nitrogen decreased by 14.9% and 2.9%, respectively. These changes have proven the formation of the oxygen-containing functional groups on the GF-OX surface.
The formation of carboxylic and epoxy groups during electrochemical oxidation has been confirmed by the FT-IR analysis data. As the comparison of FT-IR spectra of bare GF and GF-OX has revealed (Figure 2), in the spectrum of the latter, new absorption bands at 1742 and 1262 cm−1 are present and the increase in intensity of the absorption band, the maximum of which is at 1092 cm−1, is observed. An absorption band at 1742 cm−1 has been attributed to stretching frequencies of C=O in the –COOH groups, and the peaks at 1262 and 1092 cm−1 correspond to the stretching of phenolic C-O and epoxy C-O-C groups, respectively. A very intensive peak with the maximum at 1626 cm−1 is present in the FT-IR spectra of all samples (both unmodified GF and modified GF-OX, GF-OX-EDA, and GF-OX-pPDA samples). It is characteristic of the aromatic C=C bond bending in graphite structure. Similarly, the peak characteristic of all sample spectra at 1384 cm−1 has been assigned to the C-H rock in methyl groups at the edges of graphite structure [25].
The presence of O-containing functional groups on the surface of GF makes it hydrophilic. A drop of distilled water, placed on the surface of dried GF-OX, seeped into GF-OX, confirming that GF-OX had become permanently hydrophilic and could be used in further experiments without wetting with low surface tension aqueous alcohol solutions.
The N-(2-aminoethyl)carbamoyl and 2-aminoethylamino or N-(4-aminophenyl)carbamoyl and 2-aminophenylamino moieties were introduced onto the GF-OX filament surface via one-step reaction in DMF at 50 °C in a relatively short period of time (3 h) (Method A) (Figure 3), contrasting to the two-step procedure reported by Zhu et al. for modification of carbon felt [21].
For comparison reasons, the N-(2-aminoethyl)carbamoyl and 2-aminoethylamino or N-(4-aminophenyl)carbamoyl and 2-aminophenylamino moieties were introduced onto the GF-OX surface by this two-step procedure as well (Method B).
GF-OX was treated with SOCl2 at 70 °C for 48 h to form acyl chloride -COCl groups. Subsequently, it was treated with EDA or pPDA at 130 °C for another 48 h in order to enable diamine reaction with acyl chloride -COCl groups (Figure 4) [22]. The results of EDX analysis of thus obtained GF-OX modified with EDA or pPDA were identical to the ones of GF-OX modified with these diamines via one-step reaction. As the results of the EDX analysis have shown (Table 1), nitrogen atomic concentration increased up to ~13% (at.) (when treated with EDA) and ~12% (at.) (when treated with pPDA). Oxygen atomic concentration decreased to ~9% (at.) and ~10% (at.), respectively.
The formation of an amide bond during modification reactions with EDA and pPDA has been confirmed by the FT-IR analysis data (Figure 2). In the FT-IR spectra of GF-OX-EDA and GF-OX-pPDA samples, a new shoulder of absorption bands at 1576 cm−1 is present and has been attributed to the N-H bending of the amide group [25]. Amides are the most stable carboxylic acid derivatives; therefore, it has been assumed that they should not hydrolize under mild conditions of minimal media used as an anolyte in MFCs.

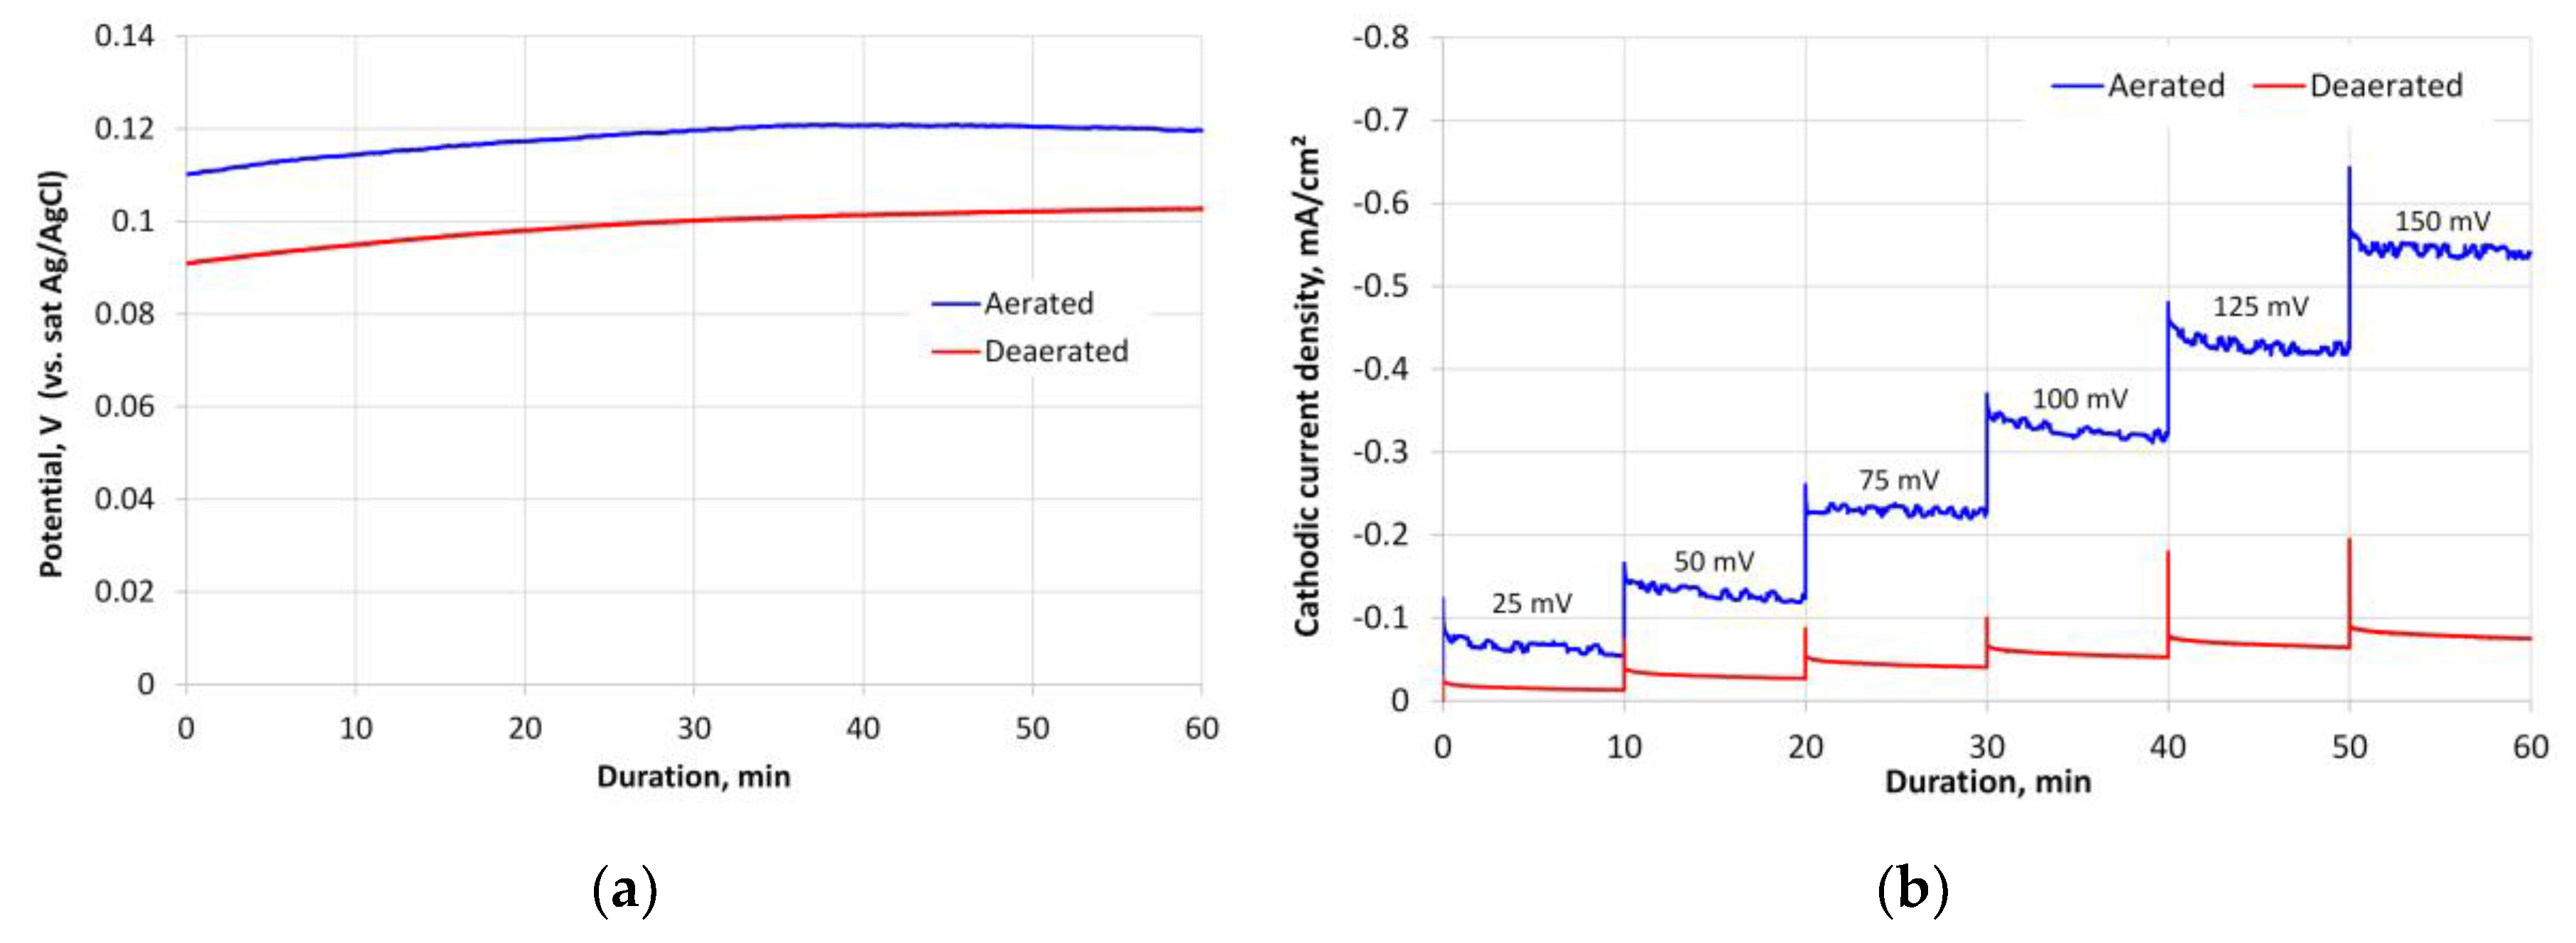
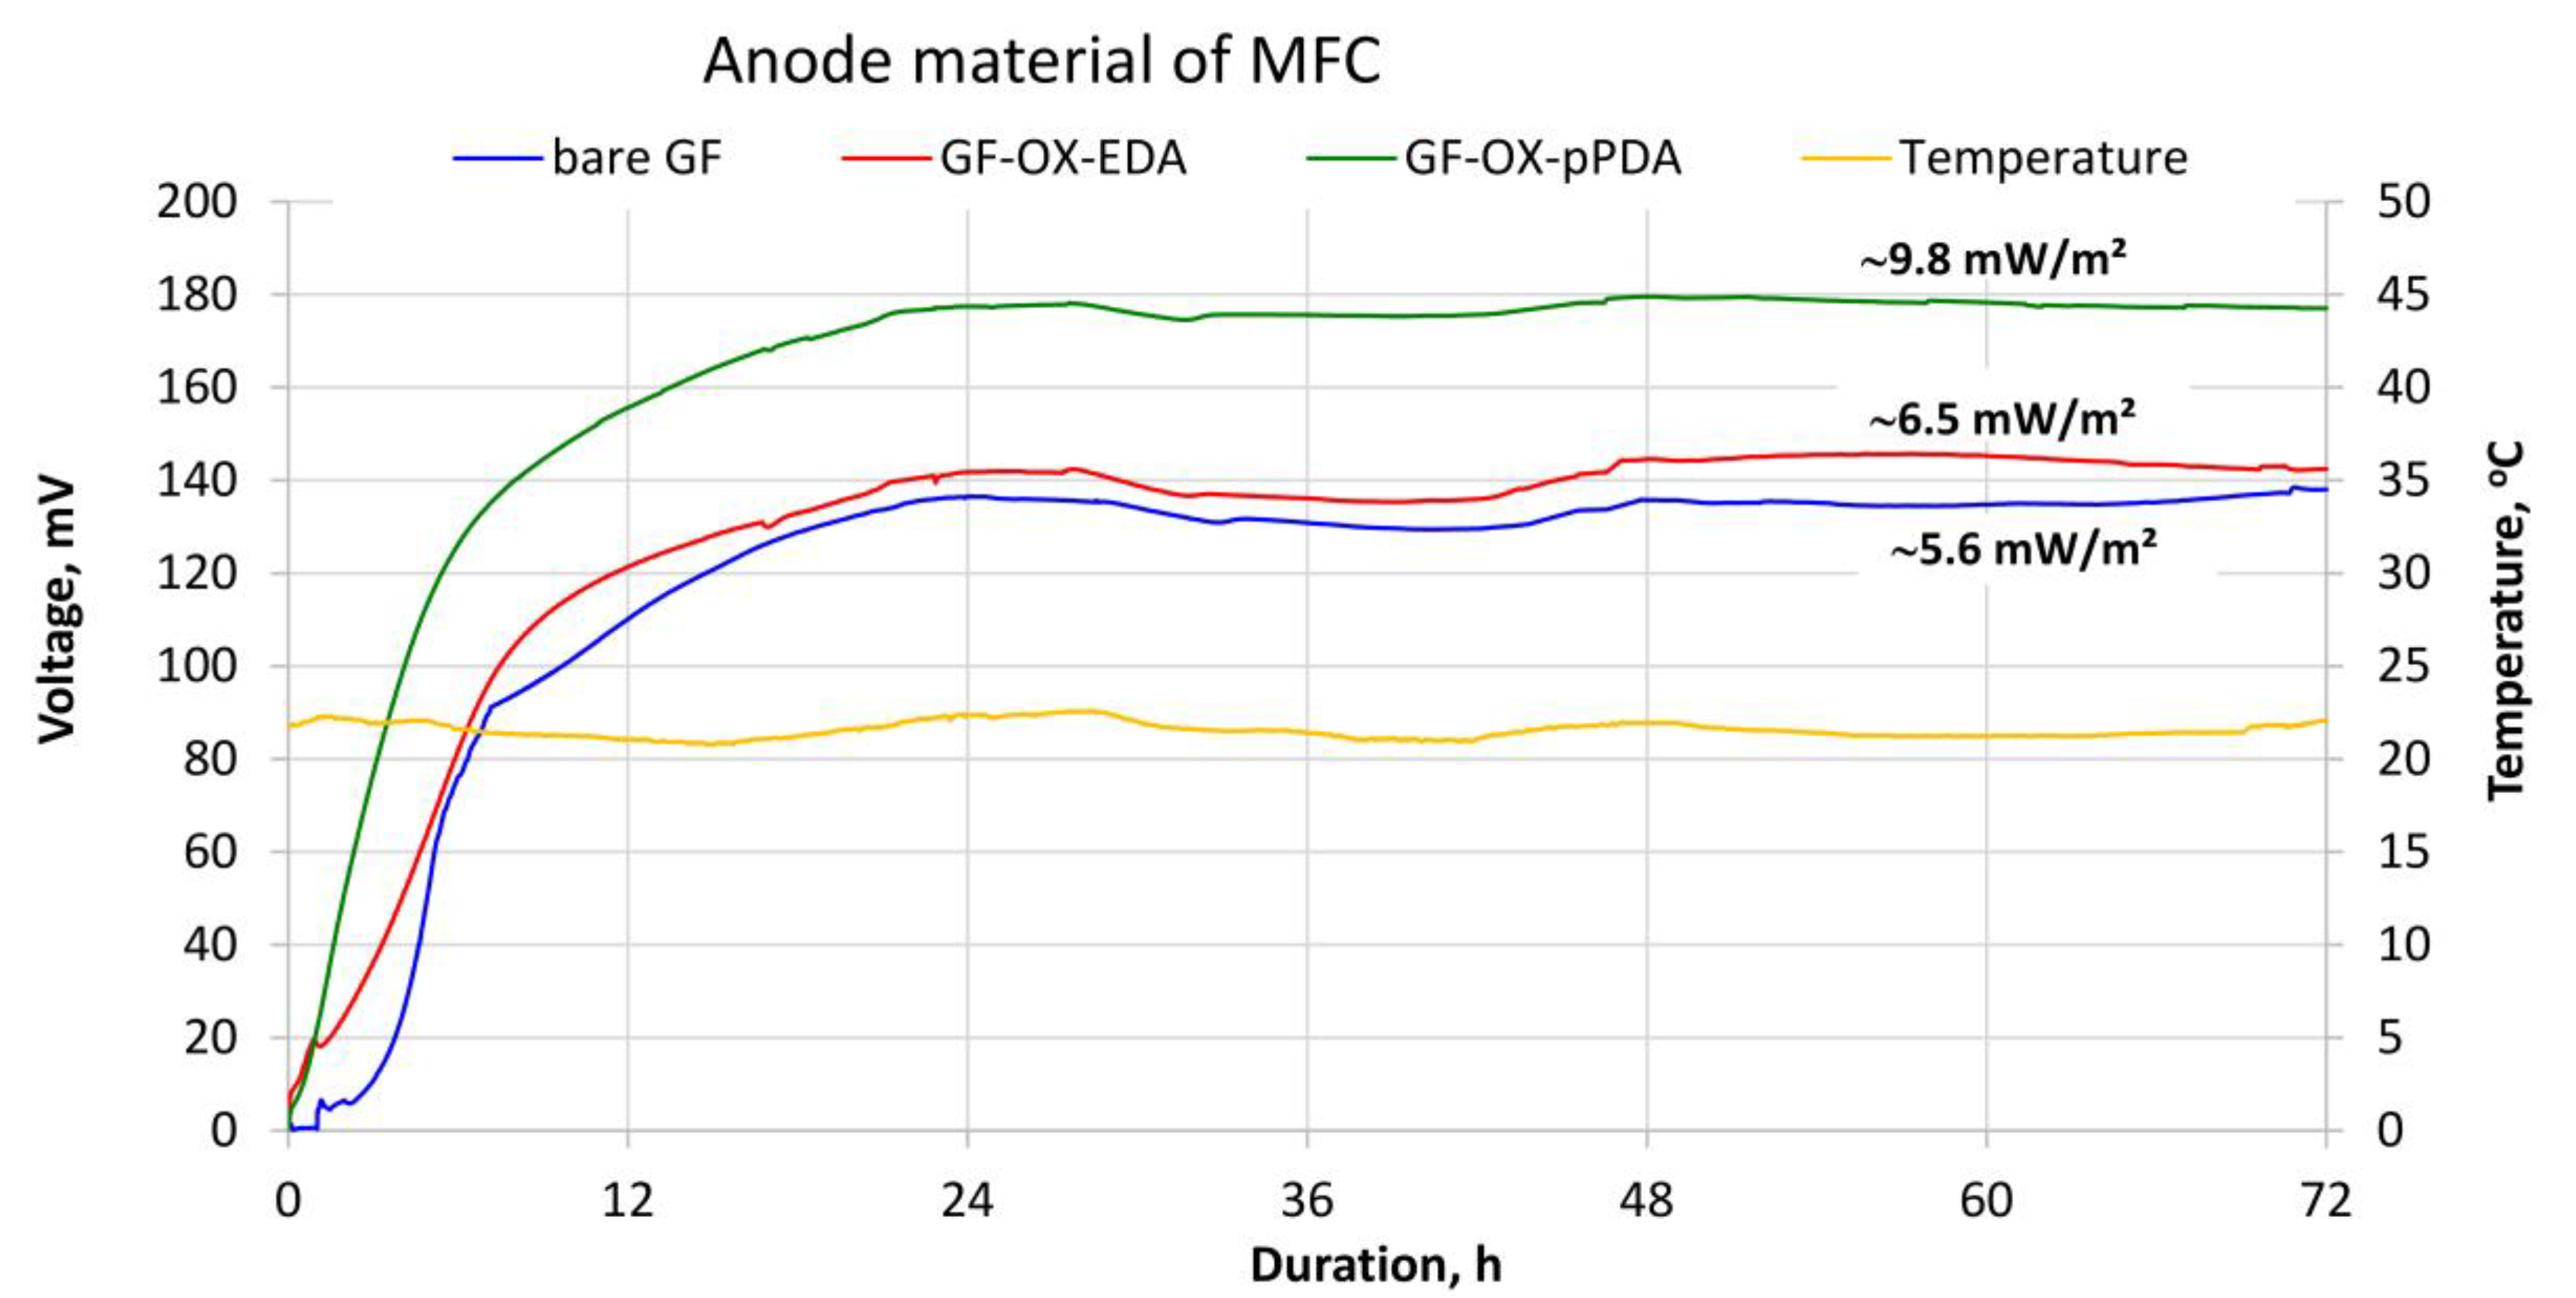
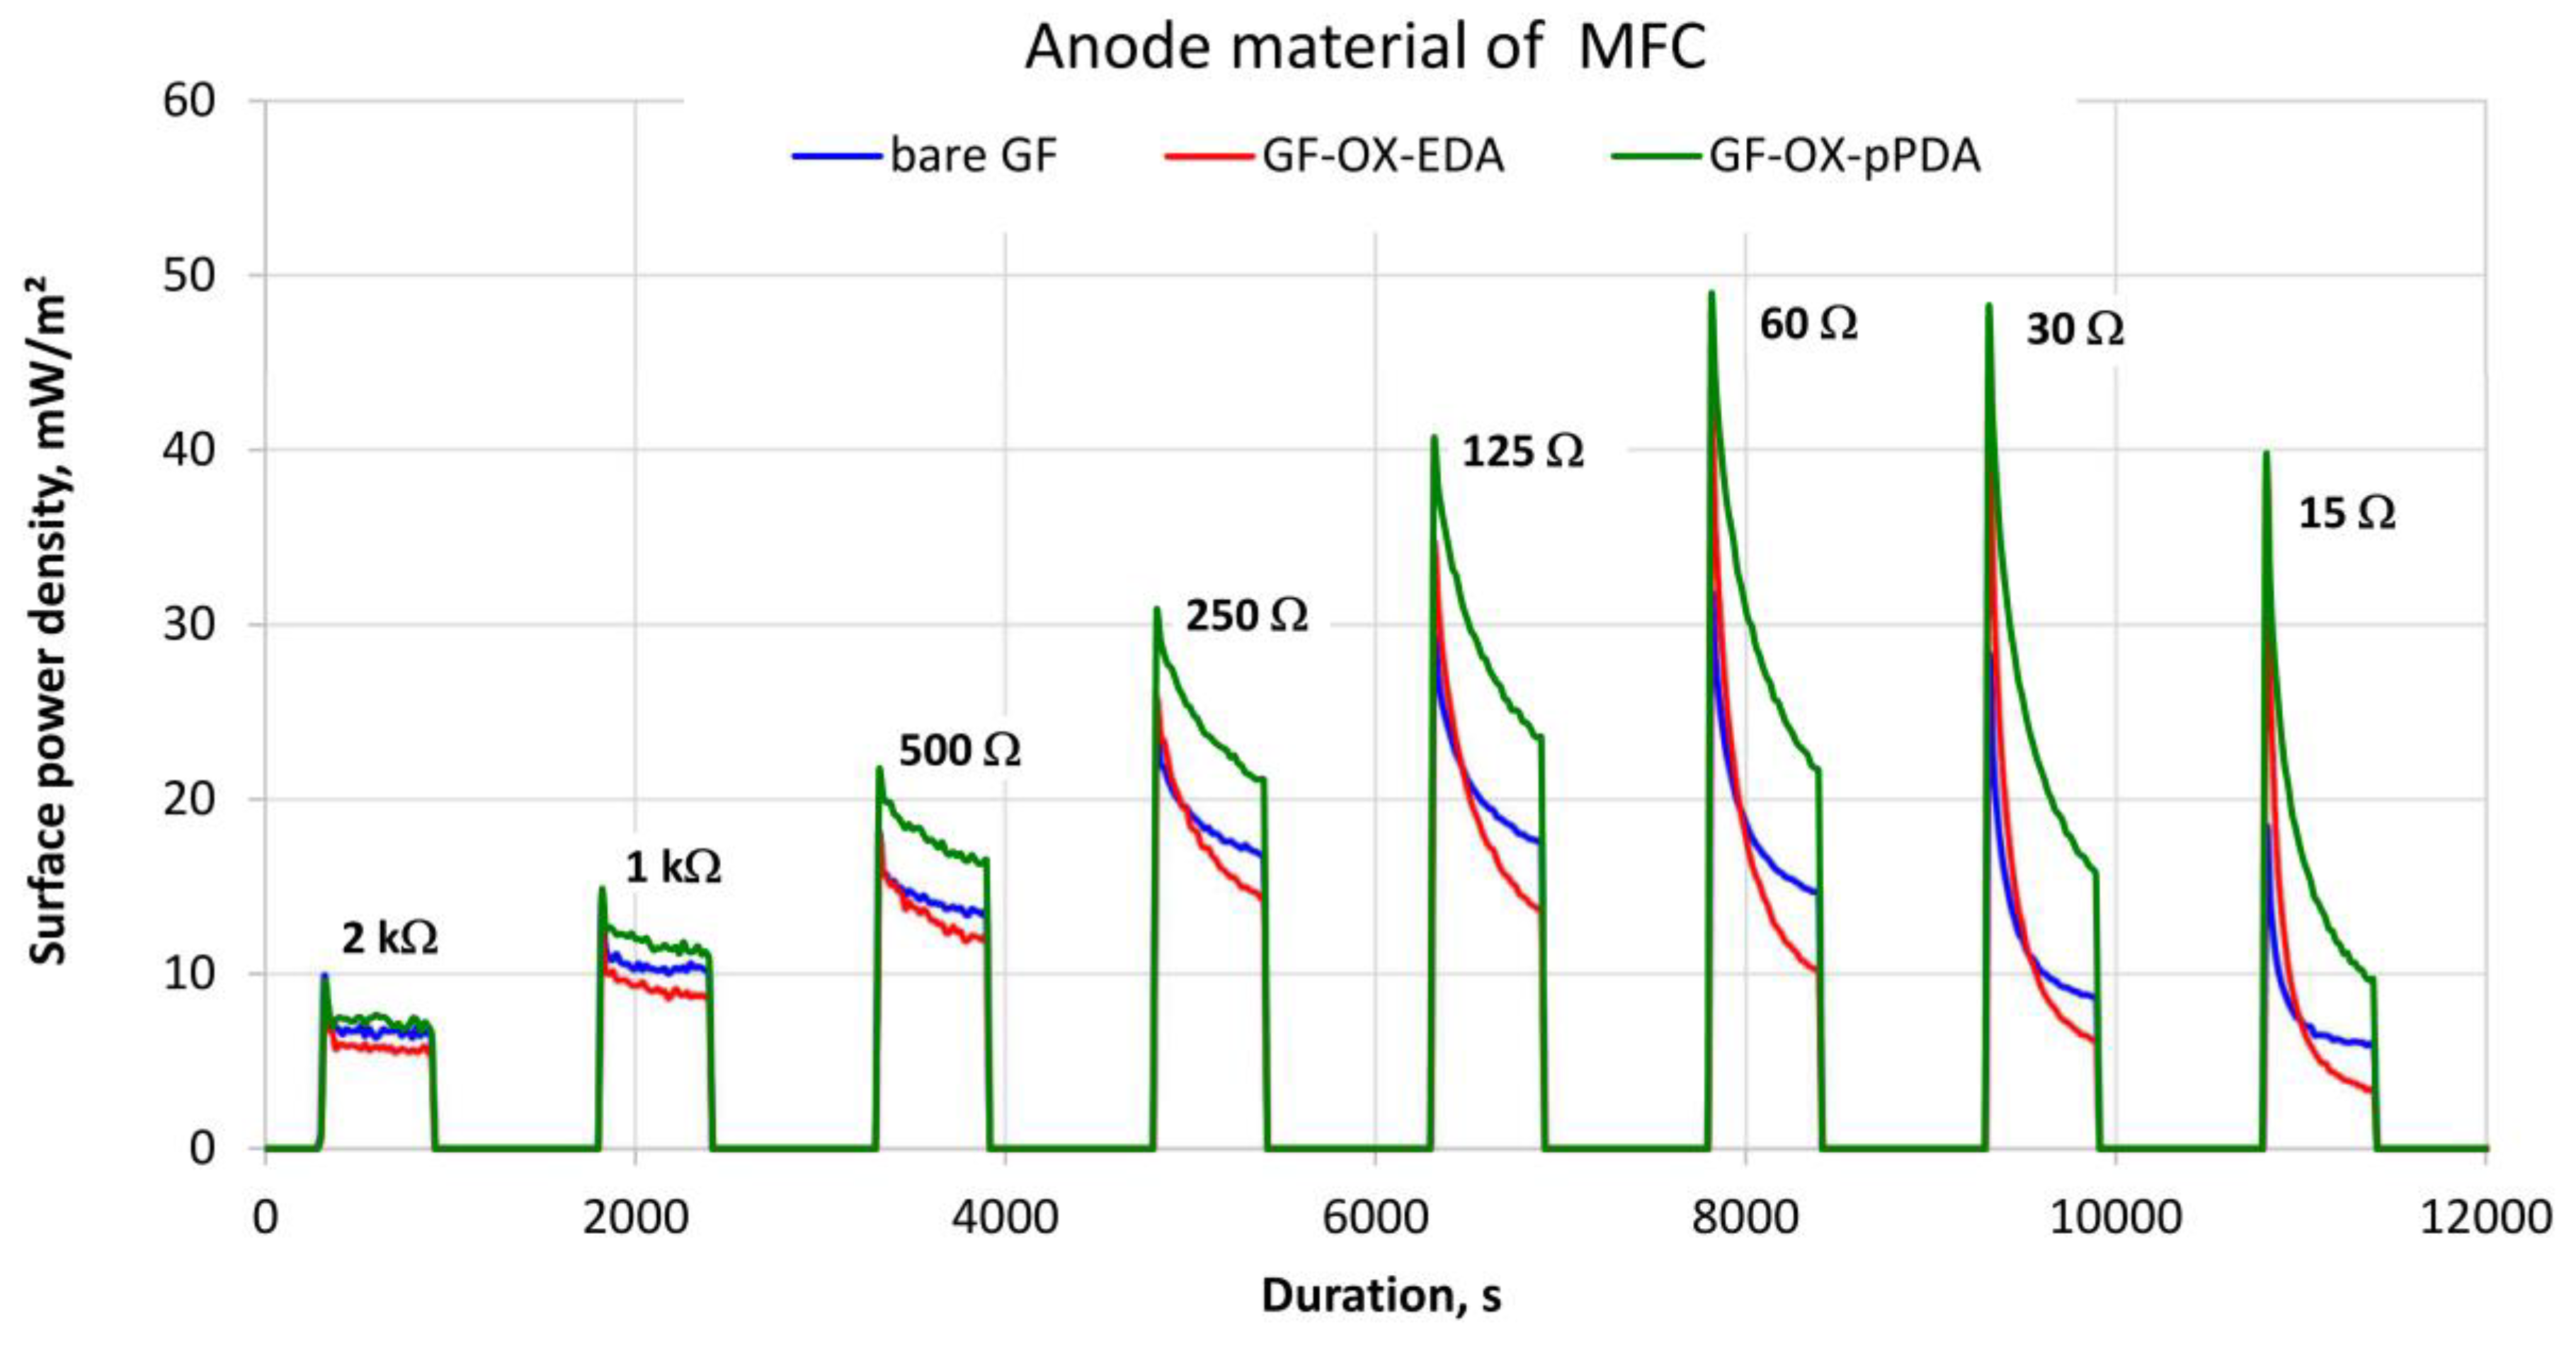
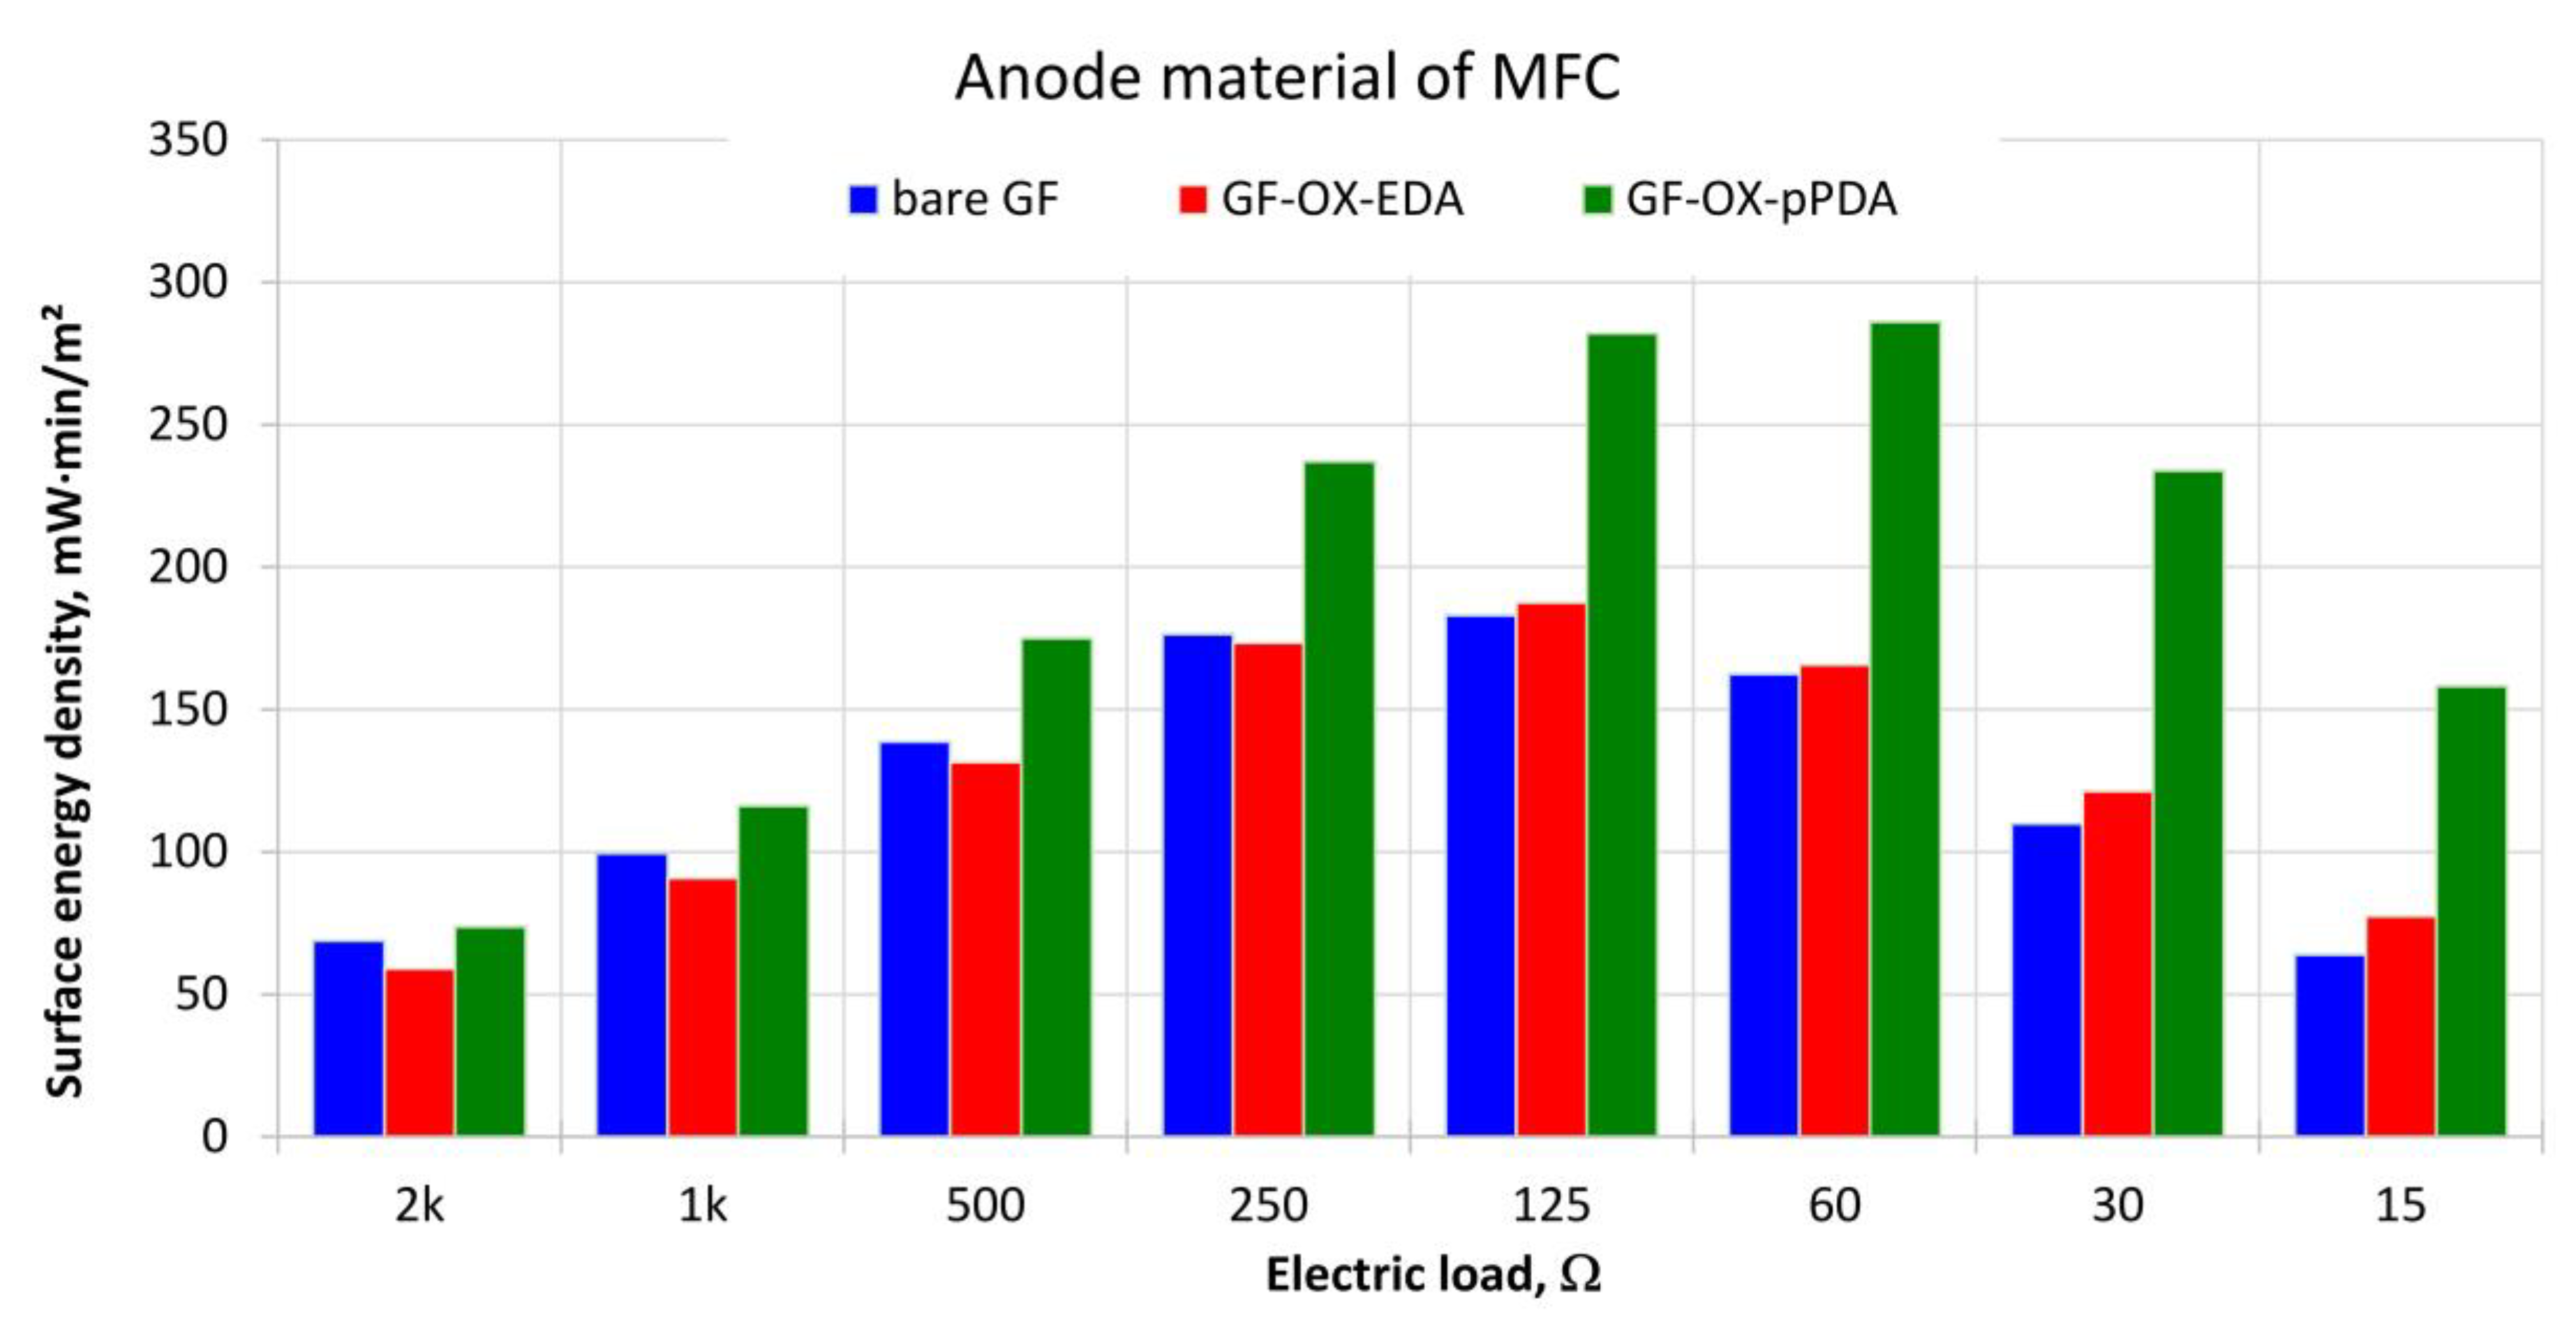
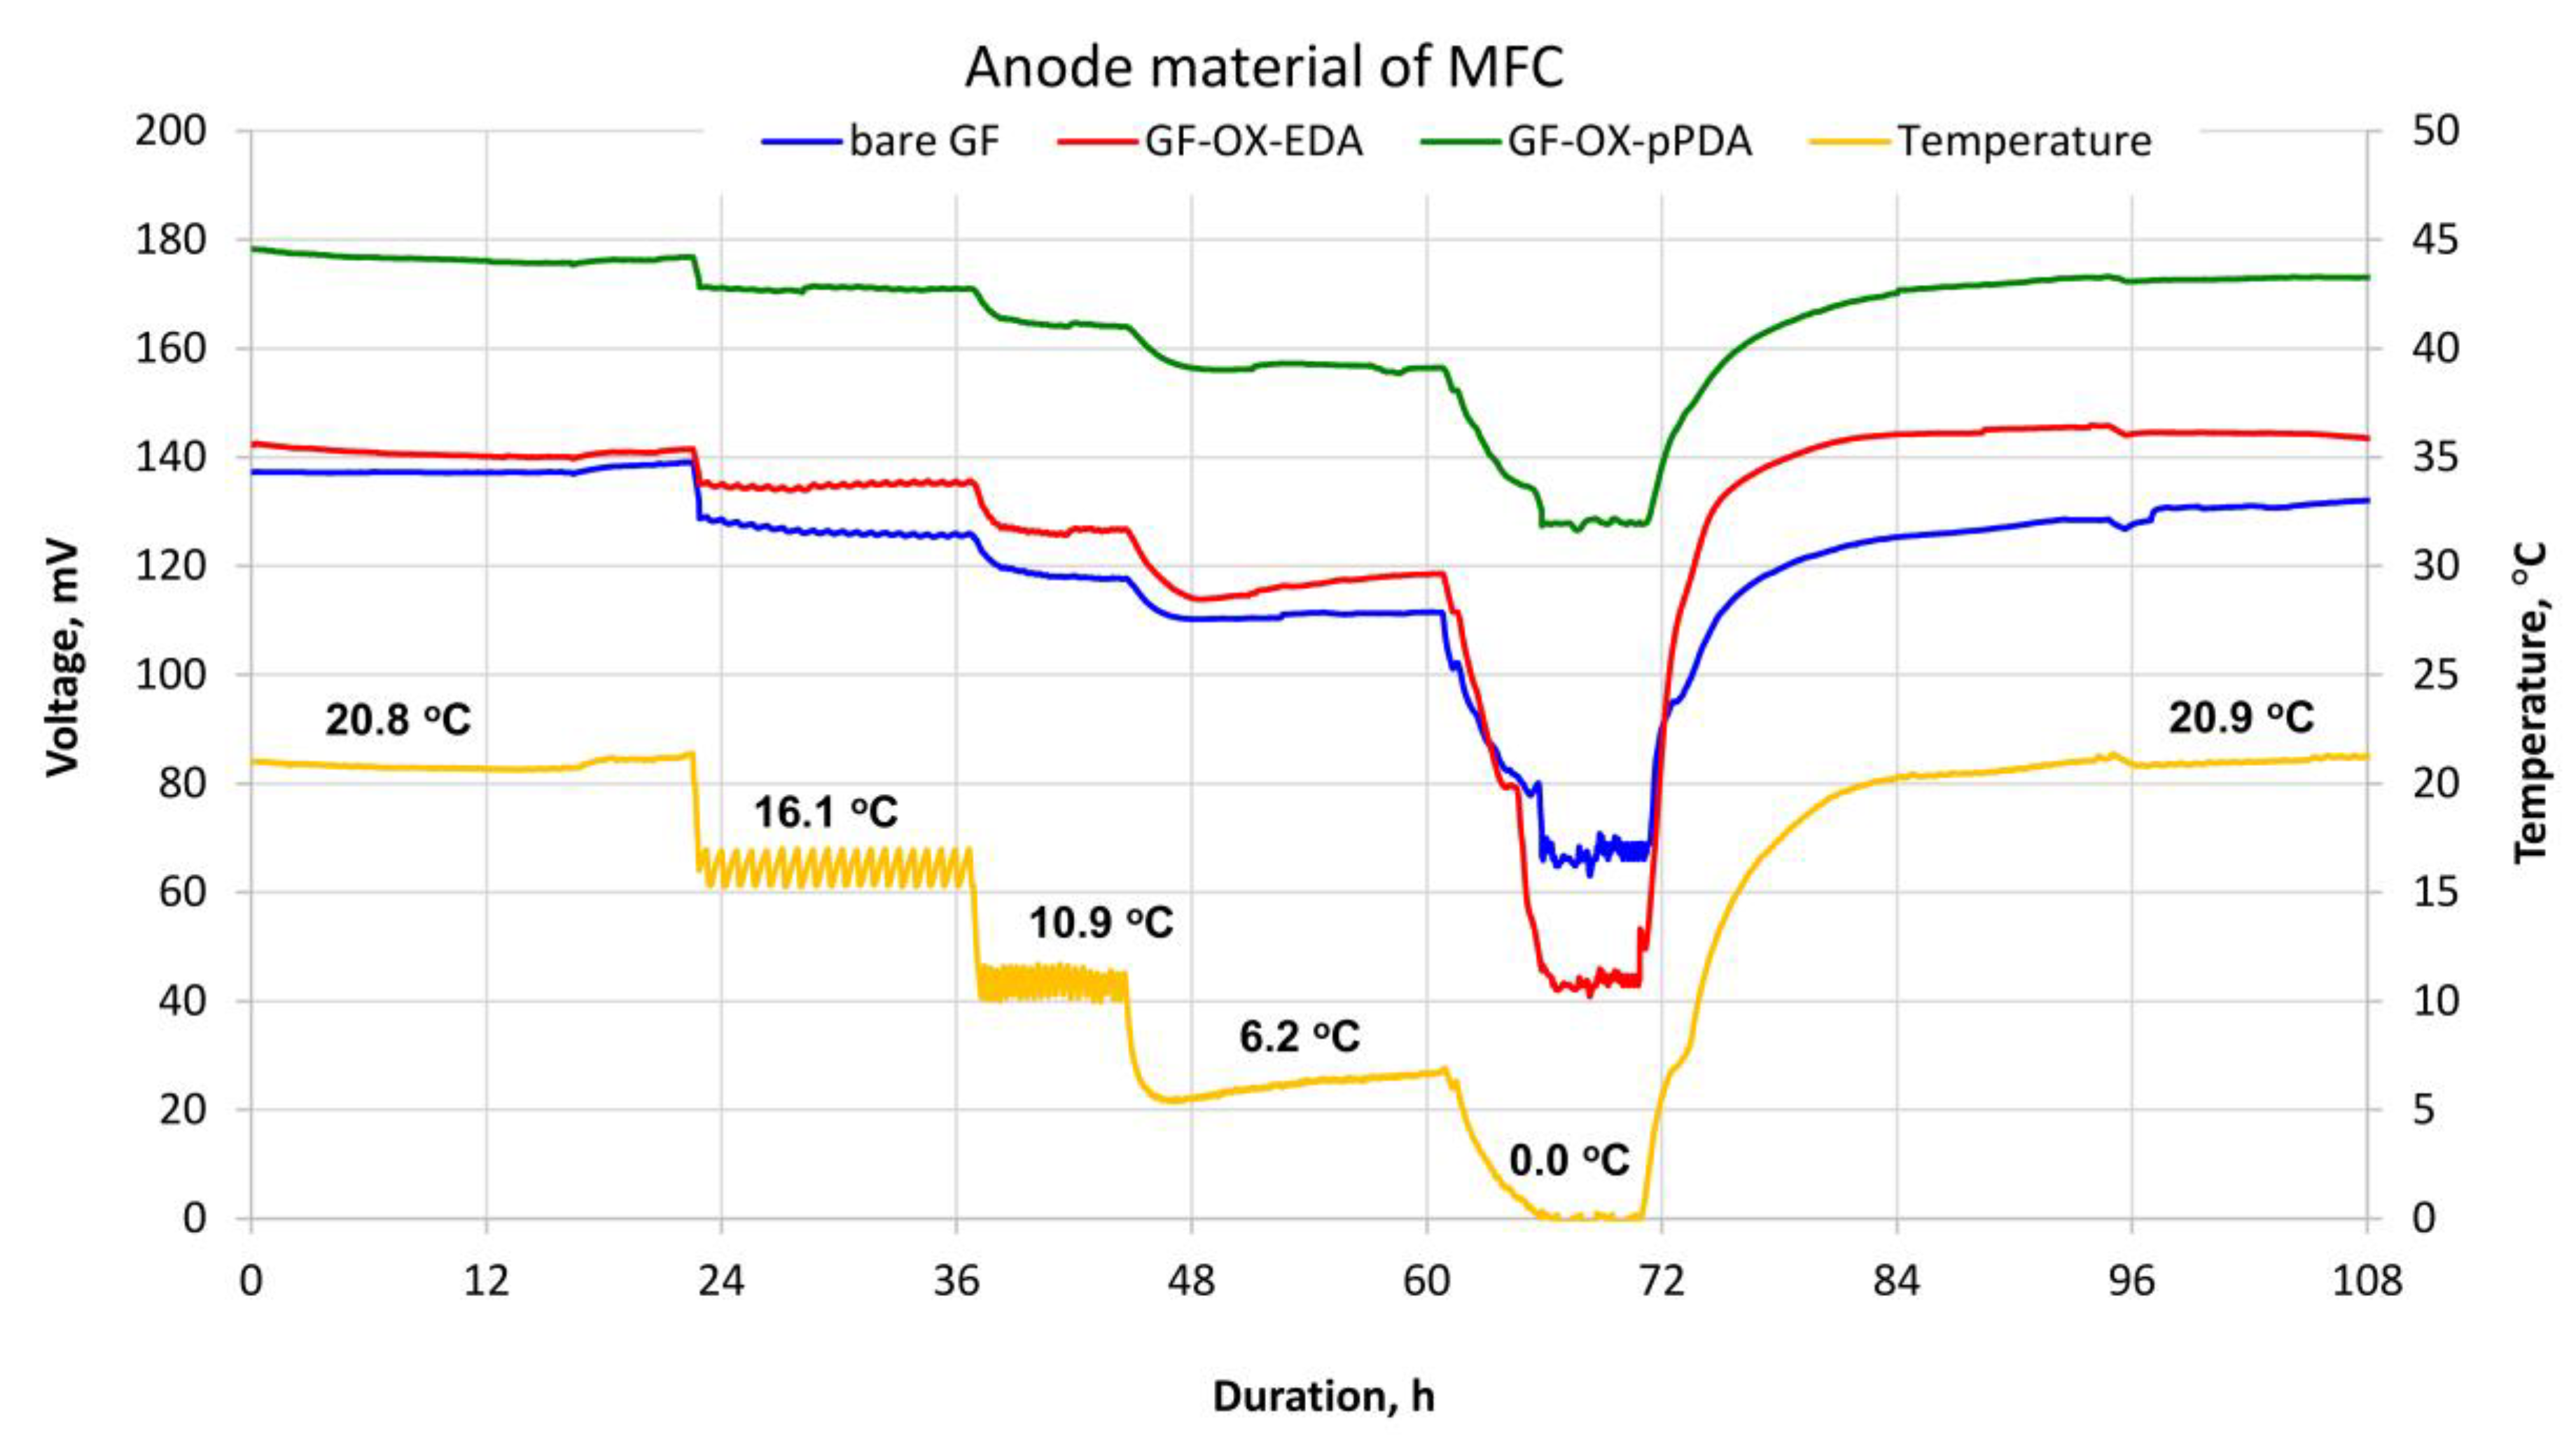
3.2. MFC Performance

The efficiency of all three MFCs, the only difference of which was in the anode material used, was investigated while maintaining all other parameters and conditions (temperature, electric load, aeration intensity, etc.) identical. The scheme of operating MFC and the measurement of its electrochemical characteristics are shown in Figure 5.
The overall electrochemical processes, which take place on the surface of the anode and cathode during MFC operation, could be described by the following equations:
Anodic process:
H3CCH(OH)COO(aq) + 6H2O(l) → 3HCO3(aq) + 14H+(aq) + 12e
Cathodic process:
O2(g) + 4H+(aq) + 4e → 2H2O(l)
The OCP and CA measurements in aerated and deaerated PBS have revealed that PBS aeration significantly influenced the electrochemical activity of the bare GF cathode (Figure 6). The OCP value of the bare GF electrode in the aerated PBS, which stabilized after 1 h, was higher by approx. 20 mV than the one in deaerated PBS. Furthermore, the cathodic polarization of the bare GF electrode in 25 mV steps from the OCP resulted in an evident increase in cathodic current in aerated PBS in contrast to the deaerated one. Although the recorded current density values were quite small (in the order of tens and hundreds of μA/cm2), which is typical for electrodes possessing no catalytic properties in oxygen electrochemical reduction, the cathodic current density was approx. 65 μA/cm2 even at the lowest cathodic polarization of 25 mV. This current density value was more than 10 times higher than the current density values (maximum values were 4–5.5 μA/cm2) generated by the investigated MFCs. The current density generated by the MFC was calculated according to Ohm’s law by dividing the measured MFC voltage values by 659 Ω electric load and the cathode and anode working surface area, which was equal to 49 cm2). Therefore, it can be stated that the electrochemical oxygen reduction on the bare GF cathode was not a limiting process in all MFC electrochemical performance experiments.
After filling all MFCs with minimal medium as an anolyte and PBS as a catholyte, anolytes and catholytes were first circulated at a constant rate for 12 h in order to allow full absorption of the solutions by the porous GF electrodes, hydration of PEM, and temperature stabilization of all parts ensuring MFC operation. All three MFCs generated 0 V voltage prior introduction of S. putrefaciens into the systems. Thereafter, an equal volume (15 mL) of bacterial culture was added to the anolyte of each MFC. Voltage generation and its steady growth was already observed during the first hours (Figure 7). Over the first 3 h after the introduction of bacteria into anolytes, the fastest increase of voltage and current was observed for the MFC with the anode from GF modified with p-phenylenediamine. After 3 h, the voltage generated by this MFC was 76.8 mV (approx. 7.2 times higher than that of the control), the MFC with the anode from GF modified with ethylenediamine generated 36.1 mV (approx. 3.4 times higher than that of the control), while the control MFC with bare GF as an anode generated just 10.7 mV. It can be assumed that the inoculation and vital activity of S. putrefaciens bacteria were more favoured on the surface of modified GF filaments.
The voltage of all MFCs reached maximum values and stabilized after 24 h. This can be attributed to the complete inoculation of bacteria on the anodes. A particularly sudden voltage rise and the maximum stable average voltage value (approx. 177 mV) over the period of 24–72 h were observed in the case of the MFC with the GF-OX-pPDA anode. Meanwhile, MFCs with bare GF and GF-OX-EDA anodes generated voltage with significantly lower average values over the same period of time but very close, approx. 134 and 142 mV, respectively. Values of voltage generated by all MFCs remained stable at the same level for 3 and more days (one month). The average voltage value generated by the MFC with the anode from GF-OX-pPDA was 1.32 times (32%) higher than that of the control MFC, whereas the MFC with the anode from GF-OX-EDA generated an average voltage 6% higher than the MFC with a bare GF anode.
The values of the surface power density for each MFC (Figure 7) were calculated over the period of 48–72 h according to the following equation:
SPD = U 2 · R S
Here: SPD—surface power density of MFC; U—voltage of MFC, V; R—electric load (resistance of electric circuit) equal to 659 Ω; S—surface area of face-to-face anode and cathode, m2.
It can be concluded that introduction of benzene rings along with amino groups in the form of N-(4-aminophenyl)carbamoyl and 2-aminophenylamino moieties onto the surface of GF filaments favoured the biofilm formation of S. putrefaciens bacteria and the electron transfer processes to the anode.
When the stable MFC operation had been achieved, short-term MFC performance efficiency tests were performed by varying the amount of electrical load. It had been observed that the most stable surface power density was provided by all MFCs at electrical circuit loads greater than 500 Ω (Figure 8).
Meanwhile, at electrical circuit loads of 500 Ω and lower, a power jump (peak) was observed after each 15 min open circuit period, after which the power of all MFCs decreased steadily, but did not reach stable values during the 10 min closed circuit period. It should be noted that, already at this stage of the investigation, it was obvious that the MFC with the GF-OX-pPDA anode generated the highest power. After calculating the surface energy density generated by all MFCs over a 10 min period over the entire range of applied electrical loads, it had been proven that the MFC with the GF-OX-pPDA anode generated the most energy, and values of generated energy by MFCs with bare GF and GF-OX-EDA anodes were lower yet similar to each other (Figure 9). The amount of energy generated by the MFC with the GF-OX-pPDA anode over a 10 min period was significantly higher than the amount of energy generated by other MFCs at lower (250–15 Ω) electrical circuit loads. A sharp drop in surface power density occurs when the circuit is again loaded with 500 Ω or lower electric load after the open circuit period is supposedly related to the polarisation of bioanode.
As another stage of the investigation of the performance of three MFCs with different anodes, the influence of temperature on MFC performance was evaluated.
After placing all MFCs with their anolyte and catholyte reservoirs and peristaltic pumps ensuring their circulation in a refrigerator and reducing the temperature from room (average 20.9 °C) to 0 °C, a synchronous decrease in the voltage of all MFCs was observed (Figure 10). S. putrefaciens is a specific spoilage organism of refrigerated marine fish, some vacuum-packed meats, and chicken [26]. It is well known that lowering the temperature lowers the metabolic rate of prokaryotes [27]. The chilling process reduces the growth rate of S. putrefaciens as well. The critical aspect of S. putrefaciens is its ability to grow at 0 °C [28]. Cold-adapting mechanism includes increased fluidity of lipid membranes by the ability to finely adjust lipids composition [29]. Therefore, S. putrefaciens should be active in an MFC at low temperatures as well.
The most significant drop in voltage of all MFCs was observed by cooling them from approx. 6.2 to 0.0 °C. At 0.0 °C, the highest voltage drop was observed in the MFC with the GF-OX-EDA anode (down to ~127 mV) and the lowest one was obtained in the MFC with the GF-OX-pPDA anode (down to ~42 mV). After the cooling was terminated and MFCs were allowed to naturally warm up to room temperature, the voltage values of all of them returned to the same levels that were recorded before the cooling experiment. Therefore, it can be assumed that when temperature decreased down to values close to 0 °C, the slowing down of bacteria metabolism resulted in a decrease in voltage generation by MFCs. It can be envisaged that more time might be needed for a low-temperature adaptation mechanism of S. putrefaciens at a temperature close to 0 °C.

4. Conclusions

In summary, graphite felt was electrochemically oxidized and treated with ethylenediamine or p-phenylenediamine in one-step short procedure resulting in introduction of amino groups on its surface. A microbial fuel cell with the anode treated with ethylenediamine generated just slightly higher voltage than the MFC with the anode from bare GF, whereas the MFC with the anode from GF modified with p-phenylenediamine provided approx. 32% higher voltage than the control MFC, when electric circuits of investigated MFCs were loaded with resistors of 659 Ω. Surface power density of the latter MFC was approx. 1.75 times higher than that of the control. Decreasing temperature down to 0 °C resulted in just an approx. 30% reduction in voltage generated by the MFC with the anode from GF modified with p-phenylenediamine.

Author Contributions

Conceptualization, E.G. and K.K.; methodology, E.G. and K.K.; formal analysis, E.G. and K.K.; investigation, E.G., A.I., I.J. and K.K.; writing—original draft preparation, E.G., L.R., R.J. and K.K.; writing—review and editing, E.G. and K.K.; visualization, E.G. and A.I.; project administration, K.K.; funding acquisition, E.G., L.R., R.J., K.K. All authors have read and agreed to the published version of the manuscript.

Funding

This research is an outcome of the Kaunas University of Technology institutional multidisciplinary project “Innovative microbial fuel cells for sustainable production of bioenergy (MicrobElas)” that received funding from KTU RDI Fund (grant No. MTEPI-P-17002).

Conflicts of Interest

The authors declare no conflict of interest. The funders had no role in the design of the study; in the collection, analyses, or interpretation of data; in the writing of the manuscript, or in the decision to publish the results.

References

  1. Li, W.W.; Yu, H.Q.; He, Z. Towards sustainable wastewater treatment by using microbial fuel cells-centered technologies. Energy Environ. Sci. 2014, 7, 911–924. [Google Scholar] [CrossRef] [Green Version]
  2. Deb, D.; Patel, R.; Balas, V.E. A Review of Control-Oriented Bioelectrochemical Mathematical Models of Microbial Fuel Cells. Processes 2020, 8, 583. [Google Scholar] [CrossRef]
  3. Wang, H.; Park, J.-D.; Ren, Z.J. Practical energy harvesting for microbial fuel cells: A review. Environ. Sci. Technol. 2015, 49, 3267–3277. [Google Scholar] [CrossRef] [PubMed]
  4. Zhen, G.; Lu, X.; Kumar, G.; Bakonyi, P.; Xu, K.; Zhao, Y. Microbial electrolysis cell platform for simultaneous waste biorefinery and clean electrofuels generation: Current situation, challenges and future perspectives. Prog. Energy Combust. Sci. 2017, 63, 119–145. [Google Scholar] [CrossRef]
  5. Raslavičius, L.; Striūgas, N.; Felneris, M. New insights into algae factories of the future. Renew. Sustain. Energ. Rev. 2018, 81, 643–654. [Google Scholar] [CrossRef]
  6. Bajracharya, S.; Srikanth, S.; Mohanakrishna, G.; Zacharia, R.; Strik, D.; Pant, D. Biotransformation of carbon dioxide in bioelectrochemical systems: State of the art and future prospects. J. Power Sources 2017, 356, 256–273. [Google Scholar] [CrossRef]
  7. Greenman, J.; Ieropoulos, I.A. Allometric scaling of microbial fuel cells and stacks: The lifeform case for scale-up. J. Power Sources 2017, 356, 365–370. [Google Scholar] [CrossRef]
  8. Hao, L.; Zhang, B.; Tian, C.; Liu, Y.; Shi, C.; Cheng, M.; Feng, C. Enhanced microbial reduction of vanadium (V) in groundwater with bioelectricity from microbial fuel cells. J. Power Sources 2015, 287, 43–49. [Google Scholar] [CrossRef]
  9. Grattieri, M.; Suvira, M.; Hasan, K.; Minteer, S.D. Halotolerant extremophile bacteria from the Great Salt Lake for recycling pollutants in microbial fuel cells. J. Power Sources 2017, 356, 310–318. [Google Scholar] [CrossRef]
  10. Tommasi, T.; Salvador, G.P.; Quaglio, M. New insights in Microbial Fuel Cells: Novel solid phase anolyte. Sci. Rep. 2016, 6, 29091. [Google Scholar] [CrossRef] [Green Version]
  11. Santoro, C.; Arbizzani, C.; Erable, B.; Ieropoulos, I. Microbial fuel cells: From fundamentals to applications. A review. J. Power Sources 2017, 356, 225–244. [Google Scholar] [CrossRef] [PubMed]
  12. Du, Q.; An, J.; Li, J.; Zhou, L.; Li, N.; Wang, X. Polydopamine as a new modification material to accelerate startup and promote anode performance in microbial fuel cells. J. Power Sources 2017, 343, 477–482. [Google Scholar] [CrossRef]
  13. Jiang, H.; Yang, L.; Deng, W.; Tan, Y.; Xie, Q. Macroporous graphitic carbon foam decorated with polydopamine as a high-performance anode for microbial fuel cell. J. Power Sources 2017, 363, 27–33. [Google Scholar] [CrossRef]
  14. Hindatu, Y.; Annuara, M.S.M.; Gumel, A.M. Mini-review: Anode modification for improved performance of microbial fuel cell. Renew. Sust. Energ. Rev. 2017, 73, 236–248. [Google Scholar] [CrossRef]
  15. ElMekawy, A.; Hegab, H.M.; Losic, D.; Saint, C.P.; Pant, D. Applications of graphene in microbial fuel cells: The gap between promise and reality. Renew. Sustain. Energ. Rev. 2017, 72, 1389–1403. [Google Scholar] [CrossRef]
  16. Shen, Y.; Zhou, Y.; Chen, S.; Yang, F.; Zheng, S.; Hou, H. Carbon nanofibers modified graphite felt for high performance anode in high substrate concentration microbial fuel cells. Sci. World J. 2014, 130185. [Google Scholar] [CrossRef]
  17. Wei, J.; Liang, P.; Huang, X. Recent progress in electrodes for microbial fuel cells. Bioresour. Technol. 2011, 102, 9335–9344. [Google Scholar] [CrossRef]
  18. Li, C.; Cheng, S. Functional group surface modifications for enhancing the formation and performance of exoelectrogenic biofilms on the anode of a bioelectrochemical system. Crit. Rev. Biotechnol. 2019, 39, 1015–1030. [Google Scholar] [CrossRef]
  19. Xie, Y.; Ma, Z.; Song, H.; Stoll, Z.A.; Xu, P. Melamine modified carbon felts anode with enhanced electrogenesis capacity toward microbial fuel cells. J. Energy Chem. 2017, 26, 81–86. [Google Scholar] [CrossRef] [Green Version]
  20. Cheng, S.A.; Logan, B.E. Ammonia treatment of carbon cloth anodes to enhance power generation of microbial fuel cells. Electrochem. Commun. 2007, 9, 492–4496. [Google Scholar] [CrossRef]
  21. Zhu, N.; Chen, X.; Zhang, T.; Wu, P.; Li, P.; Wu, J. Improved performance of membrane free single-chamber air-cathode microbial fuel cells with nitric acid and ethylenediamine surface modified activated carbon fiber felt anodes. Bioresour. Technol. 2011, 102, 422–426. [Google Scholar] [CrossRef] [PubMed]
  22. Sharma, M.; Bajracharya, S.; Gildemyn, S.; Patil, S.A.; Alvarez-Gallego, Y.; Pant, D.; Rabaey, K.; Dominguez-Benettona, X. A critical revisit of the key parameters used to describe microbial electrochemical systems. Electrochim. Acta 2014, 140, 191–208. [Google Scholar] [CrossRef]
  23. Wu, X.; Zou, L.; Huang, Y.; Qiao, Y.; Long, Z.; Liu, H.; Li, C.M. Shewanella putrefaciens CN32 outer membrane cytochromes MtrC and UndA reduce electron shuttles to produce electricity in microbial fuel cells. Enzyme Microb. Technol. 2018, 115, 23–28. [Google Scholar] [CrossRef]
  24. Carmona-Martínez, A.A.; Harnisch, F.; Kuhlicke, U.; Neu, T.R.; Schröder, U. Electron transfer and biofilm formation of Shewanella putrefaciens as function of anode potential. Bioelectrochemistry 2013, 93, 23–29. [Google Scholar] [CrossRef] [PubMed]
  25. Verma, S.; Dutta, R.K. A facile method of synthesizing ammonia modified graphene oxide for efficient removal of uranyl ions from aqueous medium. RSC Adv. 2015, 5, 77192. [Google Scholar] [CrossRef]
  26. Bagge, D.; Hjelm, M.; Johansen, C.; Huber, I.; Gram, L. Shewanella putrefaciens adhesion and biofilm formation on food processing surfaces. Appl. Environ. Microbiol. 2001, 67, 2319–2325. [Google Scholar] [CrossRef] [Green Version]
  27. Price, P.B.; Sowers, T. Temperature dependence of metabolic rates for microbial growth, maintenance, and survival. Proc. Natl. Acad. Sci. USA 2004, 101, 4631–4636. [Google Scholar] [CrossRef] [Green Version]
  28. Yang, S.P.; Xie, J.; Cheng, Y.; Zhang, Z.; Zhao, Y.; Qian, Y.F. Response of Shewanella putrefaciens to low temperature regulated by membrane fluidity and fatty acid metabolism. LWT Food Sci. Technol. 2020, 117, 108638. [Google Scholar] [CrossRef]
  29. Gao, X.; Liu, W.; Mei, J.; Xie, J. Quantitative Analysis of Cold Stress Inducing Lipidomic Changes in Shewanella putrefaciens Using UHPLC-ESI-MS/MS. Molecules 2019, 24, 4609. [Google Scholar] [CrossRef] [Green Version]
Figure 1. Schematic representation of electrochemical oxidation of graphite felt (GF) in 10% H2SO4 solution.
Processes 08 00939 g001
Figure 2. Fourier-Transform Infrared (FT-IR) spectra of bare GF, electrochemically oxidized (GF-OX) and modified with ethylenediamine (EDA) (GF-OX-EDA) and pPDA (GF-OX-pPDA).
Processes 08 00939 g002
Figure 3. Schematic view of one-step modification (Method A) of electrochemically oxidized graphite felt (GF-OX) with ethylenediamine and p-phenylenediamine.
Processes 08 00939 g003
Figure 4. Reaction scheme of two step modification (Method B) of electrochemically oxidized graphite felt (GF-OX) with ethylenediamine and p-phenylenediamine.
Processes 08 00939 g004
Figure 5. Schematic view of an operating microbial fuel cell (MFC) and measurement of its electrochemical characteristics. Here: 1—flow-through MFC, 2—PEM, 3—bare or modified GF anode, 4—bare GF cathode, 5—anolyte reservoir, 6—catholyte reservoir, 7—peristaltic pump, 8—diaphragm air pump, 9—airlock.
Processes 08 00939 g005
Figure 6. Curves of open circuit potential change over time (a) and chronoamperograms (b) of bare GF cathode in aerated and deaerated PBS. Each step in chronoamperograms corresponds to an increase of cathodic polarisation by 25 mV starting from open circuit potential (OCP).
Processes 08 00939 g006
Figure 7. Dependence of voltage generated by MFCs with different anodes on duration and ambient temperature at an electric load of 659 Ω. Surface power density values for MFCs with different anodes calculated over a 48–72 h period (presented above a corresponding curve).
Processes 08 00939 g007
Figure 8. Dependence of MFCs’ surface power density (over a 10 min periods) on applied electric load.
Processes 08 00939 g008
Figure 9. Dependence of MFCs’ surface energy density (over a 10 min period) on applied electrical load.
Processes 08 00939 g009
Figure 10. Dependence of voltage generated by MFCs with different anodes on temperature and duration at an electric load of 659 Ω.
Processes 08 00939 g010
Table 1. Data of Energy Dispersive X-ray (EDX) analysis of bare GF, GF-OX, GF-OX-EDA, and GF-OX-pPDA samples.
SampleConcentration of Element, at. %
CON
Bare GF92.91.06.1
GF-OX78.018.83.2
GF-OX-EDA77.89.013.2
GF-OX-pPDA77.99.812.3

