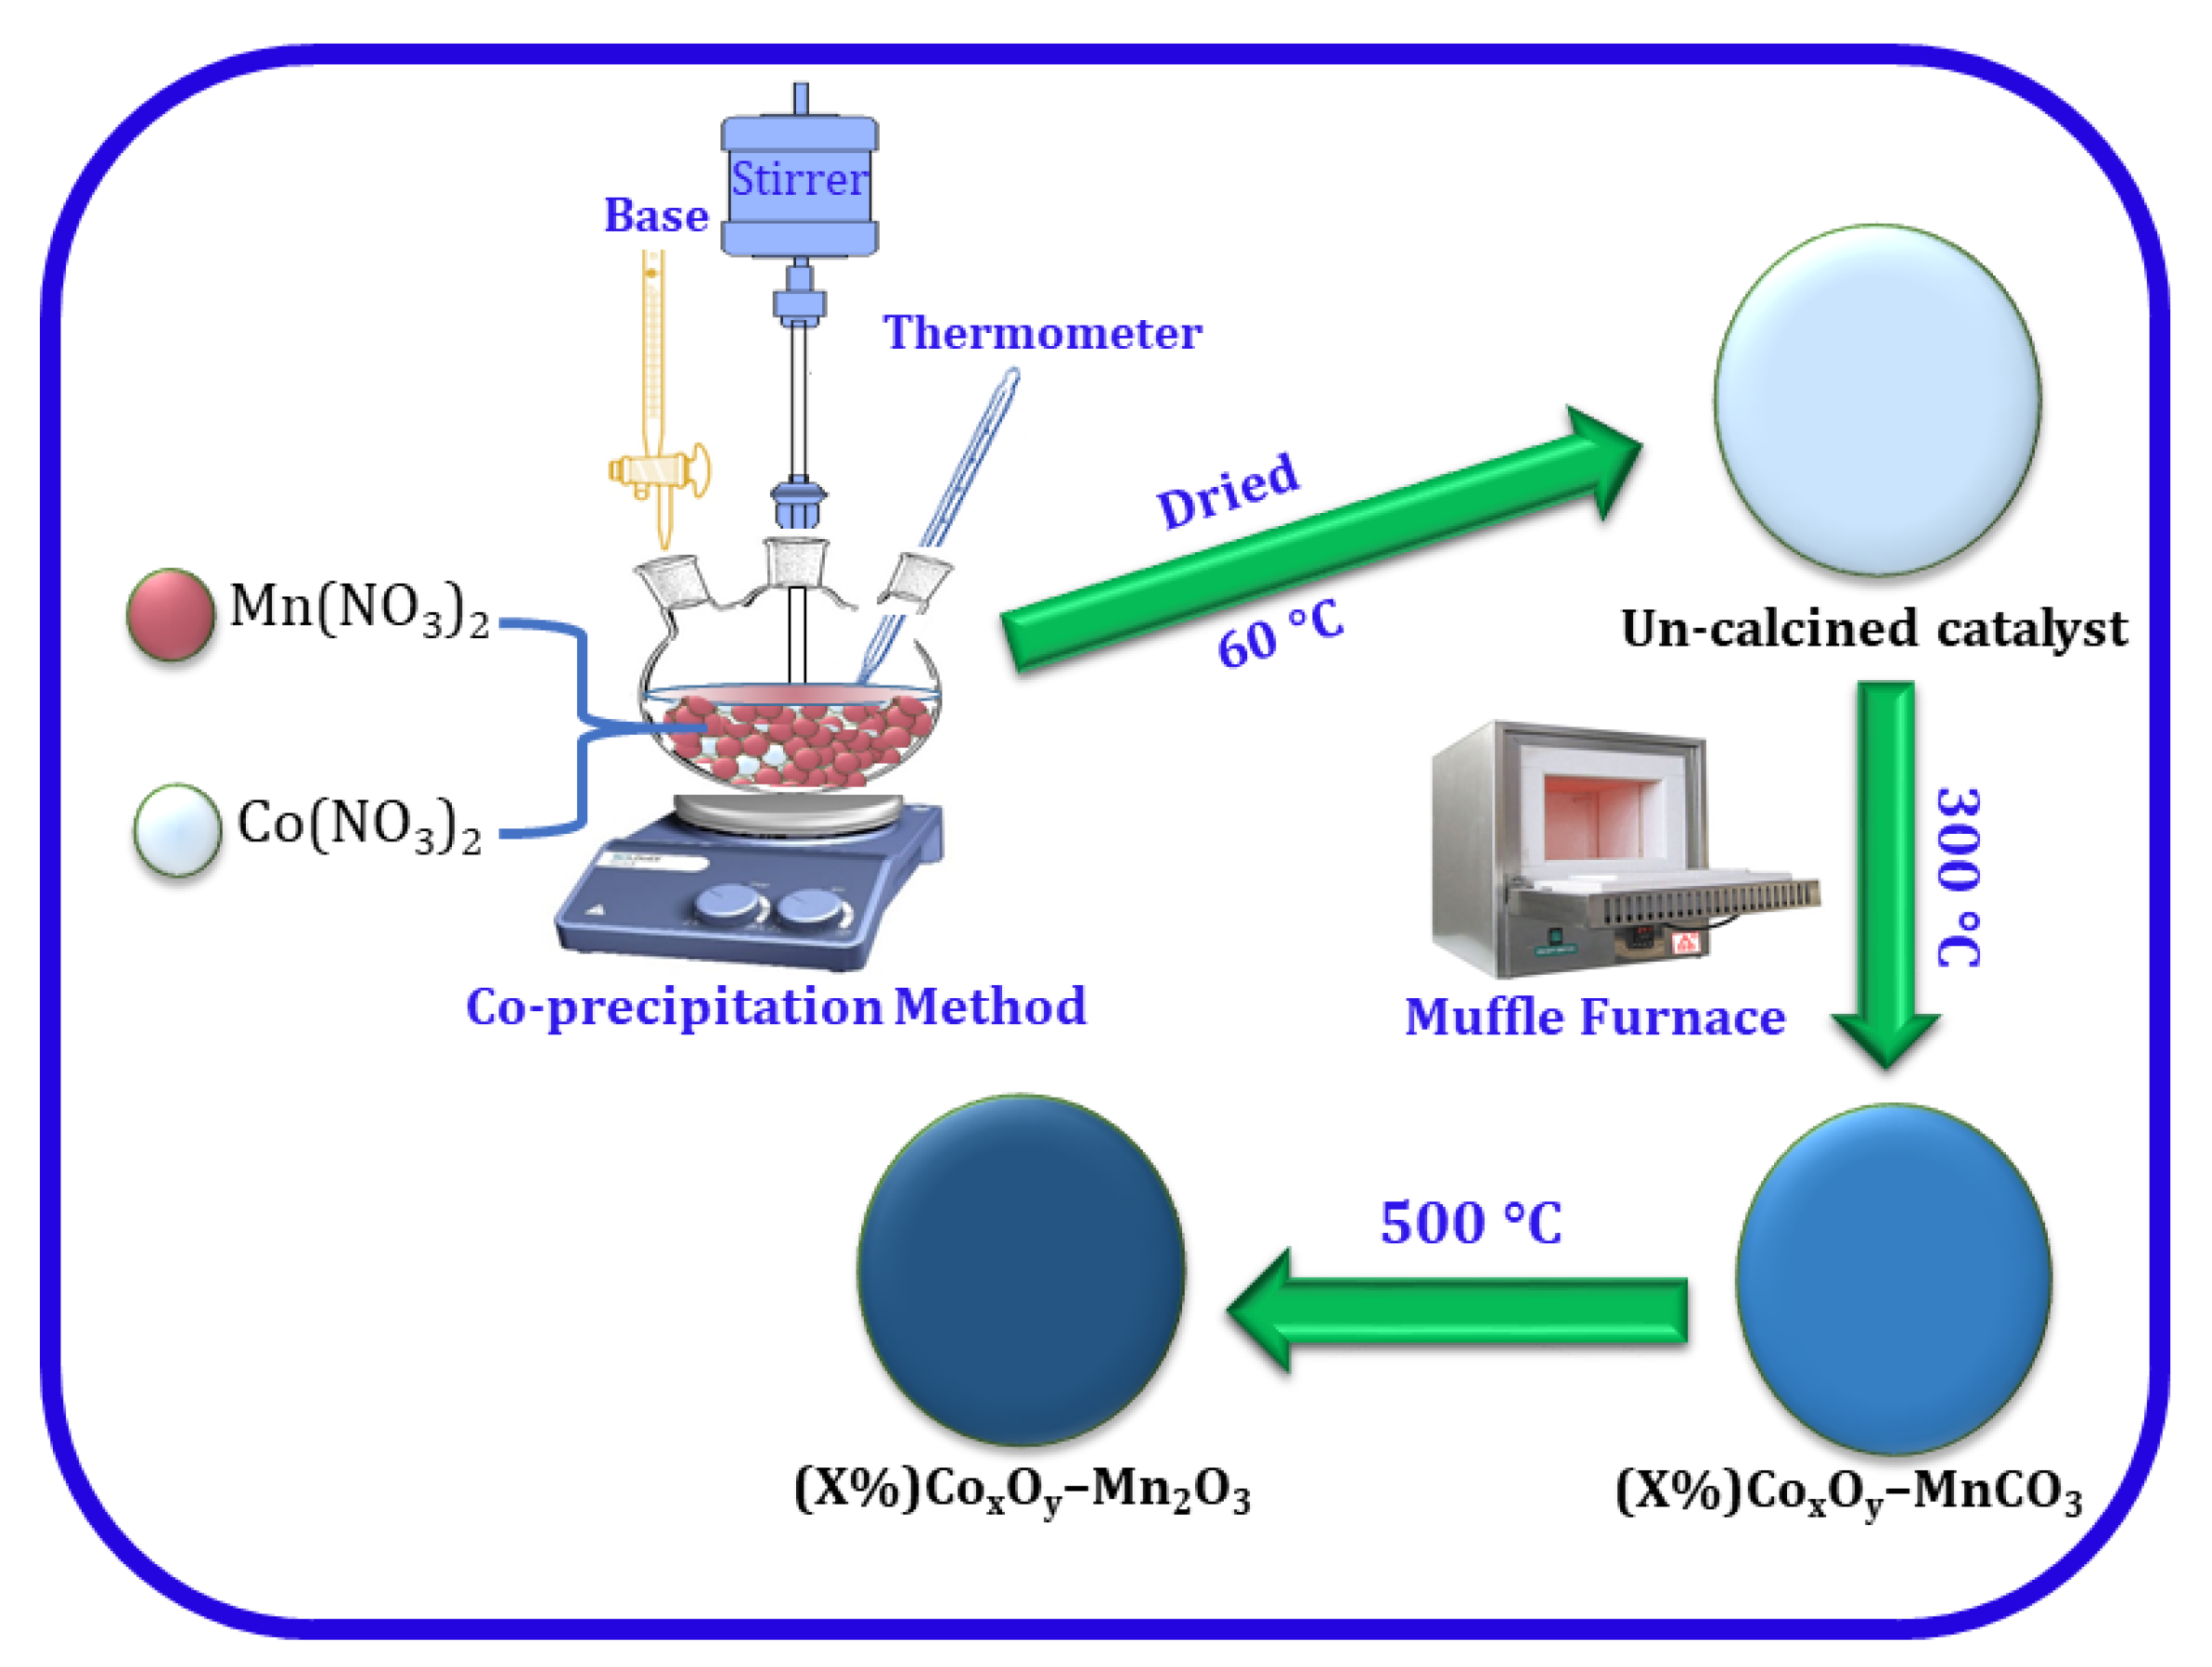
3.1. Characterizations
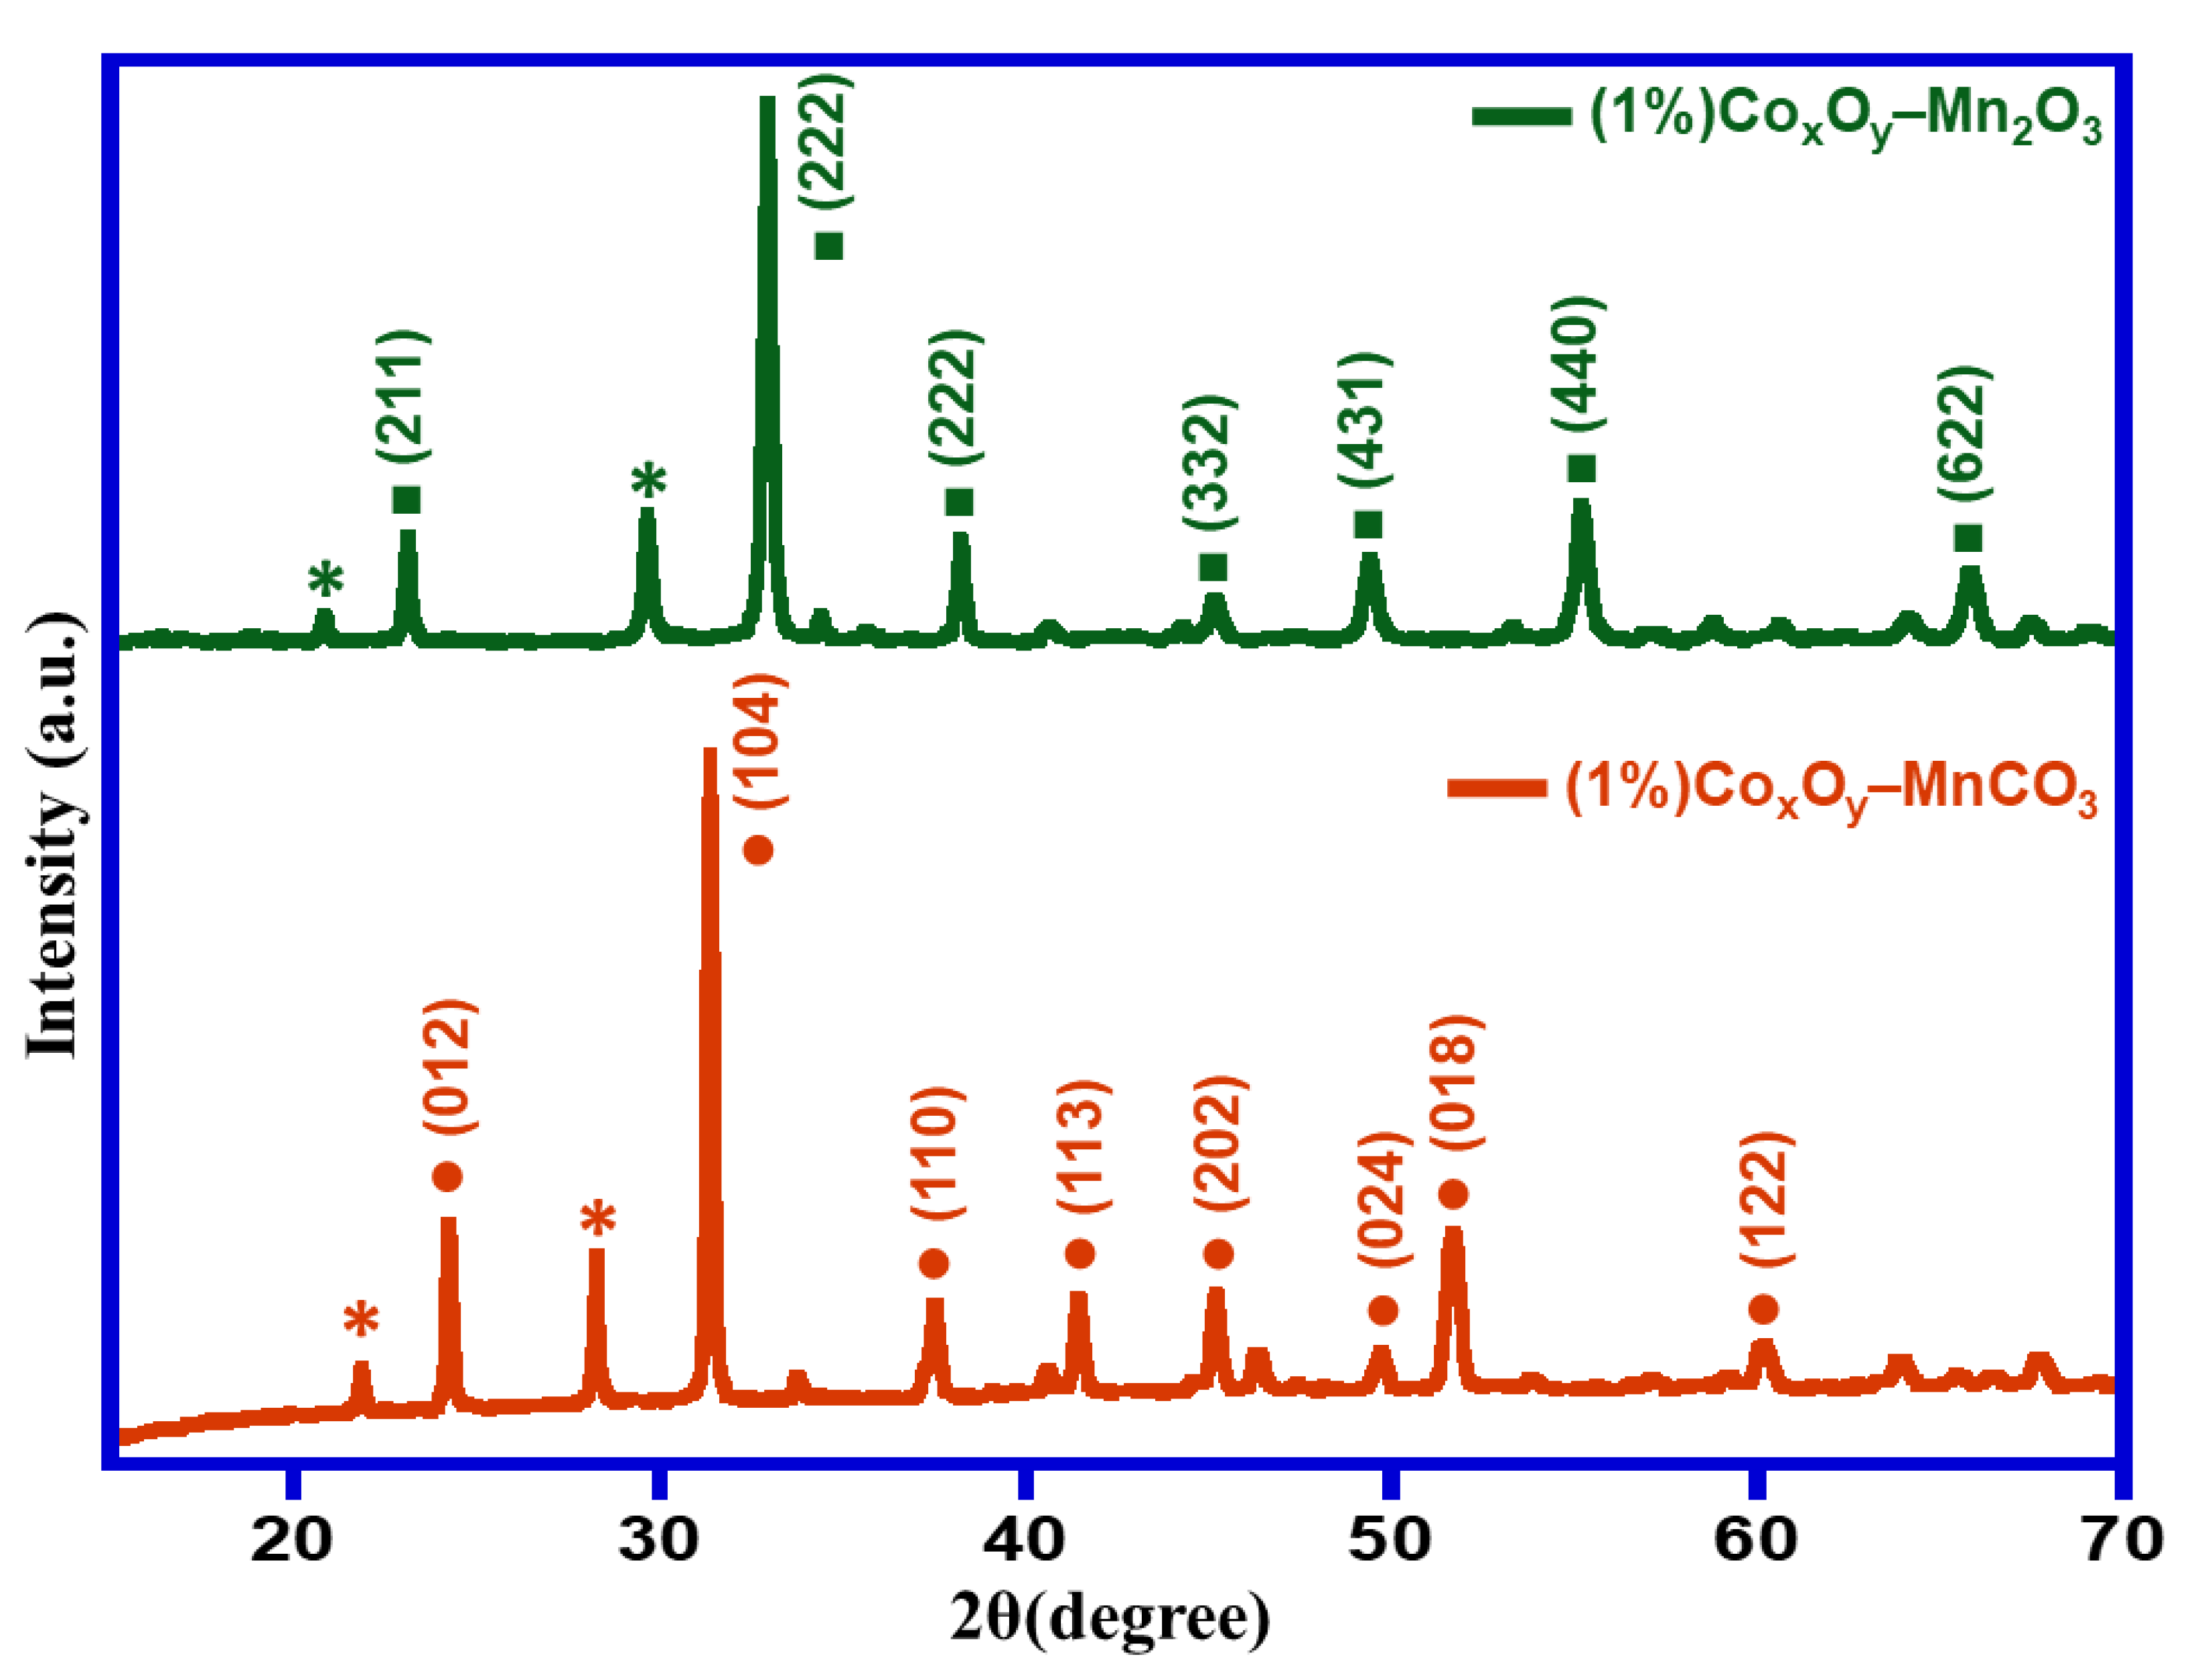
Crystallographic structure of obtained materials was determined using XRD analysis.
Figure 1 illustrates XRD analyses of catalyst calcined at 300 °C i.e., (1%)Co
xO
y–MnCO
3, and 500 °C i.e., (1%)Co
xO
y–Mn
2O
3. The obtained diffraction patterns revealed that the prepared catalysts were crystalline in nature. XRD pattern of catalyst calcined at 300 °C exhibited the existence of rhodochrosite MnCO
3 (JCPDS file no. 00-001-0981) (space group R-3c (167)). Upon the calcination at elevated temperature at 500 °C, this transformed to bixbyite dimanganese trioxide (Mn
2O
3) (JCPDS file No. 00-002-0909). The diffraction peaks related to Co
xO
y could not be identified owing to its low percentage in the catalyst. The crystallite size of the prepared samples was calculated using Debye–Scherrer equations and it was found to be 31 nm and 25.11 nm for (1%)Co
xO
y–MnCO
3 and (1%)Co
xO
y–Mn
2O
3, respectively.
The surface morphology of the as-obtained catalysts was identified using SEM analysis. The catalyst obtained using the co-precipitation procedure calcined at 300 °C (i.e., (1%)Co
xO
y–MnCO
3) and 500 °C (i.e., (1%)Co
xO
y–Mn
2O
3). The SEM images of the prepared catalysts (1%)Co
xO
y–MnCO
3 and (1%)Co
xO
y–Mn
2O
3 are represented in
Figure 2. SEM images revealed that the morphology of as-synthesized catalysts possessed well-defined cuboidal morphology. Particle-size distributions of the catalysts (1%)Co
xO
y–MnCO
3 and (1%)Co
xO
y–Mn
2O
3 were determined using Image J software program as demonstrated in
Figure 2c,f. The particle-size distribution graphs displayed slight differences in the particle sizes with changes in calcination temperature. In addition, elemental composition of both catalysts, (1%)Co
xO
y–MnCO
3 and (1%)Co
xO
y–Mn
2O
3, were determined by EDS analysis, which revealed the elemental analysis summary of as-synthesized catalysts as demonstrated in
Figure S1. Sharp signal at 5.894 keV strongly indicated the presence of ‘Mn’ as major element. Mn commonly has an optical absorption in this range owing to the surface plasmon resonance (SPR) phenomenon. A signal at 6.924 keV strongly indicated the existence of ‘Co’ element. It is also note-worthy that other signals found in the range of 0–0.5 keV, endorse typical absorption of C and O
2. Apparently, elemental compositions of catalysts are approximately identical to values of the composition anticipated while synthesizing the catalyst. Additionally, the samples were subjected to ICP analysis to confirm the exact composition of the catalyst and the percentage to Co
xO
y in the catalytic system was found to be 1.8%.
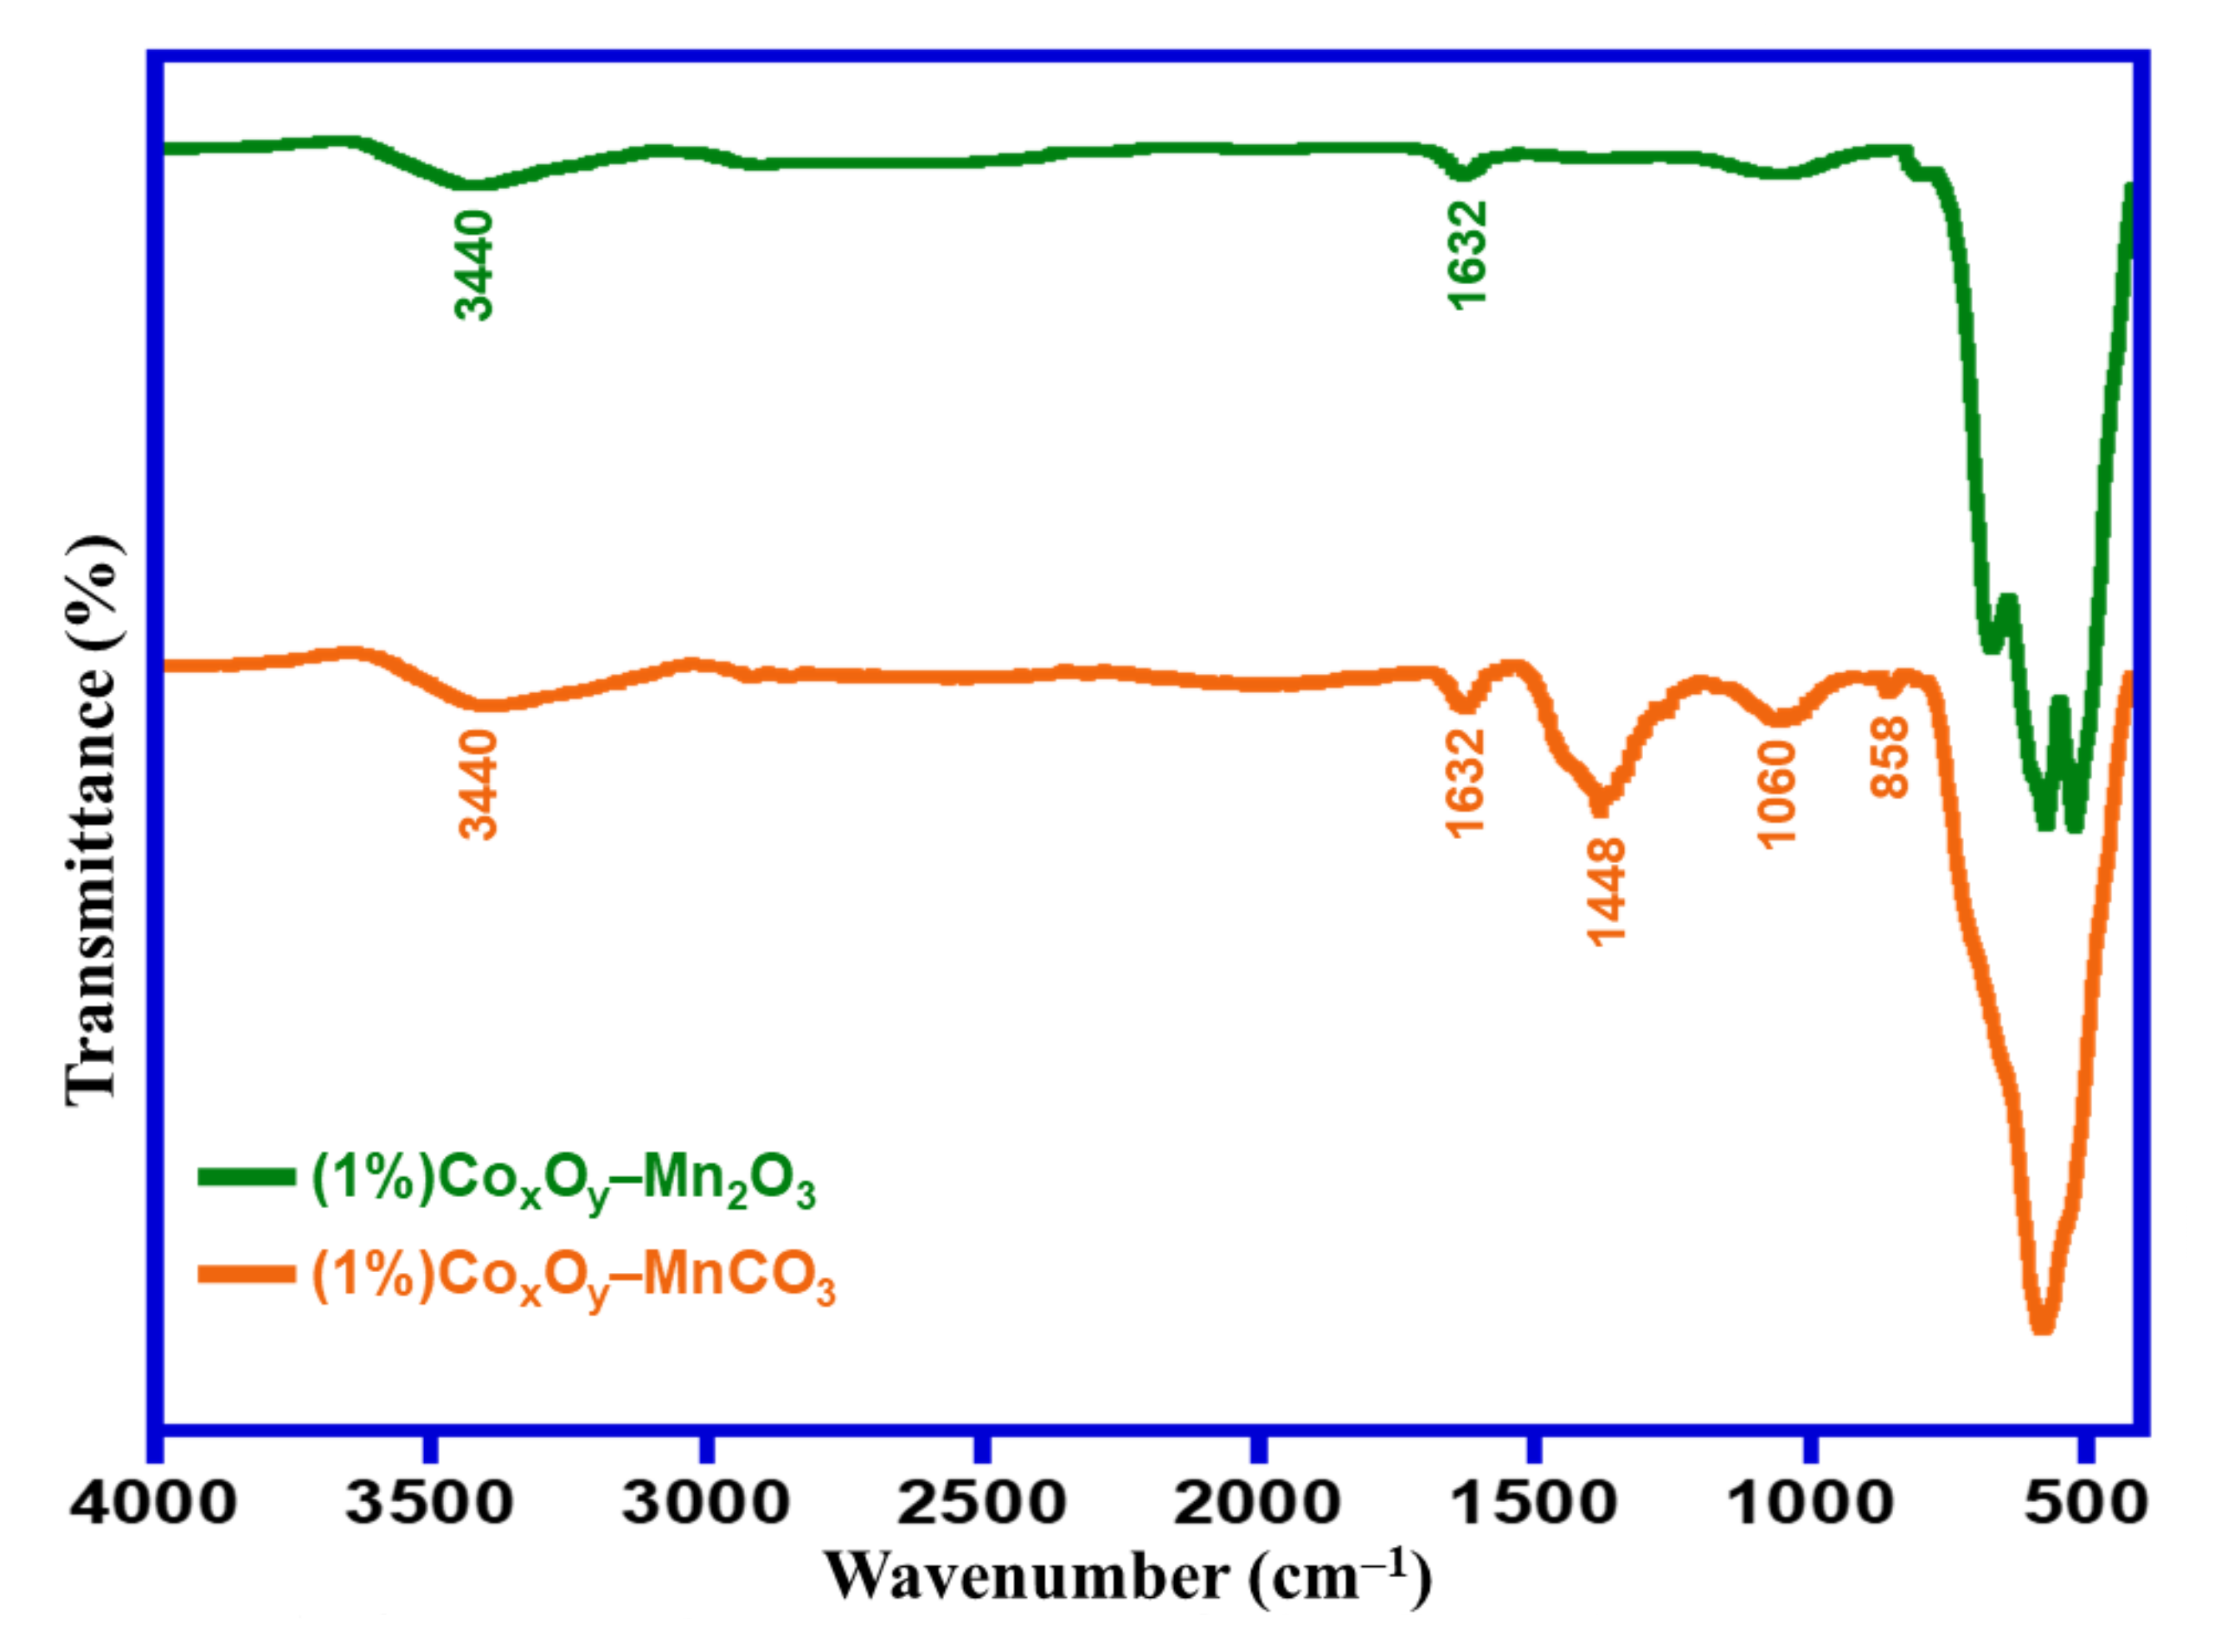
The surface functionalities of the prepared catalysts were studied using FTIR spectroscopy. FTIR analyses of catalysts at 300 °C and 500 °C calcination temperatures i.e., (1%)Co
xO
y–MnCO
3 and (1%)Co
xO
y–Mn
2O
3, respectively, are illustrated in
Figure 3. High wavenumber area shows stretching vibrations of OH groups and absorbed H
2O molecules. The characteristic absorption spectral signals of ν-OH situated approximately at 3440 cm
–1 were found in 300 °C- and 500 °C-calcined catalysts, however a reduction in the intensities of these spectral signals was observed when the calcination temperature increased from 300 °C to 500 °C. This displays the decline of the existence of number of O–H groups on the catalyst surface. Furthermore, the spectral signals centered at ~163
2 cm
–1 belong to bending modes of OH groups, which also displayed a decrease in intensity [
35]. In the FTIR spectrum of (1%)Co
xO
y–MnCO
3 calcined at 300 °C, the existence of two absorption peaks located at around 858 and 1448 cm
–1 are reported as fingerprint peaks for MnCO
3, which was also confirmed by XRD and EDS results [
36]. Additional, a peak at 1060 cm
–1, characteristic to vibrations of (C–O) bond, further confirmed the presence of the carbonate group in the catalyst calcined at 300 °C. For the 500 °C-calcined catalyst ((1%)Co
xO
y–Mn
2O
3), there were two bands at 858 and 1448 cm
–1 while the characteristic spectral signals for MnCO
3 were not found, revealing the total transformation of MnCO
3 to Mn
2O
3 at 500 °C calcination temperature. Intensive peaks were located in the range of 530–620 cm
–1 that are fingerprint for several types of manganese oxides [
37,
38].
TGA analyses were conducted to assess the thermal stability of the as-prepared materials. This technique is especially advantageous for studying the thermal degradation of materials at various temperatures. The thermal stability of (1%)Co
xO
y–MnCO
3 calcined at 300 °C as well as (1%)Co
xO
y–Mn
2O
3 at 500 °C was evaluated by TGA as described in
Figure 4. The thermogram of the catalyst calcined at 300 °C, i.e., (1%)Co
xO
y–MnCO
3, showed that it was stable up to 415 °C, with a slight weight loss of around 7% which could be ascribed to the exclusion of volatile impurities and adsorbed moisture. Raising the temperature led to an extra overall weight loss of 16% in the range of about 420–600 °C, which appears to be attributed to decarboxylation of MnCO
3 to produce MnO
2 and CO
2, with the MnO
2 being oxidized to Mn
2O
3, as reported by Zhu and co-workers [
39].
To understand the variations in specific surface areas owing to the calcination process at various temperatures and the doping of the catalytic system with Co
xO
y, and to realize the linkage between the specific surface areas and catalytic activities of synthesized catalysts for this transformation, the specific surface area of prepared materials (i.e., (1%)Co
xO
y–MnCO
3, MnCO
3, (1%)Co
xO
y–Mn
2O
3, and Mn
2O
3) was examined by BET analysis.
Table 1 shows that specific surface area of the synthesized catalyst calcined at 300 °C and 500 °C i.e., (1%)Co
xO
y–MnCO
3 and (1%)Co
xO
y–Mn
2O
3, was approximately 108.4 and 56.7 m
2/g, respectively. From this it can be said that the specific surface area of the catalyst calcined at 300 °C i.e., (1%)Co
xO
y–MnCO
3, is larger than the catalyst obtained upon calcination at 500 °C i.e., (1%)Co
xO
y–Mn
2O
3. The attained data suggests that at higher calcination temperatures there is a decline in the specific surface area, presumably attributed to sintering. It is worth pointing out that sintering not only causes inter-particles, but it additionally diminishes the porosity in a single particle [
40]. Notably, the uncalcined catalyst, i.e., (1%)Co
xO
y–MnCO
3, exhibited a surface area of 63.4 m
2/g, which confirms that the calcination temperature plays a fundamental role in enhancing the surface area of the catalytic system.
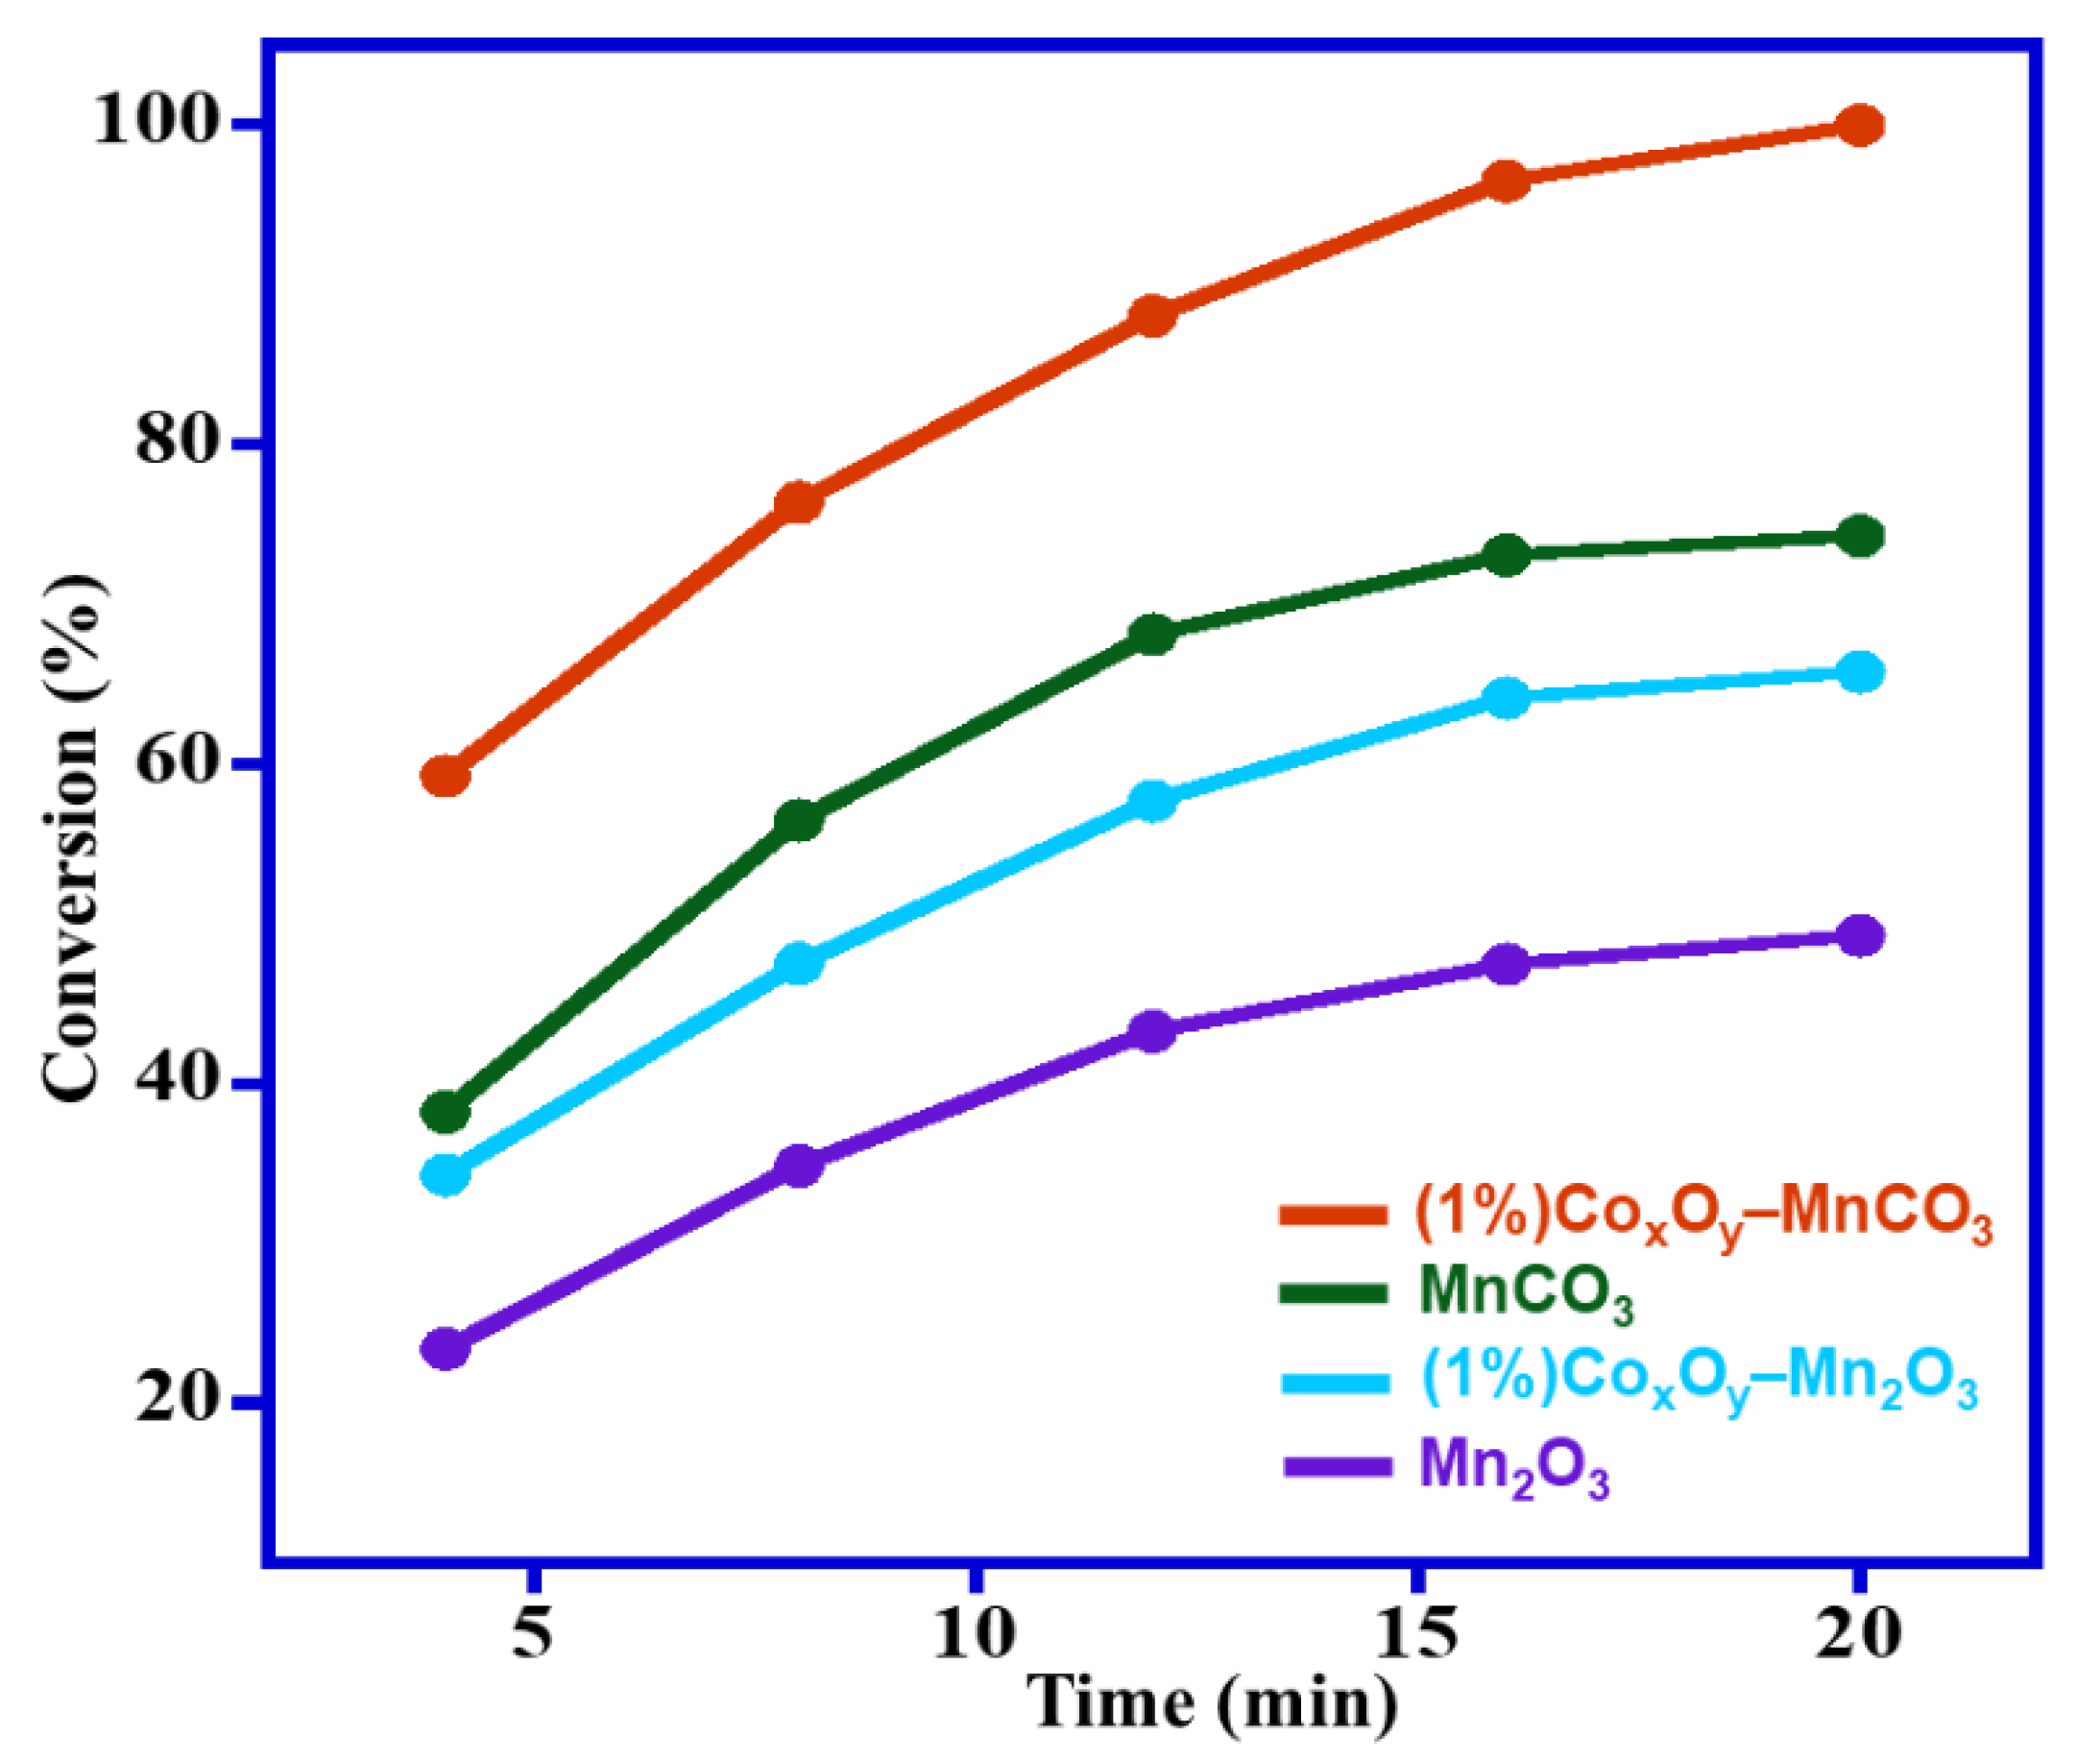
Apart from the effect of calcination temperature, CoxOy has a promoting impact on catalytic efficiency by raising the specific surface area of manganese carbonate. The results show that after doping the catalyst with CoxOy, the specific surface area increased to 108.4 m2/g and yielded 100% conversion of BzOH, while the specific surface area of un-doped catalyst i.e., MnCO3, was about 85.2 m2/g and gave 74.3% BzOH conversion. The substantial increase in the specific surface area after doping CoxOy might be responsible for enhancement of the catalytic performance, which can be attributed to existence of CoxOy on the MnCO3′s surface. As a result, it can be stated that the synthesized catalyst upon calcination at different temperatures yields catalysts with different specific surface areas, which play a pivotal role in the efficiency of the synthesized catalyst. Hence from the above data, it can be deduced that the calcination temperature and the doping of CoxOy played a key role in varying the specific surface area of obtained catalysts, which in turn affected the catalytic performance.
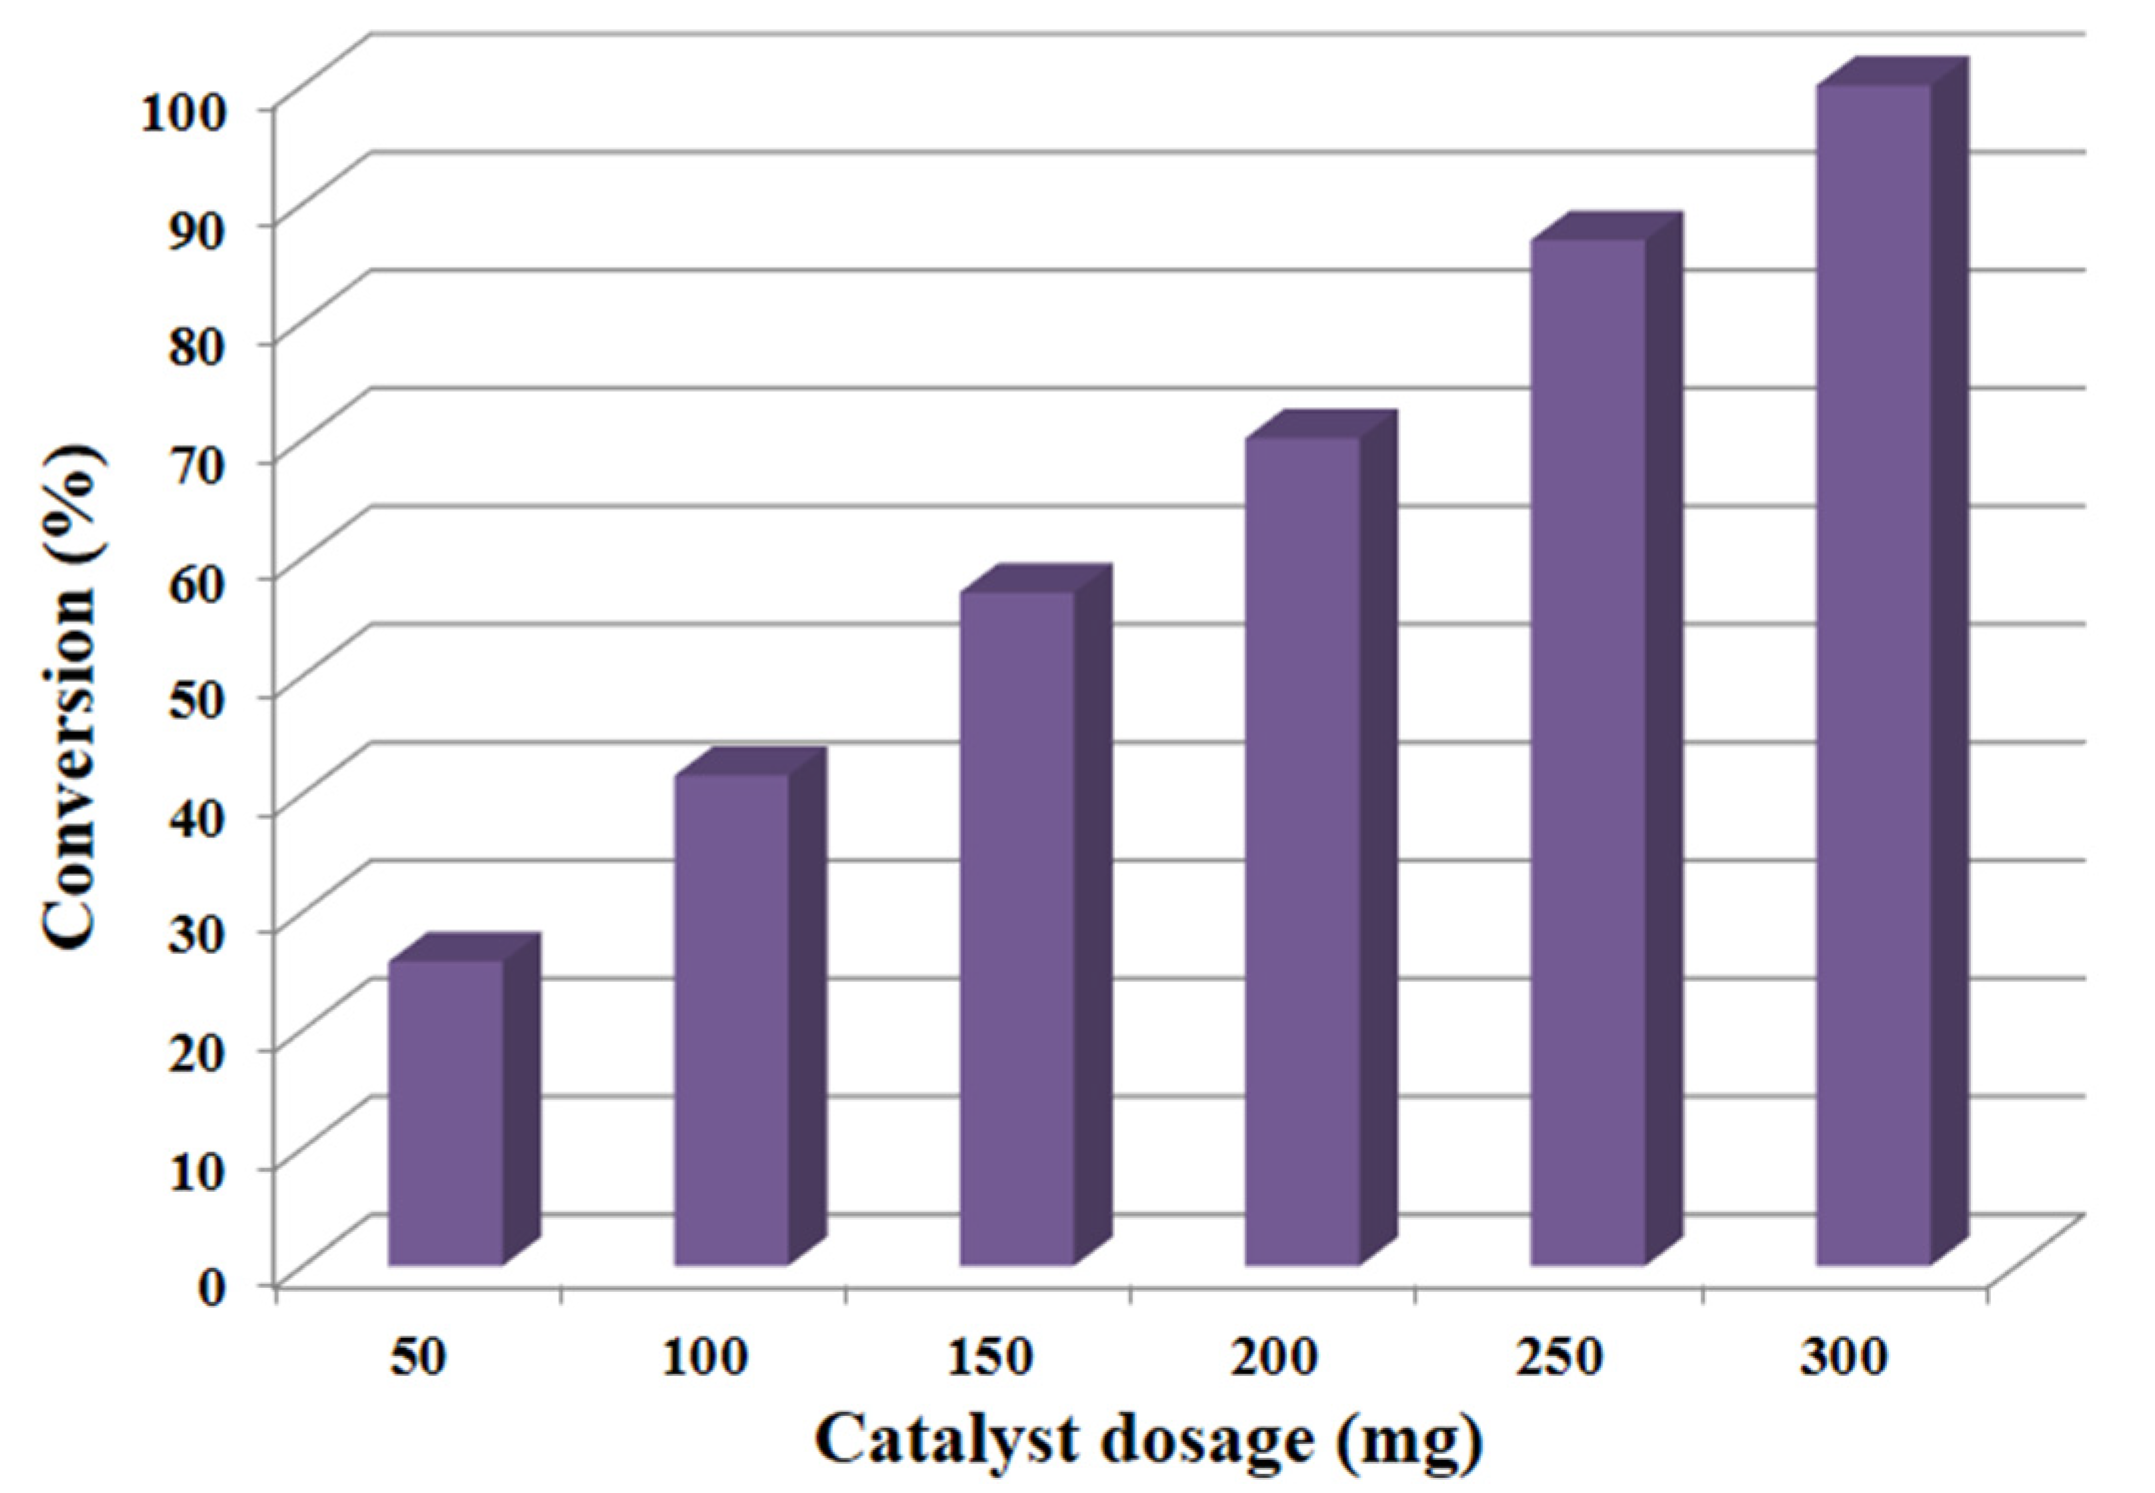
3.3. Recovery Tests
The recyclability of catalysts is an extremely important topic for cost reduction in industrial applications, therefore the repeatability of (1%)Co
xO
y–MnCO
3 for the aerial oxidation of BzOH was assessed under optimum circumstances and the attained data is depicted in
Figure 9. The recovery data disclosed that the prepared catalyst is capable of reuse for six runs without noticeable loss in its activity after each run. The BzOH conversion product declined slightly from 100% to 91.1% after six subsequent cycles, which can be ascribed to trivial weight loss of the catalyst during the washing and filtration process [
11]. Interestingly, the selectivity to BzH was intact (>99) during all recyclability tests. These observations indicate that the prepared catalyst is resistant to deactivation in catalytic oxidation of BzOH.
Moreover, to demonstrate the outstanding catalytic efficiency of our catalytic protocol, the performance of our catalyst was compared with other cobalt-possessing catalysts found in the previous publications and the findings are summarized in
Table 5. The data revealed that, among all mentioned catalysts, the (1%)Co
xO
y–MnCO
3 catalyst seems to be the most efficacious catalyst for oxidation of BzOH in terms of conversion, specific activity, and reaction time. The present catalyst i.e., (1%)Co
xO
y–MnCO
3, achieved 100% BzOH conversion as well as >99 BzH selectivity within a relatively short period of 20 min at 100 °C as well as the highest specific activity (20 mmol/g·h) when compared to listed catalysts. Notably, other reported cobalt-based catalysts required a much longer time or higher temperature to achieve 100% conversion of BzOH. In this context, Jha and his co-workers [
47] have synthesized the manganese and cobalt oxides incorporated on reduced graphene oxide (MnCoO–(1%)RGO) nanocomposites via the solvothermal procedure and employed these as an oxidative catalyst for BzOH oxidation. MnCoO–(1%)RGO nanocomposite gave about 78% BzOH conversion and 100% selectivity to BzH along with lower specific activity (12.6 mmol/g·h) after 2 h, which is a longer reaction time relative to that required by our catalyst. In another example, Ragupathi and co-workers [
48] reported the use of cobalt aluminate nanoparticles (CoAl
2O
4) as a heterogeneous catalyst utilizing H
2O
2 as an oxidizing agent for oxidation of BzOH, but it required a much longer period of 8 h to give 96% alcohol conversion as well as having lower specific activity (1.2 mmol/g·h) when compared with our catalytic system. However, when the catalyst (1%)Co
xO
y–MnCO
3 was compared with various other Mn-based catalysts it was found that the present catalyst was better, with specific activity 20 mmol/g·h, than ZrO
x(1%)–MnCO
3, ZnO
x(1%)–MnCO
3, or Ag
2O(1%)–MnO
2, which showed specific activity of 13.3 mmol/g·h, 16.0 mmol/g·h, and 3.3 mmol/g·h, respectively. However, their graphene-based nanocomposites were found to be much better than the present catalyst.
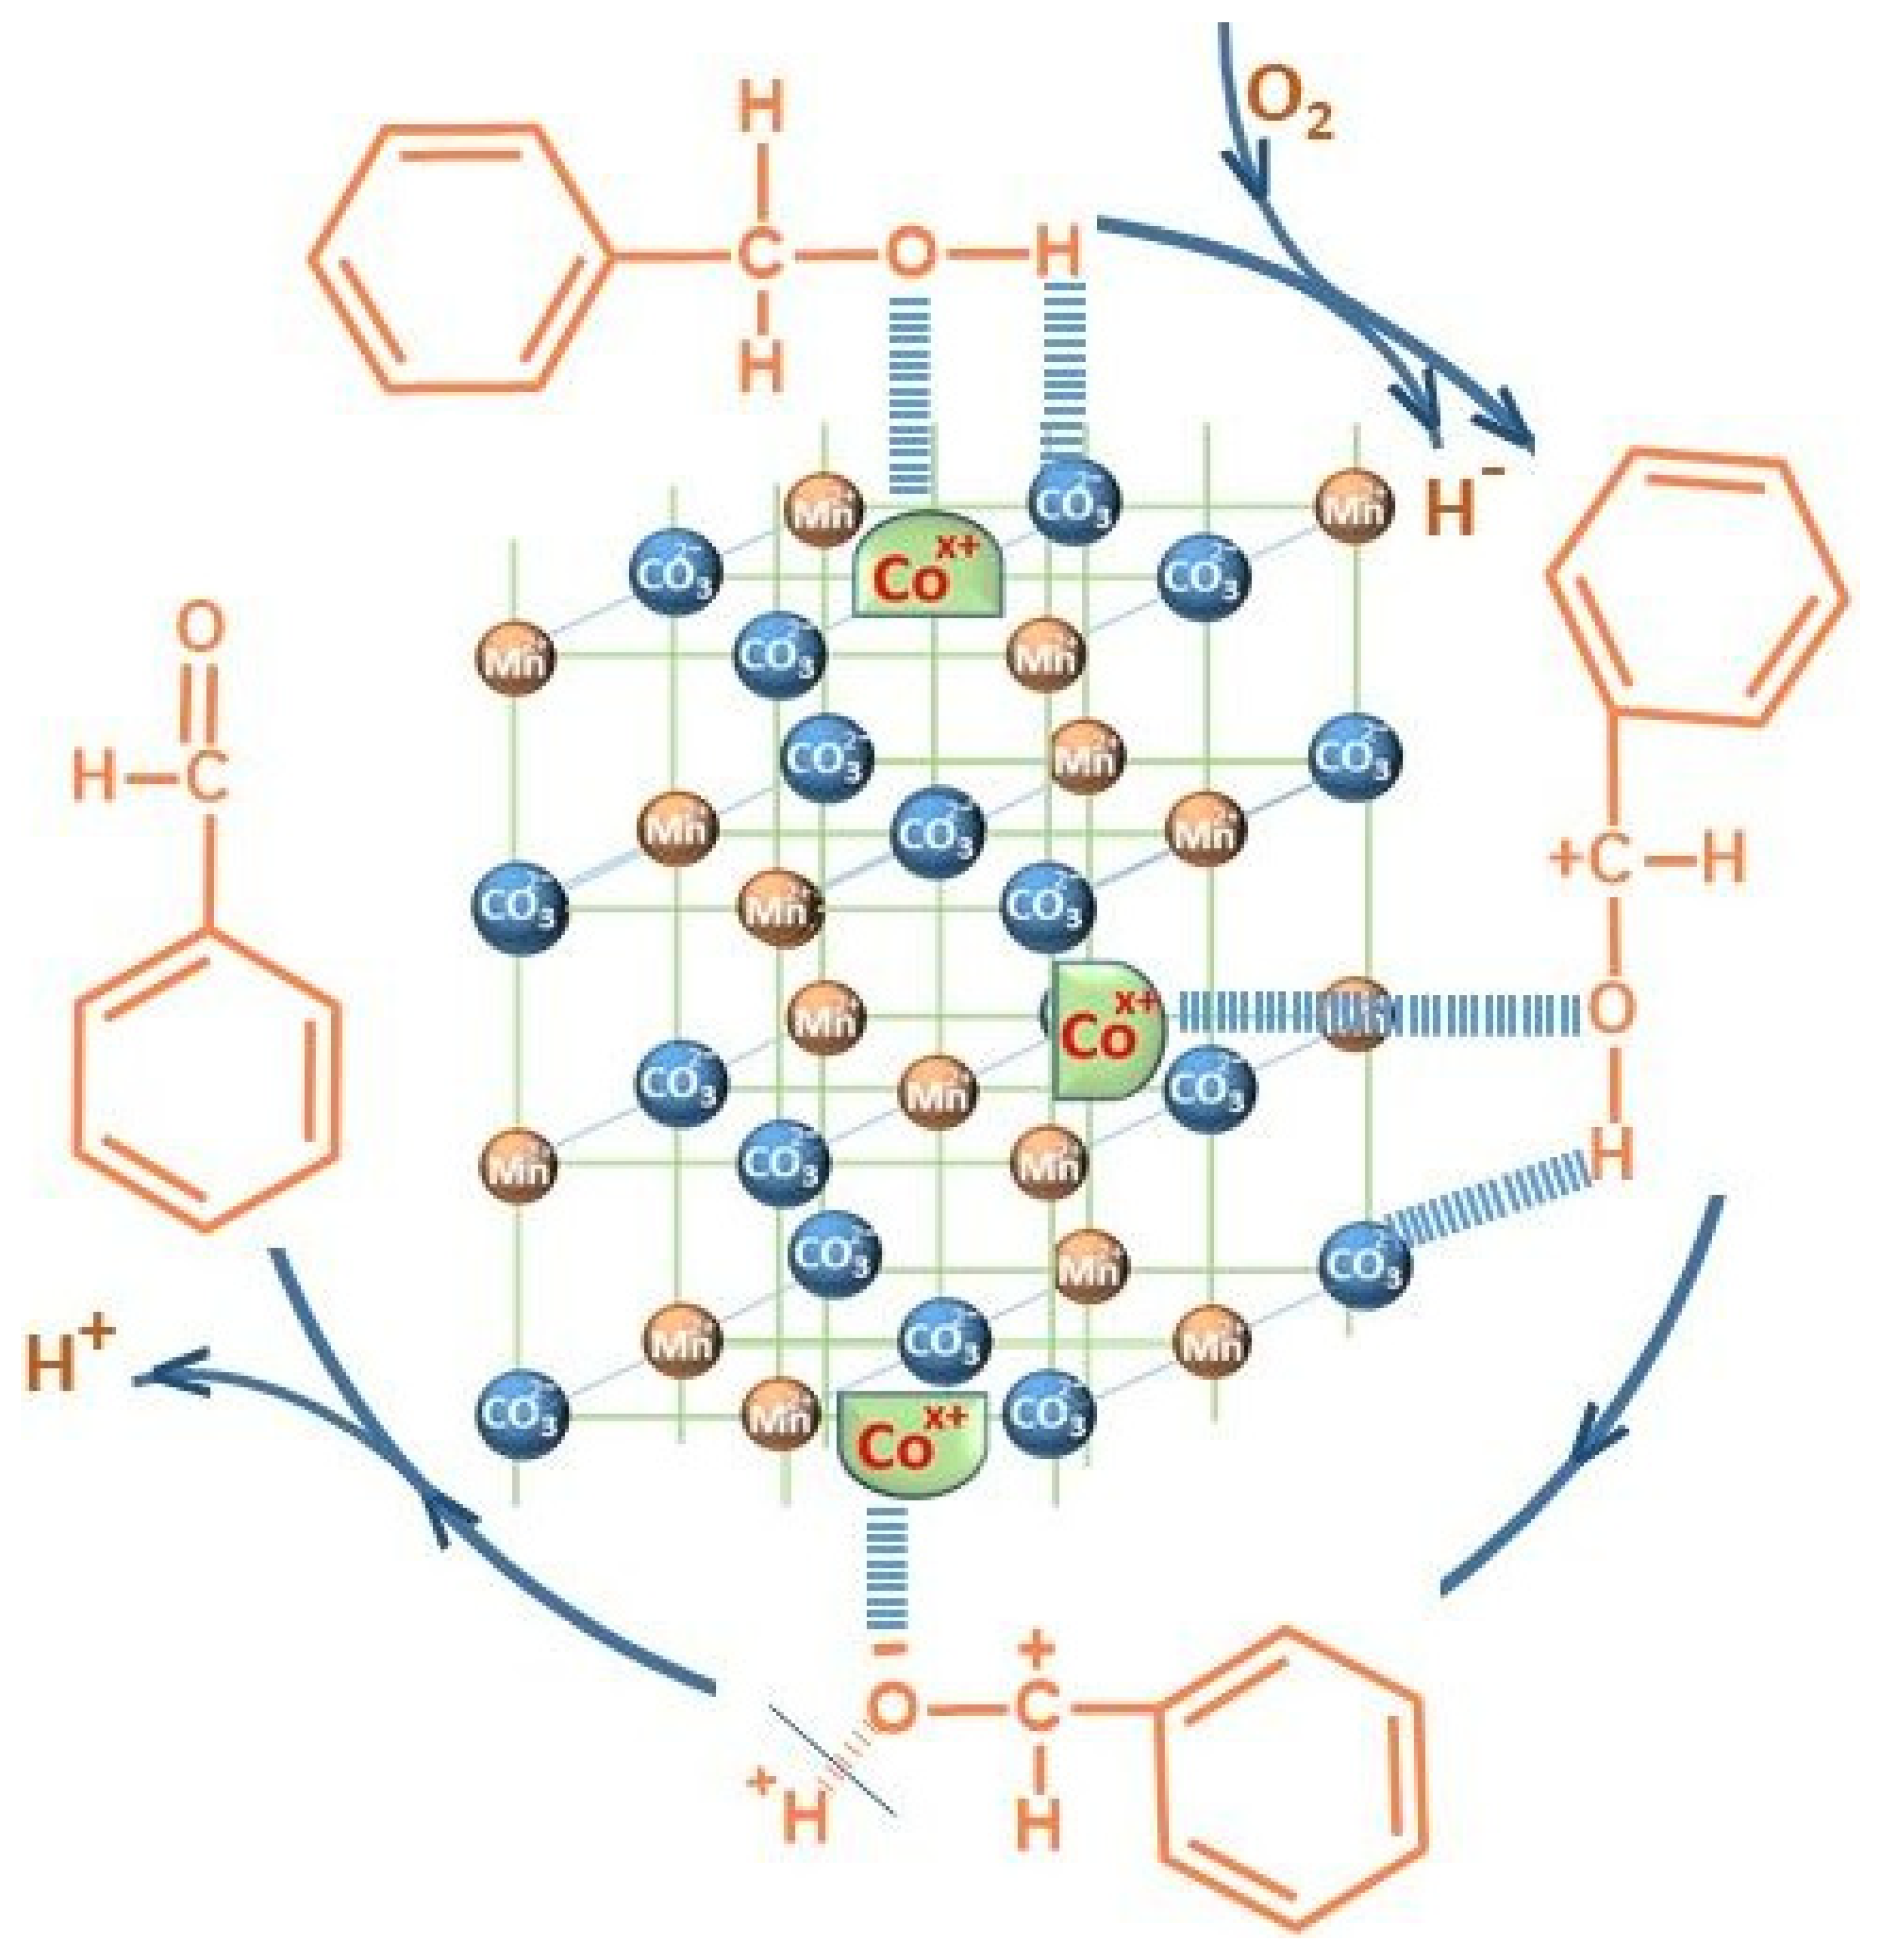
The probable mechanism of the oxidation process by the Mars–van-Krevelen mechanism is depicted in
Figure 10.
3.4. General Applicability of (1%)CoxOy–MnCO3 Catalyst
After optimization of the reaction conditions, these were extended to several types of alcohols (e.g., aromatic, aliphatic, heterocyclic, and allylic alcohols) to show the versatility of (1%)Co
xO
y–MnCO
3 catalyst. The obtained catalytic data are outlined in
Table 6. Interestingly, all primary aromatic alcohols were easily oxidized into their respective aldehydes with 100% conversions within short times using the above-optimized reaction conditions without any detectable overoxidation to acids (Entries 1–19). In addition, superior selectivity to respective aldehydes or ketones (more than 99%) was achieved for any case of alcohol in the present study and no by-products were noticed. The electronic nature of substituents on the benzylic alcohols exhibited a considerable impact on the catalytic performance depending on their ability to donate electrons to the aromatic ring [
47]. It was found that aromatic alcohols possessing electron-releasing substituents were more favorable to the formation of their corresponding aldehydes than electron-withdrawing groups. In this regard, the benzyl alcohol possessing an electron-donating group (e.g., 4-methylbenzyl alcohol), was wholly oxidized to 4-methylbenzaldehyde within 25 min (Entry 3), while, 4-nitrobenzyl alcohol, that bears an electron-withdrawing group, needed a relatively-longer reaction time (45 min) (Entry 12). It was also clearly noticed that the p-substituted aromatic alcohols were completely transformed within relatively shorter reaction times by comparing with the o- and m- positions, possibly because the p-position has less steric hindrance with respect to the other positions [
59]. p-Nitrobenzyl alcohol exhibited 100% conversion within only 45 min (Entry 12), whereas m- and o-nitrobenzyl alcohol were fully transformed after a longer time of 55 and 70 min, respectively (Entries 14 and 16). Also, steric resistance had an explicit impact on the oxidation rate; the bulky substituents (e.g., dicloro, trifluoromethyl, trimethoxy, and pentaflouro) connected to aromatic rings decreased the effectiveness of the catalytic system. This was due to steric hindrance that hindered the oxidation of aromatic alcohols possessing bulky groups (Entries 15,17–19). Heterocyclic alcohols, like furfuryl alcohol, were selectively oxidized to furfural after short time of 95 min (Entry 20). Additionally, allylic alcohols such cinnamyl alcohol were also efficiently converted to cinnamaldehyde with 100% conversion as well as selectivity within 30 min (Entry 21). With respect to the typical secondary aromatic alcohols, complete conversion and selectivity towards corresponding ketones was accomplished (Entries 22–27).
Indeed, compared to aromatic alcohols, the oxidation of aliphatic counterparts is much more complicated under the same circumstances [
60]. However, our catalytic strategy was also found to be efficacious for oxidation of primary aliphatic alcohols. In this context, the oxidation of 5-hexenol, octanol, and citronellol to respective aldehydes occurred over slightly longer periods (Entries 29–31). With respect to secondary aromatic alcohols, the oxidation of secondary aliphatic alcohols into respective ketones showed a relatively lower performance towards this transformation (Entries 32–34). Apparently, it was necessary to increase the time of the reaction, owing to the fact that oxidation of aromatic alcohols is easier than that of their aliphatic counterparts. As predicted, entire oxidation of 1-phenyl-ethanol took place after just 35 min, whereas the total oxidation of 2-octanol took place within a longer time of 250 min (Entries 24 and 34), which confirms that, the as-prepared catalyst’s performance was impacted by electronic and steric variables.

 ,
, 


