1. Introduction
The biodenitrification process (degradation of nitrite and nitrate into gaseous nitrogen) is realized by heterotrophic microbial ecosystems. In the absence of oxygen, such ecosystems use oxidized nitrogen (NO
and/or NO
) instead of oxygen as an electron acceptor while they need an organic carbon source for their growth. Mccarthy [
1] and Payn [
2] described the process of biodenitrification as a respiratory process in which certain bacteria (so-called denitrifying bacteria) use nitrates instead of oxygen as an acceptor of electrons, intended to provide energy for cell activity and the synthesis of new cells. The process generally takes place under conditions called anoxic, i.e., when the dissolved oxygen is replaced by another electron acceptor. From a thermodynamical viewpoint, nitrates are the best acceptor of electrons that can replace oxygen so that they should be considered in the modeling as a limiting compound. Most standard models of microbial growth in laboratory bioreactors, such as the chemostat or the piston flow reactor, take into account the tendency of bacteria to adhere to surfaces and thus form biofilm (cf. [
3,
4]); however, such models neglect the possible diffusion of attached biomass. In reality, the bacterial population consists of cells suspended in the fluid termed planktonic or free cells, and cells adhering to the surface, termed adherent cells. At any time, planktonic cells can adhere to the walls forming biofilms, while adherent cells can detach from the biofilm (due to erosion and sloughing) and move into the planktonic cell compartment. Earlier (see [
5]), we considered a model of the biodenitrification process taking place in a spatially-distributed bioreactor with a single type of bacteria growing on nitrate and that splits into adherent and free bacteria in the liquid, taking all interactions into account. We considered that the growth function
depends only on the nutrient concentration
S following the Monod law:
so the nitrates’ concentration,
, was not considered as a limiting substrate. Generally, in the case of the existence of two limiting substrates, the growth function
can take various forms (see [
6]) depending on the relationship among its nutrients. Among the most frequently used forms, we cite two formulas that are used when the two limiting resources are both essential (i.e., are needed). The first, called the multiplicative formula, is given by:
and the second, called the minimum formula, is given by:
where
are the two limiting substrates and
are respectively the associated half-saturation indices. Charpentier, Ch. et al. [
7] (2008) used a slightly different multiplicative formula. Stewart, H.A. et al. [
8] (2017) compared three dual limitation models (multiplicative, minimum, and Bertolazzi) based on experiments considering two bacteria types, where the growth of the first one is limited by dissolved oxygen and nitrite, whereas the growth of the second by ammonium and nitrite.
In this work, we provide a comparison between the three formulas. We will first study the limit of the model with
given by (
1), by comparing it to the case where nitrates are considered as a limiting substrate; it emerges that this first model remains valid up to a threshold beyond which the results are no longer valid. Currently, the multiplicative model is the most commonly used as it is continuous, smooth, and easy to handle in numerical simulations. We will compare the two Formulas (
3) and (
2), especially in the presence of the diffusion, which pertains to our case, and show, via numerical tests, that (
3) gives better results than others reported in the literature.
In the second section, we recall the mathematical model represented by a non-linear coupled system of four equations, before introducing the hypotheses. In the third section, we give the analysis of the existence of solutions and the approximated problem by a standard finite element method. In the last section, some numerical tests are presented where the advantage of the growth function (
3) is highlighted by comparisons with previous simulations obtained with (
1) and (
2).
2. Mathematical Model
Let
be an open set of
with a regular enough boundary
, which is divided into three parts
,
and
:
We suppose that
contains nitrified water, denitrifying bacteria, and a nutrient. The flow of the nitrified water comes from
and goes through
; we assume that the flow is permanent with a velocity
. The impermeable part of the boundary is
. In the reactor, the bacteria will be divided into two categories: those that adhere to the walls of the reactor to form a biofilm, which is assumed to be a monolayer, and those that remain mobile and free in the medium, called planktonic cells. For a given
T, let the space-time domain defined by:
We denote by
the density of the mobile bacteria and by
the surface density of bacteria adhering to the walls, with a maximum value denoted by
. The proportion of the occupation of the wall is a number between zero and one defined by the ratio:
The function
is the growth rate of
, for
, and
S is the concentration of the limiting substrate. According to [
5], the equation modeling the evolution of adherent bacteria is given by:
where:
denotes the adherent bacteria mortality rate;
denotes a term corresponding to the detachment rate from the wall.
A portion of the mobile category can attach to the walls with a certain rate that is denoted by .
denotes the proportion of daughter cells of the fixed bacteria able to find a place to attach onto the wall, the remainders being washed out by the liquid flow (cf. [
9]).
is the coefficient of conversion of the volume density to the surface density.
For the mobile bacteria, the equation modeling their evolution according to [
5] is given by:
where
denotes the free bacteria mortality rate.
The degradation of the nutrient
S and of the contaminant
is governed by the equations (cf. [
10,
11]):
where:
, for , is respectively the coefficient rate of yield of mobile and fixed bacteria, defined as the ratio of the bacterial mass produced (in g or mol) by the mass of the substrate consumed (in g or mol),
R is the rate of the degradation of nitrates.
We will give now some comments about the coefficients
G and
for
. According to the form considered by Freter ([
9,
12]), let:
where
a is a small positive number.
The most used expression for the growth rate is the Monod law [
13] given by (
1). In the present work, we take into account the fact that the bacteria need both carbon and nitrate to grow. We consider the growth rates depending on two limiting nutrients
S and
according to the Formulas (
3) and (
2). Equations (
4)–(
7) are now considered with the growth rates
, for
, given in (
2) for the analysis part. In the numerical simulations, we consider a comparison between the Formulas (
3) and (
2).
The functions
G and
in (
1) and (
2) satisfy the following hypothesis:
Hypothesis 1. The growth rate of bacteria for satisfies: Hypothesis 2. The function G satisfies: The rate of change of concentrations due to diffusion is represented by terms of the form
, where
c is the concentration or density and
D is the diffusion coefficient. The transport is represented by terms of the form
, where
is the velocity. We obtain a system of four equations, defined in
. The first one is a reaction-diffusion equation, and the others are reaction-convection-diffusion equations in which the transport velocity is
. Equations (
4)–(
7) become in the time-space variables:
In order to describe the time evolution of the variables
,
,
S, and
completely, we have to specify the behavior of these variables on the boundary of the domain. Let
be the outward normal vector to the boundary
. By the definition of fixed bacteria, there is no flux across the entire boundary of the domain:
In order to maintain the growth of the bacteria, we continuously inject from
the substrate with the density
. The boundary conditions used on
, which models flow continuity, assuming that the concentrations are uniform outside, are Robin’s type, also called Danckwerts [
14]:
At the output, the flow of
S is uniform, and the condition on
is then given by:
On the impervious part
, it is natural to consider:
For
, similar reasoning leads to the following boundary conditions:
The nitrified water contained in
comes from
with a velocity flow
and is withdrawn with the same flow from the part
of the boundary. The concentration of nitrates thus verifies the following boundary conditions:
To close this system, we define the initial conditions. At
, the domain
contains nitrified water with an initial density
, planktonic bacteria with a density
, adherent bacteria with a density
, and a carbon source with an initial density
4. Numerical Tests
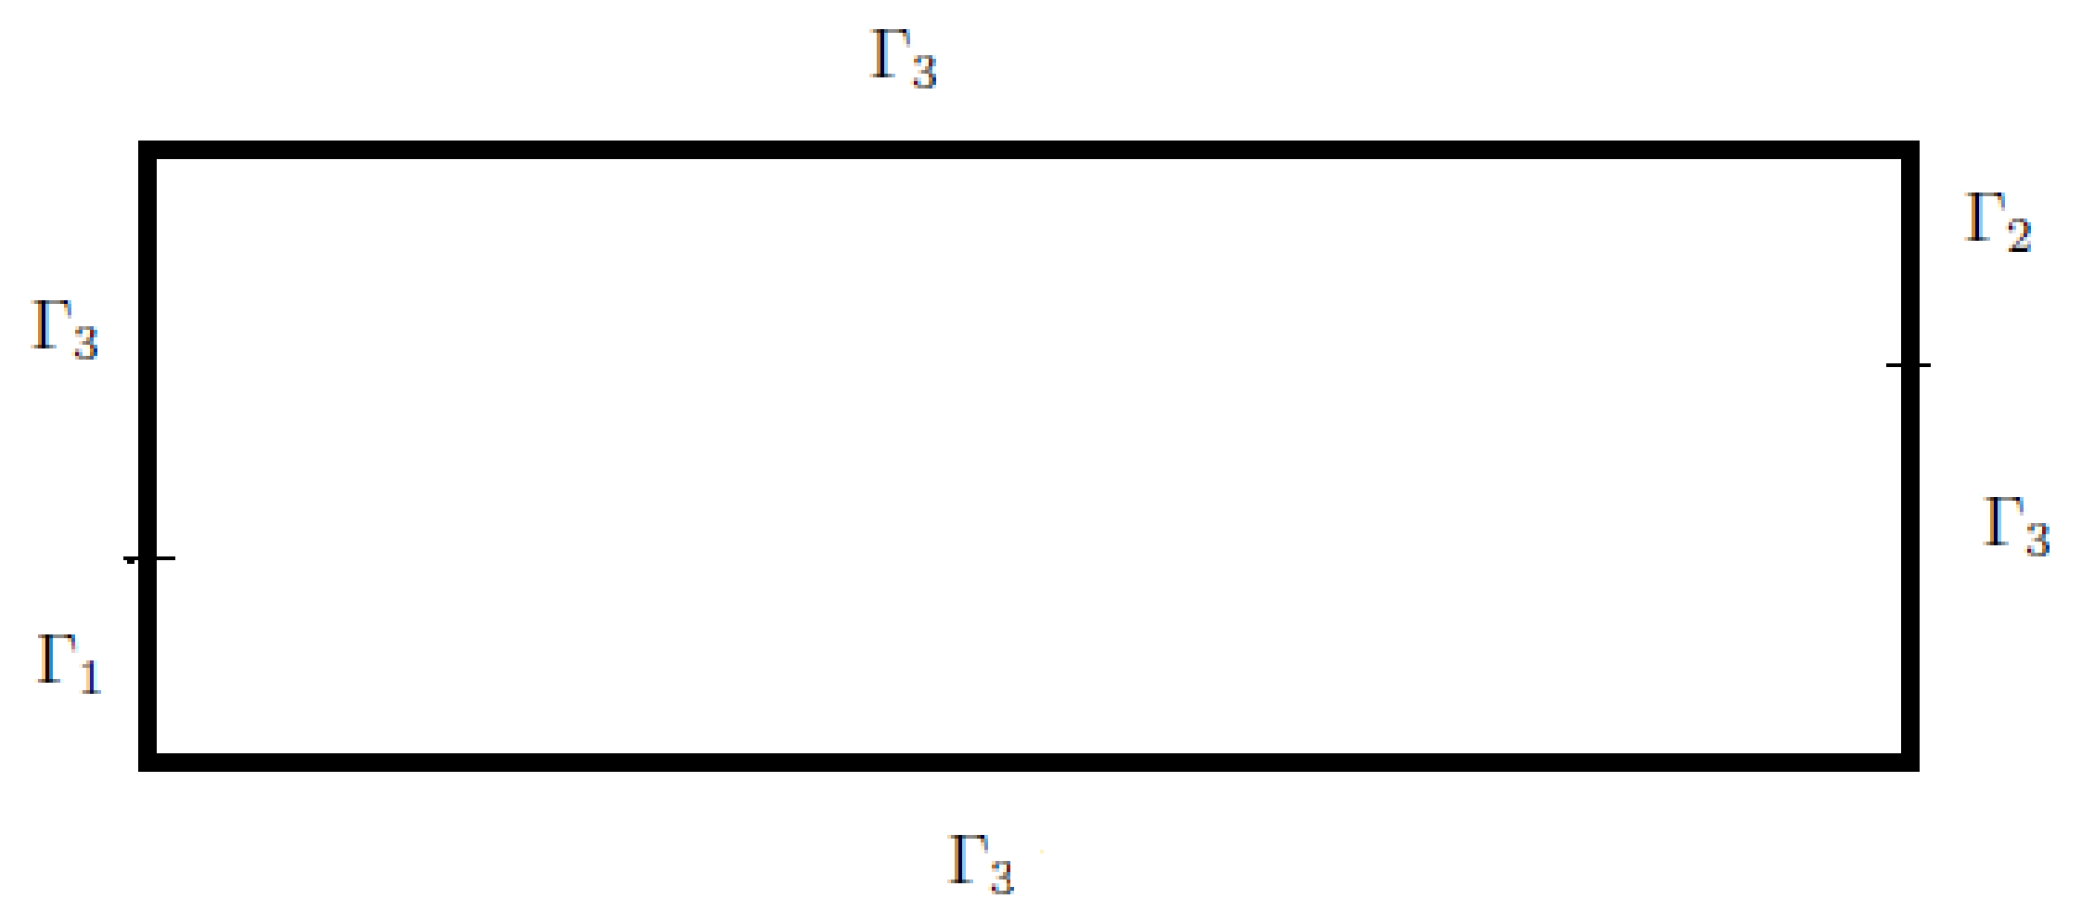
In this section, we consider a domain
defined by
,
and
(see
Figure 1).
We assume that
is a porous medium, hereafter denoted the “reactor”
, into which we inject some water containing nutrients, sources of both nitrate and a carbon with concentrations
and
, respectively. In this case, the flow in
is governed by Darcy’s equation, given in its mixed form by the system: find
with
on
such that:
where
and
,
K is the hydraulic conductivity of the medium,
is the given flux on
, and
is the given pressure on
. This problem will be approximated by the mixed finite element method of Raviart–Thomas with the lowest order (see [
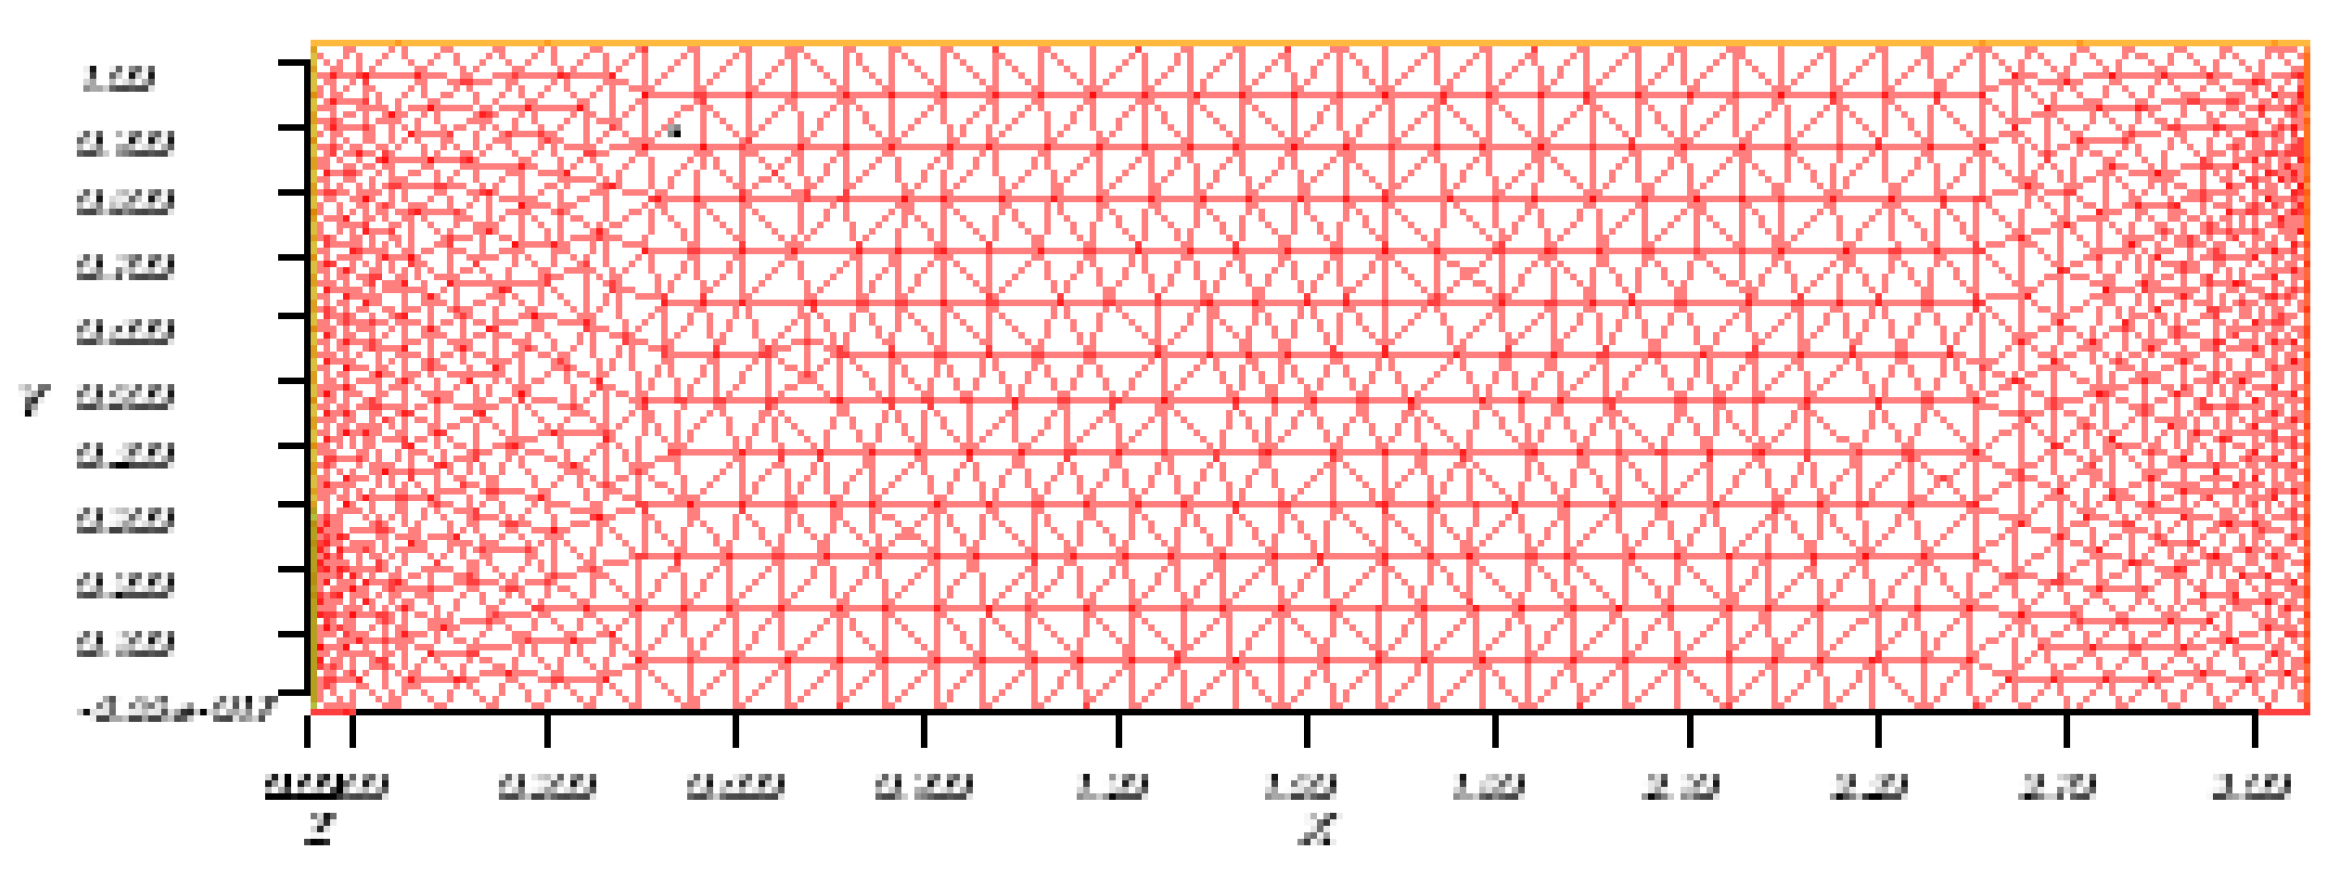
18]). The resolution of this system gives the velocity
, which is needed to resolve our system (
37). All the resolutions will be done with the FreeFem ++ software [
19] with the mesh of
Figure 2 and the curves drawn using MATLAB.
We consider the initial data given in [
20] and the parameters of the system (
22) given in [
7]. These parameters are summarized in
Table 1.
The hydraulic conductivity changes due to the evolution of the fixed bacteria. We use the following relation, given in [
21], to describe the evolution of the hydraulic conductivity with respect to this evolution:
where
is the initial conductivity and
is a given parameter. At the first time step, we resolve the system (
38) with
, which gives the first velocity
, and then, the system (
37) to obtain
. Then, at each subsequent time step
, for
, the algorithm is as follows: given
, we resolve the system (
38) with
to obtain the new velocity, and we resolve the system (
37) to obtain
, until
.
We call Models 1, 2, and 3 the models defined with the functions (
1), (
2), and (
3), respectively, and we give some comparison between these models. Using growth function (
1), which is dependent only on carbon as in [
5], can give rise to problems for some situations. For example, in the case where
, we come across negative values of the nitrate concentration, which is nonsense.
Figure 3 and
Figure 4 give the evolution of the concentrations obtained with Models 1 and 2, near
and
, respectively. In both sides of the reactor, the concentration of nitrate becomes negative for Model 1, while it remains positive for Model 2. Model 3 also gives a non-negative concentration for
.
In
Figure 5, we plot the concentrations for Models 2 and 3 near
for
: for both models, the concentration of nitrate remains positive. These foregoing conclusions also hold for small values of
, as we can see in
Figure 6, which represents the evolution of the concentrations of nitrate and carbon near
with
, for all three models.
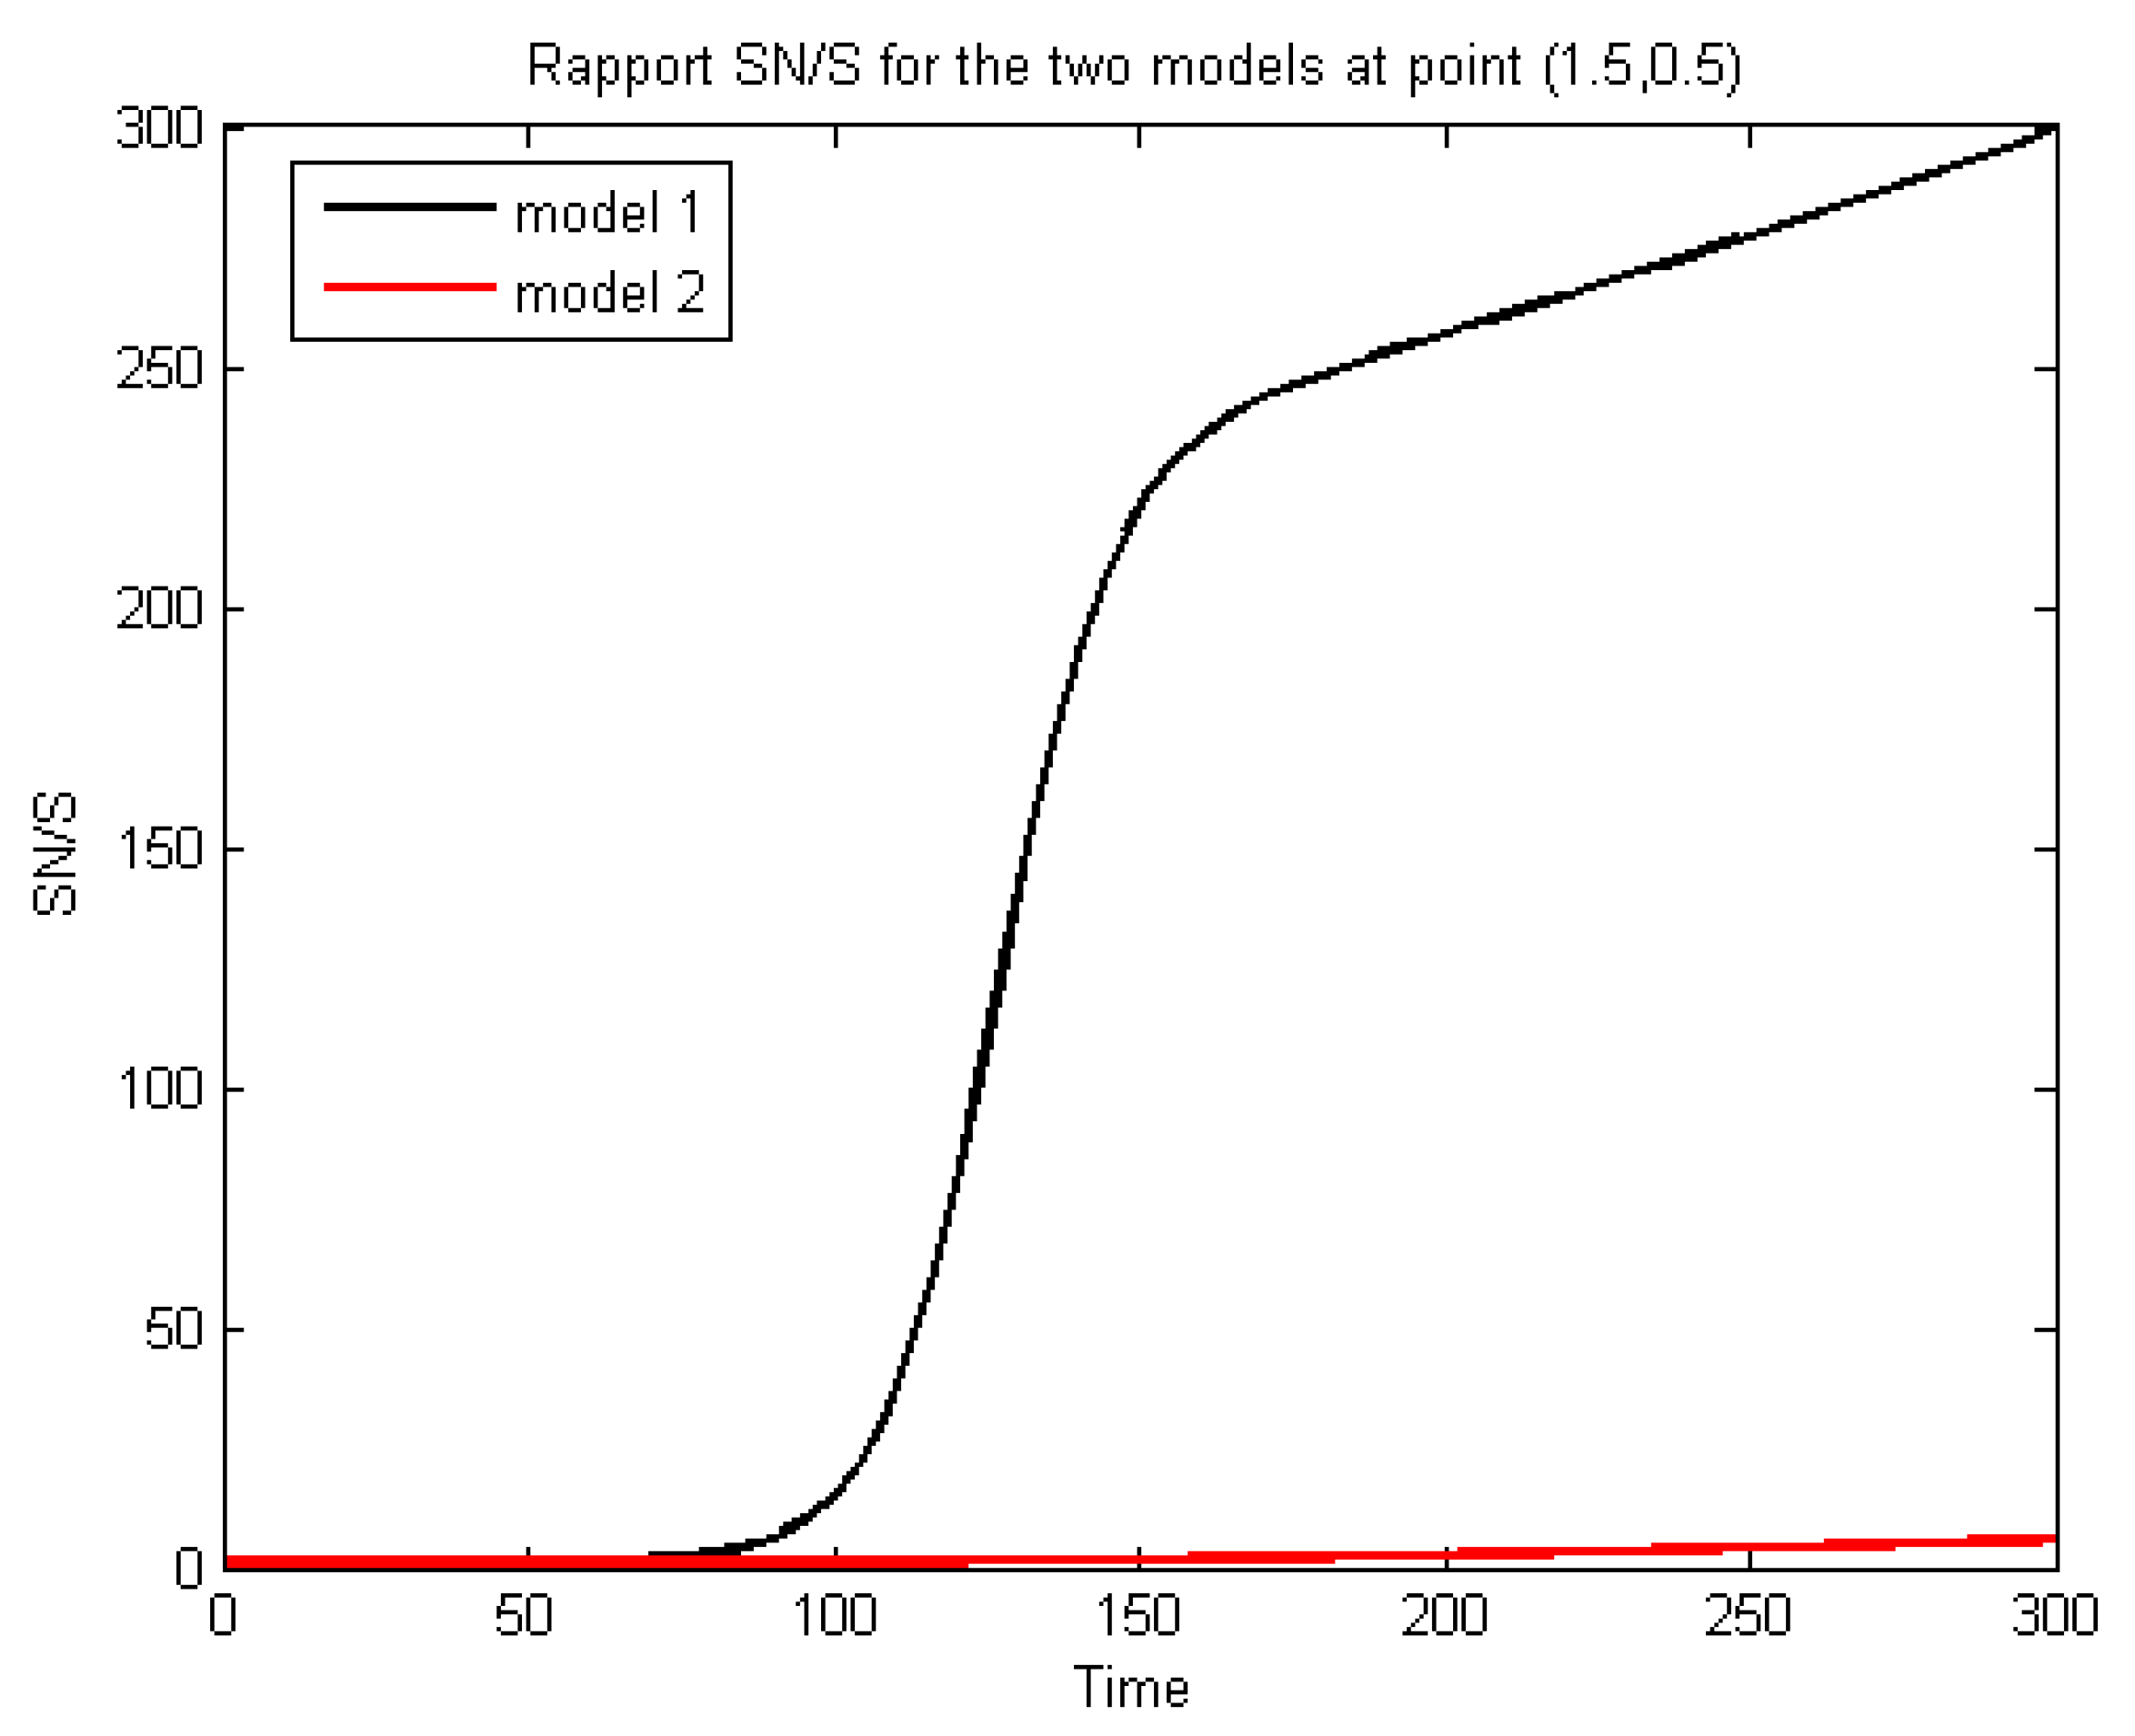
In addition, it was shown in [
22] that the ratio between the carbon used and the nitrate degraded remains constant throughout the experiment. In the curve representing
with respect to
S given in
Figure 7, this conclusion is satisfied for Model 2, but not for Model 1, at least after about 80 days. We conclude that the domain of validity of Model 1 is more reduced than that of Model 2 or Model 3.
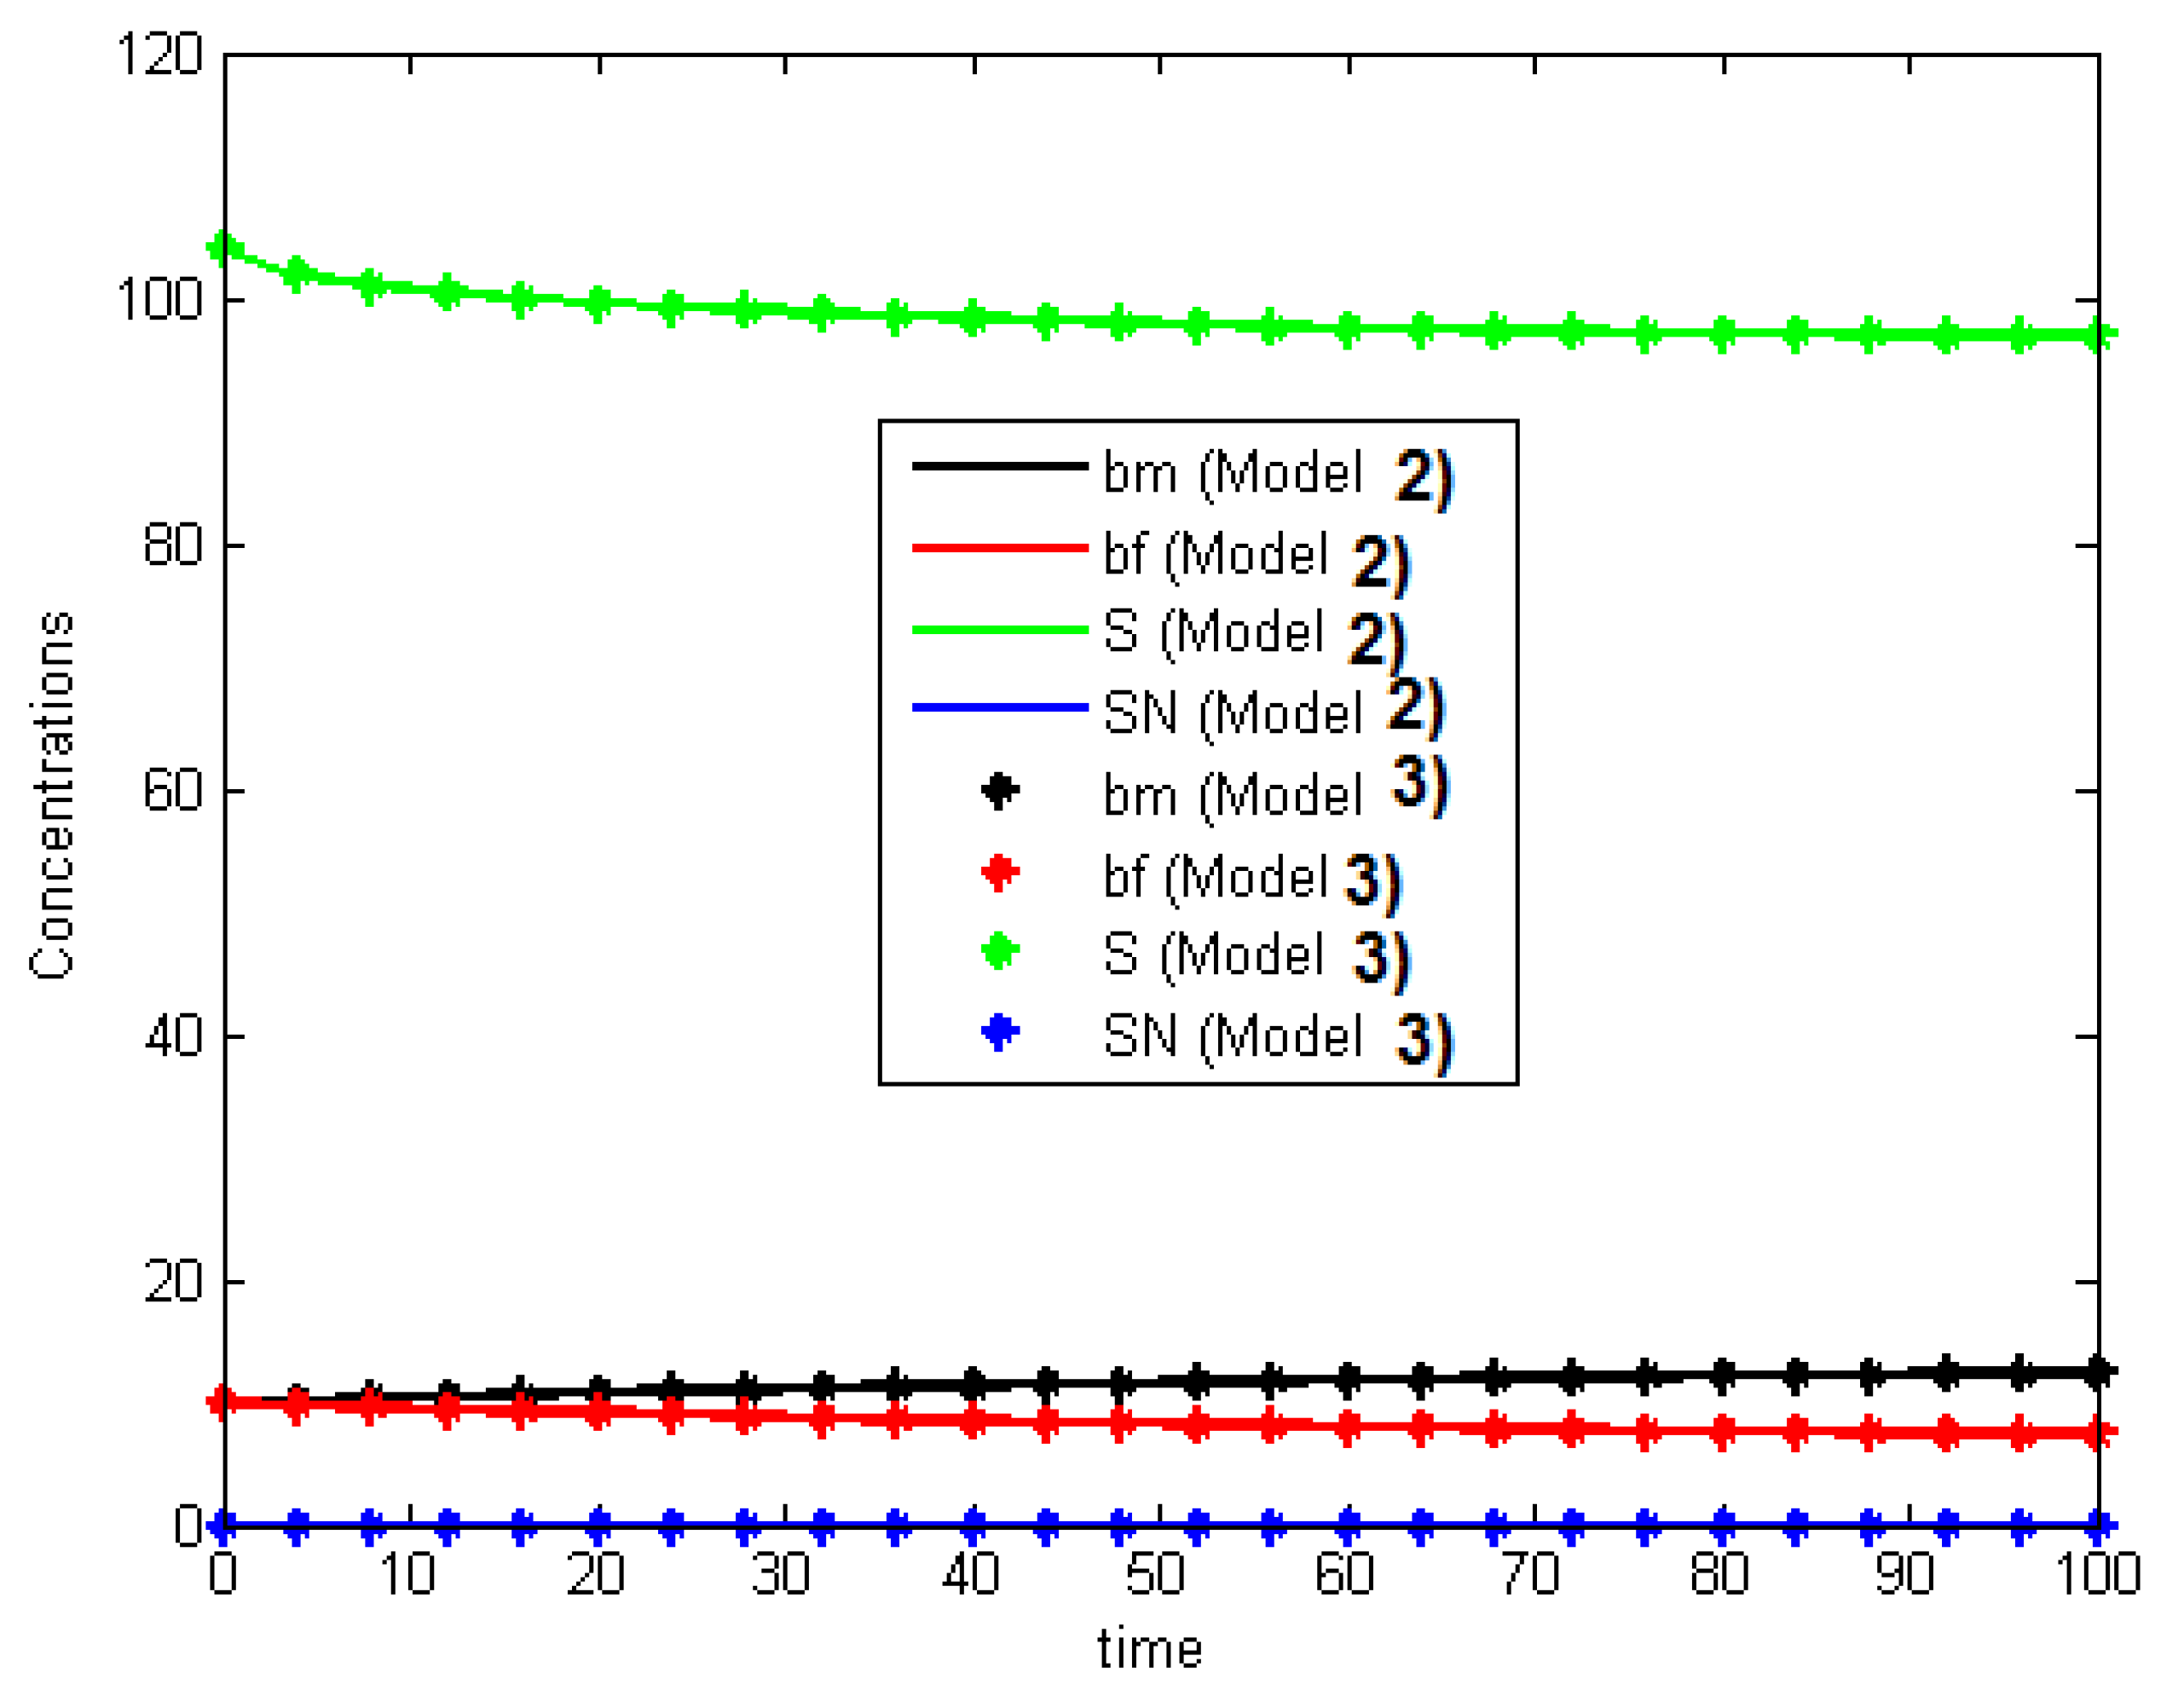
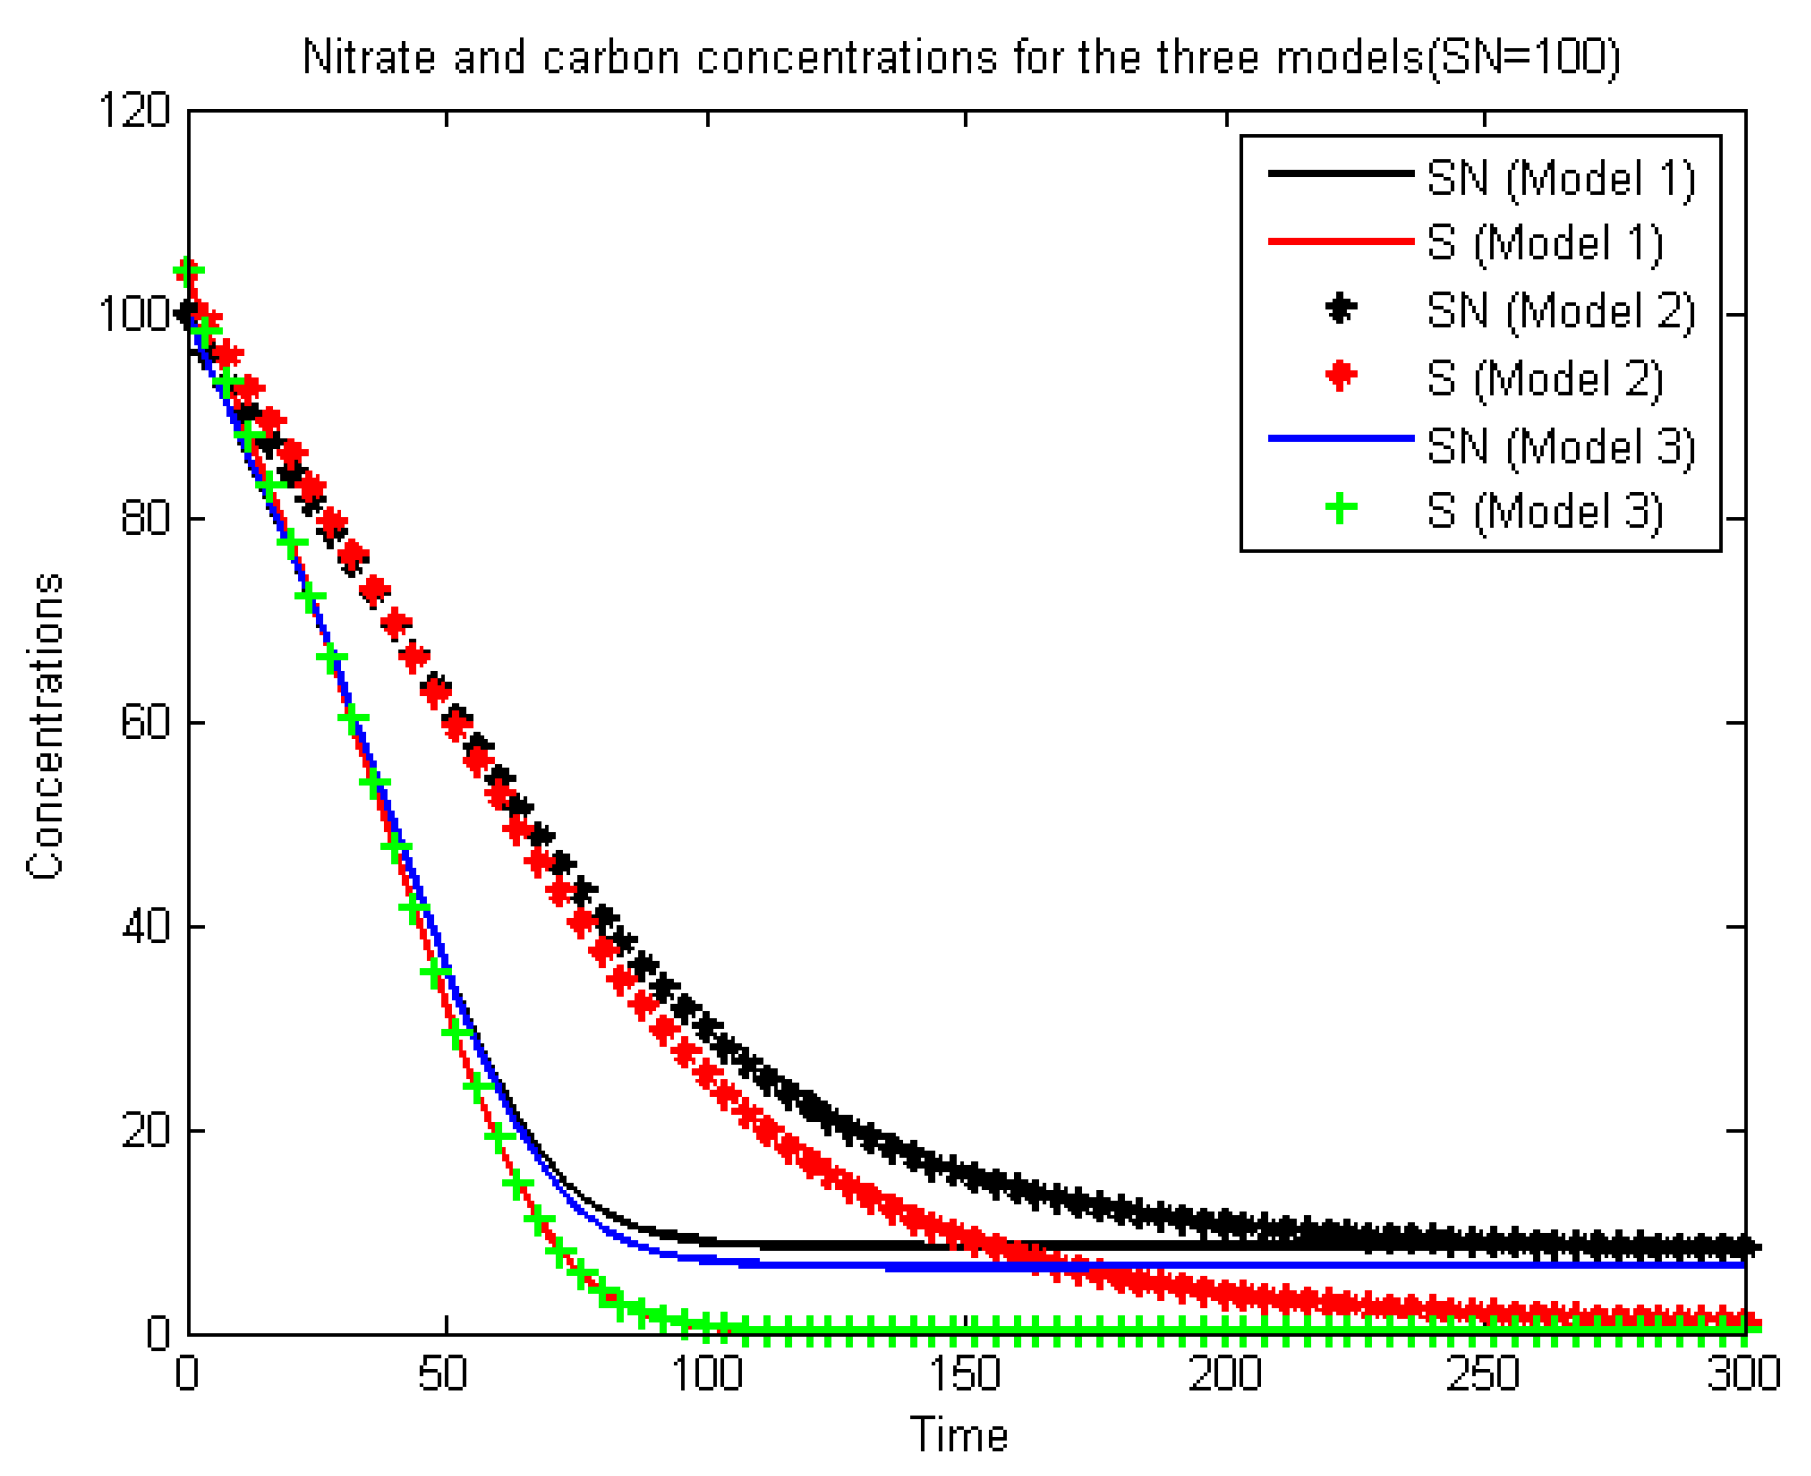
We will now consider a larger
than in the previous cases. The simulations of the evolution of the concentrations of the four components—the nitrate, the nutrient, the free, and the adherent—at the point (1.5,0.5) with
days, are represented in
Figure 8 for Models 1 and 2. We observe that the results achieved using Model 1 better agree qualitatively with the experimental results given by Chevron [
20] (see Figure 25 and page 104) compared to the other two models. Specifically, the percentage of nitrate removal stabilizes by 95 percent in 80 days of reactor operation. Indeed,
Figure 8 shows that, in Model 1, ninety percent of nitrates are removed in about 80 days, whereas Model 2 seems to be less consistent with these experimental results and would need additional parameter calibration. The comparison between the concentrations of nitrate and carbon for the three models is given in
Figure 9.
We observe that Model 1 and Model 3 concur with the experimental results. From all these observations, we can posit that the growth function (
3) (the minimum formula) seems to be more suitable for our problem than (
1) and (
2). We explain the fact that Model 1 also gives good results by the fact that when
is large enough, it prevents the nitrate from becoming negative, giving:
while small
gives a negative concentration because:
In [
8], for another problem, the authors gave a comparison between three formulas, including the minimum and multiplicative formulas, and found that the minimum formula concurs better with the experimental results. In the literature, the Formulas (
3) and (
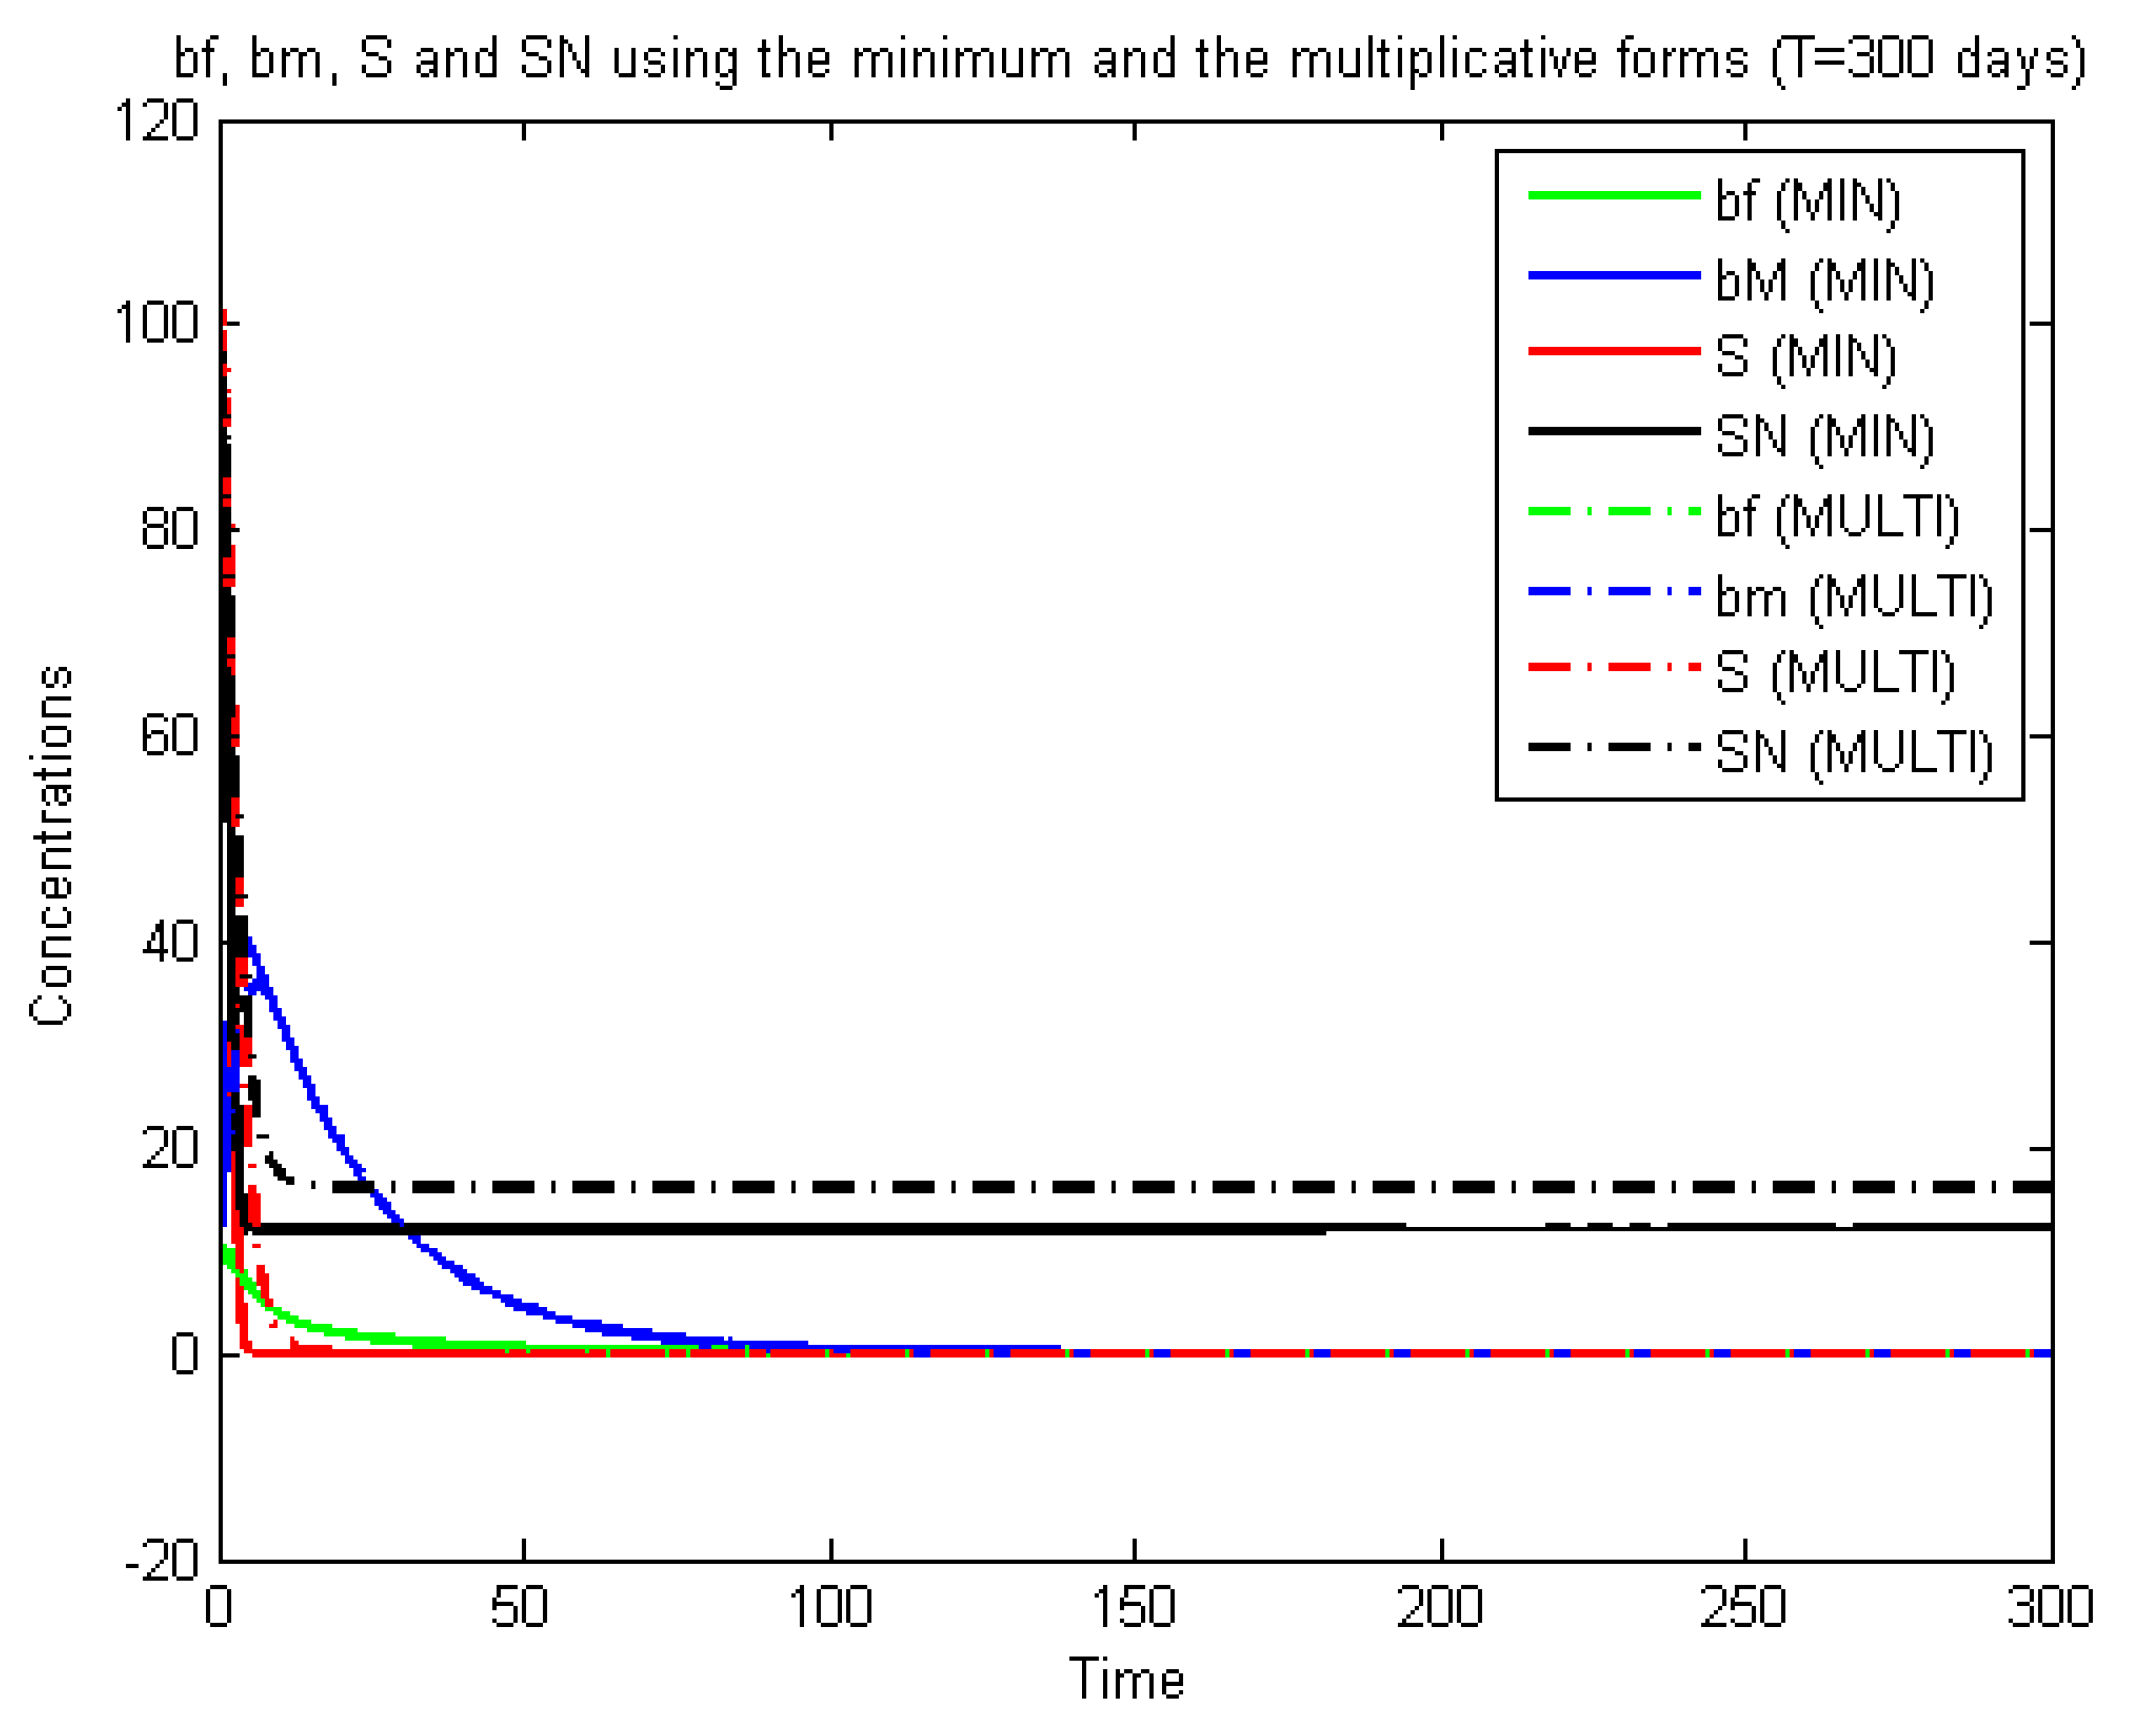
2) are generally presented as equivalent. If we consider the system (
22) with only the reaction terms, i.e., the non-spatialized model, which is a system of Ordinary Differential Equations (ODE), we notice that these formulas do indeed give equivalent results, as can be seen in
Figure 10 and
Figure 11.
These last figures are obtained using a Runge–Kutta scheme for ODE. The difference between the two cases is found mainly at the start of the calculations (first five days). Furthermore, it can be seen that the nitrate elimination rate stabilizes at 75%, which is a long way from the experimental results. We conclude that: firstly, the introduction into the equation of the diffusion and transport gives a more realistic model, and secondly, Formula (
3) is better than (
2) (as mentioned above). This can be explained by the fact that (
2) can create a numerical (not physical) diffusion, as shown in
Figure 8 and
Figure 9.


