Article

A Numerical Investigation on the Optimization of Uneven Flow in a Marine De-SOx Scrubber

College of Power and Energy Engineering, Harbin Engineering University, Harbin 150001, China
*
Author to whom correspondence should be addressed.
Processes 2020, 8(7), 862; https://doi.org/10.3390/pr8070862
Submission received: 1 July 2020 / Revised: 14 July 2020 / Accepted: 15 July 2020 / Published: 17 July 2020
(This article belongs to the Special Issue Advanced Liquid Waste and Gas Waste Treatment Processes)

Abstract

:
According to regulations from the International Maritime Organization (IMO), the sulfur content of vessels must not exceed 0.5% outside the Emission Control Areas (ECAs) starting from 2020. The marine exhaust gas desulfurization (De-SOx) system is the most feasible technology to meet the increasing regulations, but there is always a large swirl at the bottom of the scrubber causing uneven flow past the sprays. Solving this problem by adjusting the spray is a feasible method. The exhaust gas at 485 K and injection liquid at 305 K are simulated to optimize the flow field in a De-SOx scrubber. The results indicated that the flue gas was easily concentrated in the left side area of the scrubber and this part of hot gas could escape from the scrubber. By controlling the nozzles distribution and the nozzles angle, it was possible to reduce the droplets to hit the wall and improve the utilization rate of the washing liquid. The nozzles were arranged up and down in different positions, which reduced the escape amount of exhaust gas in the strong offset area. The new arrangement of nozzles made the flow field distribution inside the scrubber more uniform and increased the gas–liquid reaction time Although the pressure drop under outermost nozzles 45° injection was smaller than the vertical injection, the flow field under 45° injection became more complex and the outlet gas velocity became larger.

Graphical Abstract

1. Introduction

With the rapid development of the modern economy, the problem of environmental pollution has become increasingly serious especially air pollution [1,2]. The harm caused by air pollution has caused widespread concern in countries and international organizations around the world. The total tonnage of goods transported by sea worldwide increased from 8 billion tons in 2009 to 12 billion tons in 2019 and is expected to increase to 20 billion tons by 2025. Among the ship’s exhaust pollutants, sulfur oxides (SOx) are one of the main acid gases that cause atmospheric pollution [3,4].
According to International Maritime Organization (IMO) regulations, the sulfur content of vessels must not exceed 0.5% outside the SOx ECAs starting from 2020. The environmental and health issues caused by SOx emissions from ships had caused widespread concern in the international community [5,6]. The two methods recommended by the IMO for solving the excessive SOx content in the exhaust of ships are mainly the use of low sulfur fuel and the use of exhaust gas after-treatment devices in the SOx ECAs [7,8].
Exhaust gas scrubbing desulfurization technology is currently a mature technology for controlling SOx emissions and had been widely used in power stations and industrial fields [9,10]. The application of Flue Gas Desulphurization (FGD) technology is relatively mature [11,12]. This technology relies on adding alkaline substances to the absorption liquid to neutralize the acidic gas SOx in the exhaust gas [13]. The ship exhaust gas washing system is mainly based on the FGD technology of the power station. The practice has proved that FGD technology is feasible for ships. More and more companies are starting to study the ship’s exhaust gas scrubbing desulfurization system. Moreover, the marine scrubbing system mainly uses wet scrubbing technology due to the particularity of the ship’s power plant [14,15].
MAN B&W has devoted its research to developing the ship dry scrubber desulfurization system but had also made progress in wet scrubber desulfurization technology. The marine Exhaust Gas Recirculation (EGR) washing system developed by MAN B&W Company combines the EGR system and the closed-loop scrubber system to simultaneously reduce the harmful substances such as nitrogen oxides (NOx), SOx, and particulate matter (PM).
In 2012, Shell Global Solutions Institute studied several desulfurization technologies including the seawater method, and the freshwater–sodium hydroxide method from the perspective of energy consumption and greenhouse gas emissions. The exhaust gas aftertreatment technology was superior to low sulfur fuel [16]. In the same year, the fresh water closed desulfurization system developed by Wärtsilä was applied to 8 ships produced by Algoma Central. The first ship Algoma Equinox was launched in December 2012. Furthermore, Wärtsilä [17] studied the effect of ship exhaust gas washing system on the removal of ship pollutants. The experimental results showed that the removal efficiency of SO2 and PM were about 100% and 64%, respectively.
In 2013, Caiazzo et al. [18] conducted an experiment on a marine diesel engine exhaust gas desulfurization (De-SOx) scrubber system based on the seawater method. The exhaust gas flow rate, seawater flow rate, and SO2 concentration were used as variables to compare and analyze the desulfurization efficiency of seawater and distilled water. The results showed that the desulfurization effect of seawater washing was better than the freshwater system. Besides, increasing the flow of washing liquid and the residence time of exhaust gas could increase the desulfurization efficiency of up to 93%. In 2014, Wu et al. [19] reported a new marine diesel engine seawater SOx exhaust gas purification system and proposed to introduce carbonate ions and hydrogen ions in seawater into the system to participate in the desulfurization reaction. The experiment of emissions characteristics showed that the desulfurization efficiency can reach 88%.
In 2015, Jenkins [20] disclosed a marine exhaust gas washing device by highlighting the technical characteristics of the developed SOx scrubber. The new device was equipped with a venturi pre-processor, a defogger, and a waste liquid receiver, which could meet the gas treatment requirements. In 2016, Königsson [21] proposed the use of EGR technology combined with SOx scrubber technology to reduce SOx and NOx. This technology was equipped with a wash water circulation tank and an exhaust gas recirculation scrubber.
The vortex scrubber launched by Clean Marine Company increases the probability of collision between droplets in the exhaust gas and thus the scrubber efficiency. At the same time, the strong eddy current could separate the droplets in the exhaust gas and increase the demisting efficiency [22]. Clean Marine received requests to install the vortex scrubber system on six ships from Hyundai Mipo in South Korea and Hudong Zhonghua Shipbuilding Company in 2014.
In 2017, the marine Exhaust Gas Cleaning System (EGCS) independently developed by Harbin Engineering University successfully passed the type certification of China Classification Society. It is the first exhaust gas wet scrubber system in Asia that was approved by the classification society [23].
On 19 September 2018, PANASIA of South Korea signed a contract for the installation of a desulfurization system for MSC shipowners in Shanghai with the China Shipbuilding Industry Trading Company (CSTC). The project had a total of 29 large container ships and was currently the world’s largest installed desulfurization system. The total contract value was as high as 150 million US dollars, which has been delivered successively since April 2019.
Computational Fluid Dynamics (CFD) has become a powerful tool for studying complex fluid dynamics in the De-SOx scrubber [24,25,26]. Kumaresh S. simulated the flow fields inside the scrubber using ANSYS software based on governing equations to obtain optimum design of the system. The exhaust gases were assumed to be air because the problem can be approached in ease and convenient way reducing the complexity [27]. Besides, it is difficult for the nozzles to avoid some droplets impinging on the scrubber wall.
The main objective of this paper lies in examining the flow characteristics and spray behavior in the De-SOx scrubber to optimize the efficiency of the EGCS. In a marine De-SOx scrubber, the high-speed exhaust gas is more concentrated on one side of the scrubber and some flue gas even escapes the scrubber without a sufficient reaction. There is a large swirl at the bottom of the scrubber causing uneven flow past the lower sprays. Solving this problem by adjusting the spray is a feasible method. By using the CFD numerical analysis, the optimum De-SOx scrubber design can be elected for marine emission control in real case problems. Therefore, this study aims to further optimize the flow physics in the scrubber by using CFD simulation. An effective 3D simulation model of the scrubber was established (Section 2) and the evaporation and flow characteristics of the water droplets in the De-SOx scrubber were simulated (Section 3). By controlling the nozzles distribution and the nozzles angle, it was possible to reduce the droplets to hit the wall as much as possible and improve the utilization rate of the washing liquid (Section 3).

2. Model Description

2.1. Governing Equations

The CFD simulation is accomplished by the commercial software. The mass, momentum, and energy conservation equations are,
ρ t + ( ρ u ) = S m
t ( ρ u ) + ( ρ u u ) = p + ( τ ¯ ¯ ) + ρ g + F
t ( ρ E ) + ( u ( ρ E + p ) ) = ( k e f f T h t J + ( τ ¯ ¯ e f f u ) ) + S h
where Sm denotes the source term of discrete phase acting on continuous phase. In momentum Equation (2), p is the static pressure; τ ¯ ¯ indicates the stress tensor; ρ is density; ρ g is the gravity force; F represents the external force; In energy Equation (3), keff refers to the actual heat transfer coefficient considering the effect of turbulence; J is called as the diffusion flux; Sh refers to the heat including chemical reaction.
Ideal gas law is,
p V = m R T
where T represents the gas temperature; m is the mass; V denotes the gas volume; R is the gas constant.
The standard k-ε turbulence model is used in the De-SOx scrubber model. The k equation and ε equation are:
ρ D k D t = x i [ ( μ + μ t σ k ) k x i ] + G k + G b ρ ε Y M , μ t = ρ C μ k 2 ε
ρ D ε D t = x i [ ( μ + μ t σ k ) ε x i ] + C 1 ε ε k ( G k + C 3 ε G b ) C 2 ε ρ ε 2 k
where Gk is the turbulent flow energy due to the average velocity gradient; Gb is the term of turbulent kinetic energy due to buoyancy; ρ is density; YM represents the contribution of pulsating expansion in compressible turbulence; μt represents the turbulent viscosity; C, C, C, and Cμ are constants.
The pressure drop model uses the Kozeny-Carman (KC) model. KC equation is the famous formula in porous media field. The KC equation [28] relates the permeability K to porosity φ by
K = ϕ 3 k ( 1 ϕ ) 2 S 2 = ϕ 3 36 k ( 1 ϕ ) 2 d 2
where k is the KC constant; d represents average diameter of the particles.

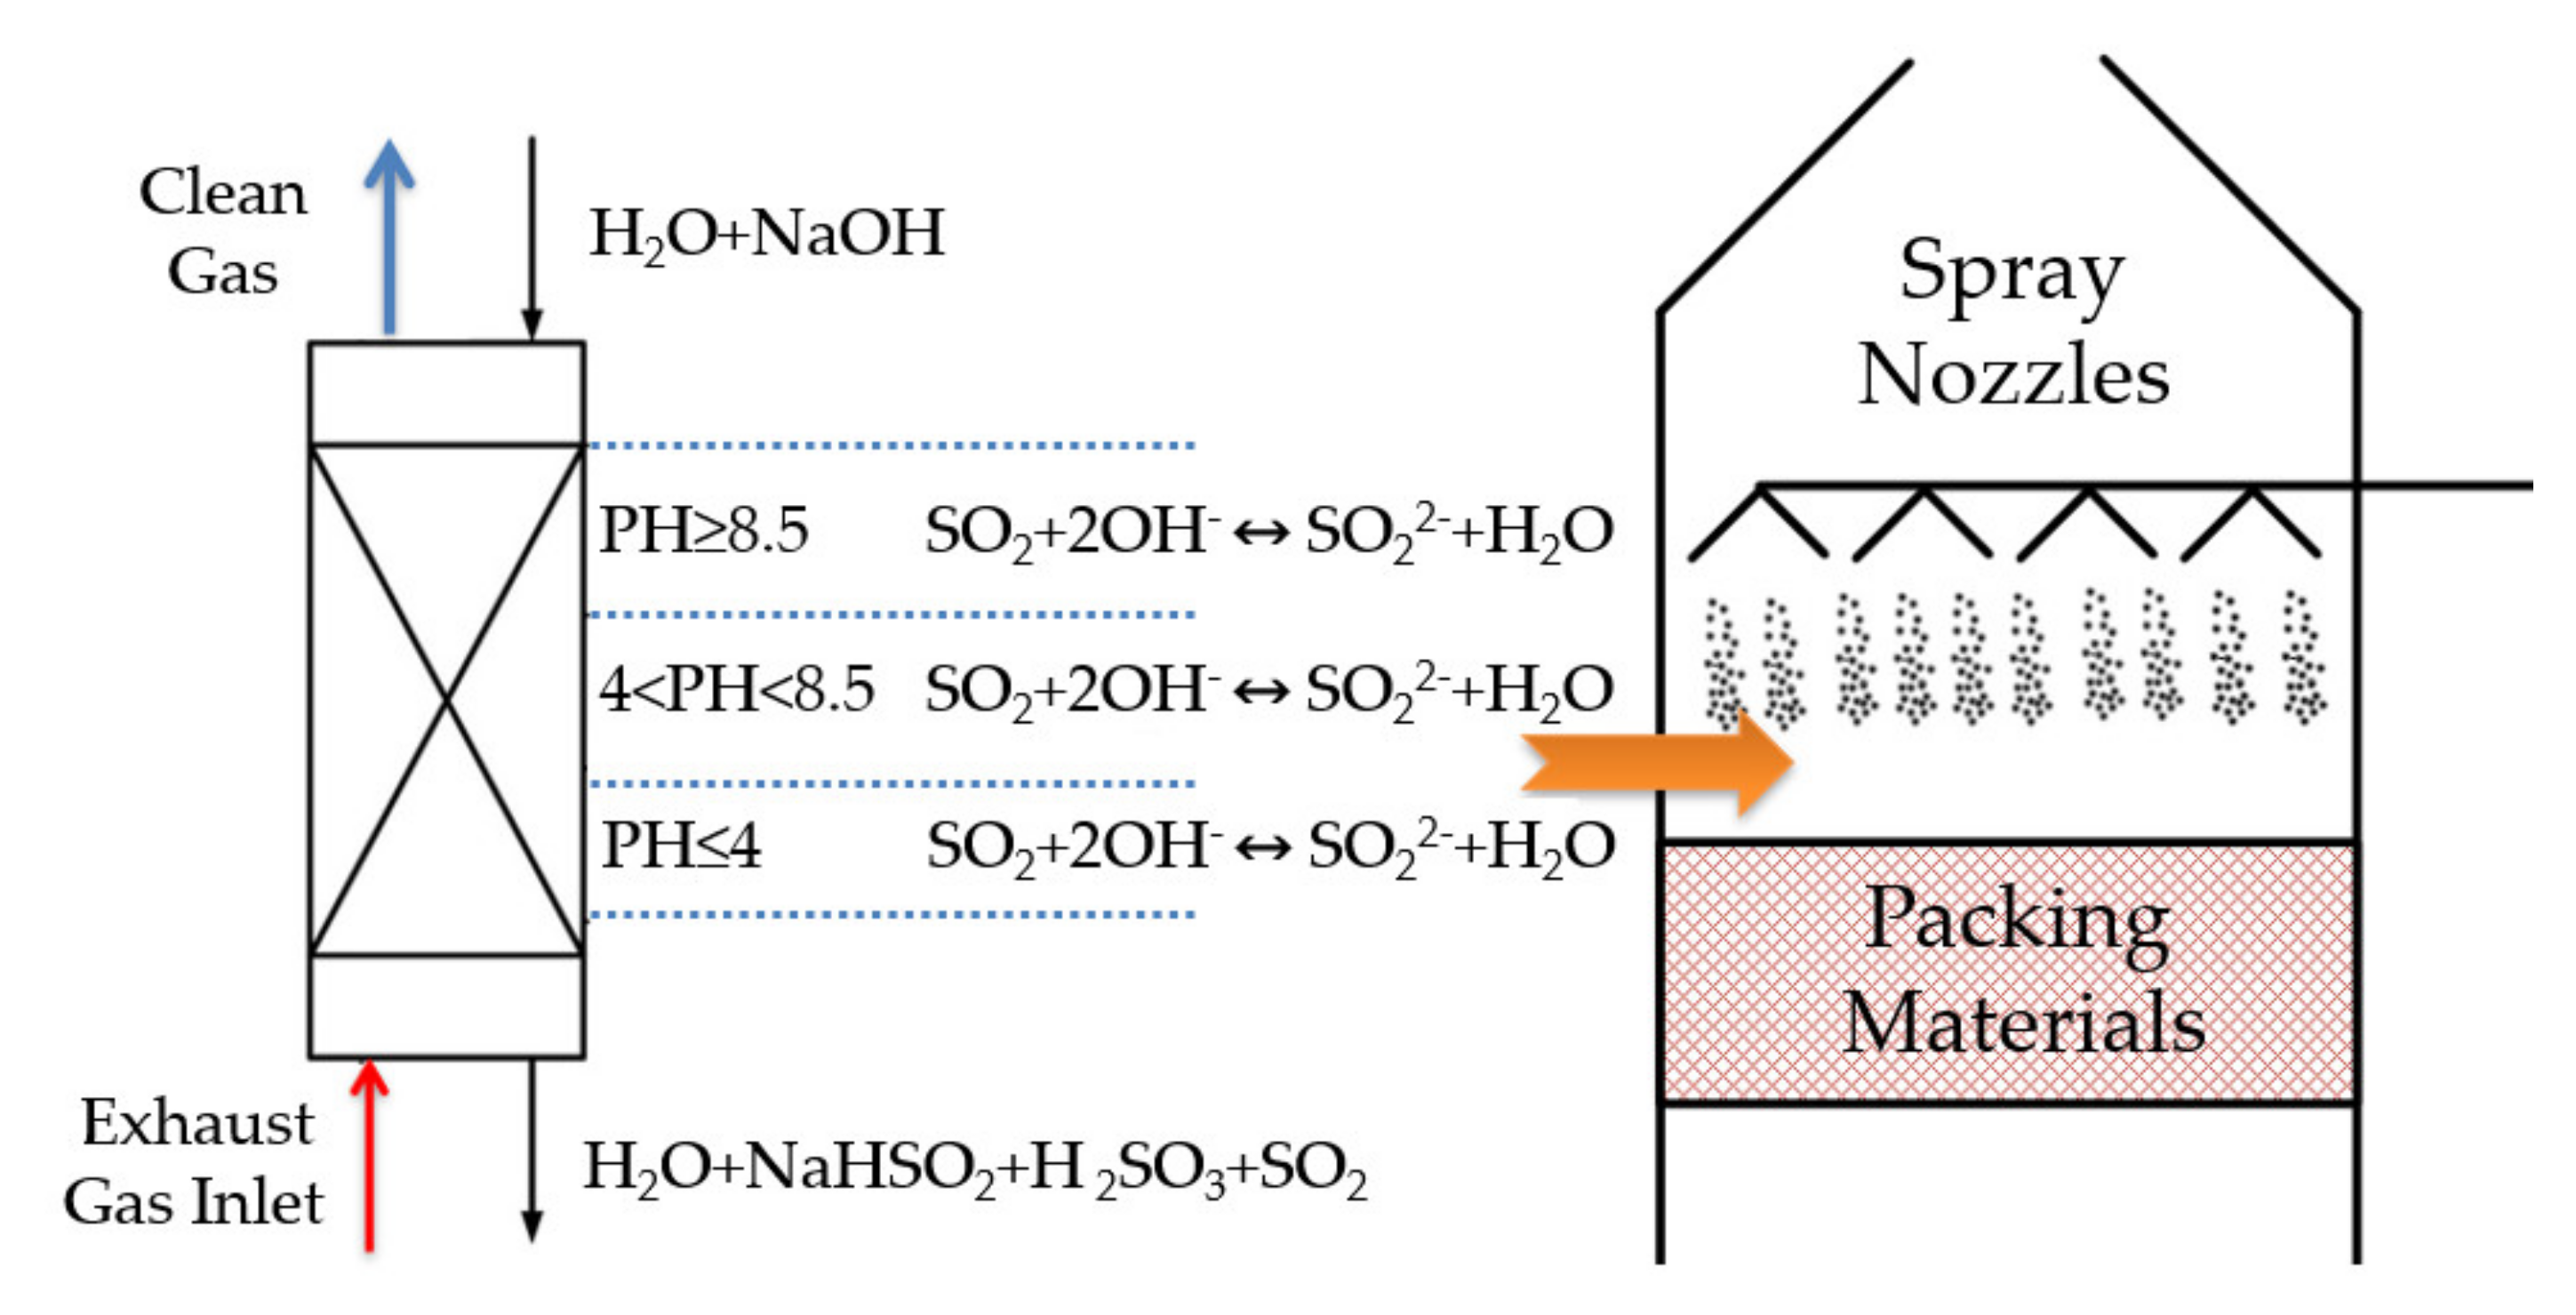
2.2. SO2 Absorption Process inside the Scrubber

The SO2 mass transfer process inside the sodium–alkali scrubber relies on the transfer of SO2 from the gas phase through the interface to the liquid phase. It is mainly based on the conduction between the gas–liquid two-phase and the connection between the two phases. The process of dissolving SO2 in the alkaline absorption liquid includes both physical adsorption and chemical absorption. Both of these two processes can be studied by using the double-membrane theory.
The process of absorbing SO2 in the gas–liquid phase inside the scrubber using a NaOH solution can be simplified to the sodium–alkali method model shown in Figure 1. Since both the solvent (water) and the solute (NaOH) in the absorption liquid have an absorption capacity for SO2, the absorption process can be divided into a water absorption SO2 process and a NaOH absorption SO2 process.
The absorption process of SO2 in water is different from that in NaOH solution, which is accompanied by a rapid and irreversible chemical reaction. The mass transfer reaction process is shown in Figure 1. After the SO2 dissolved in the liquid phase is contacted with NaOH in the scrubber, the following chemical reactions occur:
2NaOH + SO2→Na2SO3 + H2O
Na2SO3 + SO2(l)+H2O→2NaHSO3

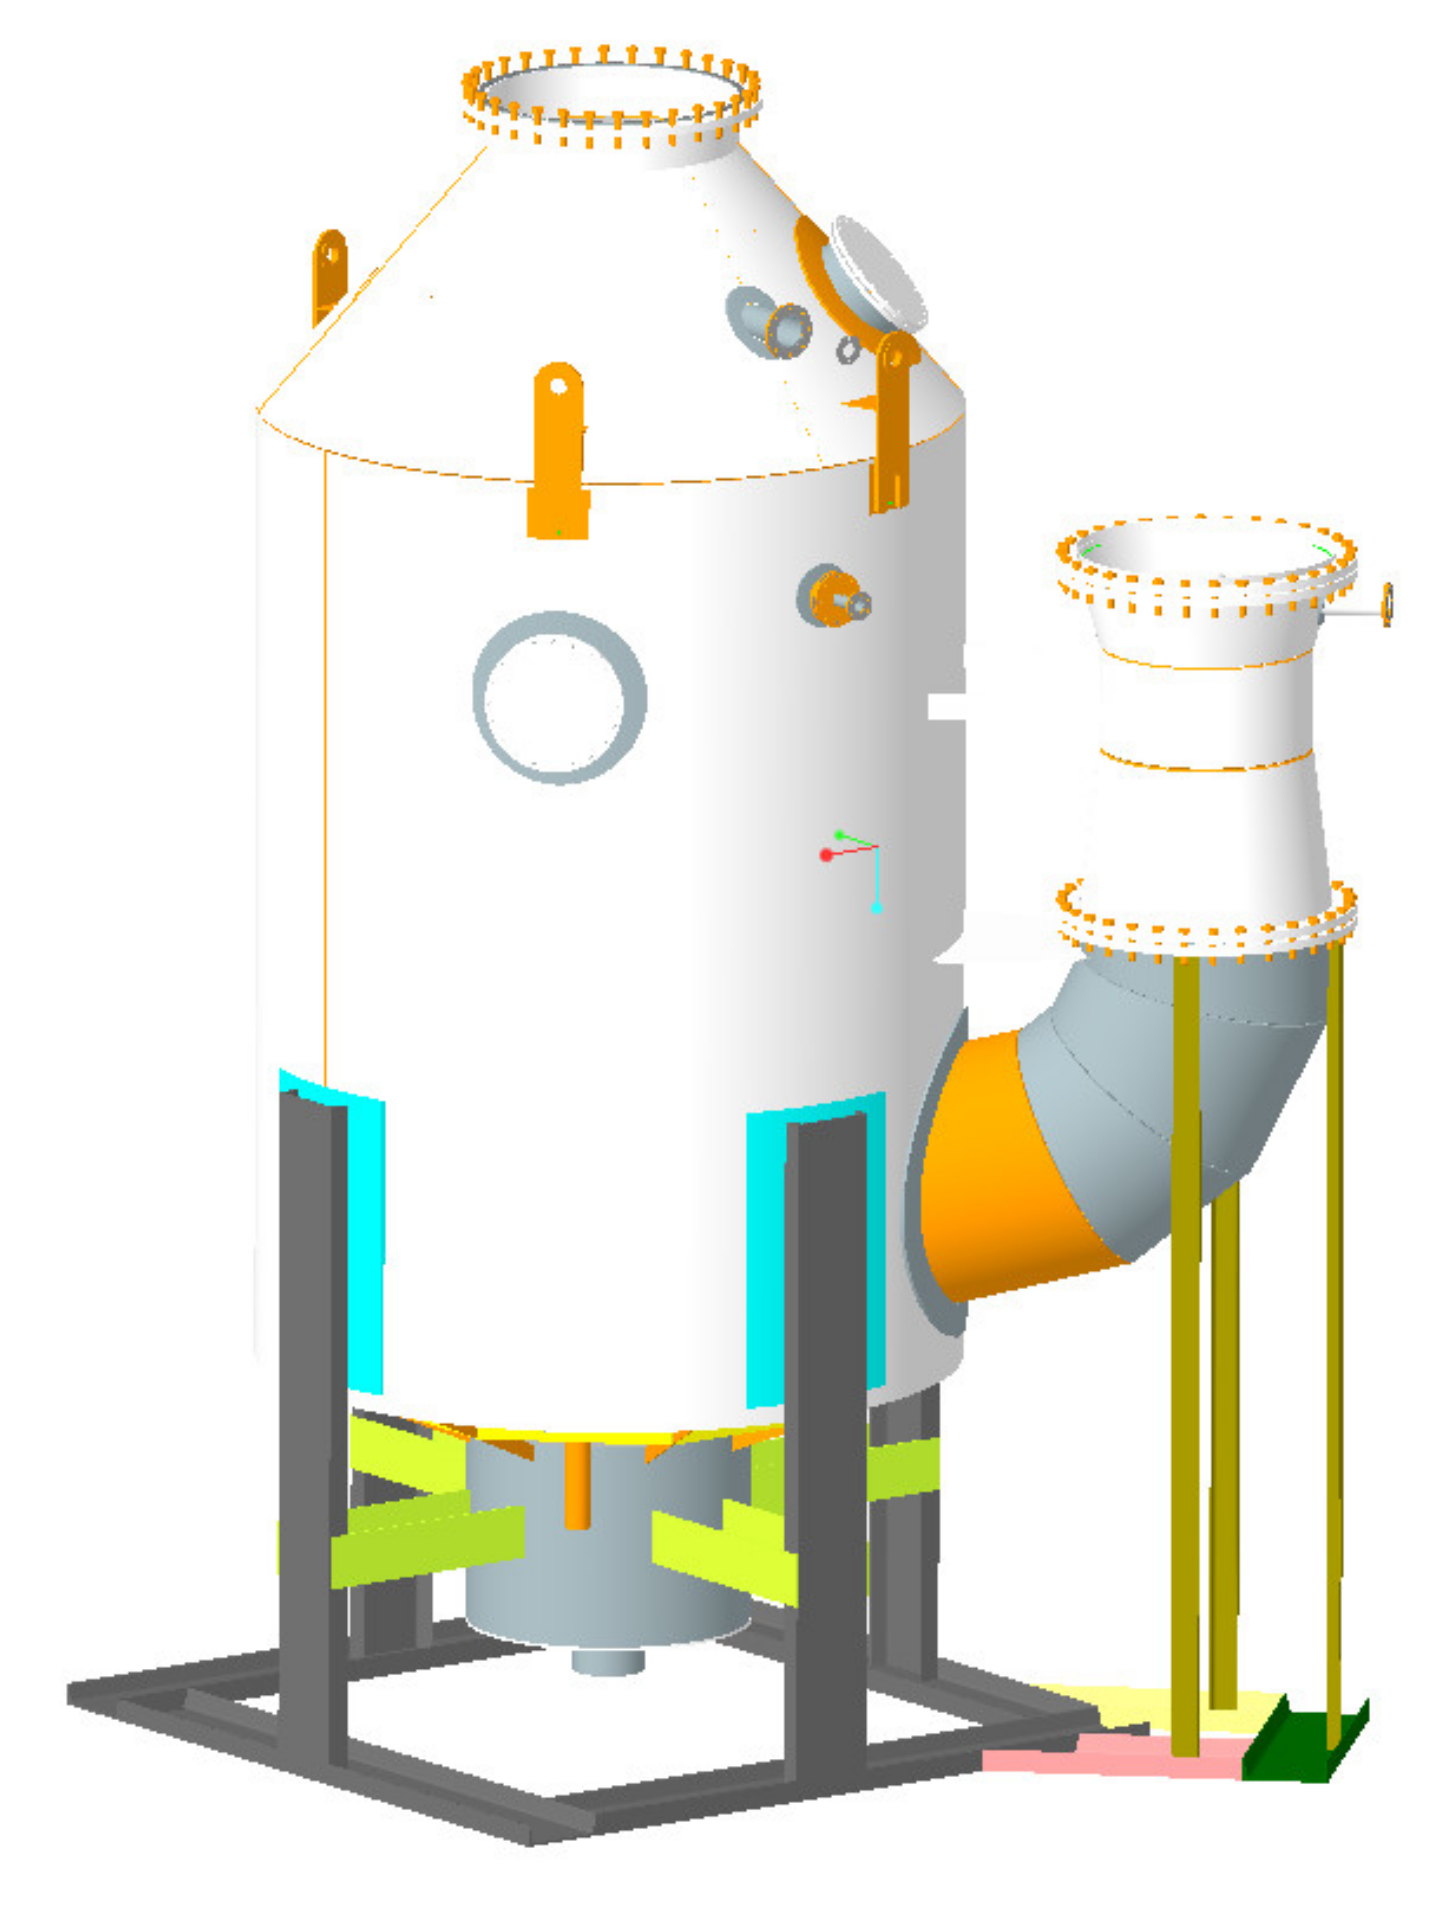
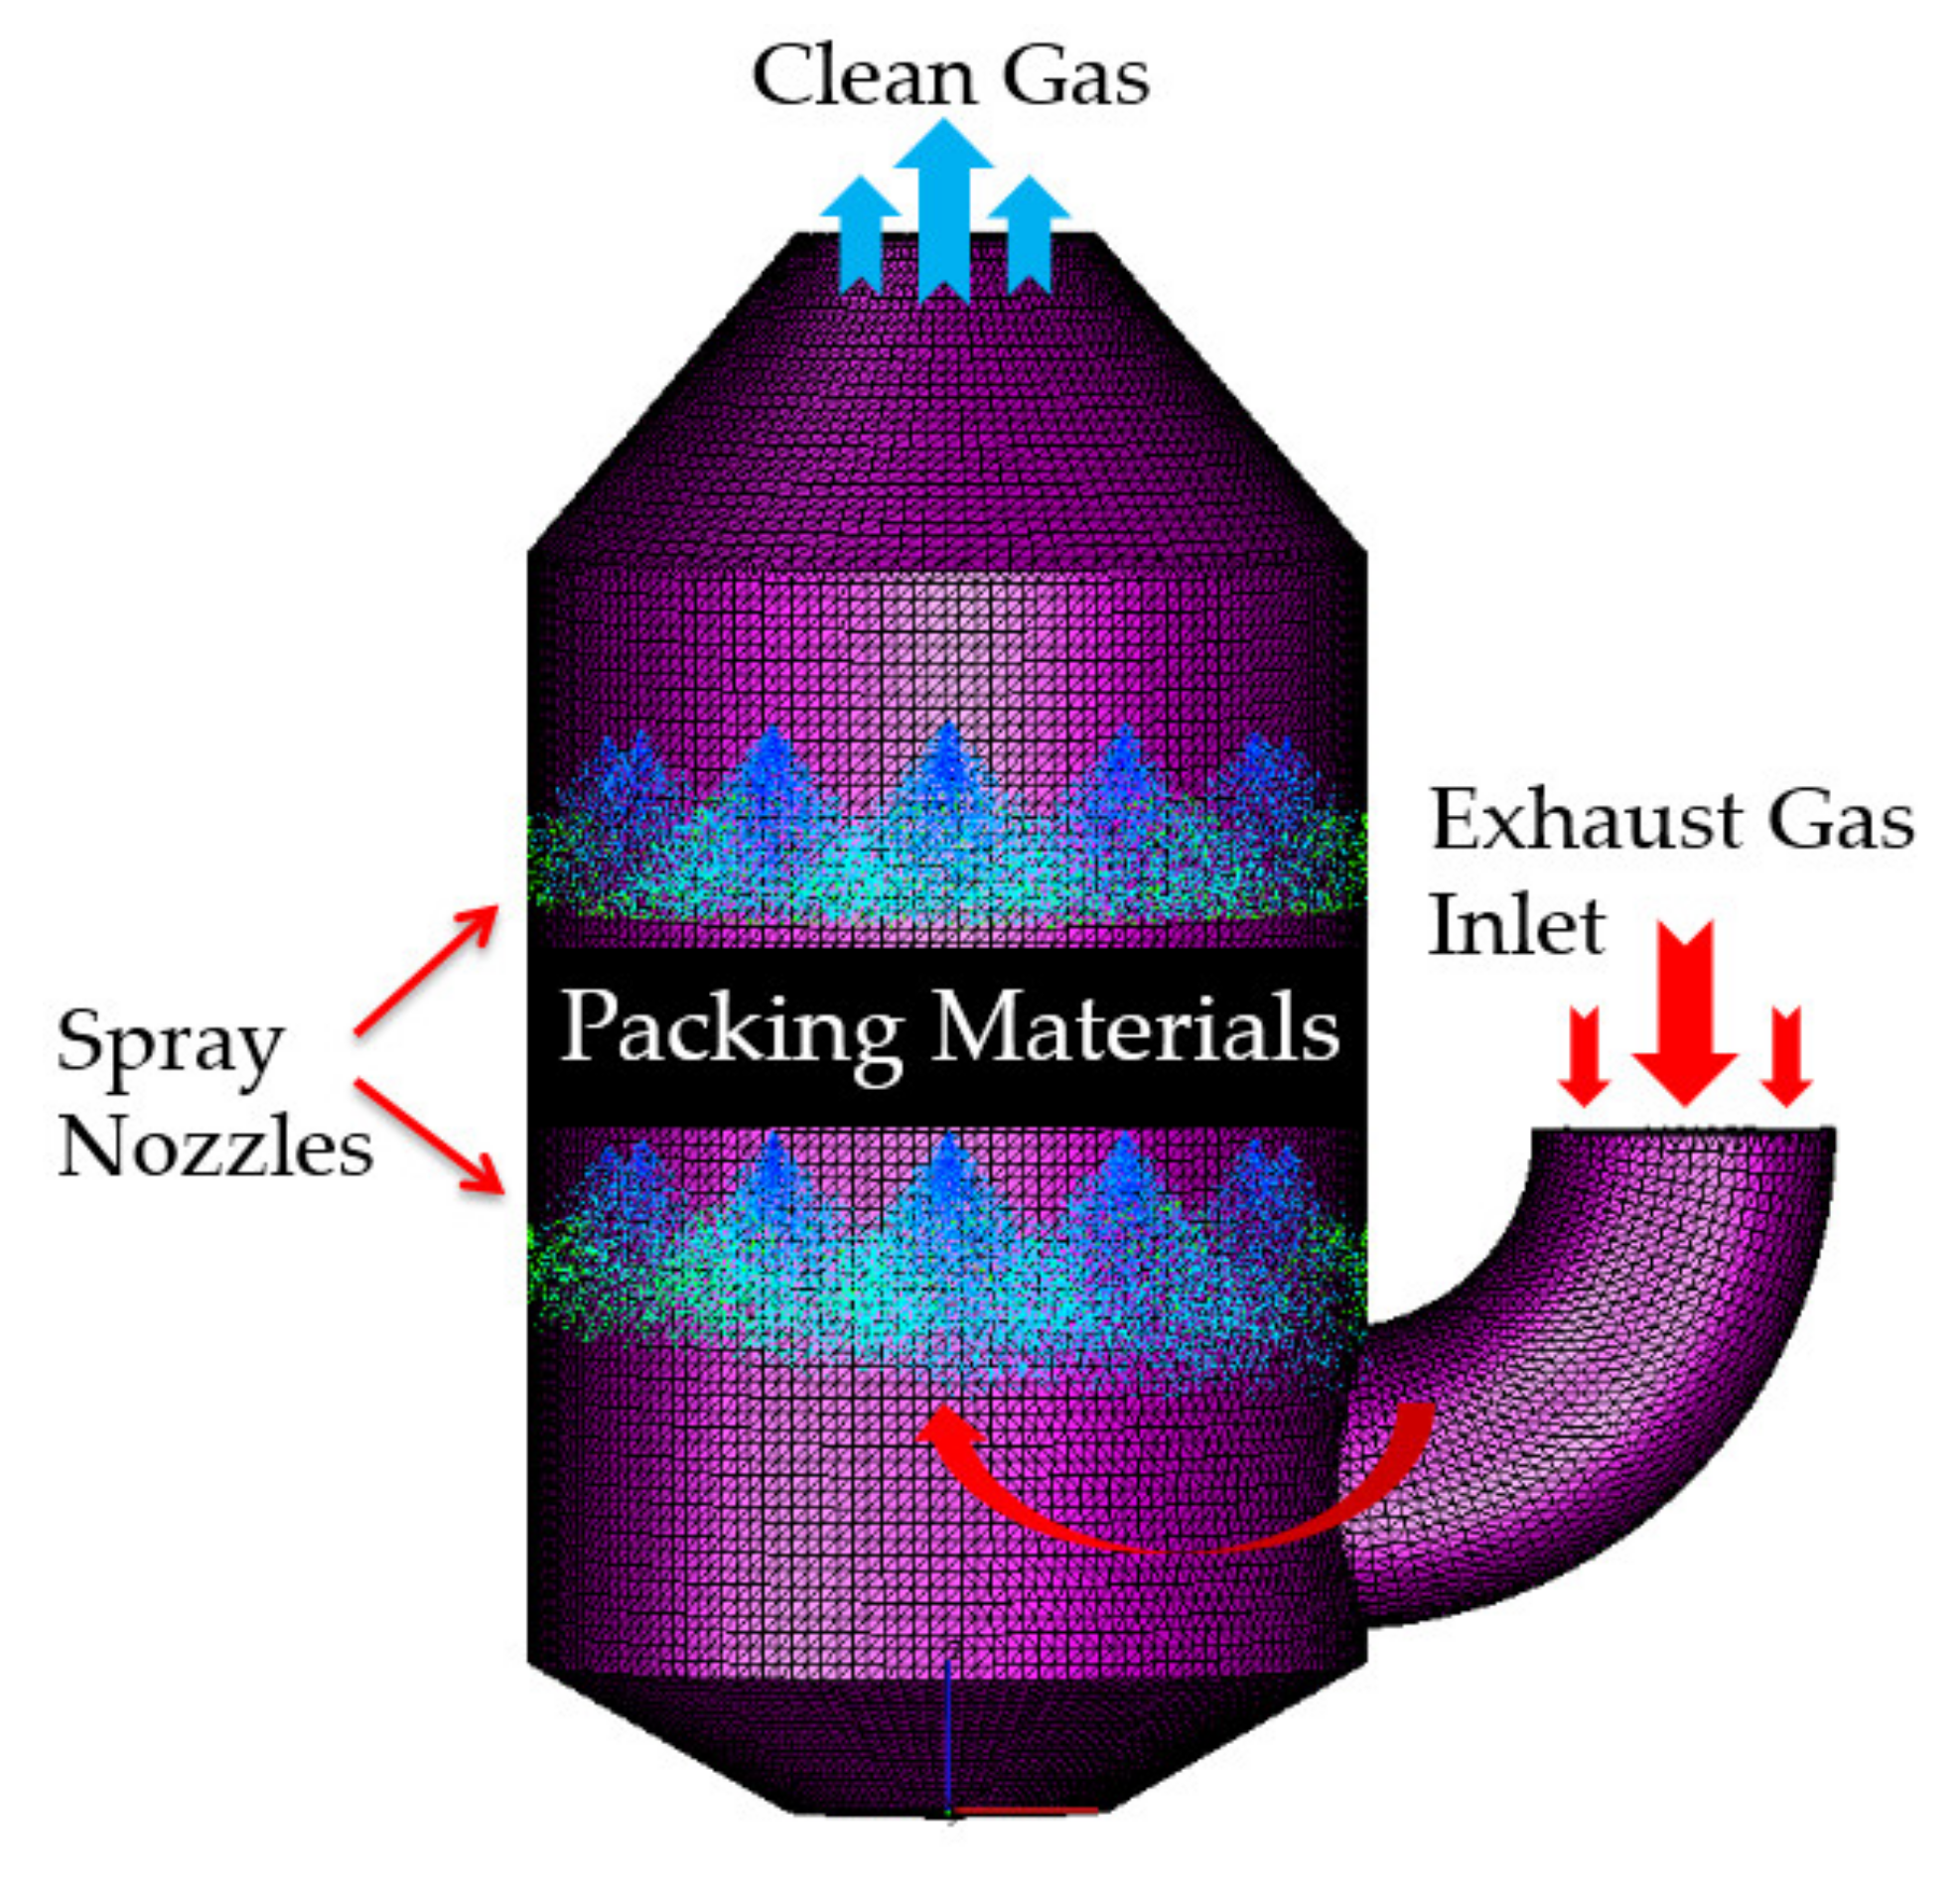
2.3. Computational Fluid Dynamics (CFD) Model Description

The 3D Computer Aided Design (CAD) structural geometry of the scrubber was shown in Figure 2. During the simulation process, the scrubber model needs to be simplified to improve the quality of the mesh and optimize the simulation efficiency while ensuring the improvement of the calculation speed. As shown in Figure 3, small mechanical parts such as the screws, the demister, and the support frame of the scrubber should be removed to simplify the calculation. After that, the total number of computational meshes was 869,175. Moreover, the actual material of the scrubber packing bed is the metal ring saddle (D = 50 mm). Therefore, the three-dimensional simulation model simplifies the packing bed of the scrubber into a porous medium. In this way, the pressure drop and temperature distribution of the flue gas passing through the packing bed (H = 720 mm) and the influence of the packing layer on the exhaust gas distribution inside the De-SOx scrubber are simulated.
The height of the De-SOx scrubber is 7.8 m and the diameter is 3.2 m. There are two layers of nozzles inside the scrubber, and each layer has 26 nozzles. The spray volume of the washing liquid is 120 m3/h. The injection pressure of each nozzle is 0.1 MPa and the spray cone angle is 90. The simulation starts with the exhaust gas entering the intake port at t = 0 s. The simulation time is long enough to ensure that the exhaust gas and the washing water fully react to simulate the real reaction process inside the scrubber.
The marine engine model supporting the scrubber is a large MAN 6S50ME low-speed 2-stroke diesel engine. The engine uses an ultra-long stroke while the scavenging form uses a port-air valve direct current (DC) scavenging. The basic parameters of the MAN 6S50ME engine are shown in Table 1.
The initial condition temperature of the De-SOx scrubber was 298 K, and the initial temperature of the wash water was 305 K. Besides, the initial pressure of the scrubber and the ambient pressure were 101,325 Pa. The flow rate of each nozzles was 77 L/min. The boundary conditions of the De-SOx scrubber simulation model were defined in Table 2. The flow characteristics of the scrubber were studied at an inlet exhaust gas mass flow rate of 23.72 kg/s under 100% engine load. In addition, the Lagrange method was used for droplets injection. The CFD model selected the WAVE Breakup model for spray, and the wall interaction model used the wall jet 2 model. The pressure drop model of the porous medium was the Kozeny-Carman model, and the evaporation model was the Spalding model.

2.4. Exhaust Gas Cleaning System (EGCS) Design Objectives

Since the EGC system is now in the design stage, two targets of 23.72 kg/s inlet mass flow rate are required for the scrubber model: pressure drop less than 1000 Pa and gas velocity in the packing bed less than 2.5 m/s. As shown in Figure 4, the pressure drop of the simulation is 562 Pa, which is not more than 1000 Pa. Moreover, the average gas velocity at the packing bed in Figure 5 is 2.2 m/s. These two design parameters are achieved at the same time, which shows that the model can be used to optimize the uneven flow field inside the scrubber.

3. Results and Discussion

3.1. Flow Characteristics and Spray Behavior Inside the Scrubber

Figure 6 shows the speed vectors and the 3D streamlines of the flow field inside the scrubber. The speed of exhaust gas at the inlet and outlet is very high whilst the velocity of gas in the upper part of the scrubber is low and relatively uniform. The flow velocity range of the exhaust gas is mainly from 1.4 m/s to 16 m/s. Besides, the flow rate of the exhaust gas in this range is more suitable for the desulfurization chemical reaction. The upper layer spray reduces the flow rate of the exhaust gas and makes the flow velocity distribution of the exhaust gas more uniform. It can be seen from the streamlines that the exhaust gas is unevenly distributed in the lower part of the scrubber and is mainly distributed on the left side of the scrubber. After the exhaust gas reaches the upper area of the scrubber, the speed of the waste gas decreases through the joint action of the packing materials and the droplets.
Moreover, part of the exhaust gas reaching the packing layer flows back along the right side of the scrubber wall and merges with the fresh high-speed exhaust gas at the inlet due to the obstruction of the lower part of the packing materials in the scrubber, which causes a large clockwise vortex to form below the packing materials. This vortex can be seen from the vector diagram near the middle and lower part of the scrubber. At the same time, the droplets after injection disturb the flow of the hot exhaust gas and many small vortices are generated near the nozzles. Eventually, the probability of collision of gas–liquid molecules is increased and the reaction performance of the desulfurization process in this region can be improved. Under the joint action of the large eddy and the newly added small vortex, the time for the exhaust gas to stay in the scrubber increases and the gas–liquid contact is utilized when spraying.
The temperature field of the whole scrubber is shown in Figure 7. From Figure 7a, the high-temperature exhaust gas enters the lower layer of the scrubber from the right side. After 1.0 s, the exhaust gas contacts the cooling layer droplets to start to cool down. After that, the exhaust gas passes through the packing materials to the upper spray layer. The temperature in the lower part of the scrubber is significantly lower than that in the non-spraying temperature field. At 1.5 s, the flue gas passing through the cooling layer is further lowered in the scrubber. In the upper half of Figure 7c, four spray-like low-temperature zones appear, which was caused by the influence of the upper nozzles spray. Finally, the average temperature at the exit of the scrubber is reduced to about 342 K—achieving the desired effect.
Figure 8 illustrates the simulation results of velocity and temperature for the preferred planes along the Z-axis direction. The spray of the two-layer nozzles has an impact on the high-speed exhaust gas so the average speed of the flue gas is reduced from 7.1 m/s to 1.5 m/s. After that, the speed of the exhaust gas rises to 15.3 m/s again due to the smaller outlet diameter of the scrubber. Concerning the best De-SOx efficiency, the flow rate of the inlet port should not be too high so that the exhaust gas and the liquid can have sufficient time to contact. Initially, the temperature of the De-SOx scrubber is high due to spray droplets have less effect on cooling the hot exhaust gas. After then, the interaction between the mediums helps to reduce the temperature indicating drops and the exhaust gas are fully mixed. In the lower area of the scrubber, the temperature drops the fastest of all.
The scrubber was under the injection of two spray nozzle layers. In the three-dimensional simulation, there was a total of 52 nozzles in the scrubber. As shown in Figure 9a, 26 nozzles are forming many spray cones after spraying for 0.5 s. The smaller droplets entrained by the exhaust gas to the upper part of the scrubber. A part of which can reach the outlet section while most of the droplets fall to the bottom pool after flushing the exhaust gas. It can be seen from the trajectory distribution diagram that the hollow cone-shaped nozzle can form an umbrella-shaped water curtain to prevent short-flow of the gas stream.
Since the lower nozzle is close to the packing layer, the airflow is rapidly changed by the resistance of the packing layer while the turbulent flow near the left side of the nozzles drives the droplets, which has a strong disturbance to the spray. It can be observed from Figure 9b that there is a high-speed and clear path up exhaust gas channel in the left area of the scrubber and this part of exhaust gas can easily escape from the De-SOx scrubber. There is a large swirl at the bottom of the scrubber causing uneven flow past the lower sprays. The De-SOx efficiency of exhaust gas is closely related to the residence time of exhaust gas in the desulfurization device. The fluent shape of the exhaust gas in this part is not conducive to mixing with the desulfurization spray. Moreover, the reaction time of the exhaust gas and the washing liquid is shortened, and the actual effect of desulfurization is affected due to the presence of the high-temperature exhaust gas channel.
Figure 10 shows the pressure contours for different plane sections. It can be clearly seen from the contour that the pressure of the exhaust gas in the packing layer decreases the fastest. The De-SOx scrubber pressure is influenced by the droplet’s impingement and temperature. Due to the sudden impingement of droplets striking the exhaust gas, the pressure on plane 2 reaches a peak value of 102,297 Pa. The injection impingement of the nozzles reduces the temperature, which gradually affects the average pressure distribution and reduces the pressure value. Therefore, the influence of droplets velocity and temperature is the reason for the pressure drop and rise in the design of a marine De-SOx scrubber.
Figure 11 explains the 3D temperature distribution contour of the outer surface of the scrubber at different times. With the increase of spraying layer height, the distribution of flue gas temperature in each layer begins to change. This is because the flue gas exchanges heat with the droplets during the ascending process. The better the effect of the contact between the exhaust gas and the droplets, the more thorough the heat exchange between them, and thus the uniformity of the temperature field distribution. Furthermore, the temperature of the exhaust gas in different areas of the scrubber should be reasonably controlled and the exhaust gas needs better cooling in the left area of the scrubber bottom.

3.2. Adjustment of the Sprays Position

In this section, the distribution position of the nozzles on the characteristics of the flow field and the thermal characteristics was studied under 100% engine load. Figure 12 illustrates the 3D distribution of the droplets. In the lower zone A, the cone shape of the spray area is destroyed, and the airflow velocity is very high because the exhaust gas is concentrated in the left side area of the scrubber. This area needs more droplets from nozzles to cool the high-temperature of the exhaust gas. If the reaction temperature in the scrubber rises, it will inhibit the physical absorption of SO2. However, in the upper zone B, the distribution of the droplets in the spray area is kept good and uniform. This was because the flow velocity of the exhaust gas after passing through the packing materials is small and the influence of the exhaust gas on the upper layer region is further weakened.
Because the high-speed exhaust gas is more concentrated on the left side of the scrubber, some flue gas even escapes the scrubber without a sufficient reaction, which will affect the desulfurization efficiency of the scrubber. In a nutshell, it is a key factor for the design of the scrubber to reduce the amount of escaping gas and increase the liquid drops on the left side of the De-SOx scrubber.
As shown in Figure 13, the positions of the upper and lower nozzles in the basic working condition correspond to the upper and lower sides and 9 nozzles are distributed on the left and right sides of the centerline. In contrast, the positions of the upper nozzles remain unchanged while the positions of the lower nozzles rotate by 90° clockwise, as shown in Figure 13. As a result, 12 nozzles out of the 26 nozzles in the lower layer are distributed on the left side of the longitudinal centerline. In the comparison simulation case, the distribution of the upper nozzles remains unchanged with 9 nozzles on the left and right sides. The nozzles are arranged up and down in such a staggering way, which can increase the spray density in the strong offset area of exhaust gas on the left side of the scrubber wall and reduce the occurrence of the high-speed escape of exhaust gas as much as possible.
As an illustration in Figure 14, the nozzles were arranged up and down in different positions. At the same spraying time, the spray from the upper and the lower nozzles in the basic case are more concentrated in the center of the scrubber as shown in Figure 14a. In the comparison case of Figure 14b, three more nozzles were placed on the left side of the scrubber, which means more spray droplets could come into contact with the exhaust gas on the left side of the scrubber. Compared with the basic case, the spray from the lower nozzles is more dispersed and the number of droplets on the left side of the scrubber is bigger than that of the upper nozzles. Since the number of nozzles in the design of the scrubber is limited, the droplets of different spray cones affected each other, which means that the droplets cannot be evenly distributed inside the scrubber. The main purpose of the nozzles in the upper and lower layers is to complement the dense and spray areas of the scrubber, which makes the contact between the flue gas and the droplets more sufficient, increases the gas–liquid reaction time, and improves the desulfurization efficiency of the scrubber.
From Figure 15, comparing the number of droplets hitting the wall at the left side, it is found that the number of droplets hitting the wall by rotating the lower layer nozzles 90° is significantly less. Besides, more droplets are concentrated inside the scrubber center for the comparison case. High liquid-to-gas ratios (L/G) are used for high-temperature gas streams to prevent pollution and for high grain loadings. If the L/G ratios fall below the design value, De-SOx scrubber collection efficiency will diminish. With a smaller number of droplets hitting the scrubber wall, the L/G ratios will increase more easily, and the scrubber can obtain higher desulfurization efficiency.
As shown in Figure 16, the red high-temperature area in the comparison case is smaller, which indicates that the average outlet temperature is lower than the basic case. In the outlet temperature comparison of Figure 16, the comparison simulation case has a good cooling effect on the hot exhaust gas on the left side of the scrubber. The average outlet temperature is lower than the basic case by about 7.2 K and the temperature distribution is more uniform.
Due to the uneven distribution of exhaust gas in the scrubber, the spray droplets fall quickly and the gas–liquid contact time is shorter. Besides, the poor mass transfer effect also reduces the desulfurization rate. Through the above methods, the nozzle arrangement and the nozzle position were improved to make the flow field as uniform as possible and maintain the liquid holding capacity per unit volume in the scrubber, so that the desulfurization rate could be improved. With no increase in EGC system cost, the problem of uneven flow is improved.

3.3. Adjustment of the Sprays Angle

In this section, the influence of the outer nozzles angle on the flow field, the temperature field, and the droplet atomization and evaporation inside the scrubber were simulated. As shown in the spray photo of Figure 17a, the nozzles spray the washing liquid vertically downward inside the scrubber. From the 3D simulation results, it can be seen that the distribution of droplets has a cone-shape and there is always a part of washing liquid hitting the wall in the scrubber. Besides, it is very difficult for the outermost nozzles to avoid some droplets impinging on the scrubber wall—resulting in uneven distribution of the droplets.
From the 3D distribution of the spray in Figure 17, the normal spray has a vertical downward spray under normal operating conditions while the outermost nozzles changes to an angle of 45° with the vertical direction in the comparison simulation case. By controlling the nozzle to spray obliquely, it is possible to reduce the droplets to hit the wall as much as possible and improve the utilization rate of the washing liquid. Moreover, only the outermost nozzle changes the spray inclination angle while the inner nozzle still maintains a vertical downward injection.
It is obvious from the concentration distribution contour of the spray droplets that at the early stage of spraying at 0.6 s, the number of wall droplets with vertical spray is much larger than that of the 45° injection as shown in Figure 18. At the time of 2.5 s, the number of droplets on the wall under 45° injection is still much smaller than the number of droplets under the vertical spray and very few droplets on the wall can be observed in the lower layer and the upper layer of the scrubber. However, the amount of residual liquid at the bottom of the scrubber of the vertical injection is slightly smaller than the 45° injection. As the evaporation rate is a key parameter regulating the nature of the physics inside the scrubber design, the concentration of residual water droplets left in the domain should be minimized.
Figure 19 describes the average temperature distribution curves inside the scrubber under two different spray angles. The overall trend of the curve is that the temperature rises rapidly before 0.5 s. After the spray injection begins, the exhaust gas contacts with the droplets and the temperature of the exhaust gas begins to decrease. After 1.5 s, the slope of the temperature curves become gentler, and finally, the whole temperature field inside the scrubber reaches a stable state. The slope of the temperature drop of the scrubber is related to the evaporation of the droplets, which also reflects that the evaporation of the droplets decreases after 1.5 s. By comparing the two curves, it is found that although the spray angles are different, they have little influence on the temperature field of the whole scrubber.
Figure 20 represents the 3D distribution of the spray droplets under different injection direction. From Figure 20, the downward kinetic energy of vertical spray droplets is large and the number of droplets rising with the exhaust gas is very small. Besides, the spray droplets under the 45° injection are easy to be disturbed by the exhaust gas. This is due to the momentum of the inclined direction when the jet is injected. Although the number of wall droplets is greatly reduced, the number of upward droplets is also large, and some droplets are easily dispersed by the exhaust gas. The flow field distribution in the scrubber under 45° injection is more complex and some liquid drops reach the bottom of the scrubber before they can conduct heat and mass transfer with the exhaust gas, which is a result of an insufficient reaction.
Figure 21 shows the contour of the average pressure distribution in the scrubber under different nozzles angle. From the color of the contour, it could be seen directly that the pressure drop under 45° injection is smaller than the vertical injection. Due to the angle between the spray direction of the nozzle and the exhaust gas, the resistance of the exhaust gas to the outlet is correspondingly reduced, which in turn leads to a poor cooling effect of the exhaust gas at the bottom area of the scrubber. However, the use of oblique injection increases the complexity of the flow field in the scrubber and causes the spray droplets to lose more kinetic energy. After the inclined spraying of the outer nozzles, the flow field in the scrubber becomes more complicated and the outlet gas velocity becomes larger. At the same time, the residence time of gas–liquid is shortened, and the desulfurization efficiency is reduced.

4. Conclusions

To optimize the uneven flow in a marine De-SOx scrubber, an effective three-dimensional simulation model of the scrubber was established and the evaporation and flow characteristics of the droplets inside the scrubber were simulated. The main conclusions are listed as follows:
(1)
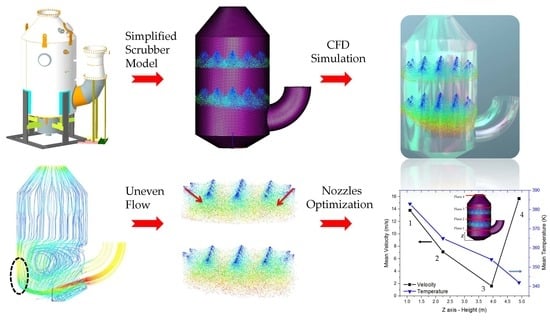
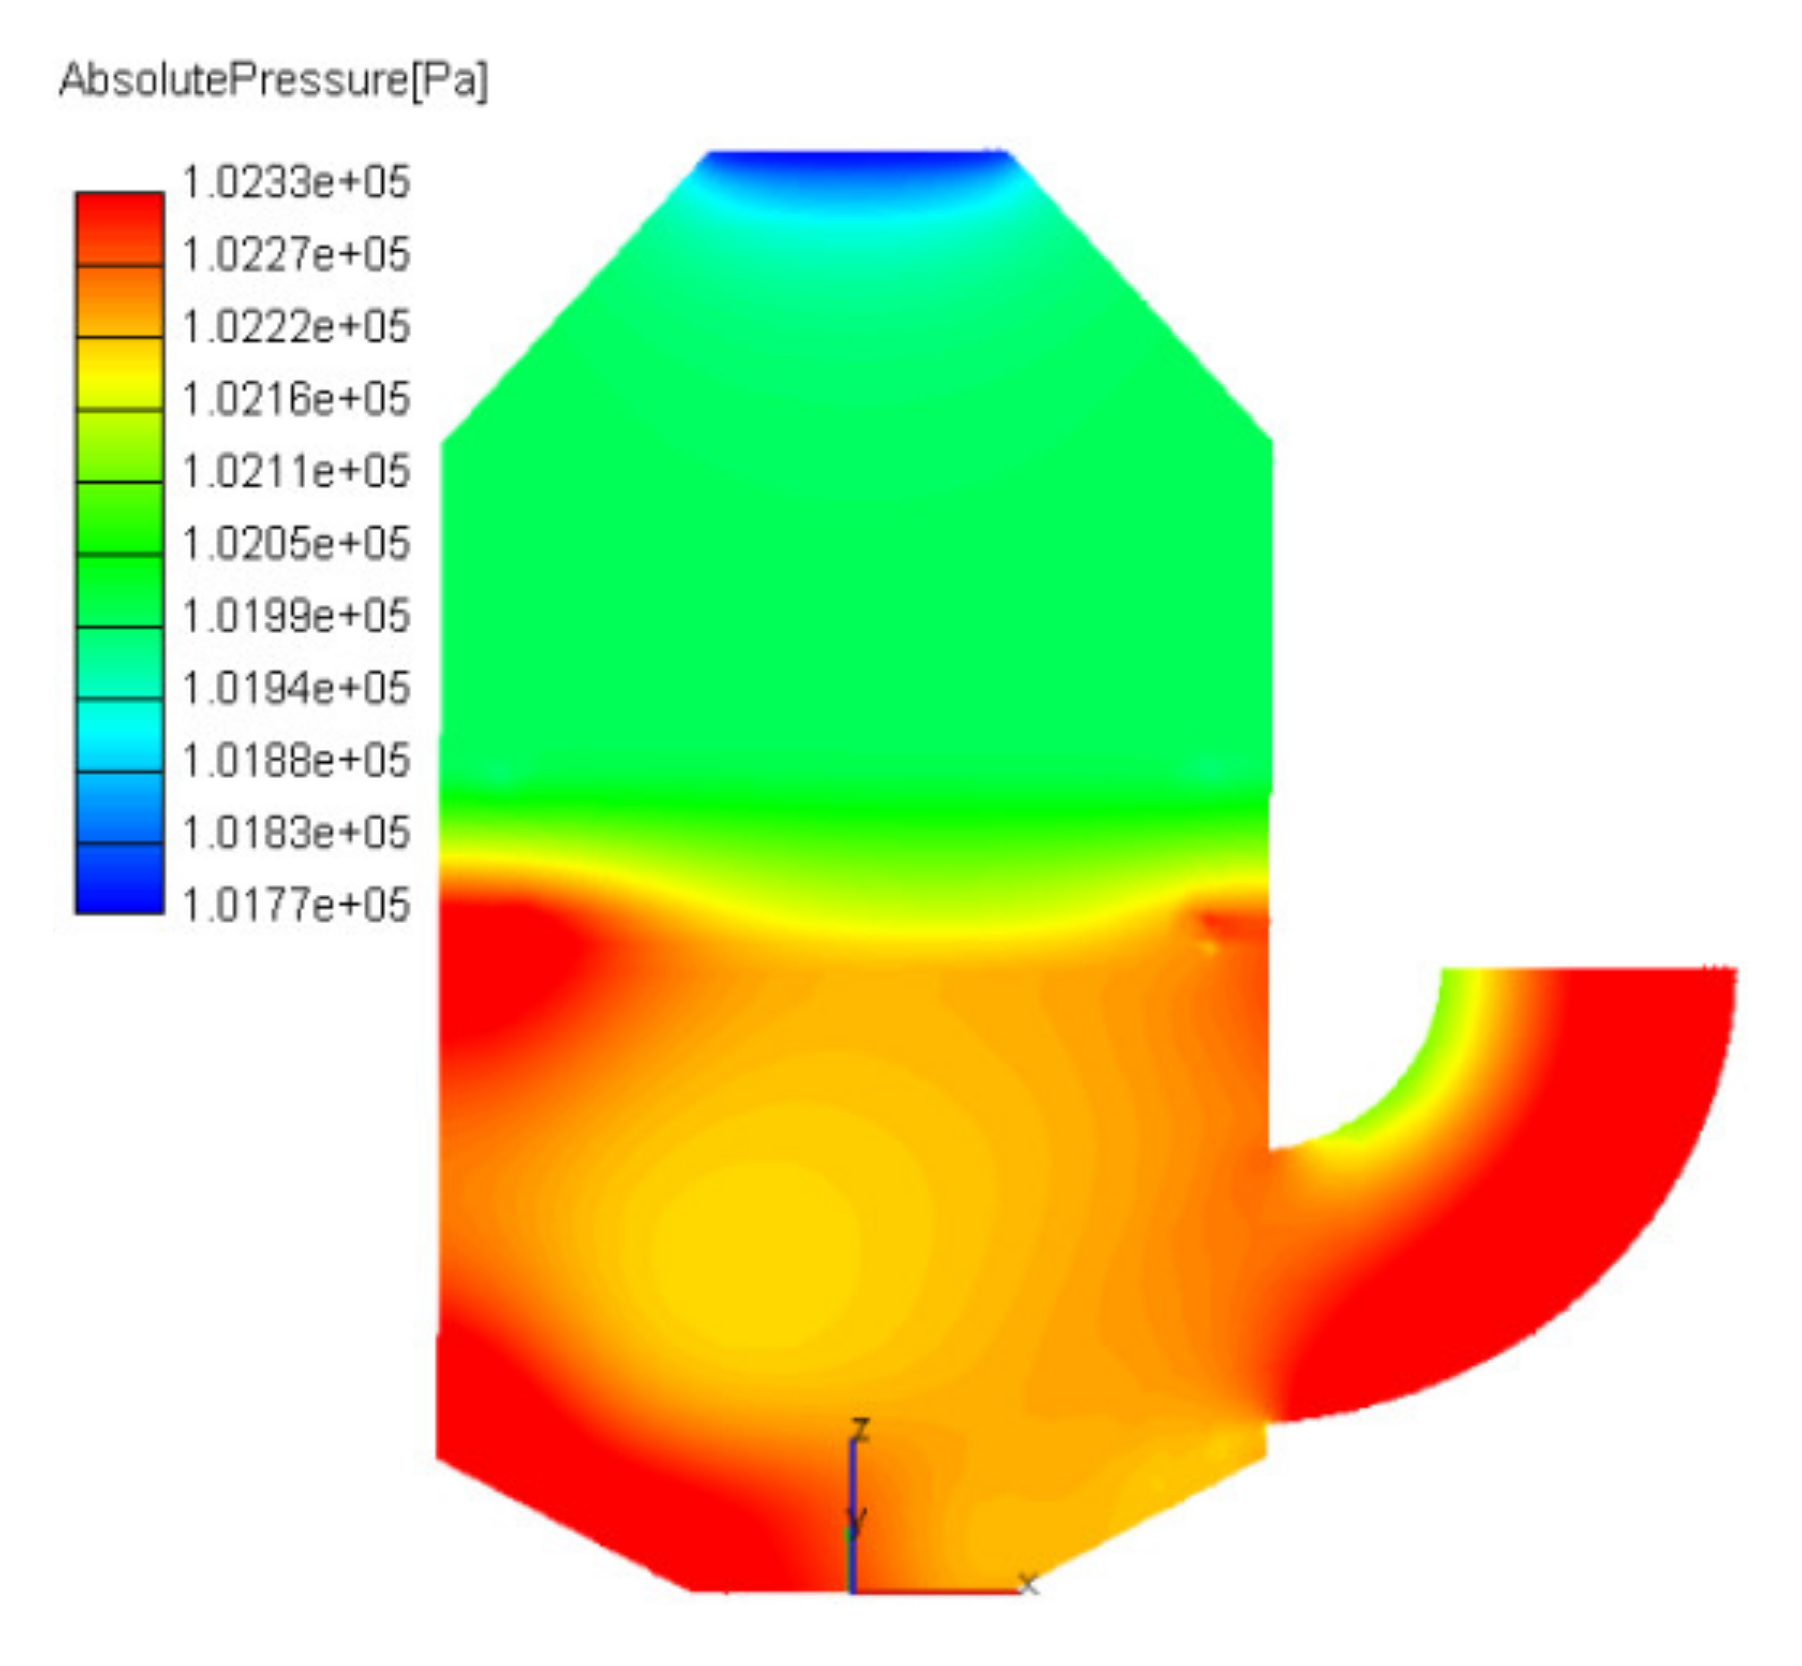
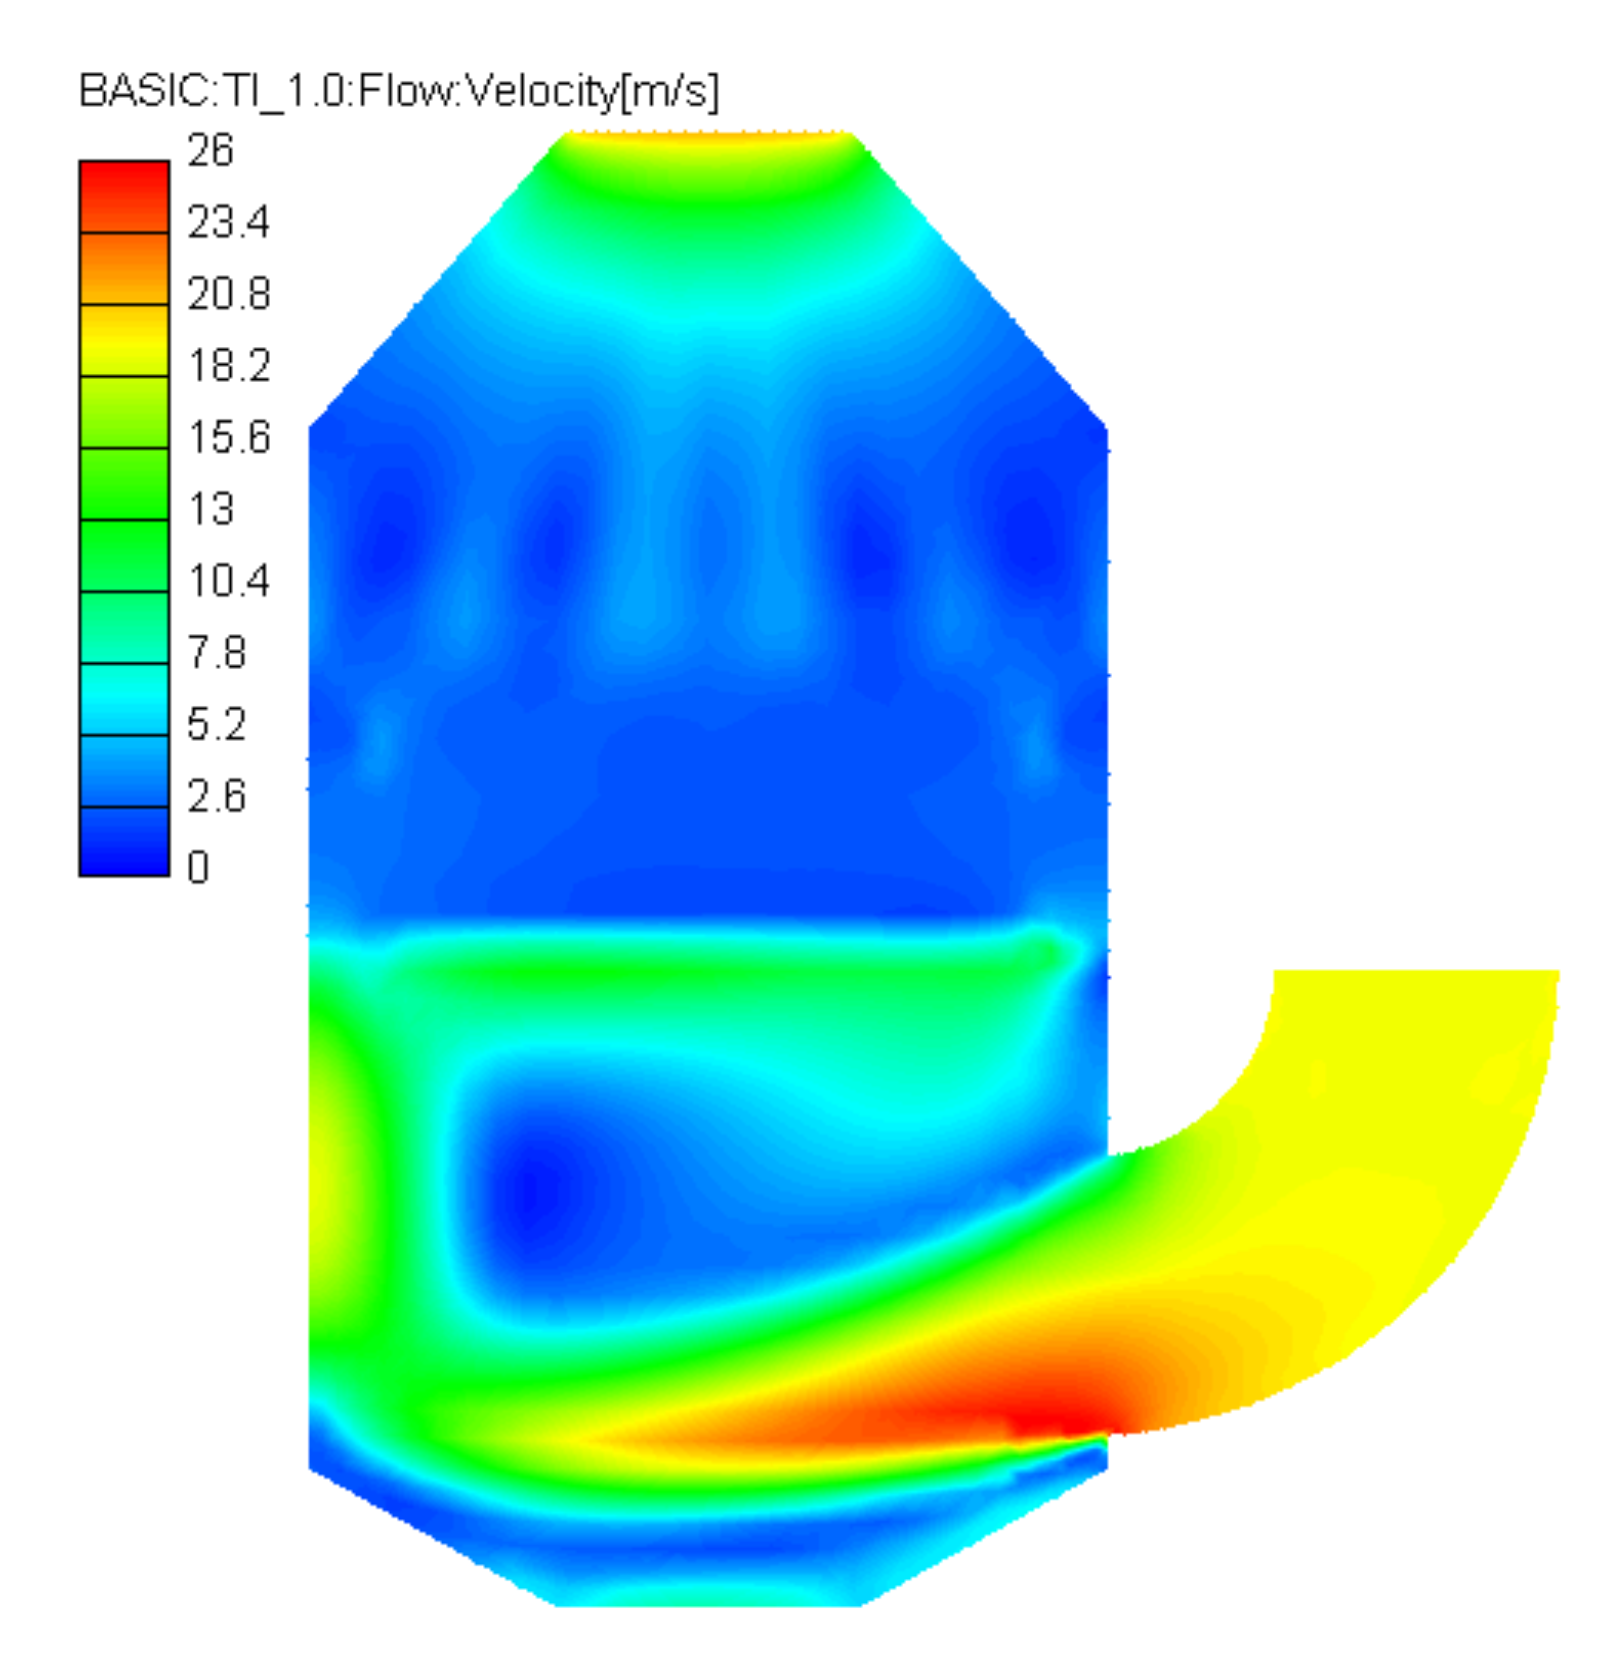
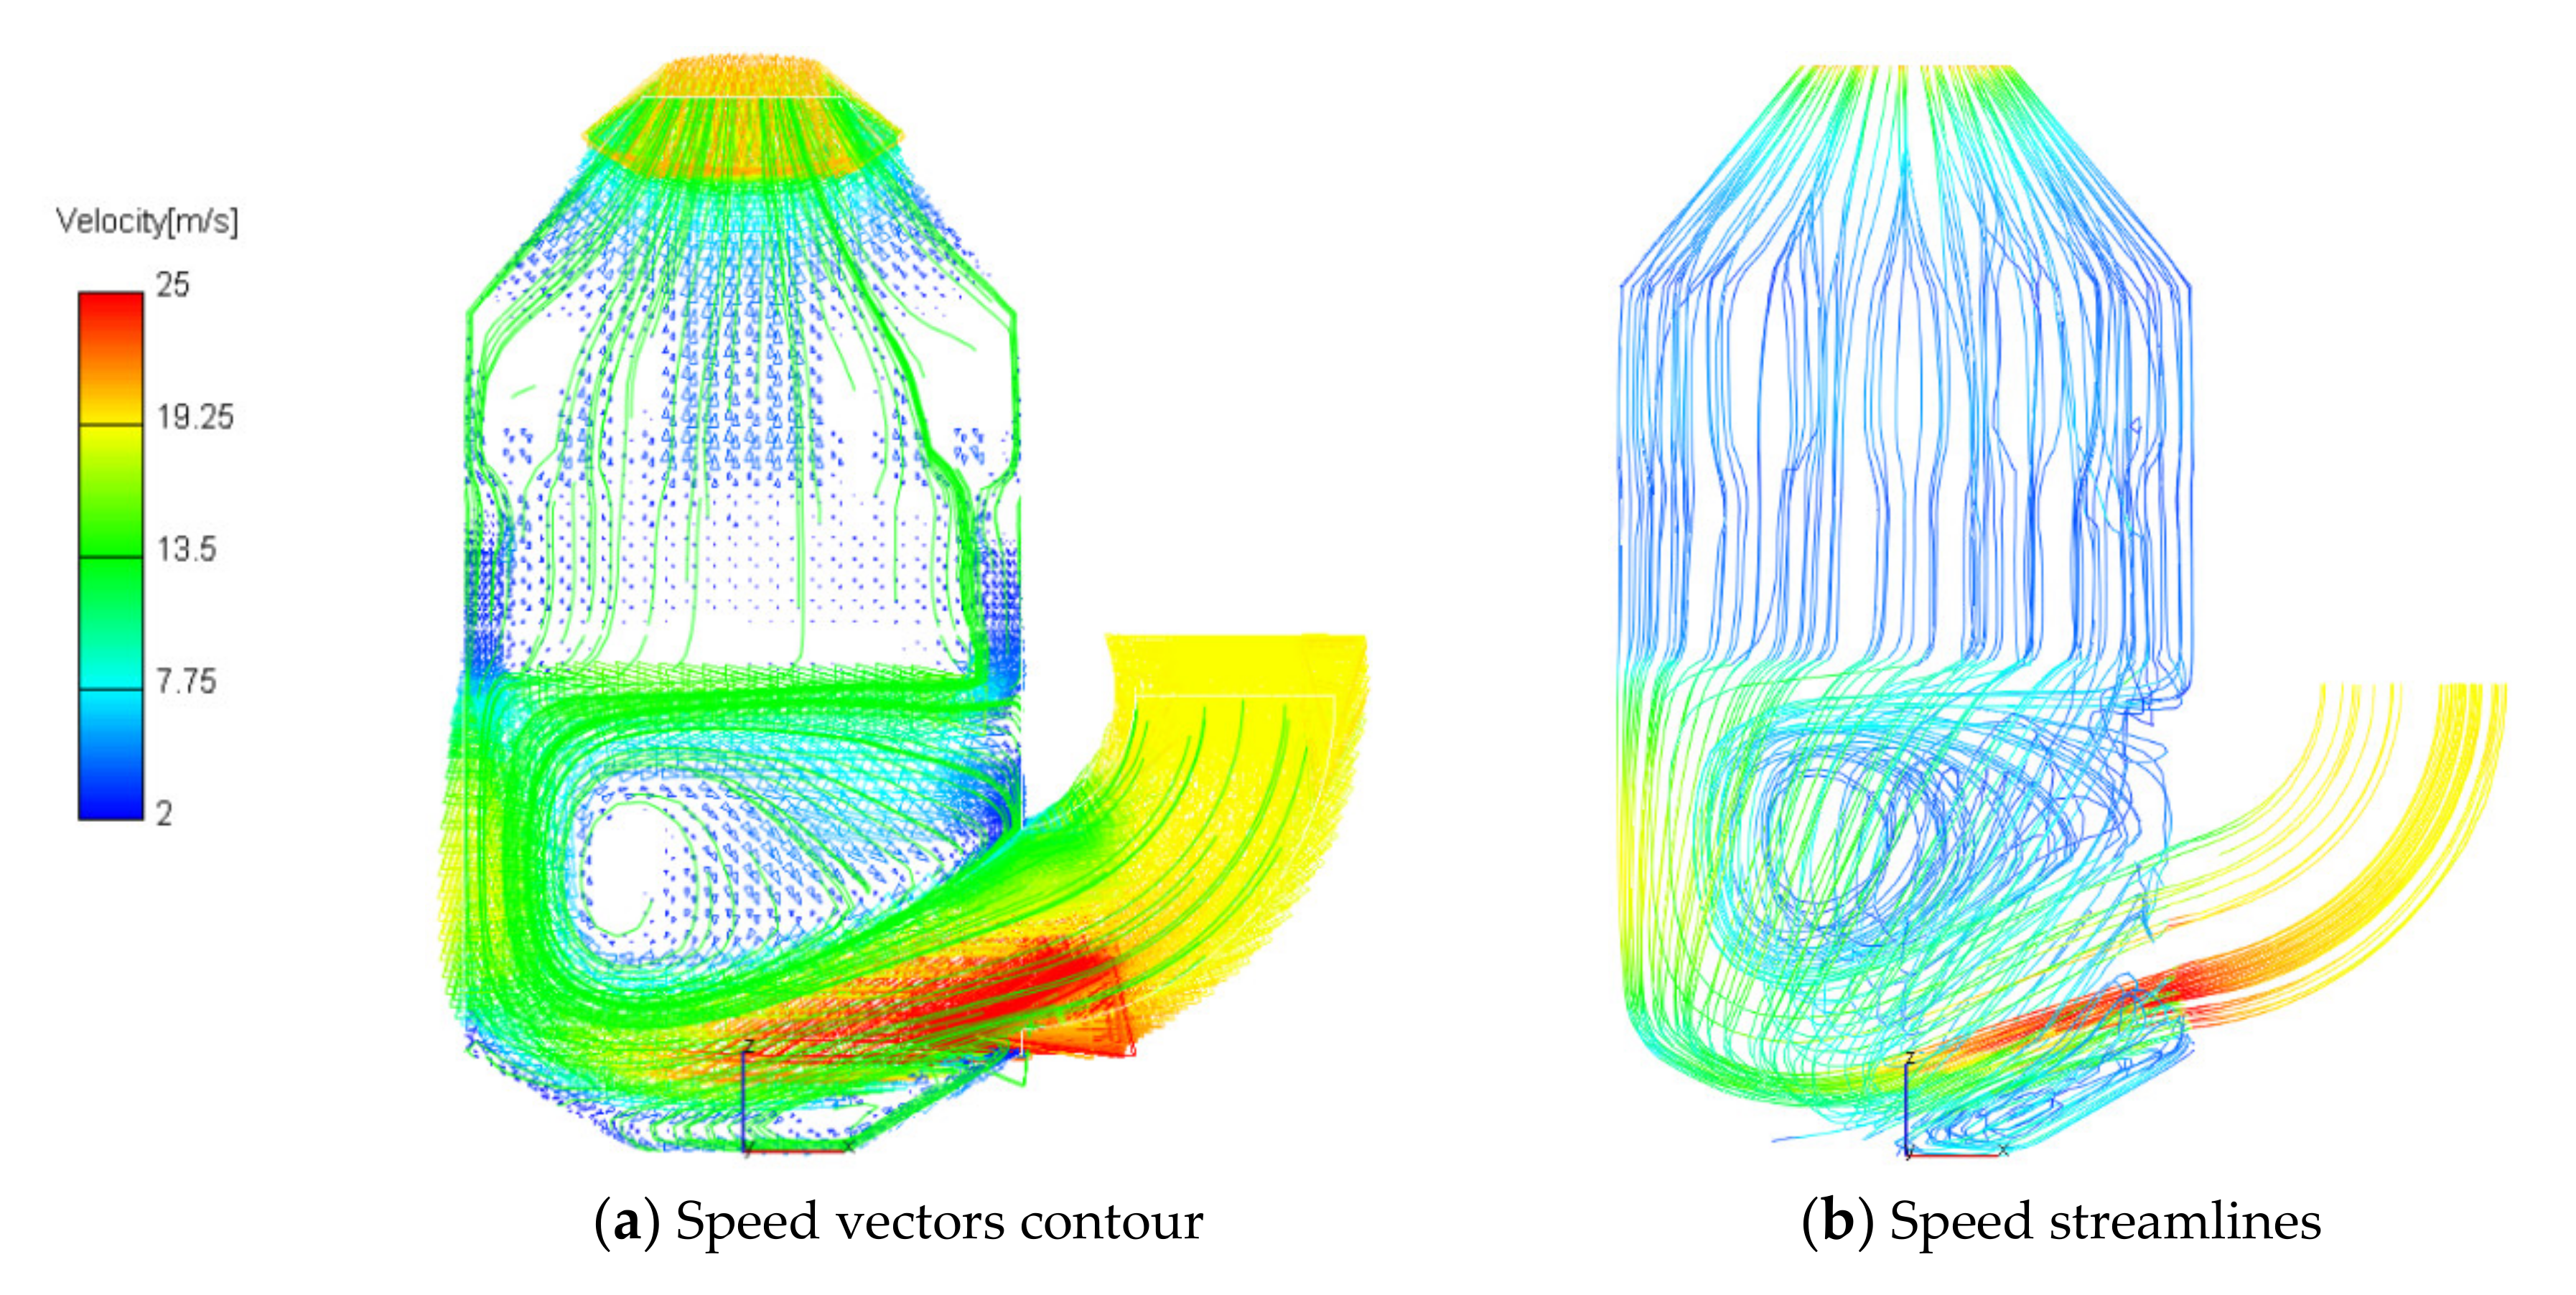
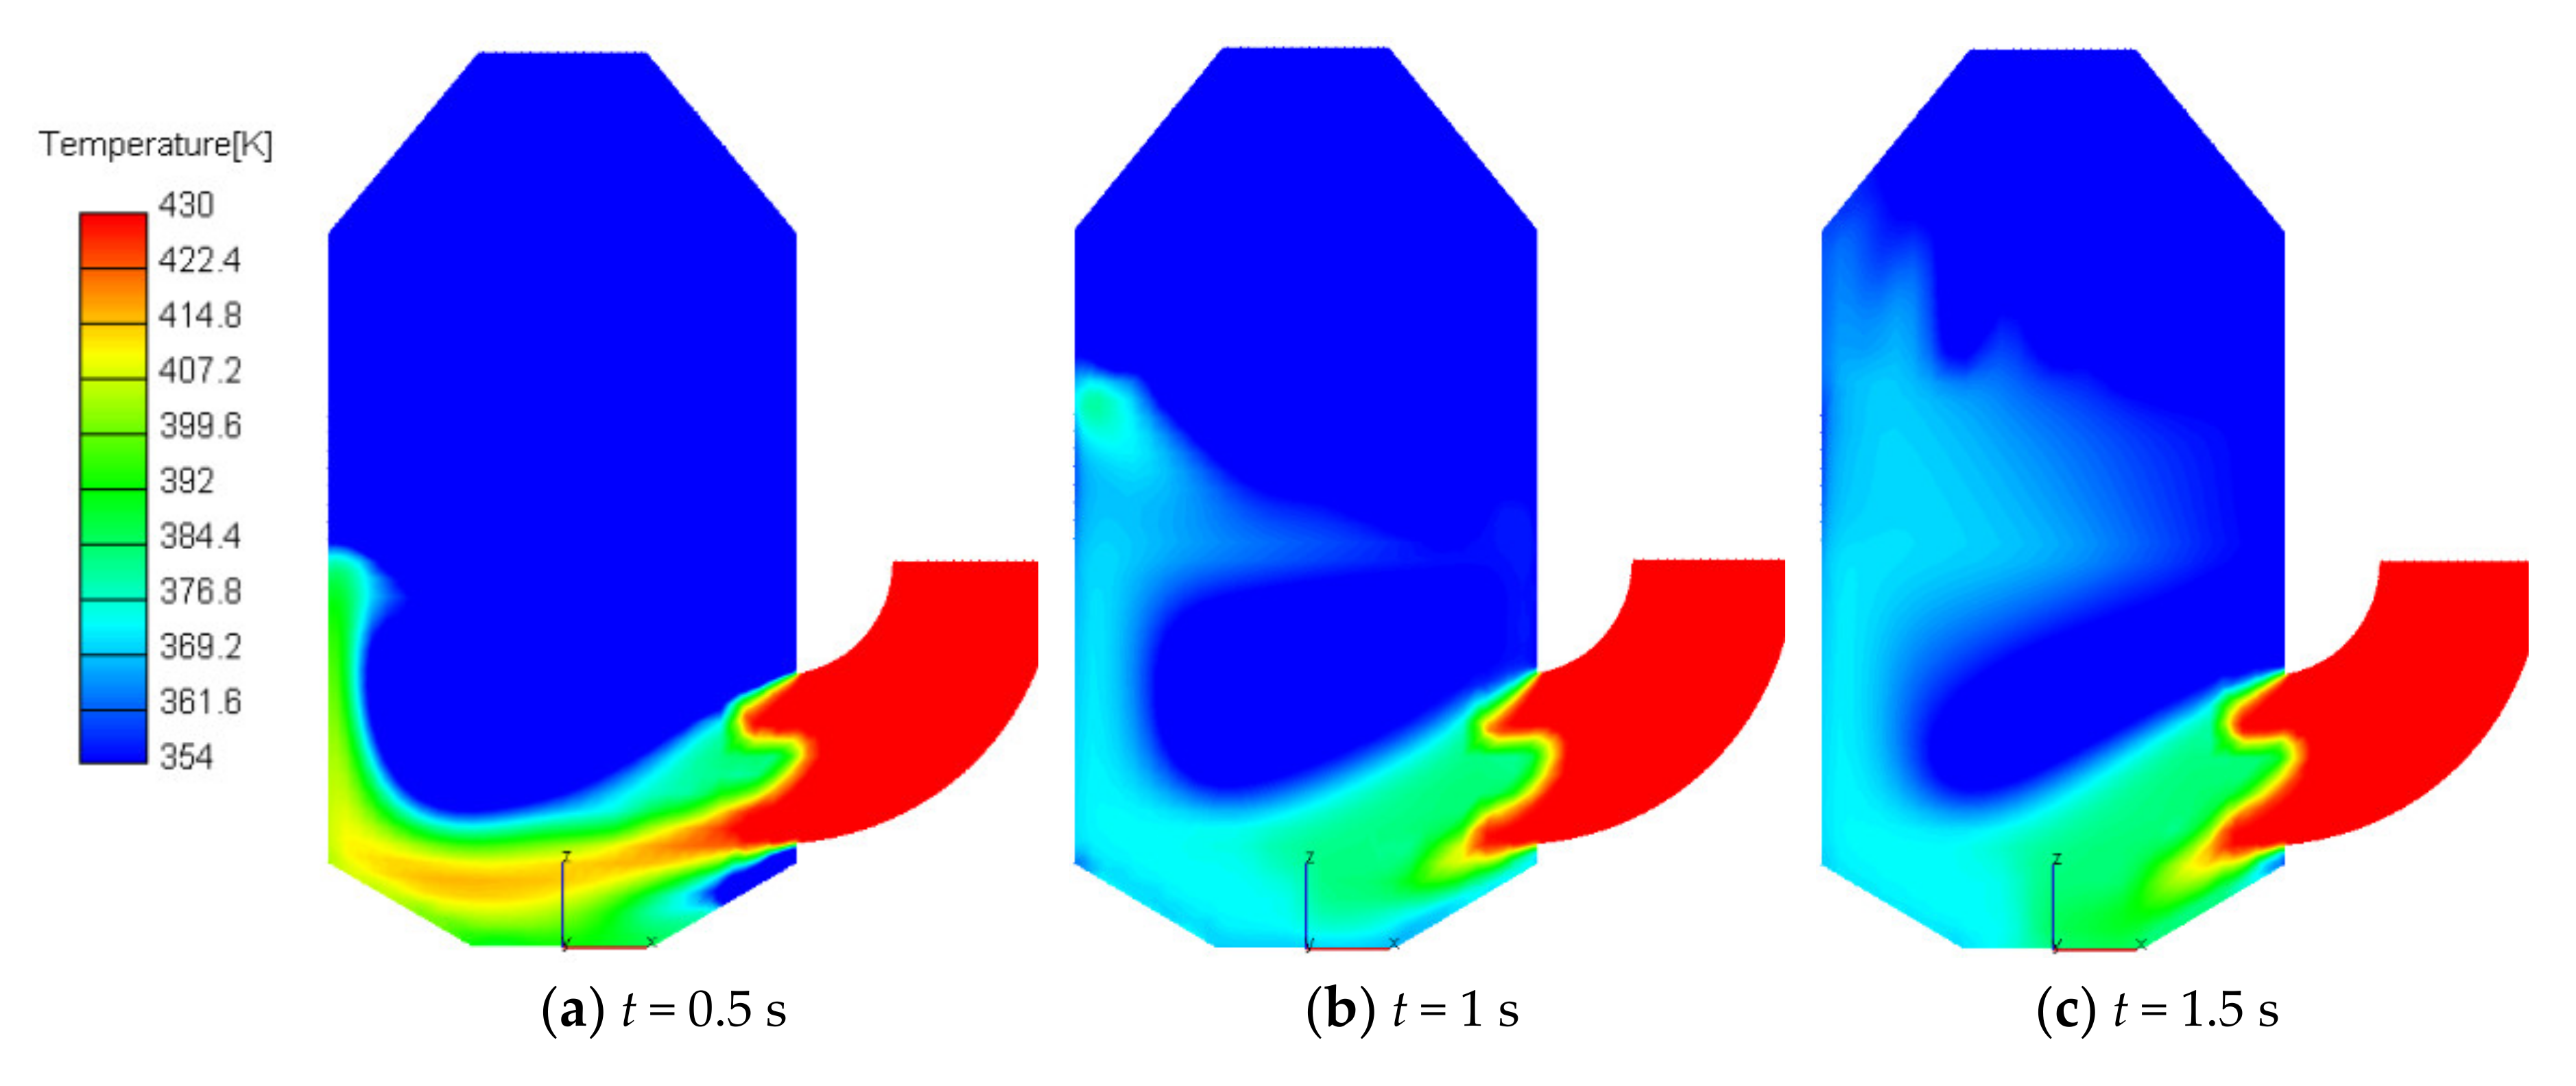
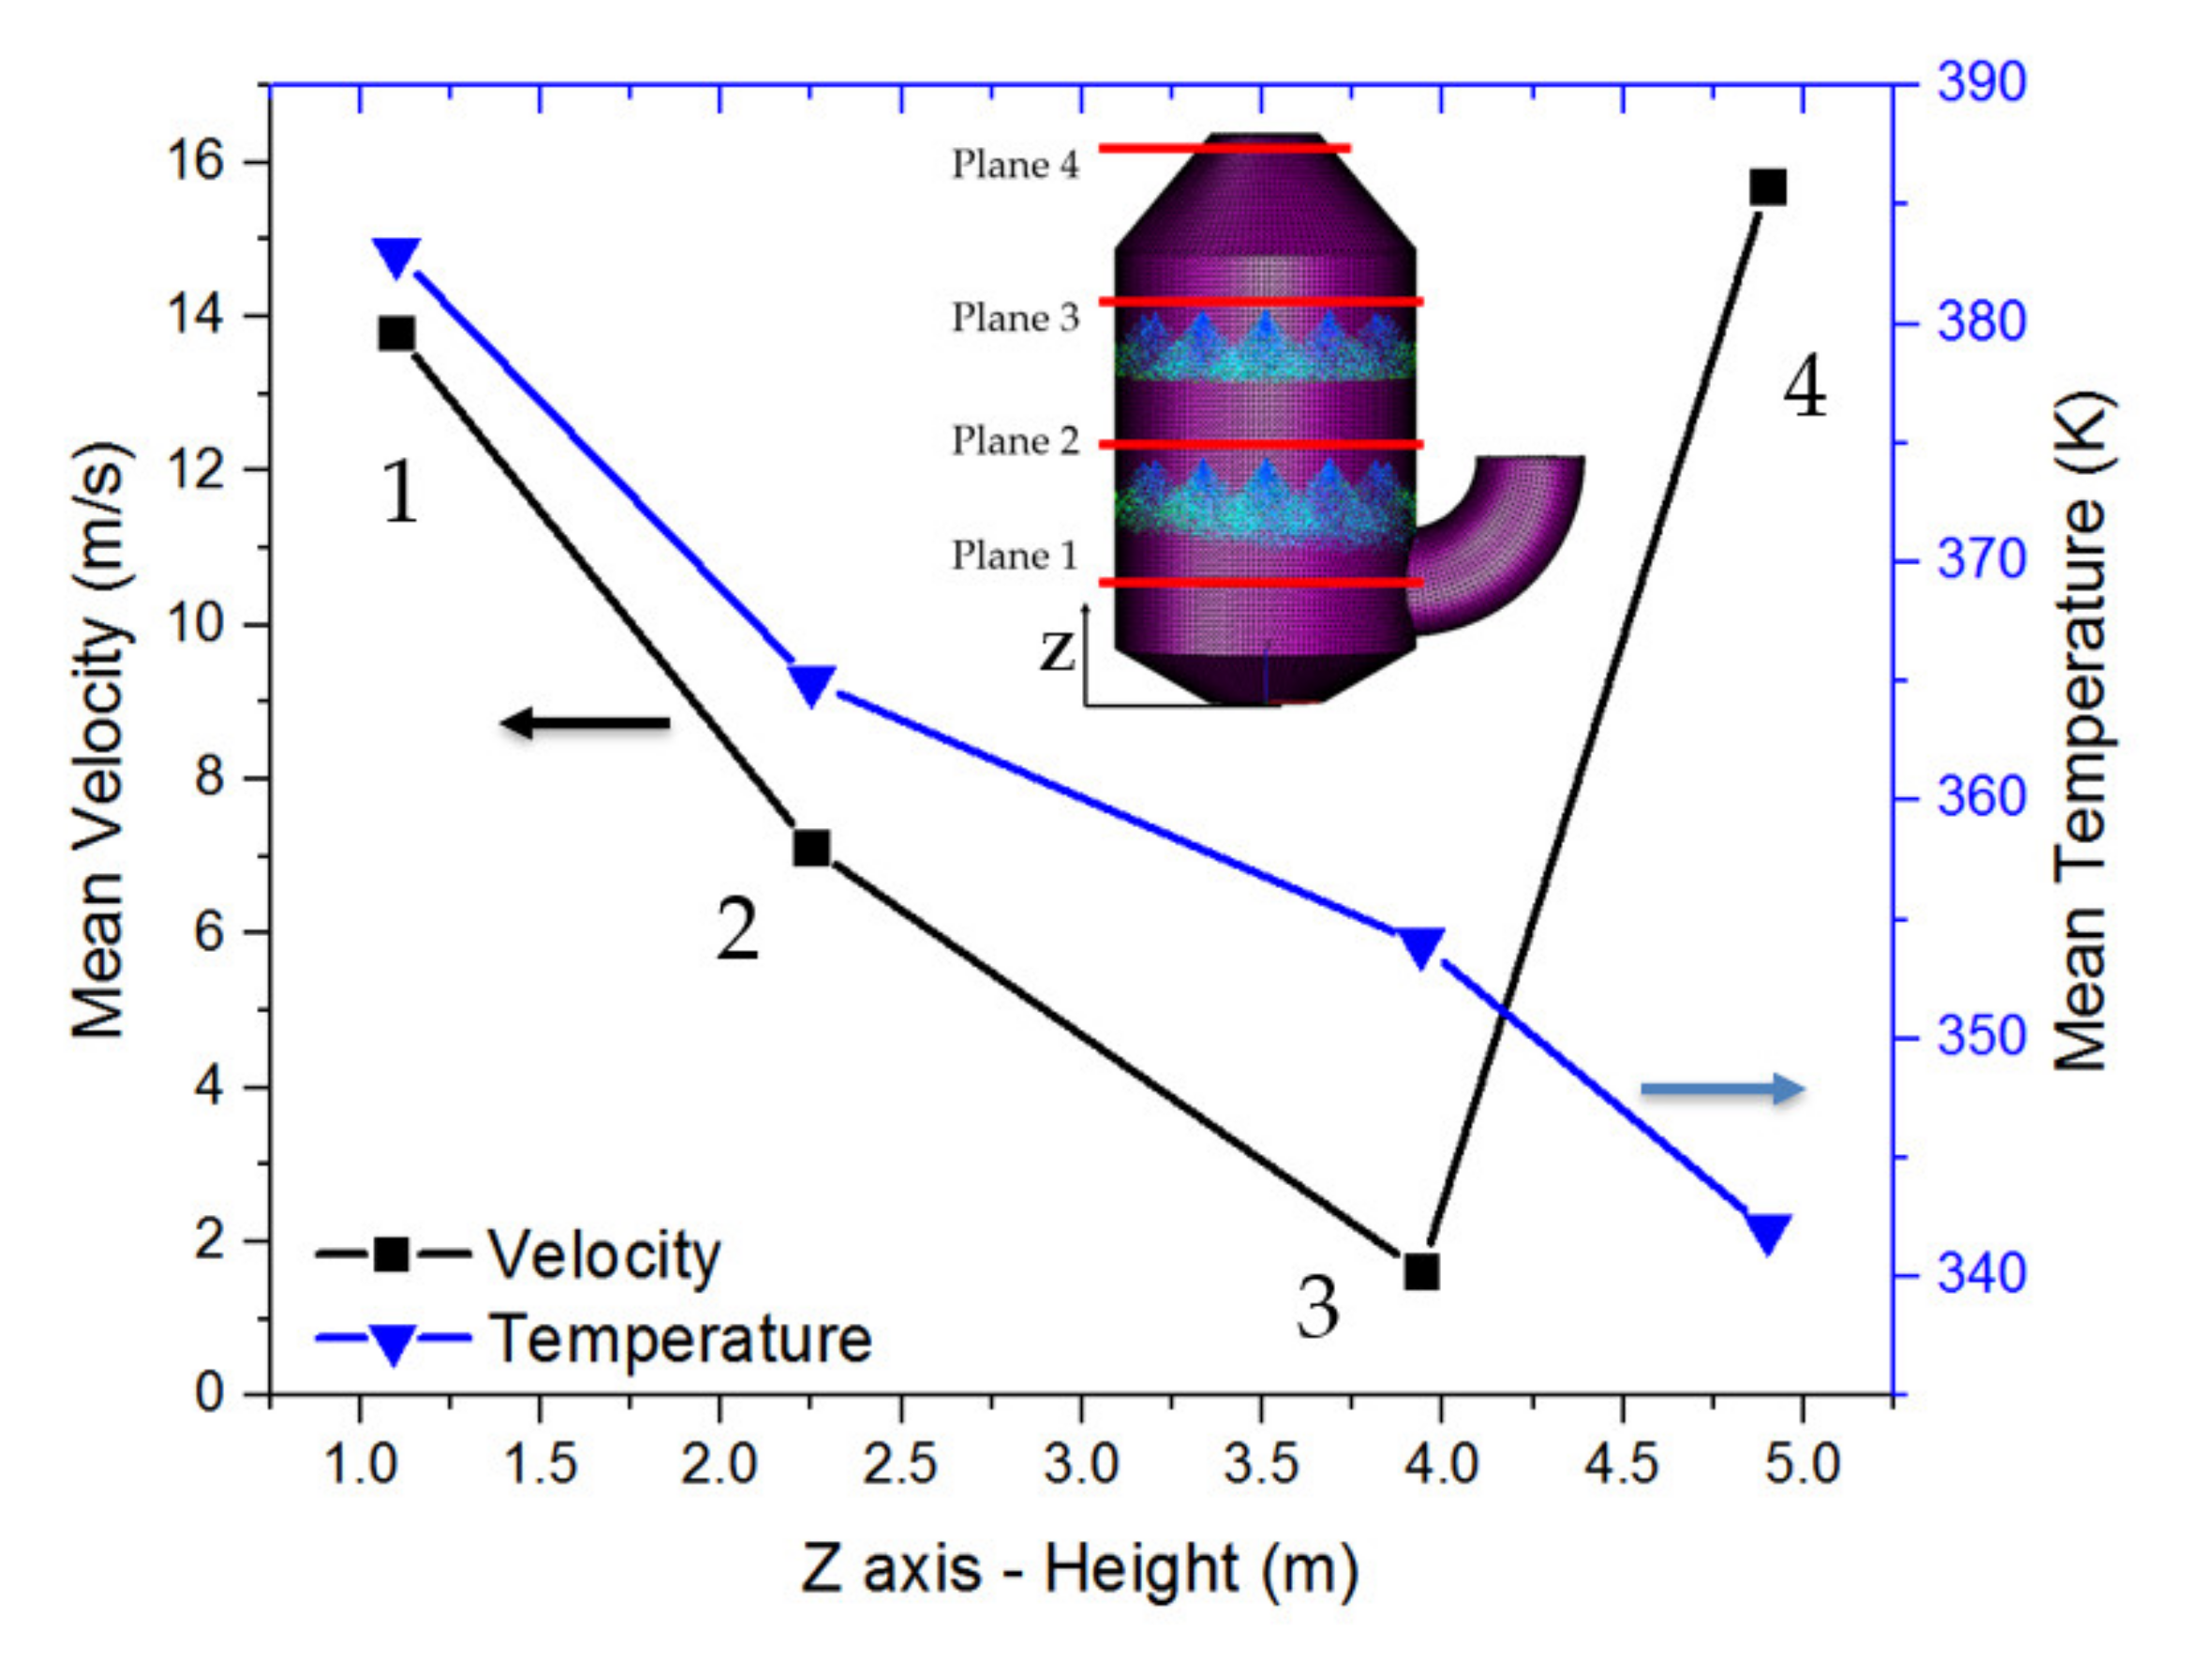
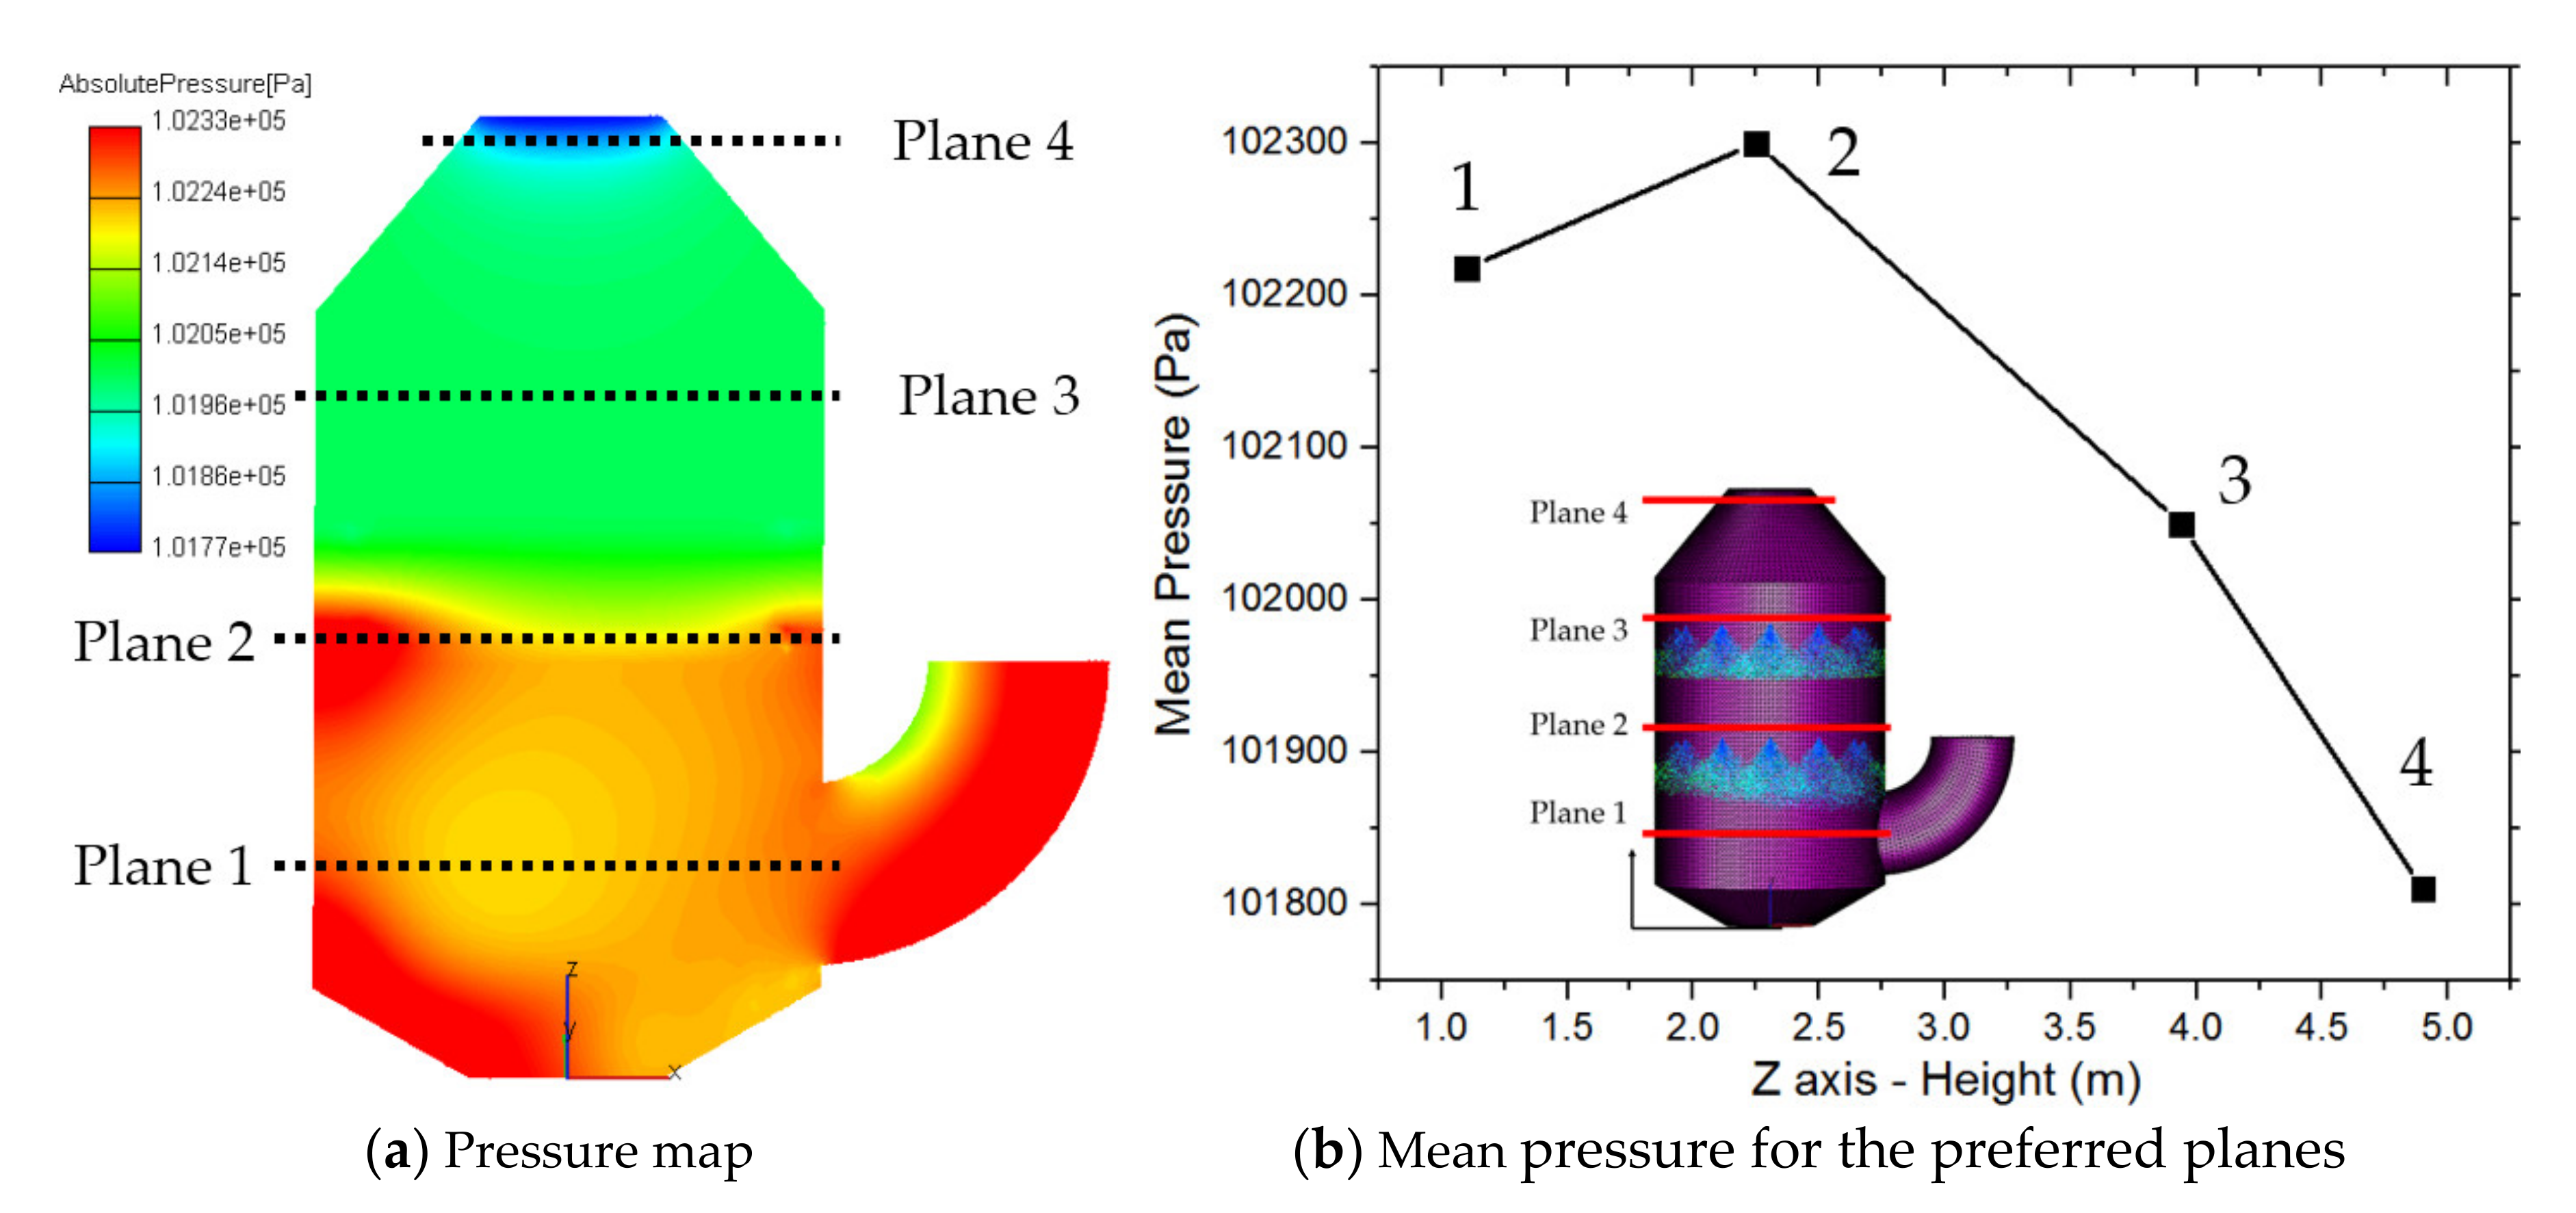
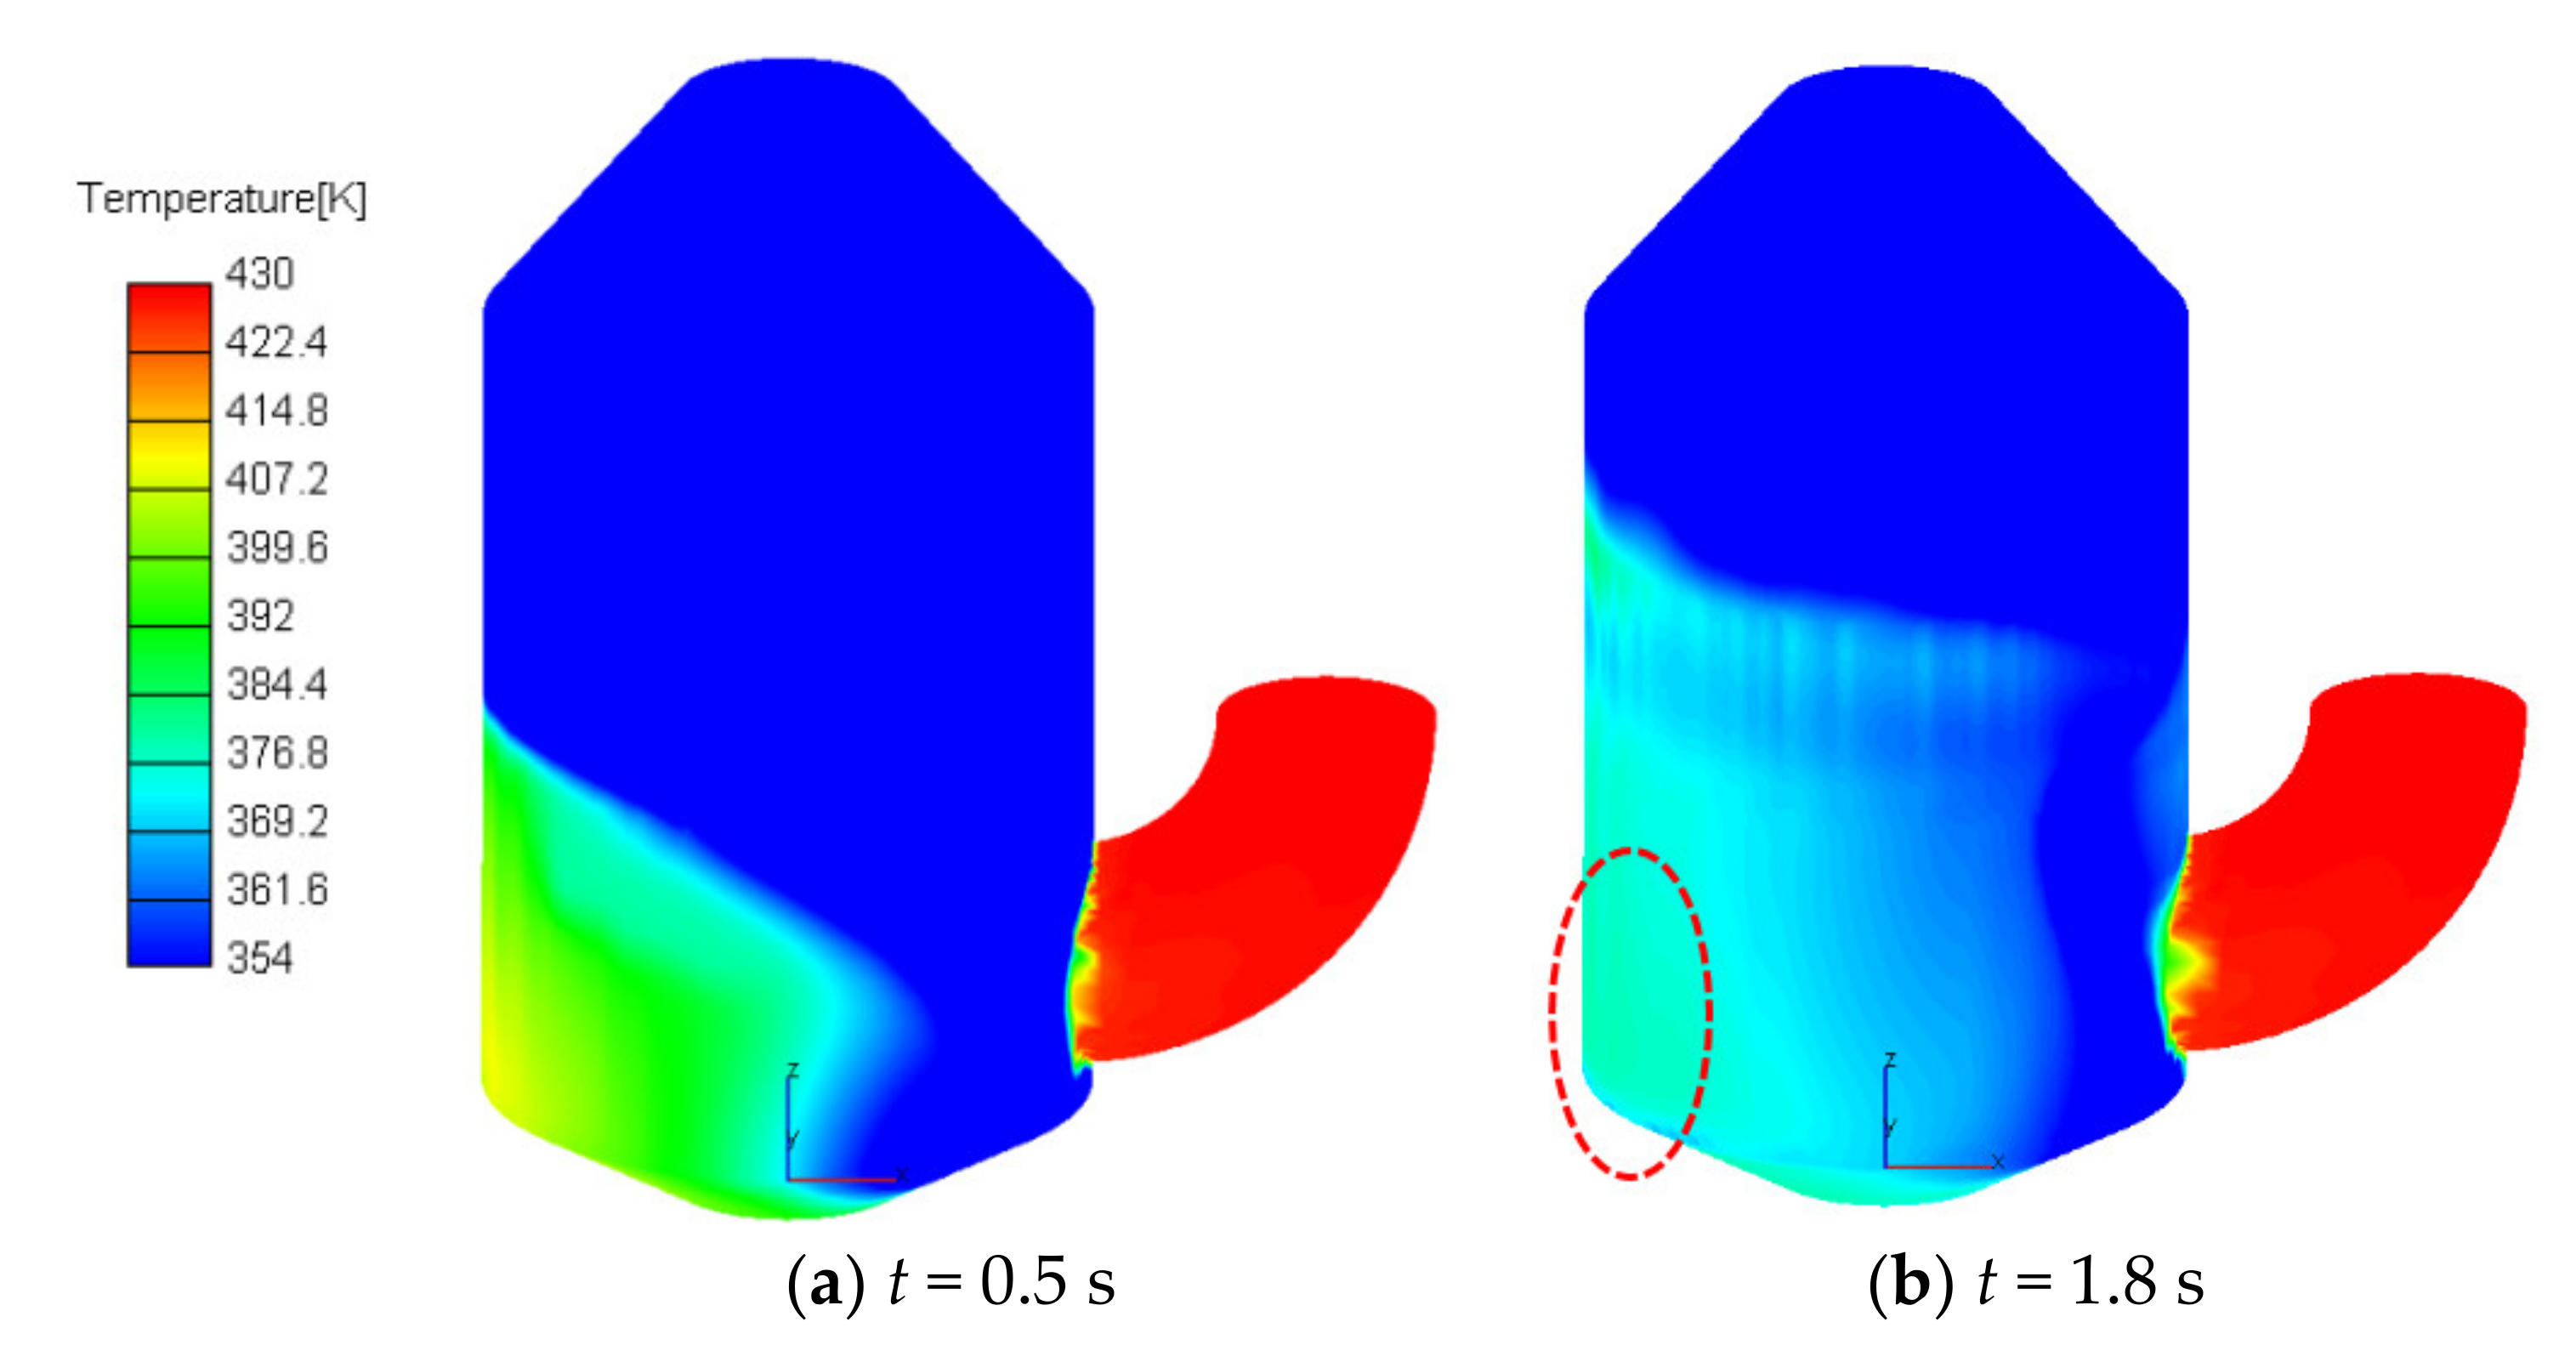
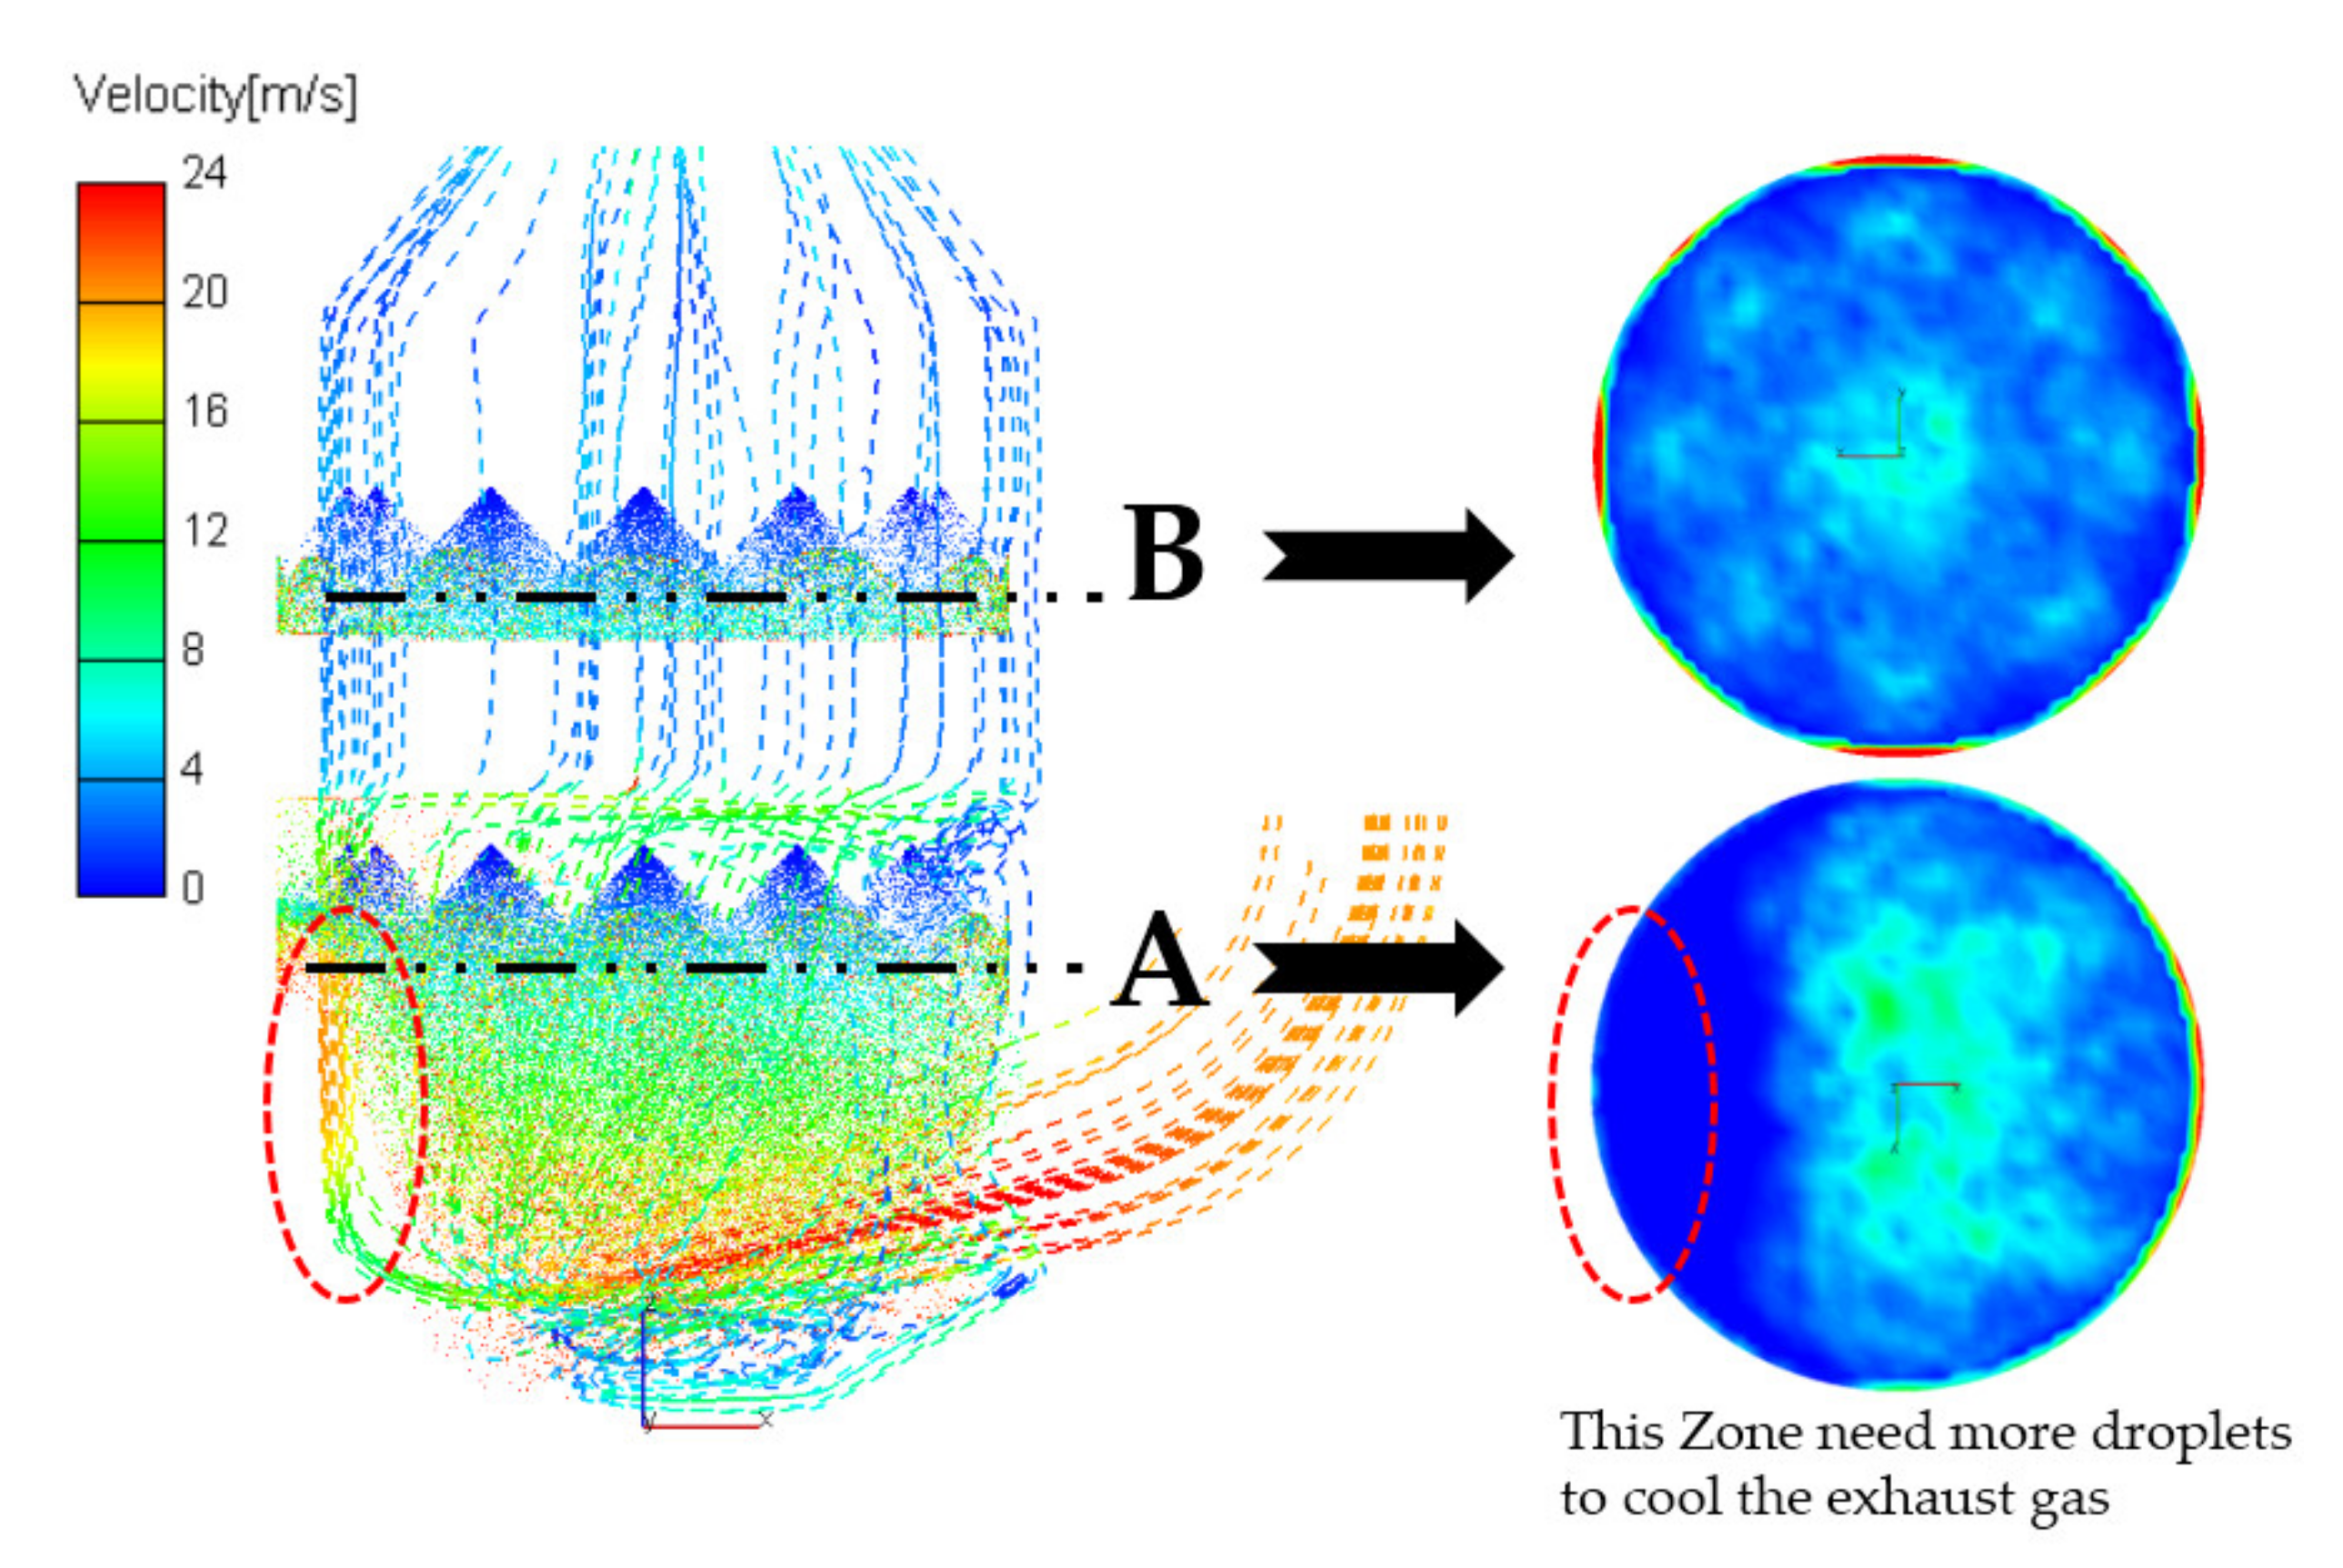
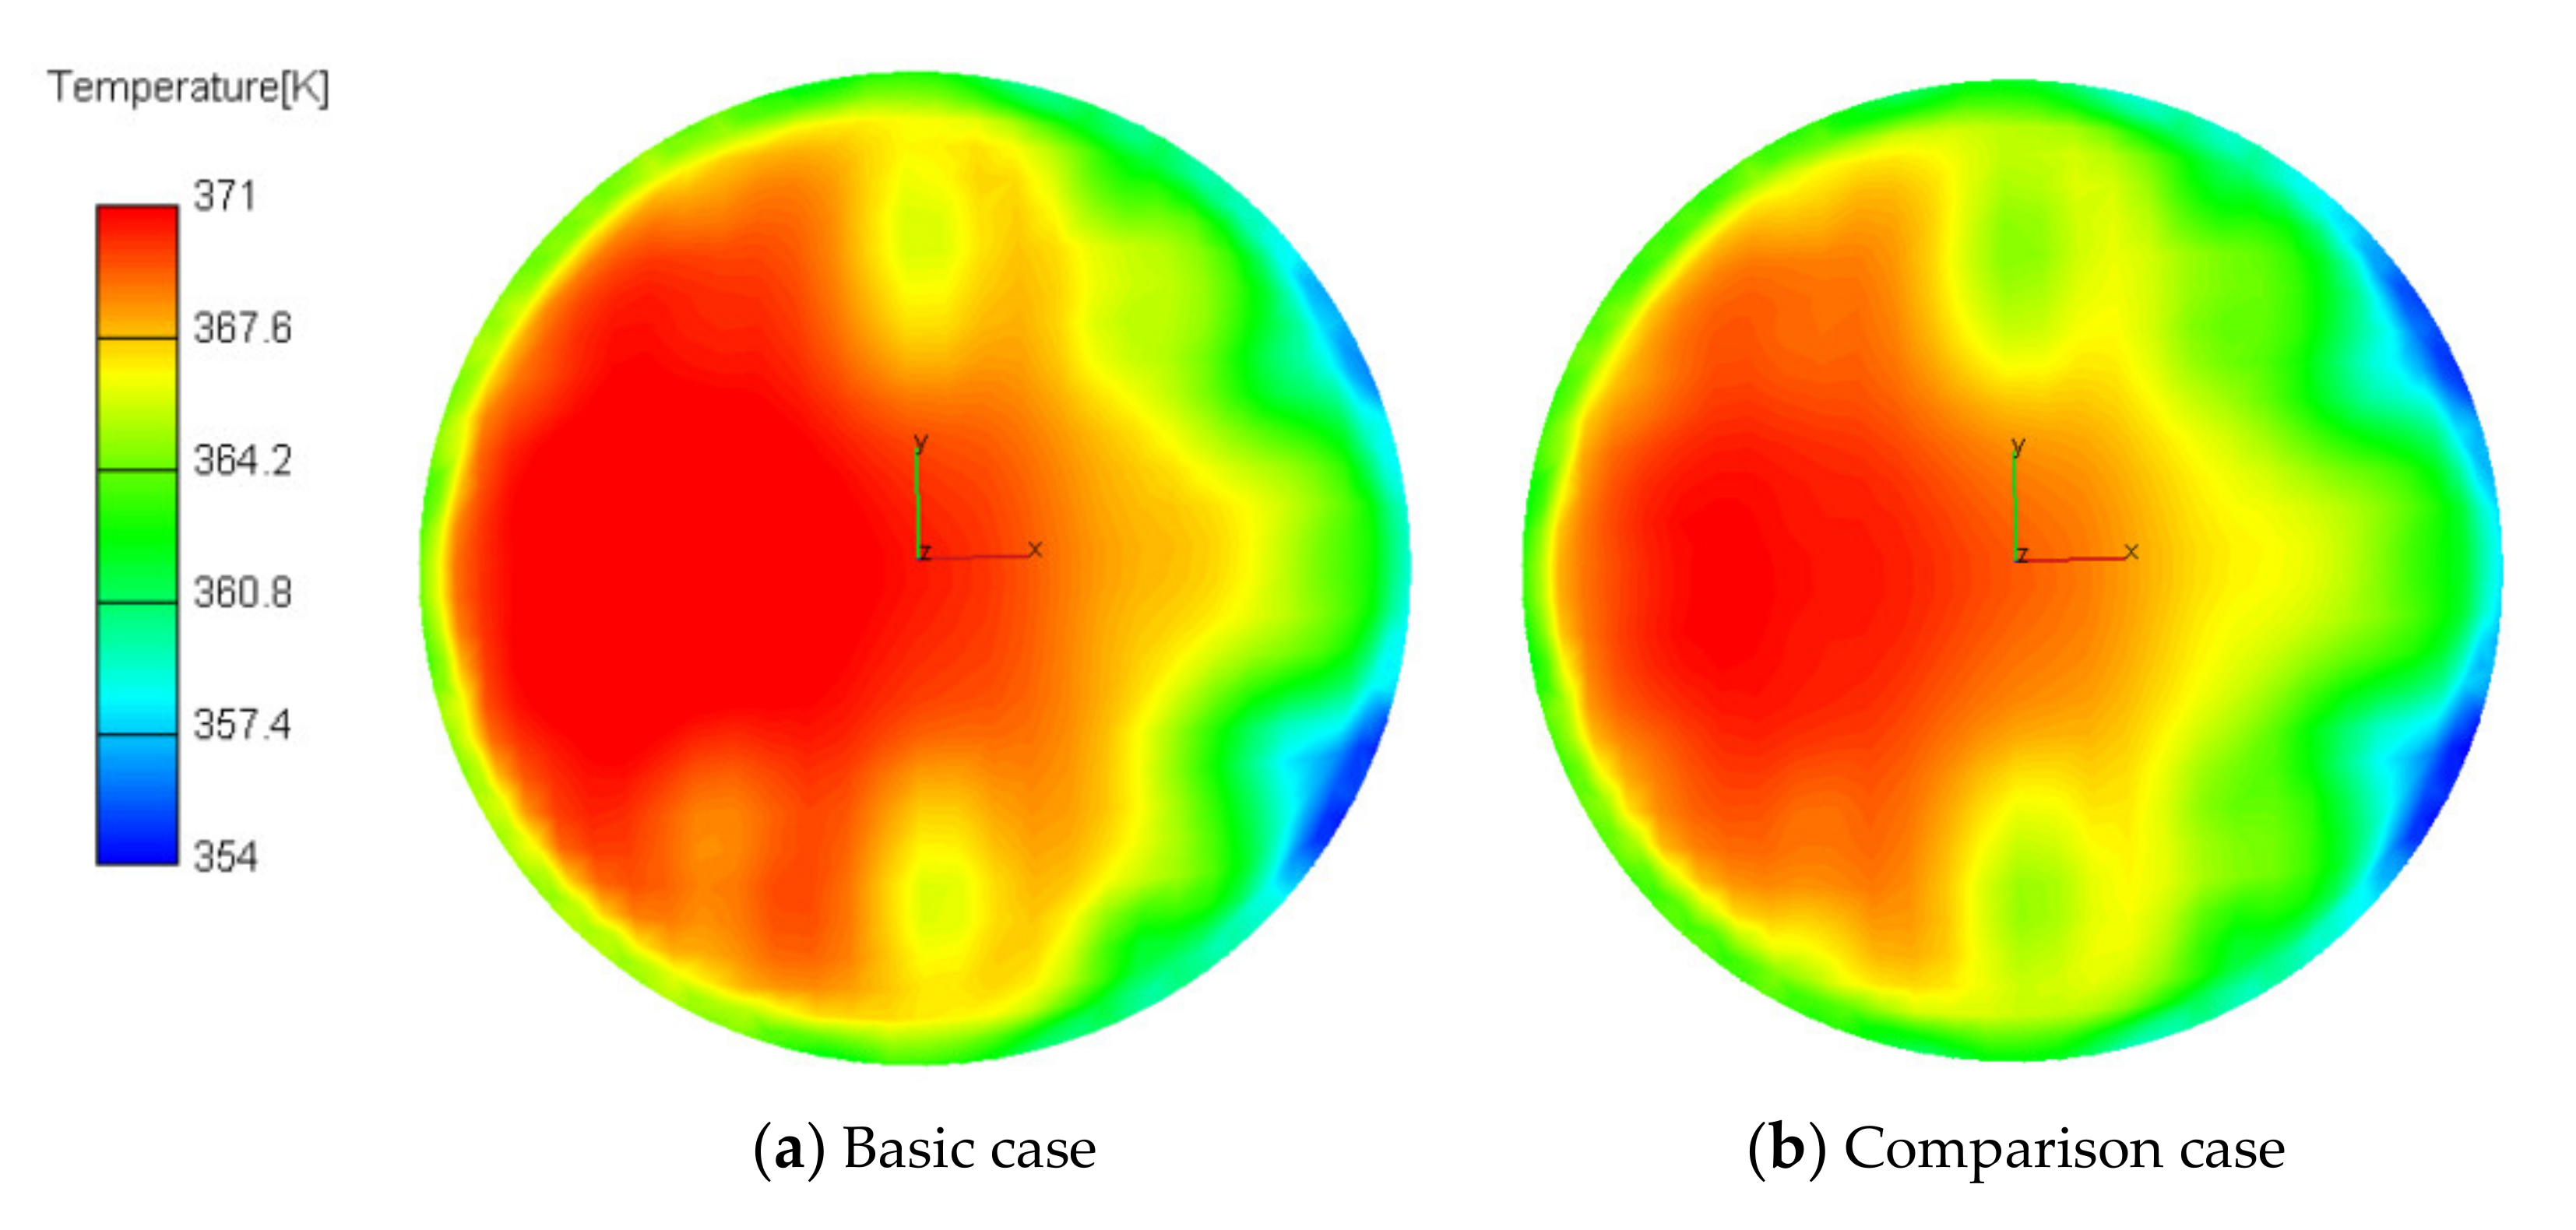
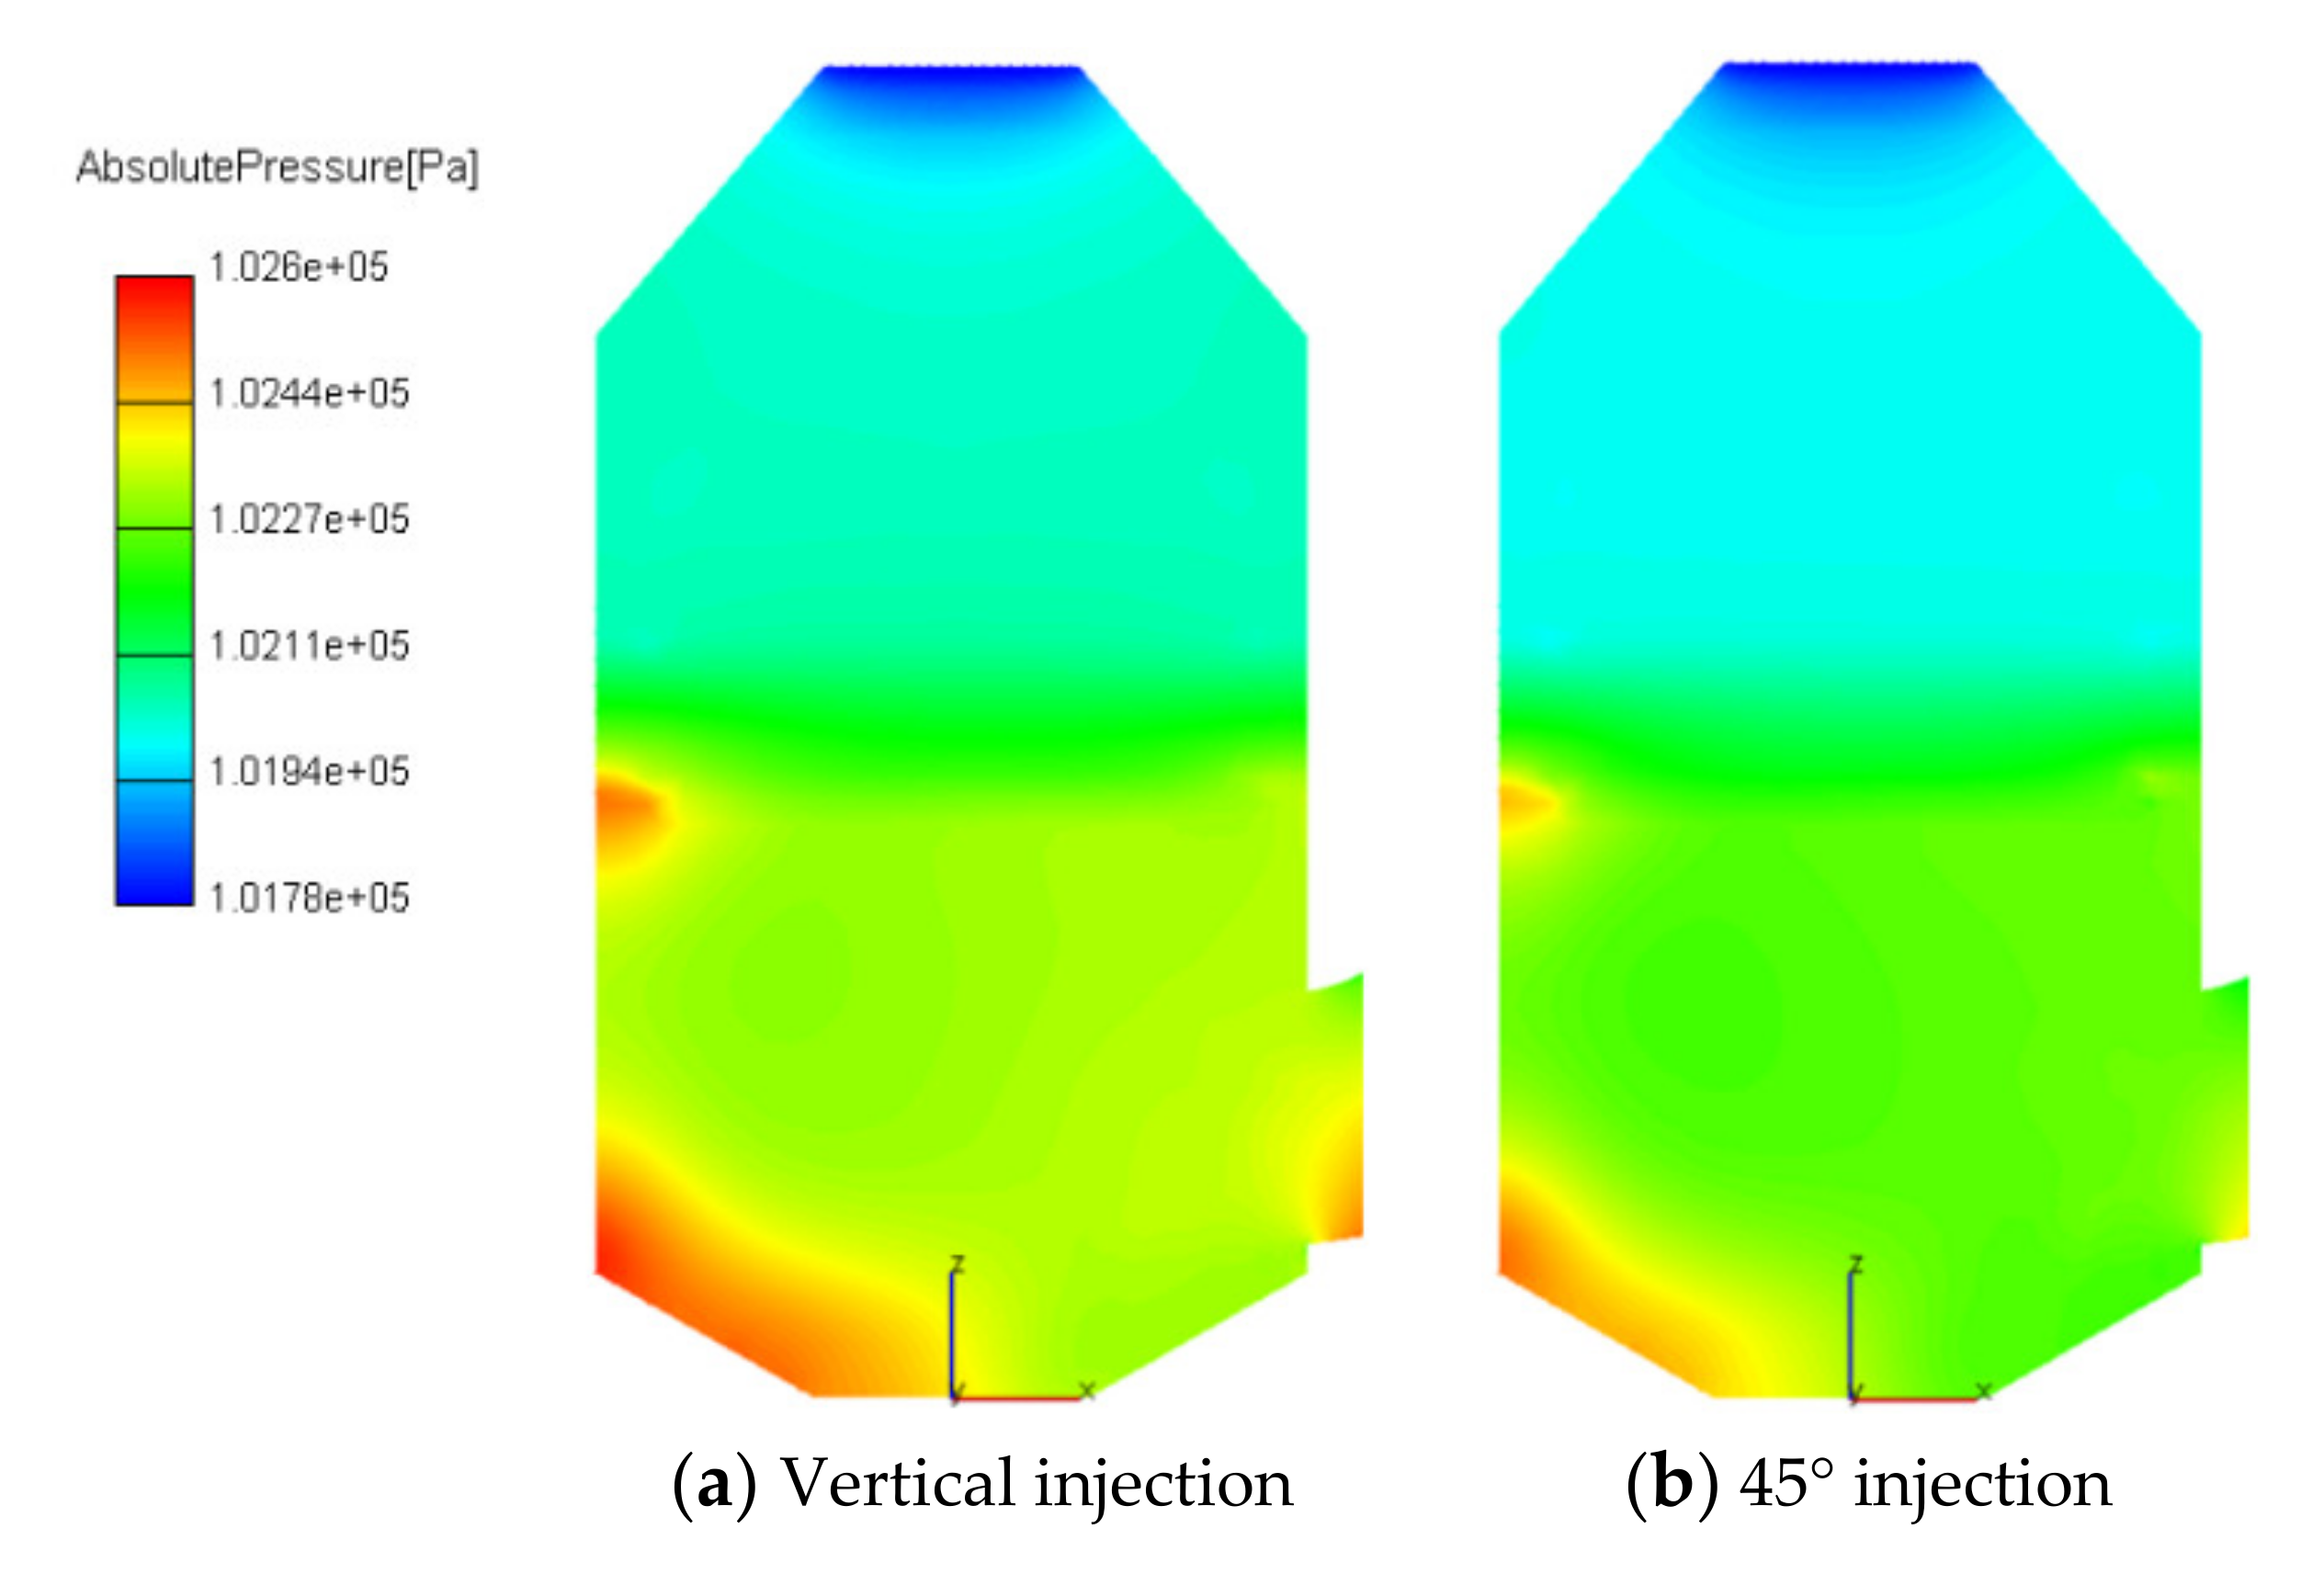
The exhaust gas was concentrated in the left side area of the scrubber and this part of exhaust gas could escape from the scrubber with a bad De-SOx efficiency. In the lower area of the scrubber, the temperature dropped the fastest of all. The influence of droplets velocity and temperature was the reason for the rise and fall of pressure in the marine De-SOx scrubber design.
(2)
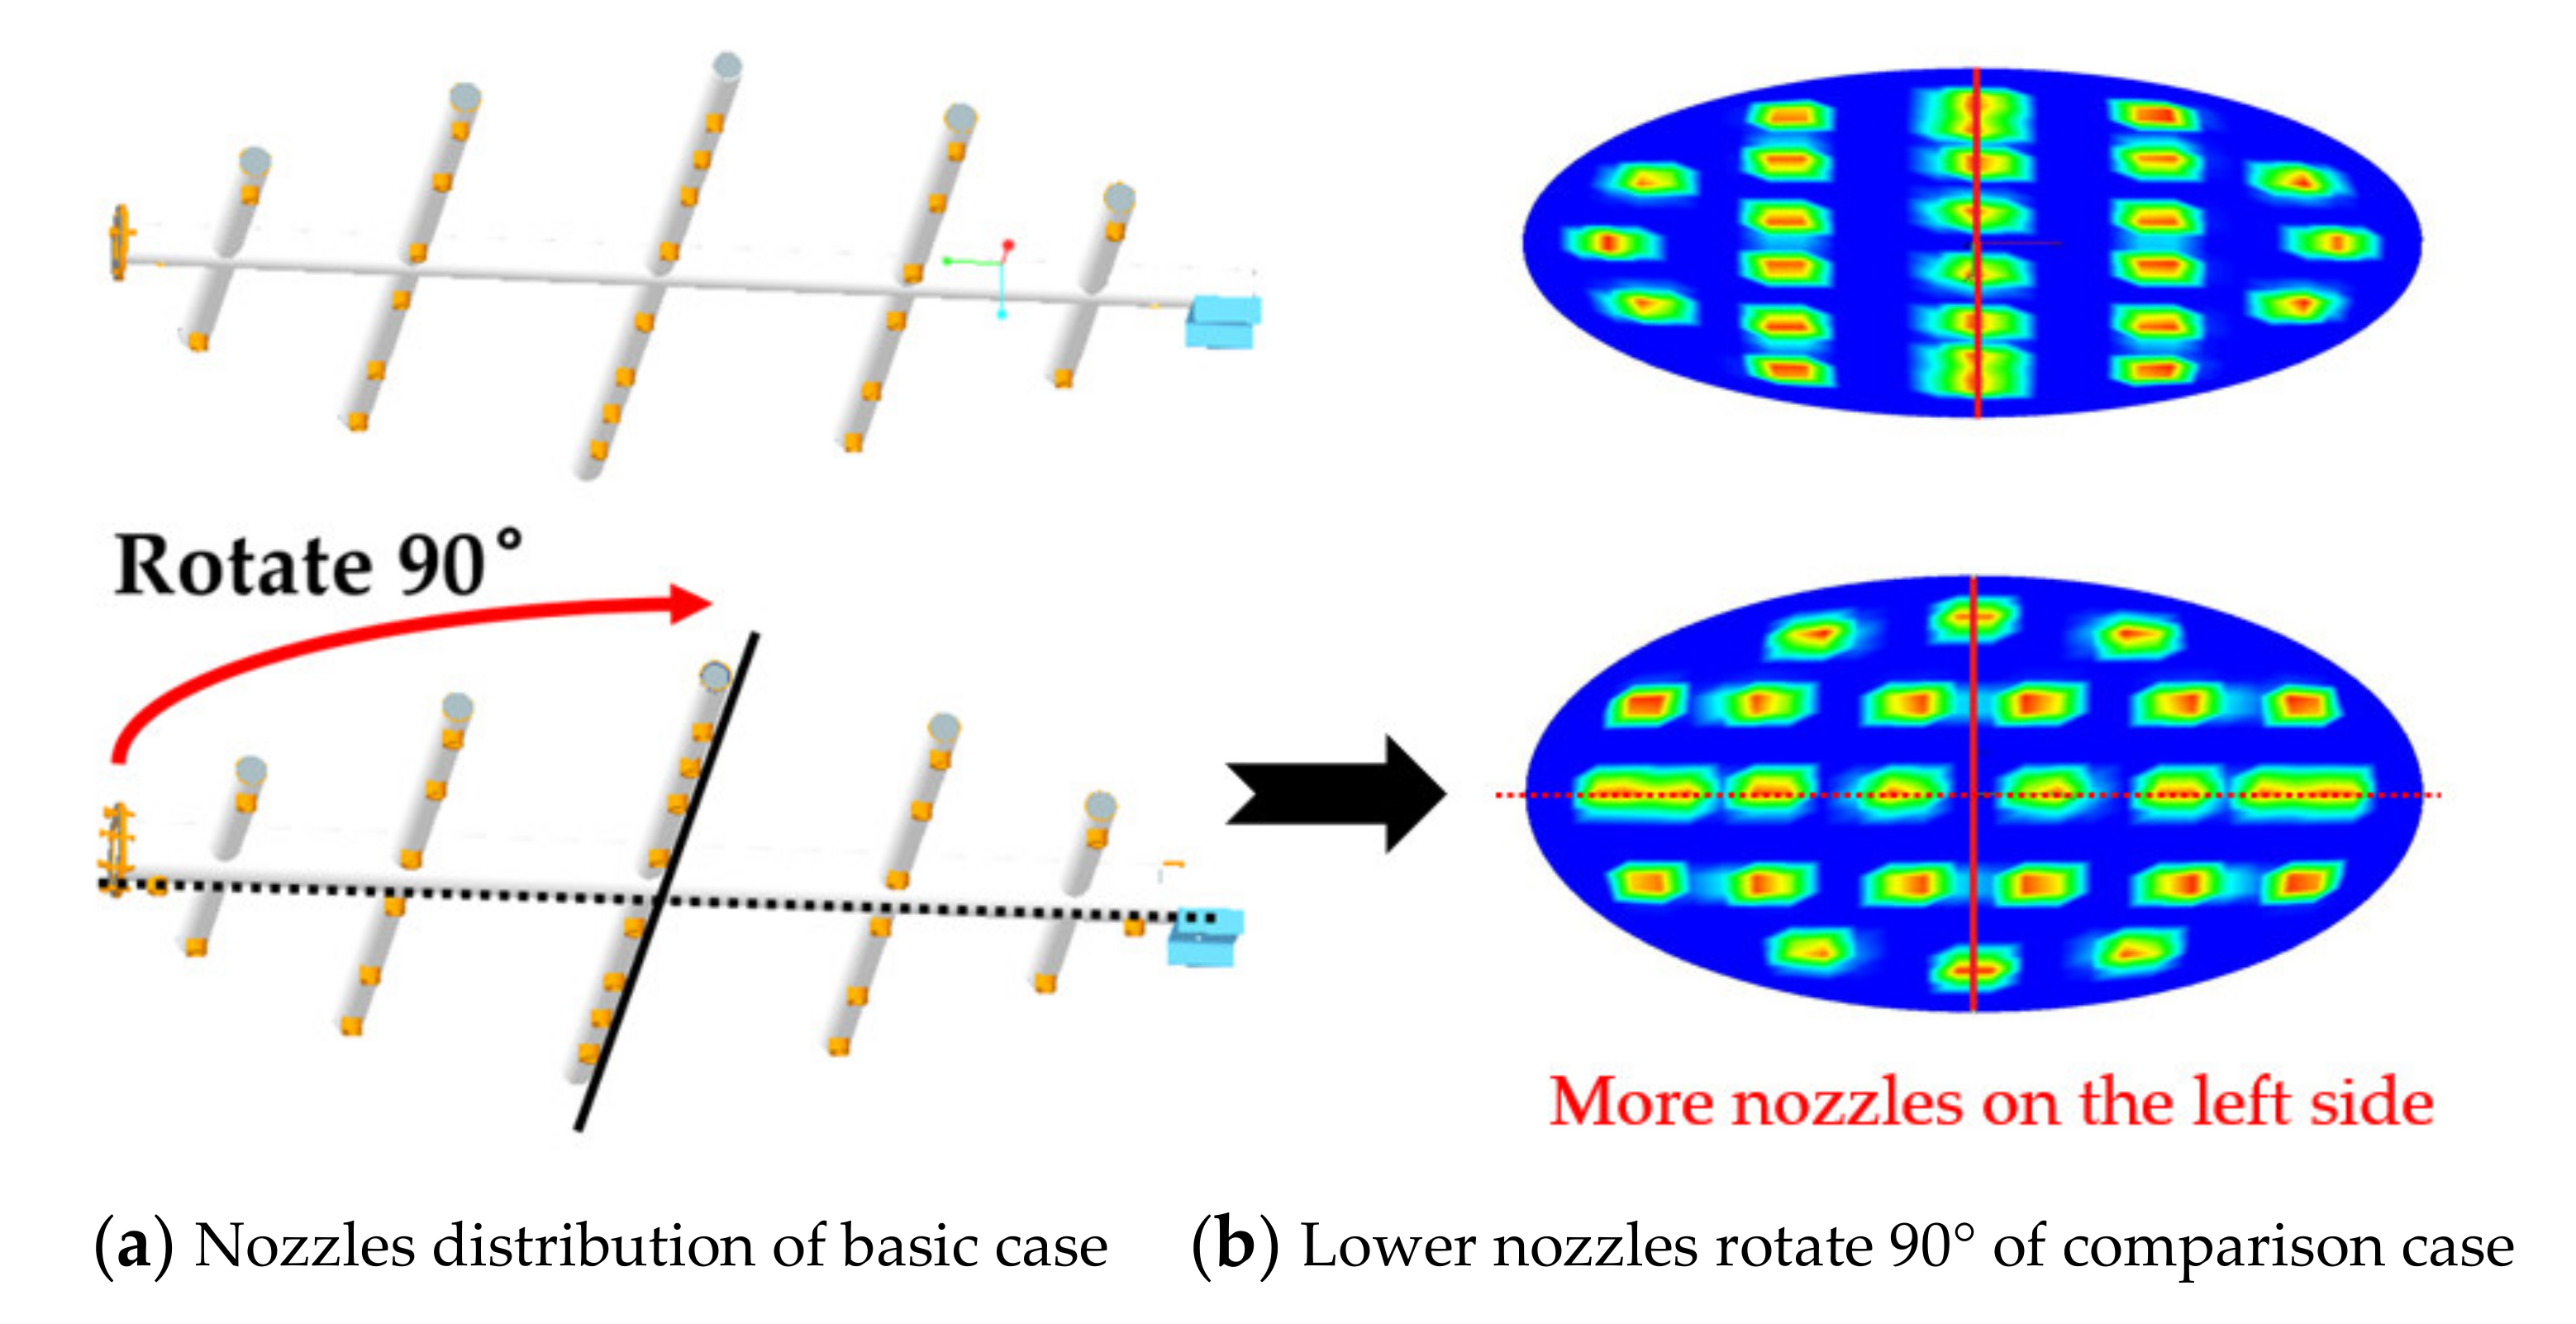
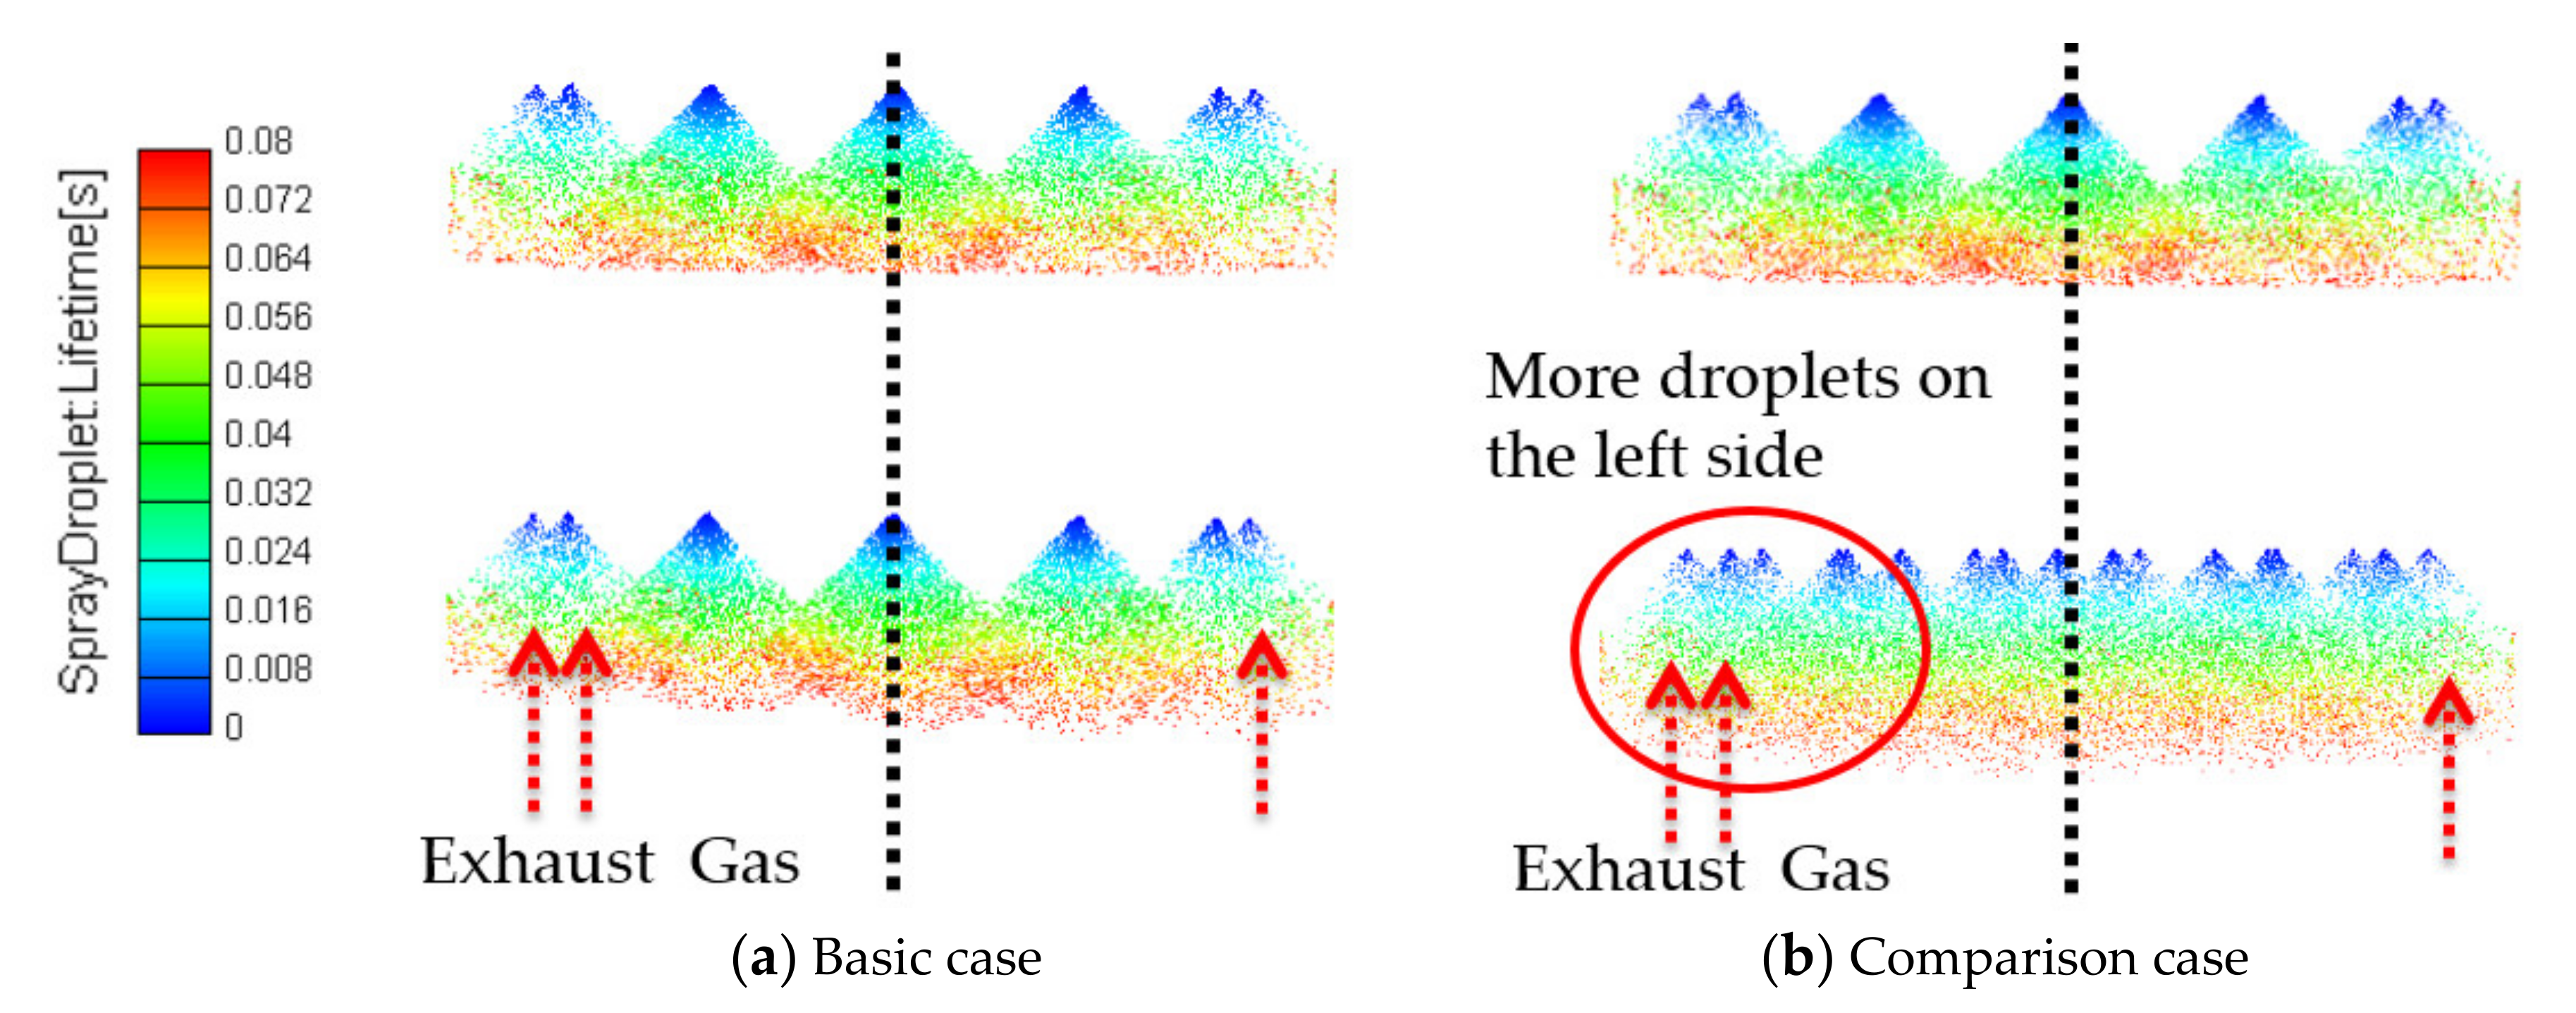
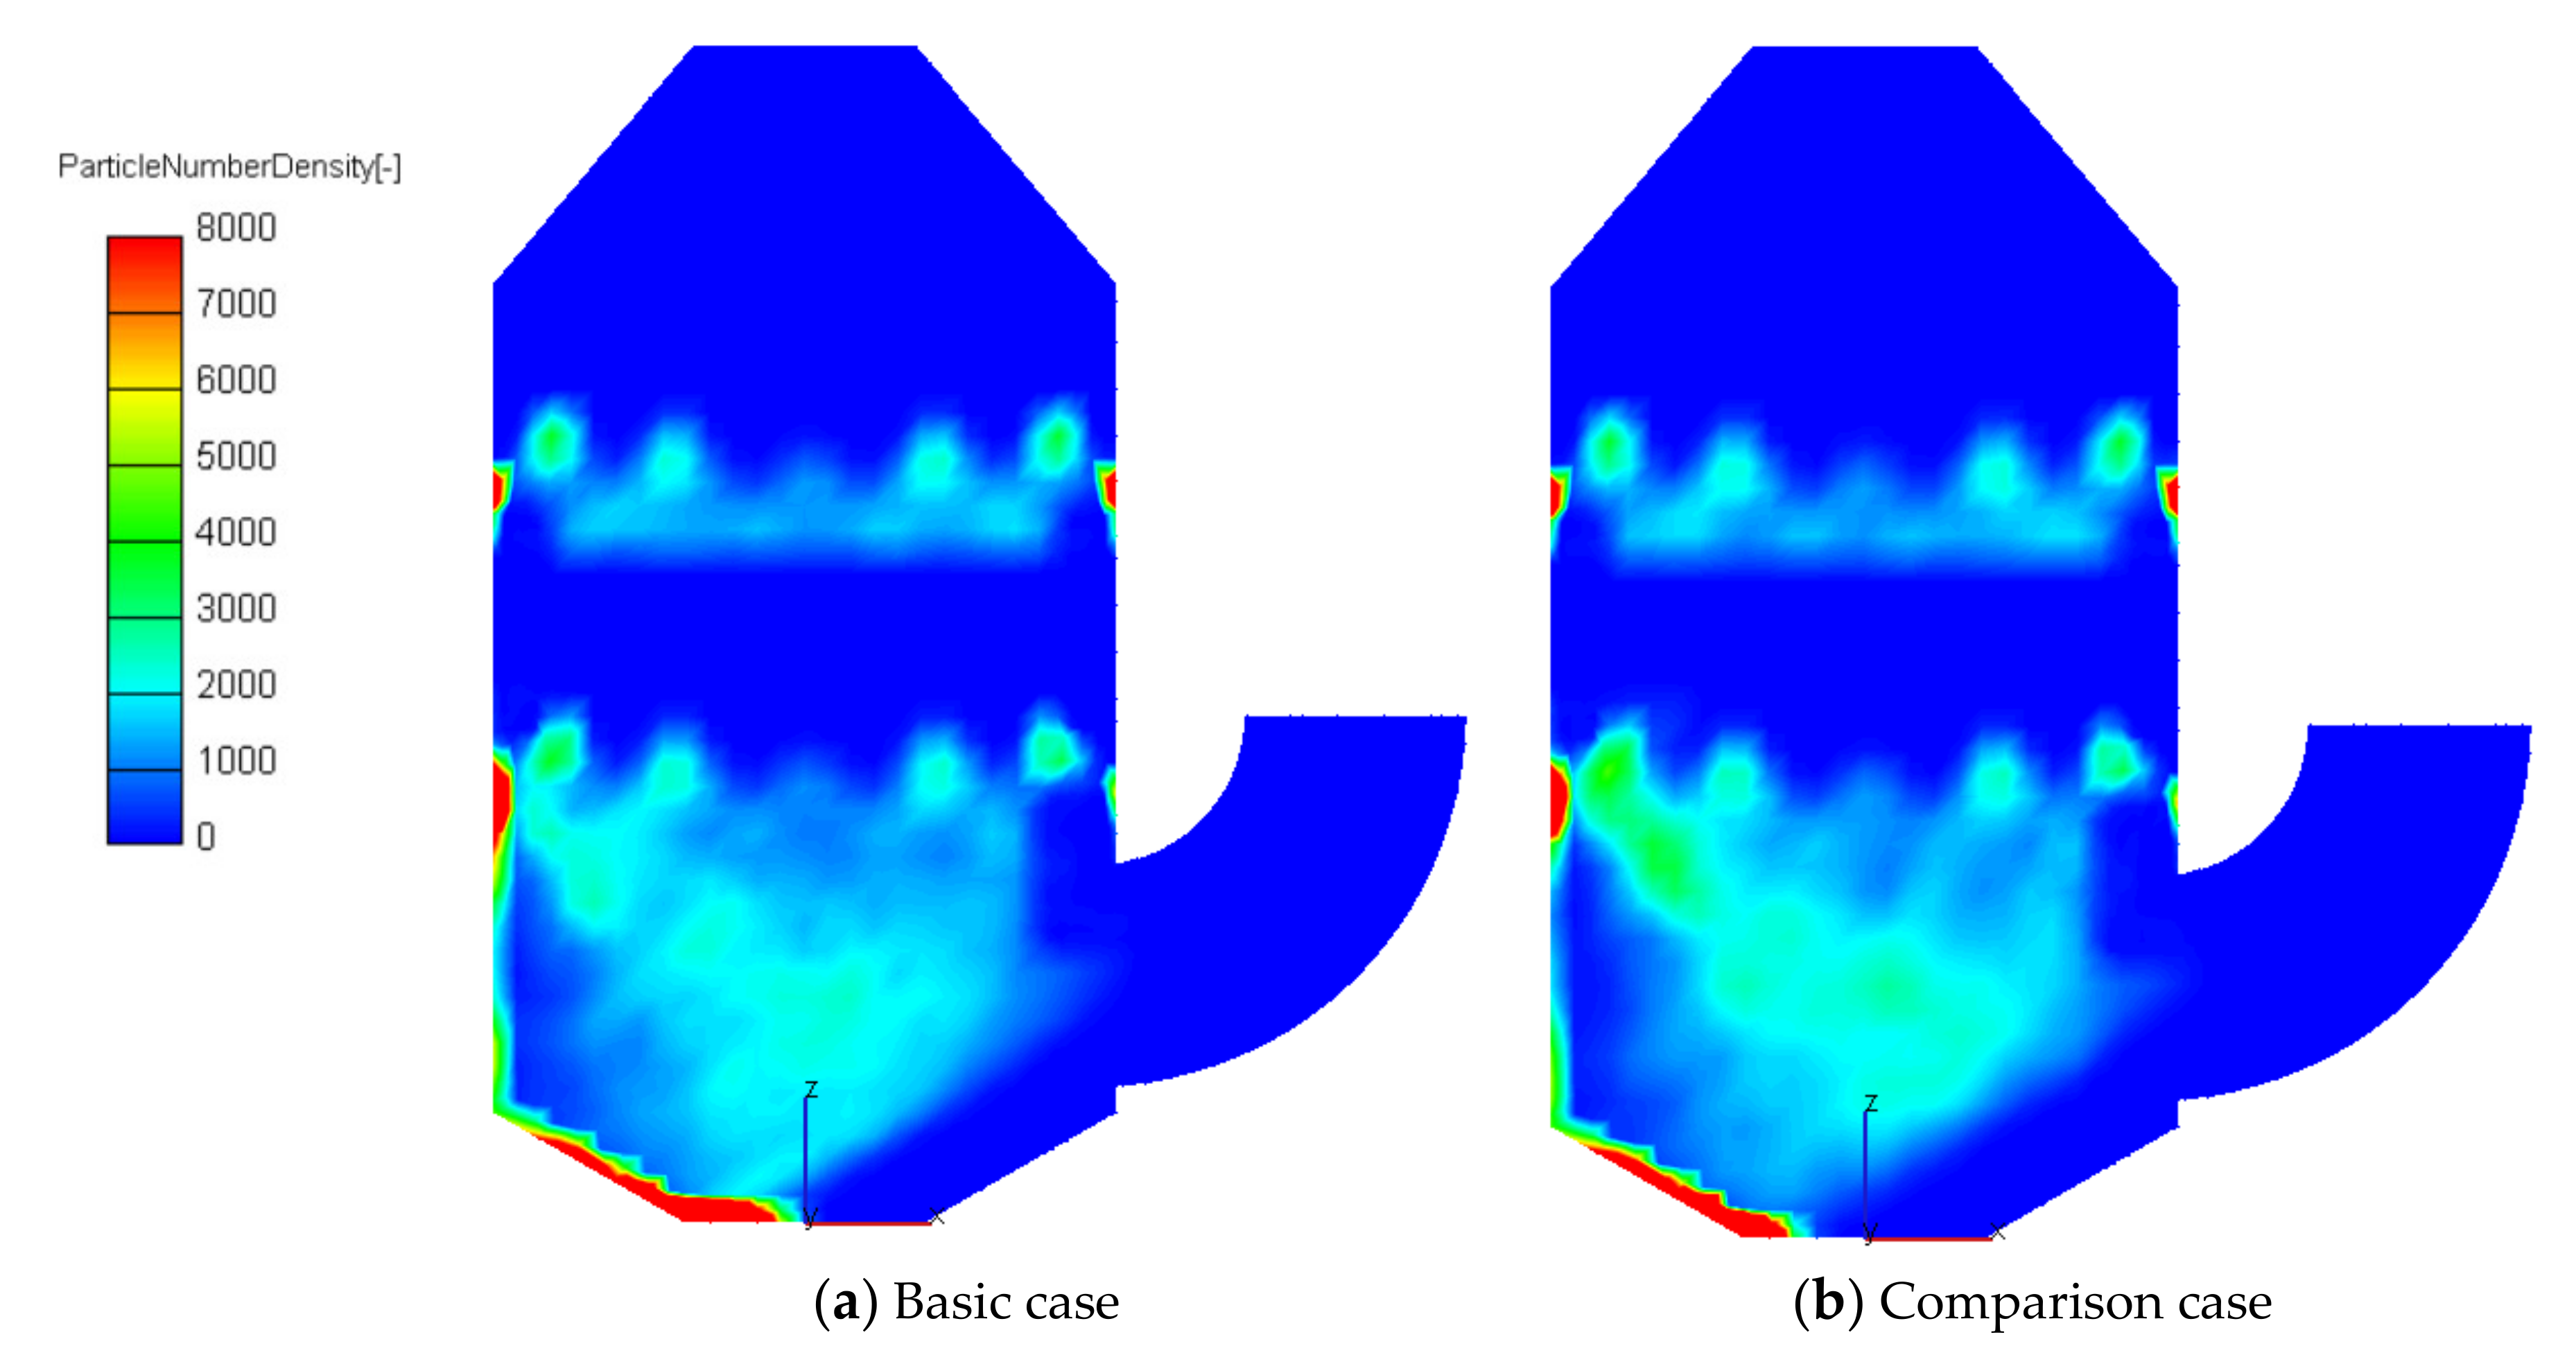
Controlling the nozzles distribution reduced the droplets to hit the wall and improved the utilization rate of the washing liquid. The nozzles were arranged up and down in different positions, which increased the spray density in the strong offset area of exhaust gas on the left side of the scrubber and reduced the escape amount of exhaust gas. Moreover, the new arrangement of nozzles made the flow field distribution in the scrubber more uniform and increased the gas–liquid reaction time, which further improved the desulfurization efficiency of the scrubber.
(3)
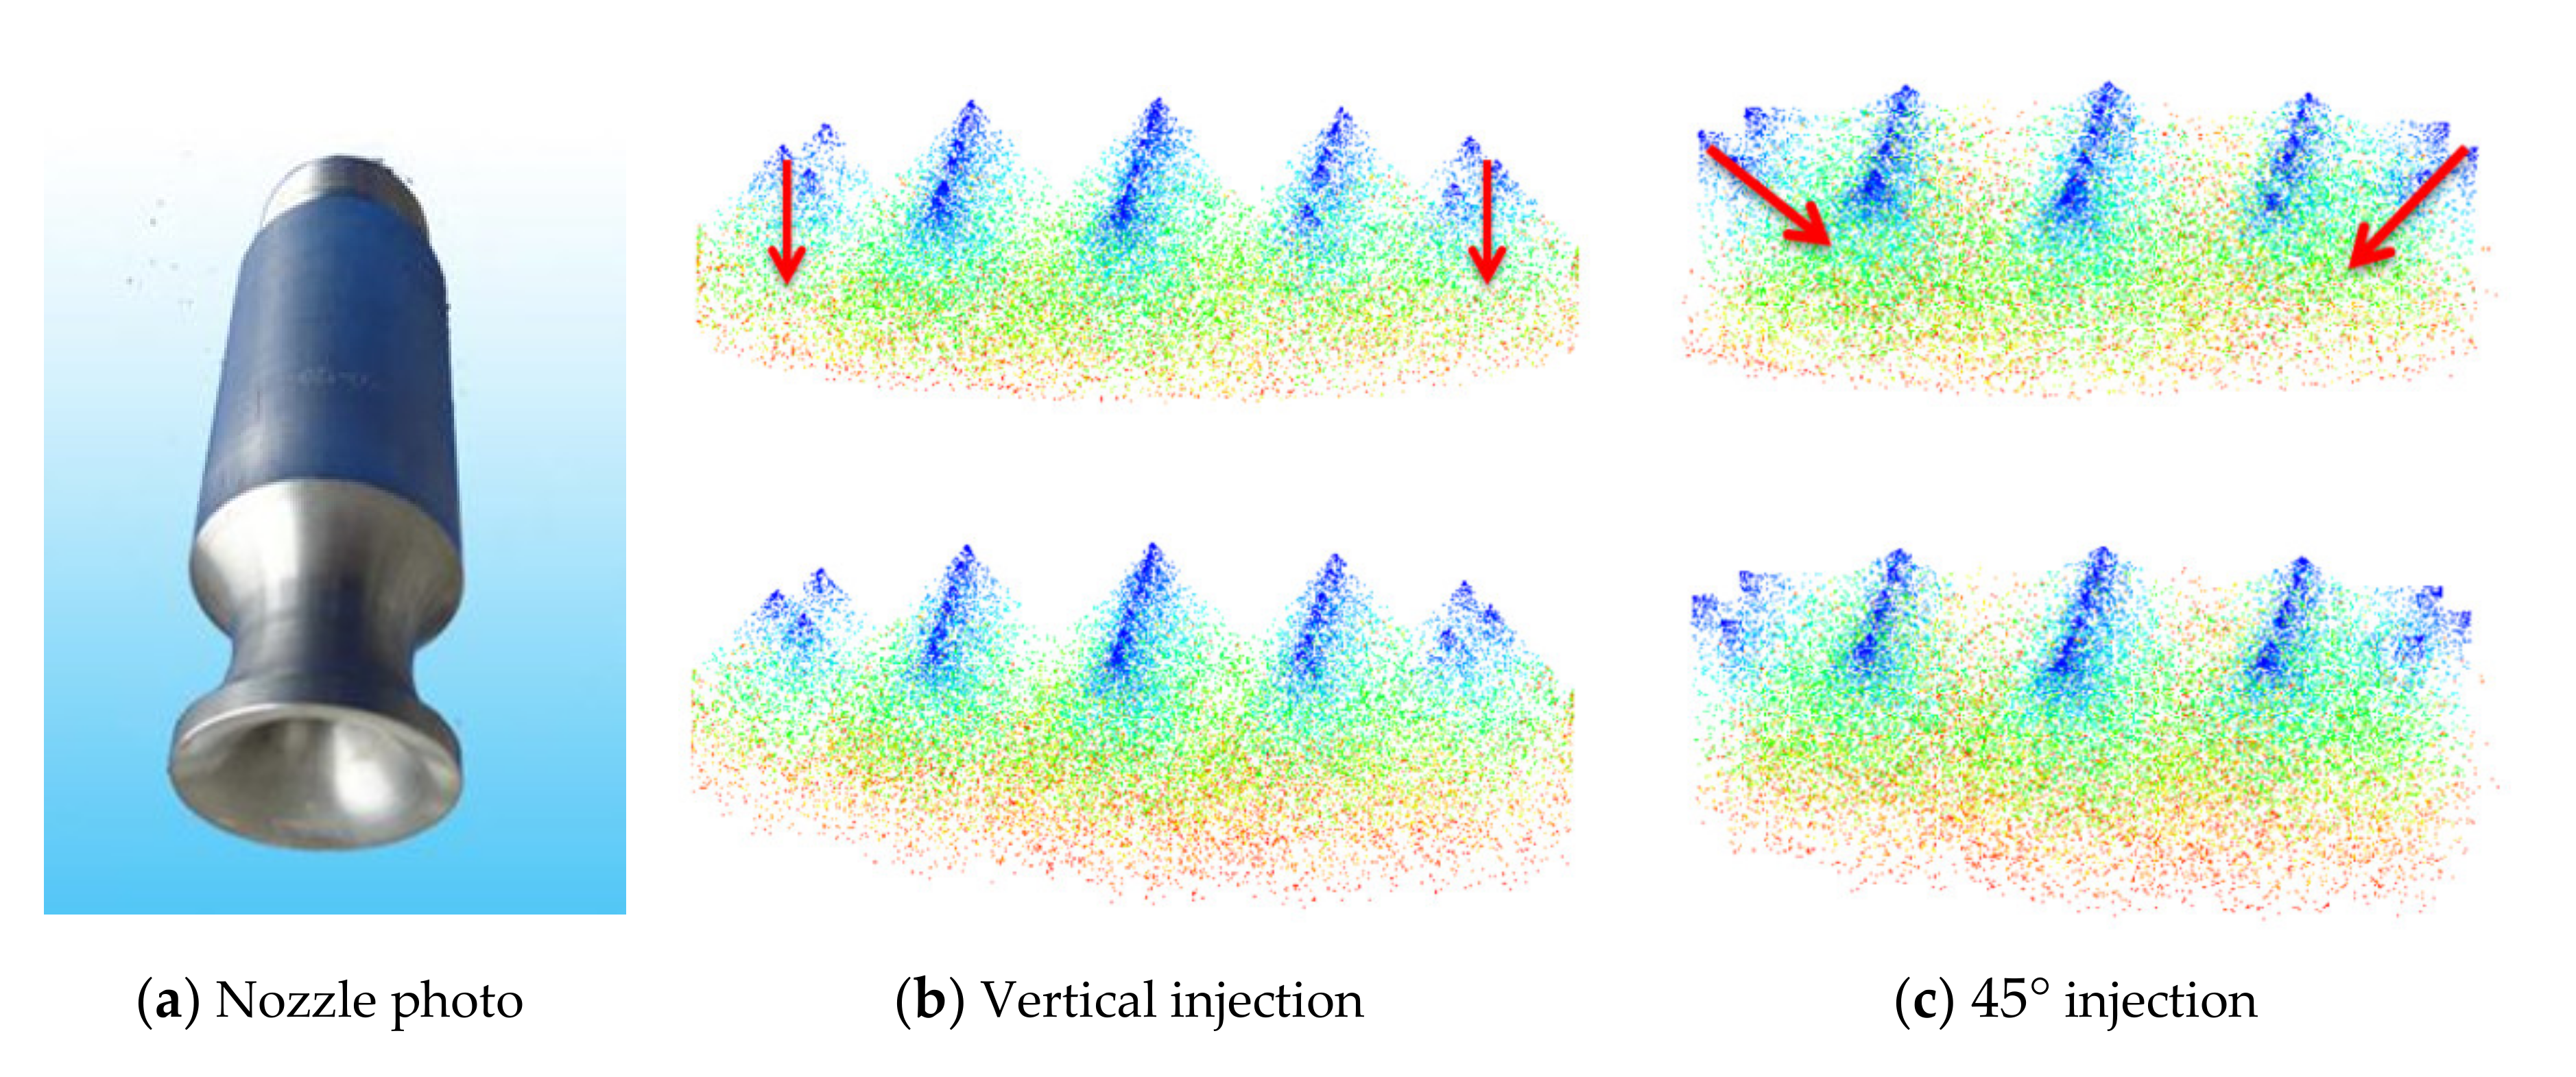
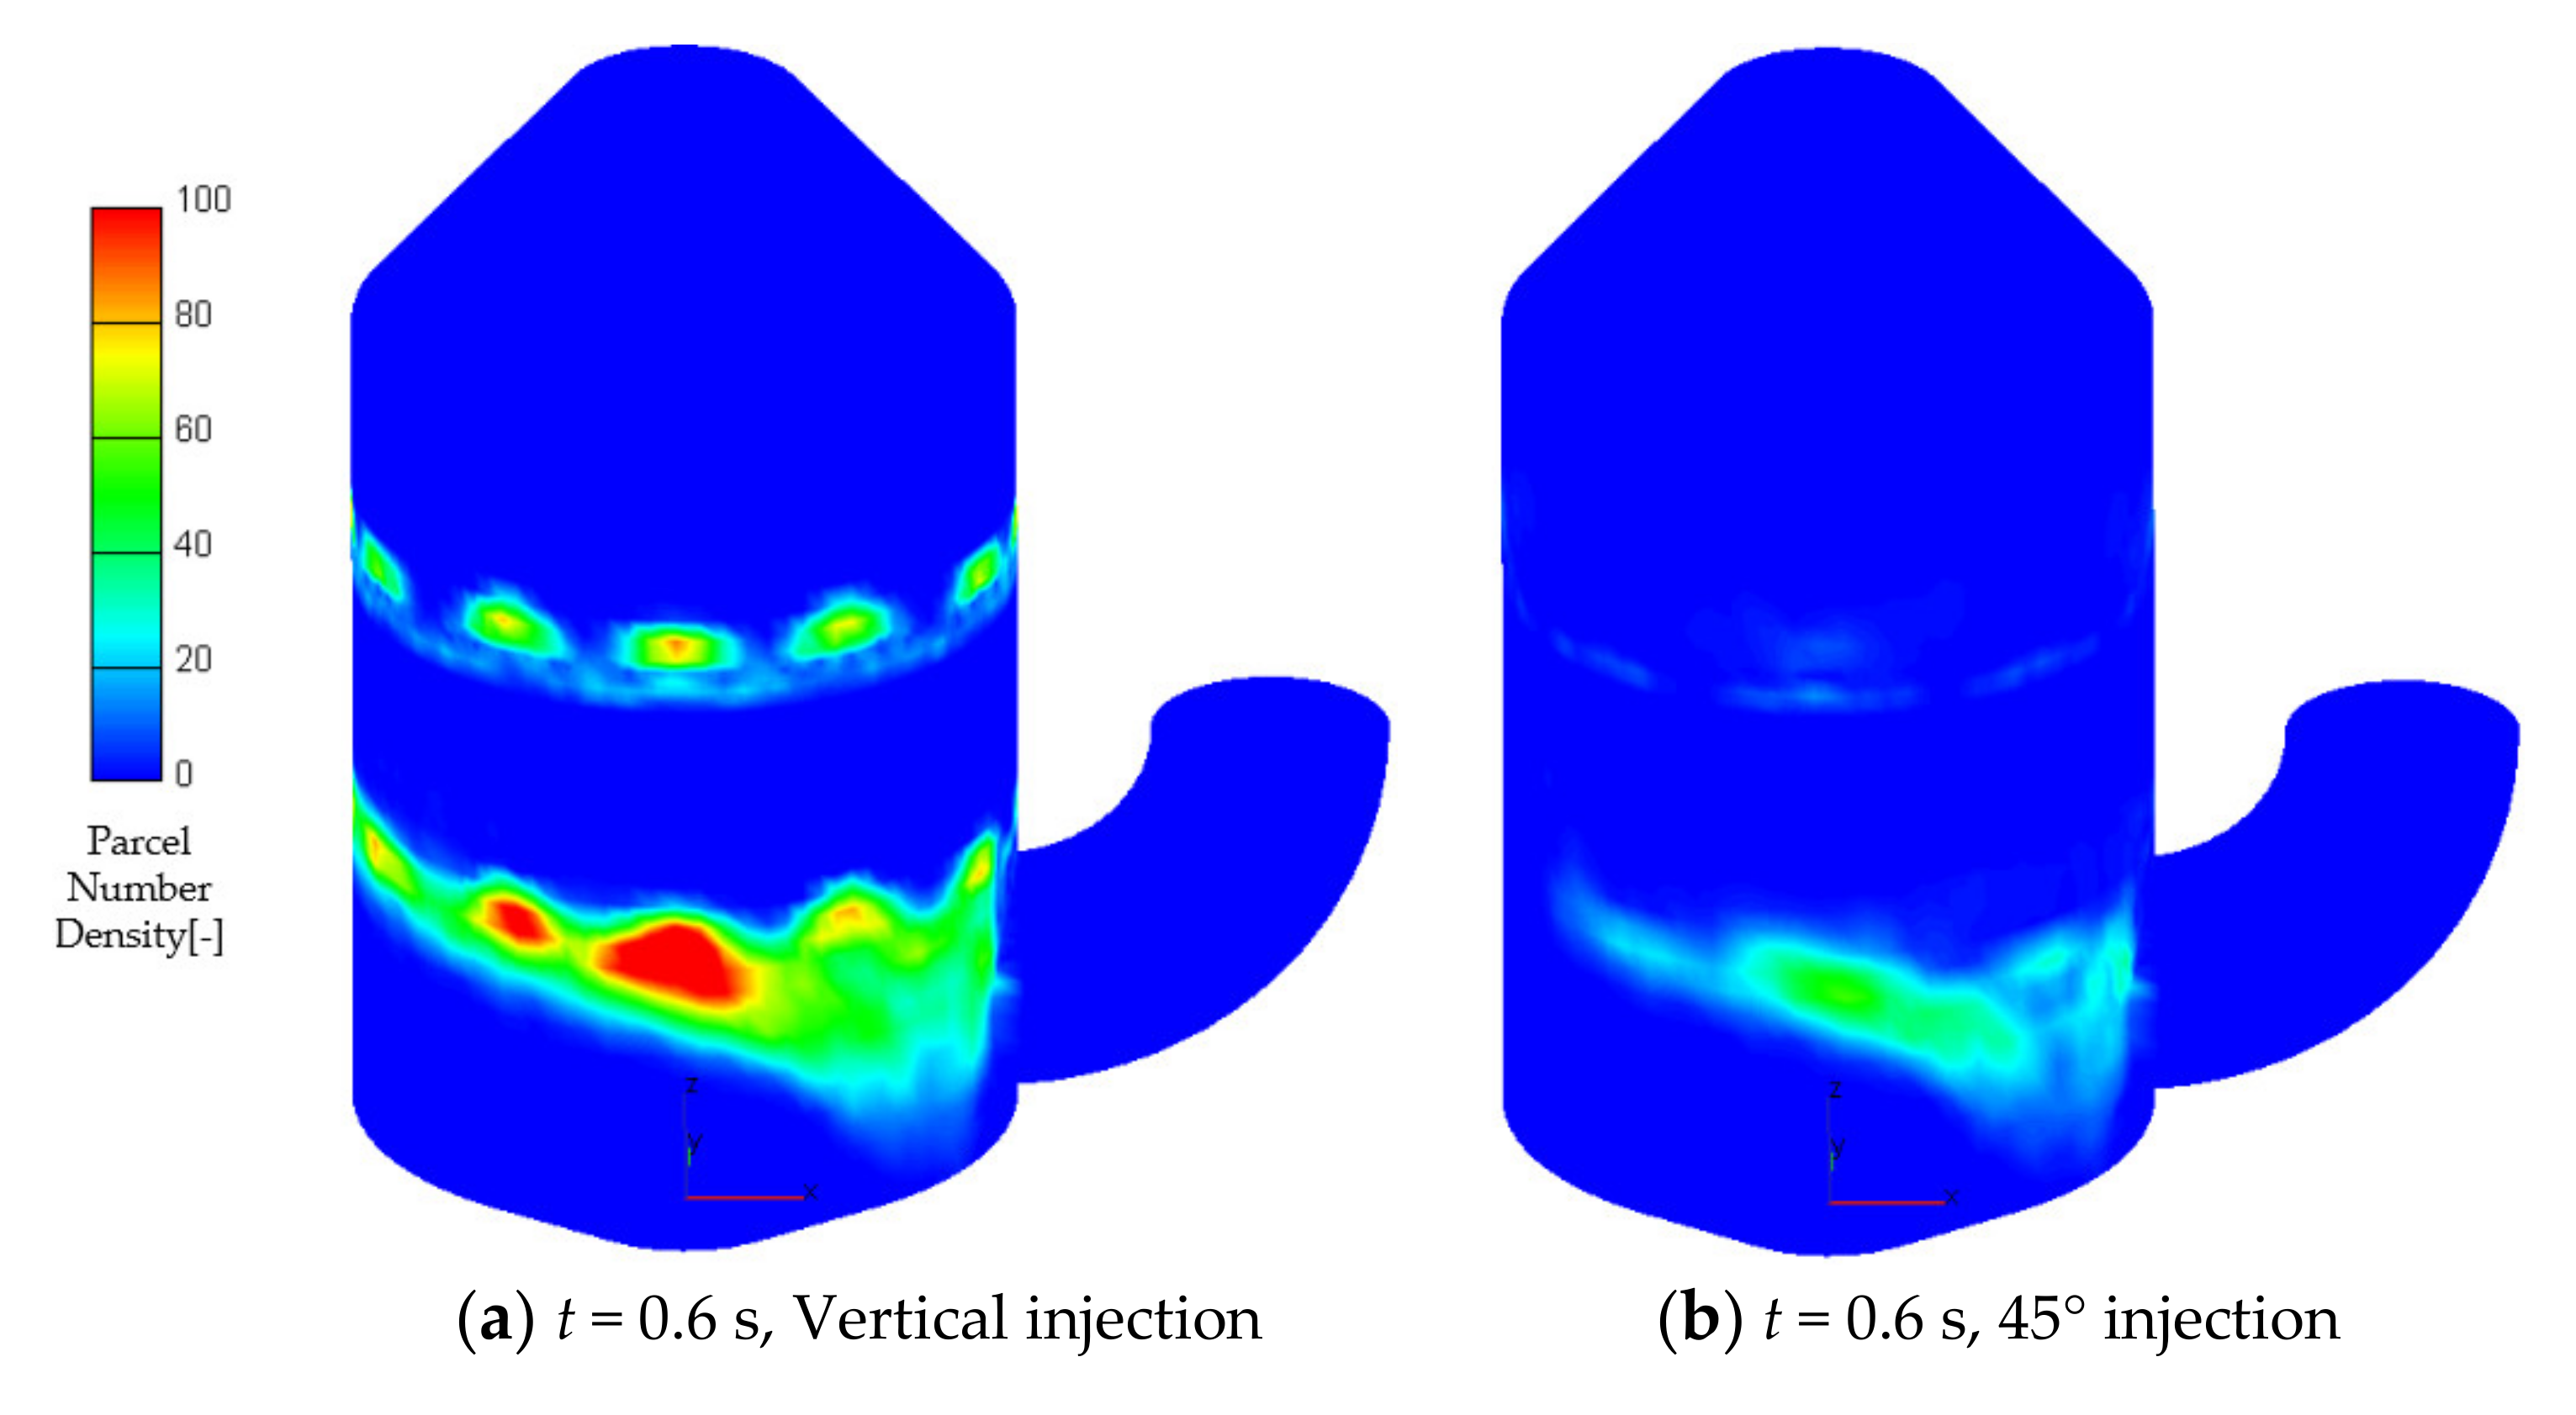
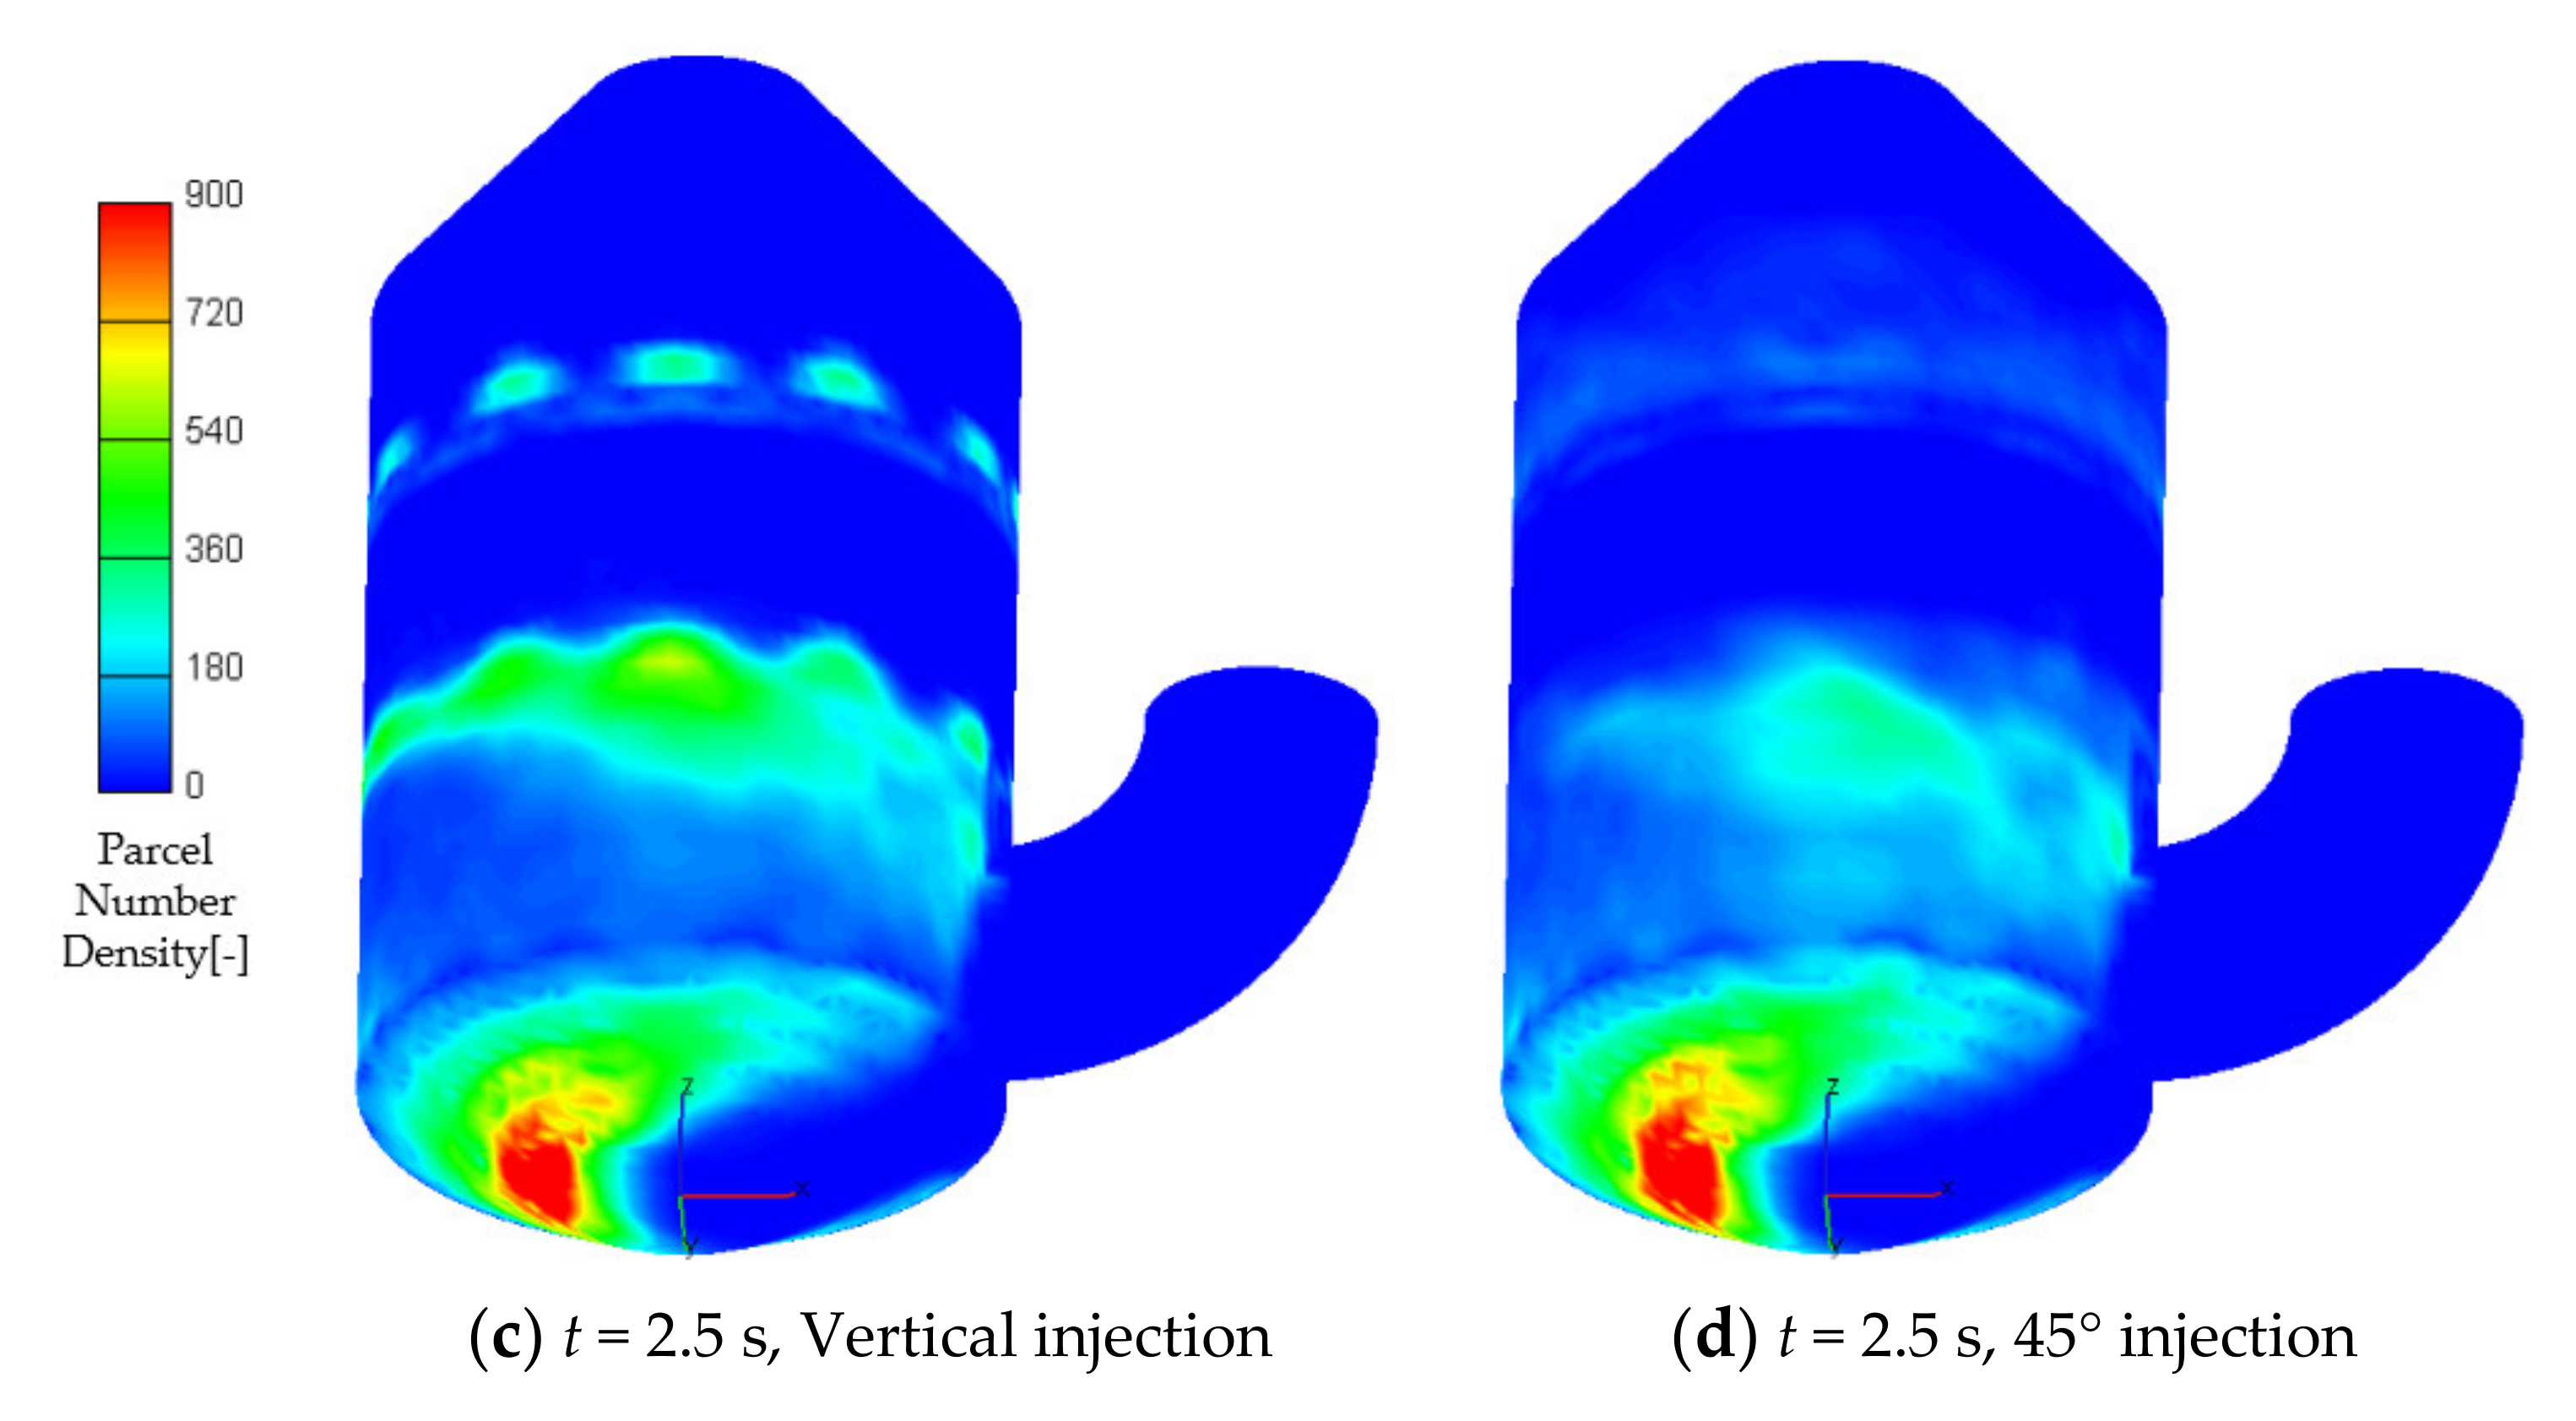
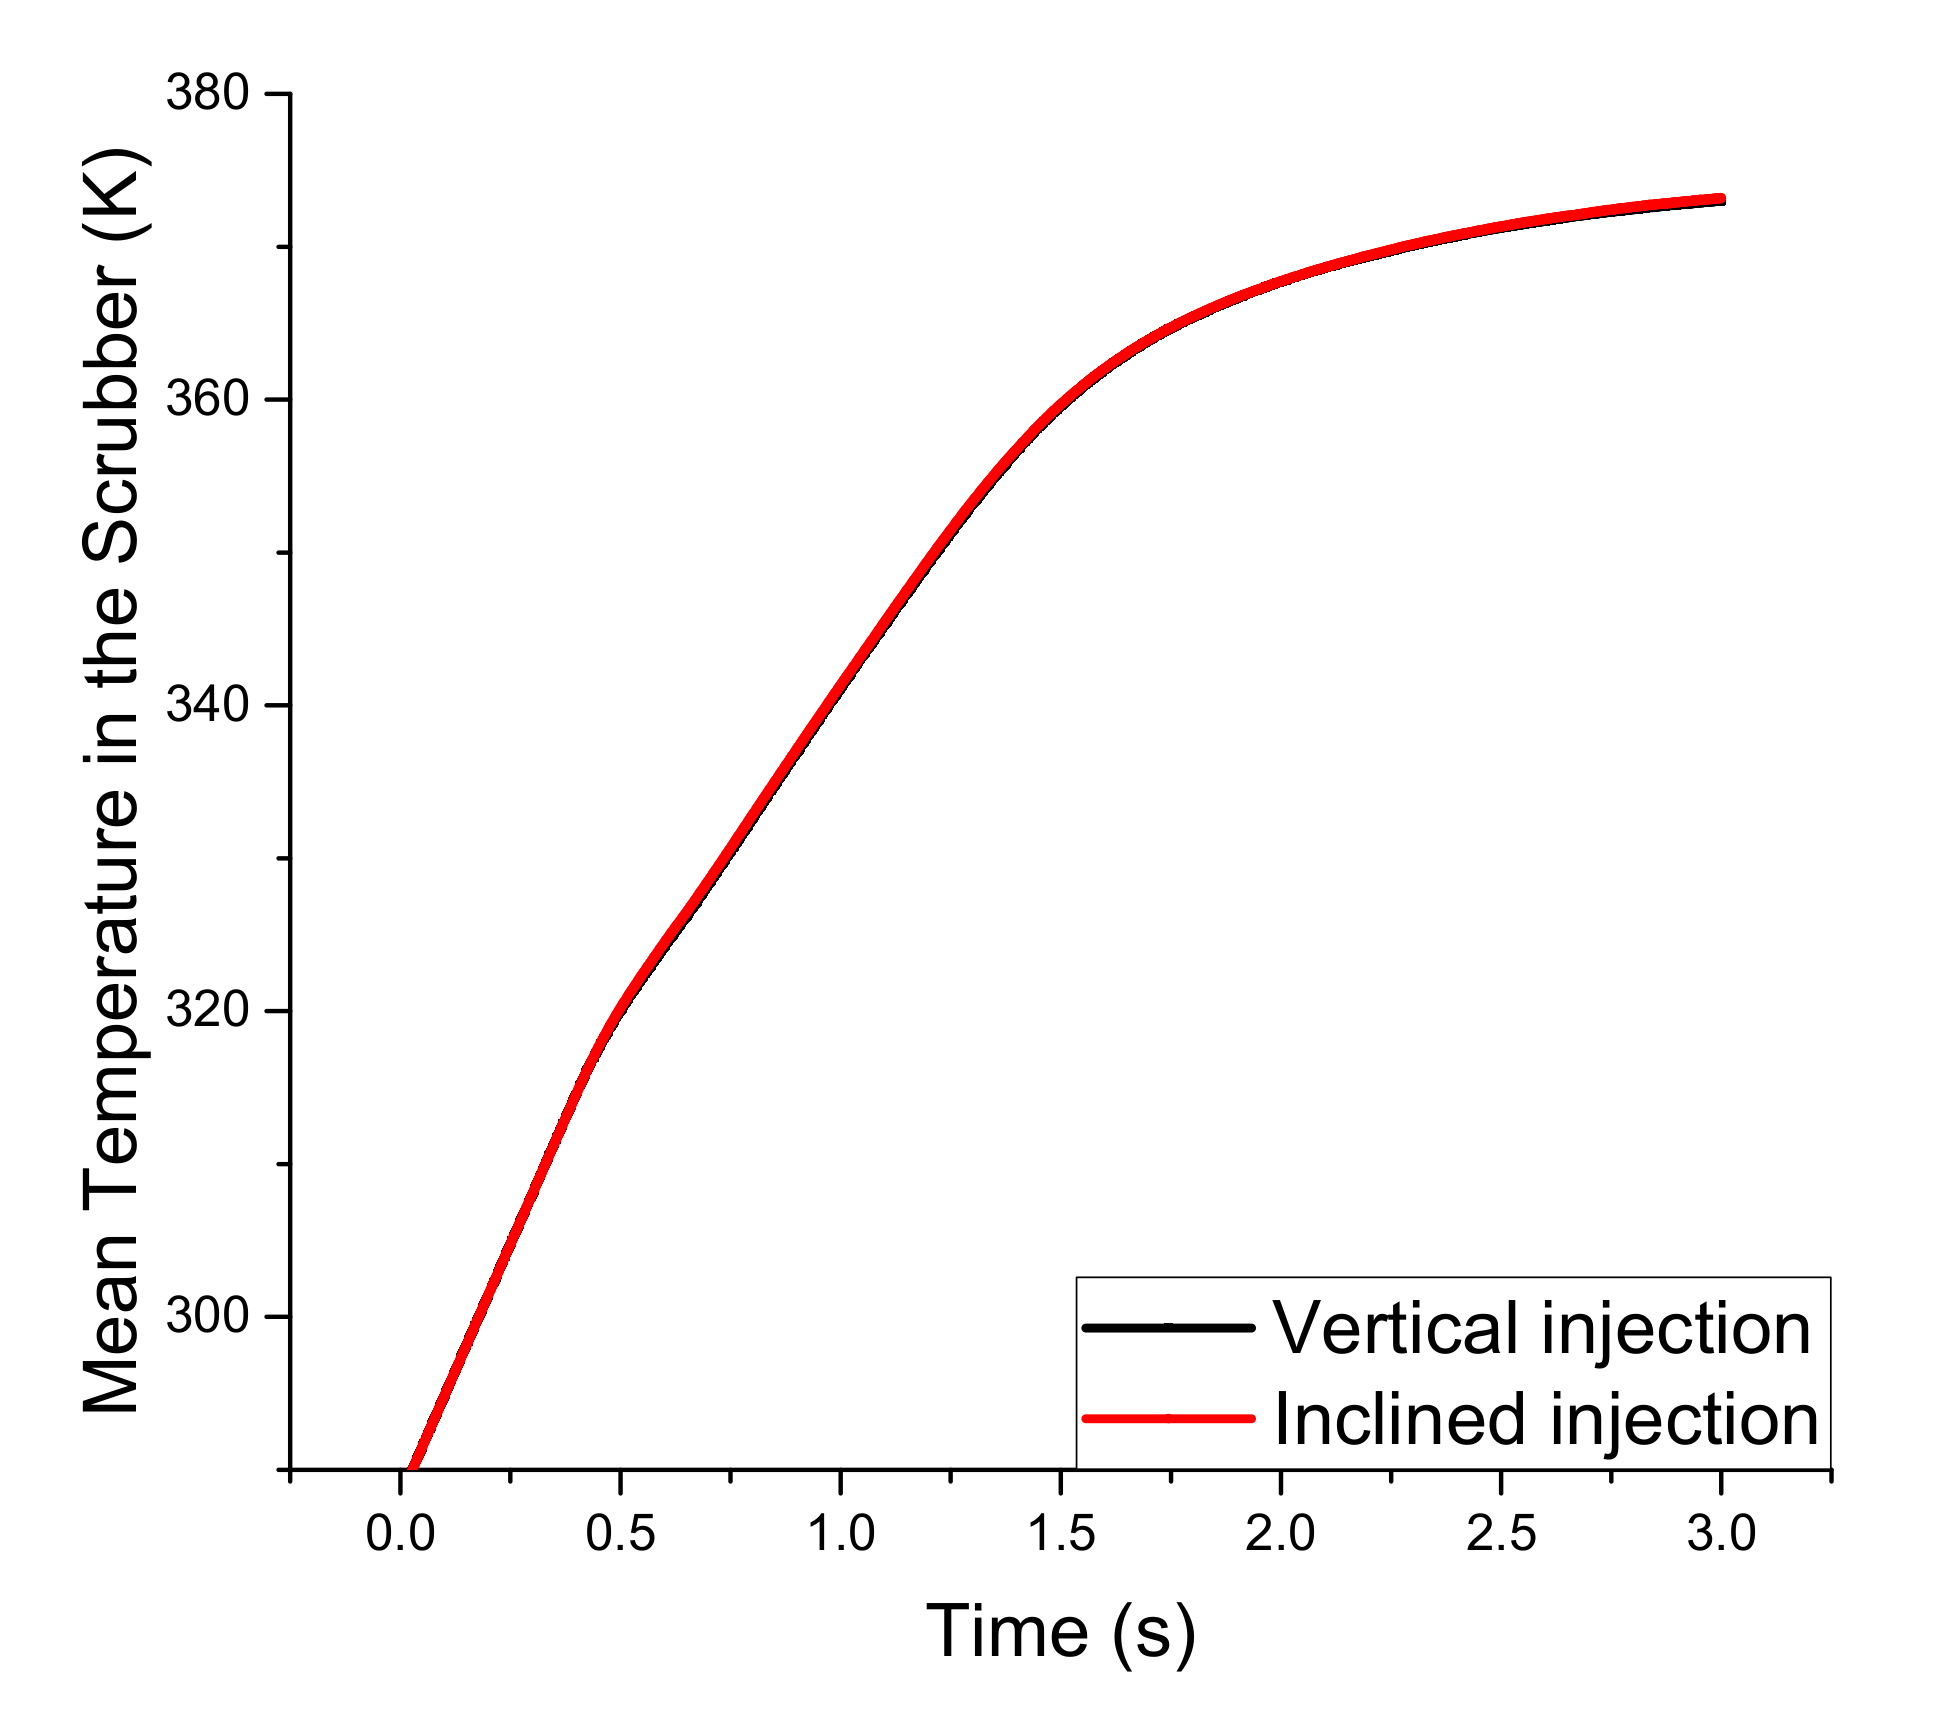
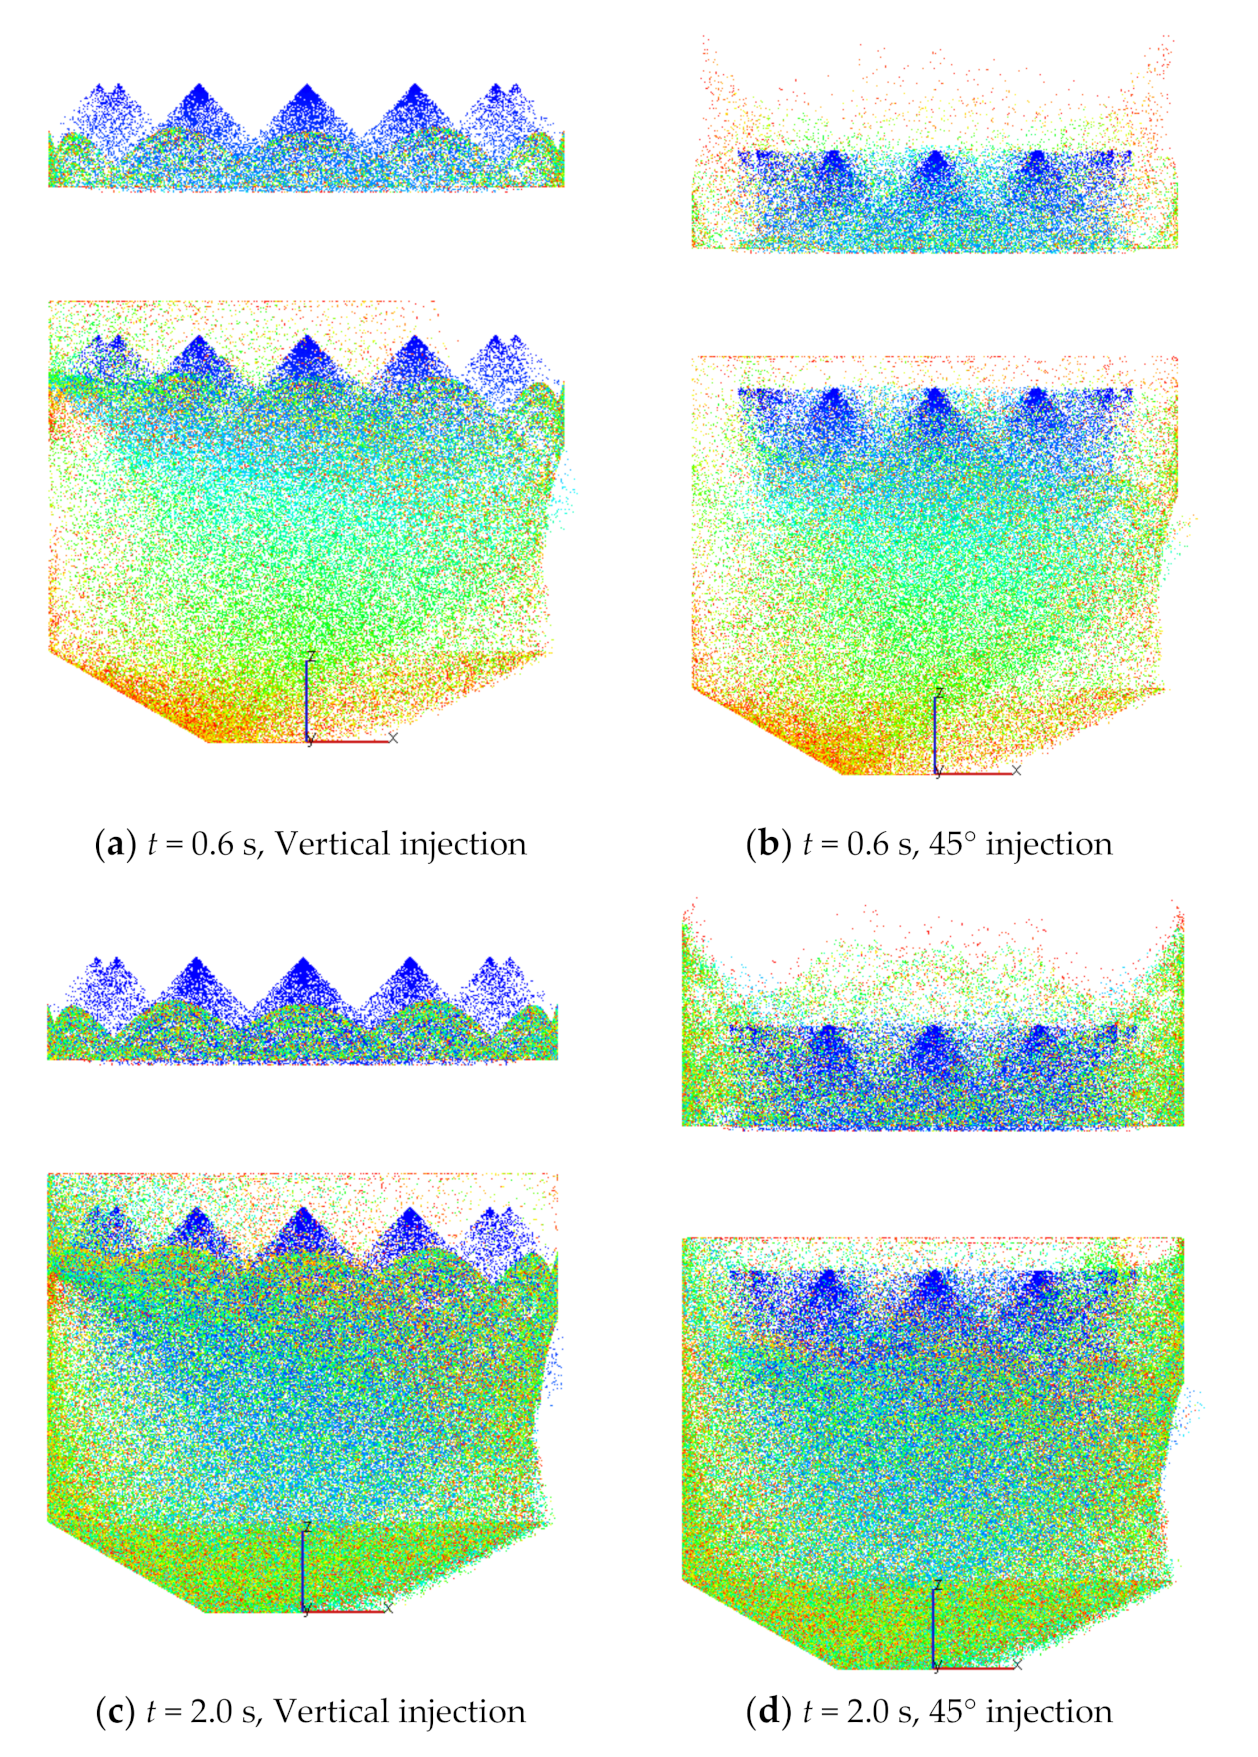
By controlling the outermost nozzles angle, it was possible to reduce the droplets to hit the wall as much as possible and improve the utilization rate of the washing liquid. The number of wall droplets with vertical spray was much larger than that of the outermost nozzles 45° injection. Although the pressure drop under outermost nozzles 45° injection was smaller than the vertical injection, the flow field in the scrubber under outermost nozzles 45° injection became more complex and the outlet gas velocity became larger.

Author Contributions

H.G. and S.Z. contributed to the case study and the original manuscript. M.S. translated the original manuscript. Y.F. checked the results of the whole manuscript. All authors have read and agreed to the published version of the manuscript.

Funding

This research was supported by the China financial support of National Natural Science Foundation (Grant No. U1906232) and Marine Low-Speed Engine Project-Phase I (IEGCS) (Grant No. MC-201501-D01-15).

Conflicts of Interest

The authors declare no conflict of interest.

Abbreviations

IMOInternational Maritime Organization
ECAsEmission Control Areas
NOxNitrogen Oxides
SOxSulfur Oxides
De-SOxDesulfurization
PMParticulate Matter
HFOHeavy Fuel Oil
FGDFlue Gas Desulphurization
CFDComputational Fluid Dynamics
3DThree-Dimensional
EGCSExhaust Gas Cleaning System
EGRExhaust Gas Recirculation
CADComputer Aided Design
CSTCChina Shipbuilding Industry Trading Company
BSFCBrake Specific Fuel Consumption
L/GLiquid-to-Gas Ratios
DCDirect Current

References

  1. Fuglestvedt, J.; Berntsen, T.; Eyring, V.; Isaksen, I.; Lee, D.S.; Sausen, R. Shipping emissions: From cooling to warming of impacts on health. Environ. Sci. Technol. 2009, 43, 9057–9062. [Google Scholar] [CrossRef] [PubMed] [Green Version]
  2. Mehdi, G.; Zhou, S.; Zhu, Y.; Shah, A.H.; Chand, K. Numerical investigation of SCR mixer design optimization for improved performance. Processes 2019, 7, 168. [Google Scholar] [CrossRef] [Green Version]
  3. Murphy, S.M.; Agrawal, H.; Sorooshian, A.; Padró, L.T.; Gates, H.; Hersey, S.; Welch, W.; Jung, H.; Miller, J. Comprehensive simultaneous shipboard and airborne characterization of exhaust from a modern container ship at sea. Environ. Sci. Technol. 2009, 43, 4626–4640. [Google Scholar] [CrossRef] [PubMed] [Green Version]
  4. Wang, G.X.; Yu, W.B. Experimental and numerical study on the influence of intake swirl on fuel spray and in-cylinder combustion characteristics on large bore diesel engine. Fuel. 2019, 237, 209–221. [Google Scholar] [CrossRef]
  5. Jiang, L.; Kronbak, J.; Christensen, L. The costs and benefits of Sulphur reduction measures: Sulphur scrubbers versus marine gas oil. Transp. Res. Part D Transp. Environ. 2014, 28, 19–27. [Google Scholar] [CrossRef]
  6. Diantao, L.; Song, Z. Experimental study and model analysis sodium desulfurization in marine application. J. Chem. Eng. Jpn. 2015, 11, 909–914. [Google Scholar]
  7. Song, Z.; Jinxi, Z.; Yongming, F. Marine emission pollution abatement by a wet scrubbing method. Ind. Eng. Chem. Res. 2016, 55, 5825–5831. [Google Scholar]
  8. Ariana, I.; Fujita, H.; Nishida, O. Using water-plate collector and water spray on ESP to reduce marine diesel exhaust emission. J. Mar. Environ. Eng. 2007, 9, 35–44. [Google Scholar]
  9. Carotenuto, C.; Di Natale, F.; Lancia, A. Wet electrostatic scrubbers for the abatement of submicronic particulate. Chem. Eng. J. 2010, 165, 35–45. [Google Scholar] [CrossRef]
  10. Di Natale, F.; Carotenuto, C.; D’Addio, L. New technologies for marine diesel engine emission control. Chem. Eng. Trans. 2013, 32, 361–366. [Google Scholar]
  11. Youfeng, L.; Liangjun, X. Development of low-fuel consumption and low-emission locomotive engine. In Proceedings of the CIMAC Congress, Vancouver, BC, Canada, 10–14 June 2019; p. 51. [Google Scholar]
  12. Yin, B. Economic assessment of ship gas emission control. J. Dalian Marit. Univ. 2008, 34 (Suppl. 2), 130–132. [Google Scholar]
  13. Andreasen, A.; Mayer, S. Use of seawater scrubber for SO2 removal from marine engine exhaust gas. Energy Fuels 2007, 21, 3274–3279. [Google Scholar] [CrossRef]
  14. Jamil, R.; Ming, L.; Jamil, I.; Jamil, R. Application and development trend of flue gas desulfurization (FGD) process. Int. J. Innov. Appl. Stud. 2013, 4, 286–297. [Google Scholar]
  15. Ma, H.; Steernberg, K.; Riera-Palou, X. Well-to-wake energy and greenhouse gas analysis of SOx abatement options for the marine industry. Transp. Res. Part D Transp. Environ. 2012, 17, 301–308. [Google Scholar] [CrossRef]
  16. Caiazzo, G.; Di Nardo, A.; Langella, G. Seawater scrubbing desulfurization: A model for SO2 absorption in fall-down droplets. Environ. Prog. Sustain. Energy 2012, 31, 277–287. [Google Scholar] [CrossRef]
  17. Wärtsilä Corporation. Exhaust Gas Scrubber Installed Onboard mt “Suula” Public Test Report; Wärtsilä: Helsinki, Finland, 2010. [Google Scholar]
  18. Caiazzo, G.; Langella, G.; Miccio, F. An experimental investigation on seawater SO2 scrubbing for marine application. Environ. Prog. Sustain. Energy 2013, 32, 1179–1186. [Google Scholar] [CrossRef]
  19. Wu, X.C.; Wang, Z.J. Investigation on a novel seawater exhaust gas cleaning system applied for SOx emissions reduction of marine diesel engine. Adv. Mater. Res. 2014, 12, 765–771. [Google Scholar]
  20. Jenkins, G.E.; Sampson, K.G.; Dumont, D.S. Marine Exhaust Gas Cleaning System. World Patent WO2015106355A1, 23 July 2015. [Google Scholar]
  21. Fridell, E.; Kent, S. Measurements of abatement of particles and exhaust gases in a marine gas scrubber. J. Eng. Marit. Environ. 2016, 1, 154–162. [Google Scholar] [CrossRef]
  22. Chelluboyana, V.R.; Mondal, M.K. Removal of SO2 and NO by complex absorbent using wet scrubbing. Int. J. Appl. Eng. Res. 2014, 9, 345–350. [Google Scholar]
  23. Zhou, J.; Zhou, S.; Zhu, Y. Experiment and prediction studies of marine exhaust gas SO2 and particle removal based on NaOH solution with a U-type scrubber. Ind. Eng. Chem. Res. 2017, 56, 12376–12384. [Google Scholar] [CrossRef]
  24. Zhang, S.; Duan, X.; Liu, Y. Experimental and numerical study the of combustion chamber shapes on combustion and emissions characteristics on combustion and emissions characteristics in a heavy-duty lean burn SI natural gas engine coupled with detail combustion mechanism. Fuel 2019, 258, 116–130. [Google Scholar] [CrossRef]
  25. Guo, H.; Zhou, S.; Shreka, M.; Feng, Y. Effect of pre-combustion chamber nozzle parameters on the performance of a marine 2-stroke dual fuel engine. Processes 2019, 7, 876. [Google Scholar] [CrossRef] [Green Version]
  26. Zhou, S.; Gao, R.F.; Feng, Y.M. Evaluation of Miller cycle and fuel injection direction strategies for low NOx emission in marine two-stroke engine. Int. J. Hydrogen Energy 2017, 42, 20351–20360. [Google Scholar] [CrossRef]
  27. Kumaresh, S.; Kim, M.Y. A numerical study on the fluid flow and thermal characteristics inside the scrubber with water injection. J. Mech. Sci. Technol. 2016, 30, 915–923. [Google Scholar]
  28. Peng, X.; Boming, Y. Developing a new form of permeability and Kozeny–Carman constant for homogeneous porous media by means of fractal geometry. Adv. Water Resources. 2008, 31, 74–81. [Google Scholar]
Figure 1. A simplified model of the SO2 absorption process.
Processes 08 00862 g001
Figure 2. 3D Computer Aided Design (CAD) model of the scrubber.
Processes 08 00862 g002
Figure 3. Simplified scrubber meshes.
Processes 08 00862 g003
Figure 4. Pressure map inside the scrubber.
Processes 08 00862 g004
Figure 5. Velocity map inside the scrubber.
Processes 08 00862 g005
Figure 6. Speed vectors contour and streamlines inside the scrubber.
Processes 08 00862 g006
Figure 7. Temperature contours inside the scrubber.
Processes 08 00862 g007
Figure 8. Velocity and temperature for the preferred planes along the flow direction.
Processes 08 00862 g008
Figure 9. 3D distribution of the spray droplets.
Processes 08 00862 g009
Figure 10. Pressure for the preferred planes along the flow direction.
Processes 08 00862 g010
Figure 11. Temperature distribution of the scrubber wall.
Processes 08 00862 g011
Figure 12. Distribution of the droplets inside the scrubber (ZA = 2.2 m, ZB = 3.92 m).
Processes 08 00862 g012
Figure 13. Distribution of the spray nozzles.
Processes 08 00862 g013
Figure 14. Comparison of the number of droplets that hitting the wall.
Processes 08 00862 g014
Figure 15. Distribution of the spray droplets.
Processes 08 00862 g015
Figure 16. Contour of the outlet temperature.
Processes 08 00862 g016
Figure 17. Nozzle photo and injection direction.
Processes 08 00862 g017
Figure 18. 3D distribution of the droplets.
Processes 08 00862 g018aProcesses 08 00862 g018b
Figure 19. Average temperature inside the scrubber.
Processes 08 00862 g019
Figure 20. 3D distribution of the droplets.
Processes 08 00862 g020
Figure 21. Pressure map inside the scrubber.
Processes 08 00862 g021
Table 1. MAN 6S50ME engine dimensions.
ParameterValue
Bore500 mm
Stroke2000 mm
Cylinder Number6
Engine Speed127 r/min
Power9480 kW
Peak Combustion Pressure15.4 MPa
Brake Specific Fuel Consumption
(BSFC)
171 g/kWh
Piston Speed8.5 m/s
Table 2. CFD model boundary conditions.
IndexBoundary ConditionData
InletMass flow rate23.72 kg/s
Temperature485 K
OutletPressure101325 Pa
WallNo slip wall

