Article

Evaluation of the Interactive Effect Pretreatment Parameters via Three Types of Microwave-Assisted Pretreatment and Enzymatic Hydrolysis on Sugar Yield

by
Saleem Ethaib
1,2,
Rozita Omar
1,*,
Mustapa Kamal Siti Mazlina
3 and
Awang Biak Dayang Radiah
2
1
Department of Chemical and Environmental Engineering, Faculty of Engineering, University Putra Malaysia, Serdang 43400, Selangor, Malaysia
2
College of Engineering, University of Thi-Qar, Al Nassirya 64001, Iraq
3
Department of Process and Food Engineering, Faculty of Engineering, University Putra Malaysia, Serdang 43400, Selangor, Malaysia
*
Author to whom correspondence should be addressed.
Processes 2020, 8(7), 787; https://doi.org/10.3390/pr8070787
Submission received: 12 May 2020 / Revised: 6 June 2020 / Accepted: 10 June 2020 / Published: 6 July 2020

Abstract

:
This study aims to evaluate the sugar yield from enzymatic hydrolysis and the interactive effect pretreatment parameters of microwave-assisted pretreatment on glucose and xylose. Three types of microwave-assisted pretreatments of sago palm bark (SPB) were conducted for enzymatic hydrolysis, namely: microwave-sulphuric acid pretreatment (MSA), microwave-sodium hydroxide pretreatment (MSH), and microwave-sodium bicarbonate (MSB). The experimental design was done using a response surface methodology (RSM) and Box–Behenken Design (BBD). The pretreatment parameters ranged from 5–15% solid loading (SL), 5–15 min of exposure time (ET), and 80–800 W of microwave power (MP). The results indicated that the maximum total reducing sugar was 386 mg/g, obtained by MSA pretreatment. The results also illustrated that the higher glucose yield, 44.3 mg/g, was found using MSH pretreatment, while the higher xylose yield, 43.1 mg/g, resulted from MSA pretreatment. The pretreatment parameters MP, ET, and SL showed different patterns of influence on glucose and xylose yield via enzymatic hydrolysis for MSA, MSH, and MSB pretreatments. The analyses of the interactive effect of the pretreatment parameters MP, ET, and SL on the glucose yield from SPB showed that it increased with the high MP and longer ET, but this was limited by low SL values. However, the analysis of the interactive effect of the pretreatment parameters on xylose yields revealed that MP had the most influence on the xylose yield for MSA, MSH, and MSB pretreatments.

1. Introduction

The utilization of solid waste, such as lignocellulosic biomass, as raw materials for the fuel, food, and pharmaceutical component industries is a global concern [1]. Forestry, agricultural, and agro-industrial residues are the main sources of these useful materials [2,3], such as sago palm bark (SPB) which is a by-product generated by the sago starch industry. Due to the presence of cellulose and hemicellulose contents in sago palm bark (> 63%) [4], SPB can provide a sustainable resource for sugar platform-based chemicals and organic fuels because of its availability in enormous quantities at low cost. The conversion of the lignocellulosic materials into different valuable products faces the complex structure of lignocellulosic materials, which make these materials resistant to some conversion possessing stages, such as enzymatic hydrolysis. Hence, the challenge in the hydrolysis stage is to achieve a high sugar yield from lignocellulosic biomass using limited amounts of energy and chemicals during pretreatment to reduce the investment cost. A pretreatment stage is a key to the use of lignocellulose materials in bio-alcohol compound production [5]. Various techniques have been developed for the pretreatment of lignocellulosic compounds, including physical and chemical pretreatment methods, such as steam explosion [6], diluted acid [7], alkali [8], and hydrothermal pretreatments [9]. Most of these methods of pretreatment involve high processing costs, due to harsh operating conditions, such as high pressure and/or temperature. Furthermore, highly concentrated chemicals, such as acids, are toxic to the enzymes or fermentative microorganisms and, therefore, require an additional processing step [10].
In recent years, microwave heating has received more recognition. The key benefit of microwave heating is the short amount of time it takes, relative to traditional heating; minutes versus hours [11]. This is because of the fundamental difference in the heat transfer mechanism between microwave and conventional heating [12]. Conventional heating requires surface heating until conduction, convection, or radiation transfers the heat inwards. However, during microwave heating, the microwave energy not only interacts with the surface material but, at the same time, penetrates the surface that comes into contact with the material’s core [13]. Because of its high heating rate and easy operation, microwave heating is, therefore, a viable alternative to conventional heating methods, which have been widely used in many fields. The microwave-assisted pretreatment of various lignocellulosic biomass substrates was used in many studies [14,15,16]. These studies reported that microwave heating has a positive effect on cellulosic material digestion for downstream processes. Despite the large number of microwave-assisted application studies, microwave technology has not completely replaced conventional heating in industry. The problems associated with the processing of waste materials with microwaves include inherent difficulties with microwaves themselves and those inherent with processed materials. Microwave radiation can be applied via an applicator; therefore, it can be placed remotely and heating can be done in a clean environment. However, not all materials (e.g. transparent materials) are easily heated via microwave heating. Another characteristic of microwave processing is the differential coupling of materials, which enables selective heating. Adding absorbers to transparent material could help to increase the reaction temperature. On the other hand, using additives (absorbers) may result in unwanted impurities. At a temperature below the critical temperature of a material, microwave processing is self-limiting and, therefore, heating can cease after the process or phase is completed. For this reason, the efficacy of microwave-assisted pretreatment relies ultimately on the the pretreatment parameters. The factors that have most influence on sugar recovery in microwave pretreatments are solvent type, solid loading (solvent to feed ratio), exposure time, and microwave power [16,17,18,19,20].
Microwave heating-based processes may achieve a green and low-energy pretreatment cycle. The minimal use of energy requirements (short heating time), chemical auxiliaries (use of extreme diluted solvents), and the recycling of biomass wastes meet with the principles of green-extraction and can provide more sustainable and feasible routes for commodity production [21,22]. Therefore, this study investigates the use of low concentration solvents in microwave-assisted pretreatment and evaluates their effect on fermentable sugar yield from sago palm bark wastes through enzymatic hydrolysis. Extremely diluted solvents, such as sulphuric acid, sodium hydroxide, and sodium bicarbonate were applied in the microwave-assisted pretreatment prior to the enzymatic hydrolysis process. The microwave-assisted pretreatment methods were, namely, microwave-sulphuric acid pretreatment (MSA), microwave-sodium hydroxide pretreatment (MSH), and microwave-sodium bicarbonate pretreatment (MSB). Experimentally, the response surface methodology (RSM) was used for the design of experiment (DOE), to construct an empirical model based on the collected experimental data, and to highlights the interactions among the microwave-assisted pretreatment parameters and their effect on the enzymatic hydrolysis process. Therefore, this study aims to evaluate the sugar yield and the interactive effect of the key operating parameters of acidic and alkali microwave-assisted pretreatments. An emphasis is placed on how MSA, MSH, and MSB pretreatment processes effect glucose and xylose yield from the enzymatic hydrolysis of SPB.

2. Material and Methods

2.1. Substrate

The purchased sago palm trunks from a plantation in Melaka, Malaysia were used to prepare the experiment feedstock. These trunks were debarked to obtain the bark fraction (the outer layer). The collected bark was dried in an oven until reached a constant weight (temperature of 105 °C for ~24 h). Then, a woodchipper (Woodchipper from Pallmann Maschinenfabrik Gmb & Co KG in Zweibrücken, Germany type PZ 8) was used to chop the dried bark. The chopped matter was sieved by a chip classifier to get particle size (2–3 cm). Finally, these materials were stored in plastic bags at −20 °C until the experiments were carried out.

2.2. Enzymes and Chemicals

The cellulase enzymes from Trichoderma reesei (E.C. 3.2.1.4), xylanase from Trichoderma viride (E.C. 3.2.1.8) and β-glucosidase from Almond (E.C. 3.2.1.21) were purchased from Sigma-Aldrich (St. Louis, MO, USA) and used in enzymatic hydrolysis. In addition, the monosaccharides glucose, xylose analytical standards, and 3,5 dinitrosalicylic acid, as well as sodium azide were and used in the qualitative and quantitative analysis for sugar. Concentrated sulphuric acid, sodium hydroxide pellets, and sodium bicarbonate powder were purchased from R&M (Selangor, Malaysia) and were utilized in the pretreatment process. Citric acid monohydrate and sodium citrate were obtained from R&M (Selangor, Malaysia) to prepare the sodium citrate buffer.

2.3. Microwave-Assisted Pretreatment

The microwave-assisted pretreatment was performed in a single-phase stainless steel domestic microwave oven with a 206 mm (H) × 315 mm (W) × 353 mm (D) microwave oven cavity from Panasonic (NN-ST340M, Panasonic, Kadoma, Osaka Prefecture, Japan). This microwave has a 2.45 GHz magnetron. This magnetron was mounted at the side of the casing and with a maximal operation power of 800 W and five discrete settings. The microwave oven was modified by making a 25 mm round hole at the center of upper side to facilitate the connection between the reaction flask and the reflux condenser and the upper end of the reflex condenser was sealed by aluminum paper to prevent evaporation. The reflux unit is often included to control pressure by condensing the vaporized sample mixture, and this system operates at atmospheric conditions. The dried samples were transferred to a 1000 mL round-bottom flask that contained 100 mL of the pretreatment solvent. Then, the flask was placed inside the microwave cavity. After the pretreatment, the slurry was filtered through filter paper (0.45 μm) (Double Ring filter paper 102, China) to separate the solid residue and liquid faction (liquor). The filtered solid fraction was washed with distilled water to remove the pretreatment solvent and was dried at 60 °C for 48–72 h to get a constant weight. Then, the dried materials were stored at −20 °C in plastic bags for the subsequent enzymatic hydrolysis process.
Three solvents—0.05 M H2SO4, 0.1 M NaOH, and 0.01 M NaHCO3—were used for the microwave-sulphuric acid pretreatment (MSA), microwave-sodium hydroxide pretreatment (MSH), and microwave-sodium bicarbonate pretreatment (MSB) of SPB, respectively. The pretreatments were performed at various solid loading, exposure time, and microwave power which resulted from the experimental design (DOE). The design of experiment (DOE) was done using Design Expert software (Version 7.1, Stat-EaseInc., Silicon Valley, CA, USA) a RSM approach. The Box–Behnken factorial design (BBD) with three independent variables and three levels was employed to plan experiments with consideration for the interactive effects among the variables during the pretreatments and their responses. Since there is no accurate procedure to directly measure the exact temperature and pressure of pretreatment in a domestic microwave oven, pretreatment was expressed in terms of the microwave power output that can be set on the instrument. The case study in this design involves the interaction effects of the pretreatment variables, microwave power (MP) (X1), exposure time (ET) (X2), and solid loading (SL) (X3) on enzymatic hydrolysis from biomass. Table 1 shows the 17 experimental runs which were generated in terms of coded and actual variables.

2.4. Enzymatic Hydrolysis

Enzymatic hydrolysis was performed in an incubator shaker at 55 °C and 150 rpm for 72 h. A total of 1.0 g of pretreated biomass, on a dry matter basis, was immersed in 30 mL of 50 mM sodium citrate buffer (pH 4.8) in a 250 mL Erlenmeyer flask. Cellulase was supplemented by 24 FPU/g, 2 UN/g of xylanase and β-glucosidase at an enzyme loading of 50 U/g. U and UN refer to the activity of β-glucosidase and xylanase, respectively, as reported by the manufacturer: “One U of β-glucosidase corresponds to the amount of enzyme which liberates 1 μmol of glucose per minute at pH 5.0 and 37 °C (salicin as substrate)” and “one UN will liberate 1 μmole of reducing sugar measured as xylose equivalents from xylan per minute at pH 4.5 at 30 °C. Additional β-glucosidase was essential to alleviate the cellobiose inhibition of cellulase. Prior to use, the cellulase activity assay for determining filter paper cellulase units (FPU) was performed as outlined by the NREL LAP-006 procedure [23] which was found to be 67 FPU/mL. A dose of 0.3% (w/v) sodium azide was added to avoid microbial contamination. Following hydrolysis, the samples were immediately transferred to a boiling water bath for 10 min to avoid further reaction and the denaturing of the enzymes. They were then cooled in an ice bath. Samples of the slurries were collected and filtered through a 0.22 μm nylon membrane, neutralized and kept at −30 °C for further sugar analysis. The sugar analysis was performed to identify the total reducing sugar using the dinitrosalicylic acid method (DNS) and to estimate monomeric sugar content via HPLC analysis.

2.5. Sugar Analysis

The total reducing sugar analysis was performed according to the DNS method of Miller (1959) [24]. The colored samples were then measured with a UV–VIS spectrophotometer (UV-2700, Shimadzu, Japan) at 540 nm using a standard curve of glucose. The monomeric sugars of glucose and xylose were analyzed by a high-performance liquid chromatography (HPLC) system (Alltech 2000, East Lyme, CT, USA) equipped with a RI detector and a Rezex RPM-Monosaccharide Pb+2 column, 300 mm in length and 7.5 mm in internal diameter, particle size: 8 (µm), Max back pressure: 1000 (PSI) (Phenomenex Inc., Torrance, CA, USA). The column was conditioned for 30 to 60 mins to reach a steady state using a mobile phase deionized water HPLC grade, which was already sonicated to deaerate the system at a flow rate of 0.6 mL/min. The column and detector temperatures were set at 85 and 40 °C, respectively and the injection volume of sample was 20 µL. The liquid samples were filtered using a 0.22 μm disposable nylon membrane syringe filter (Phenex Inc., England, UK) prior to HPLC analysis.

3. Results and Discussion

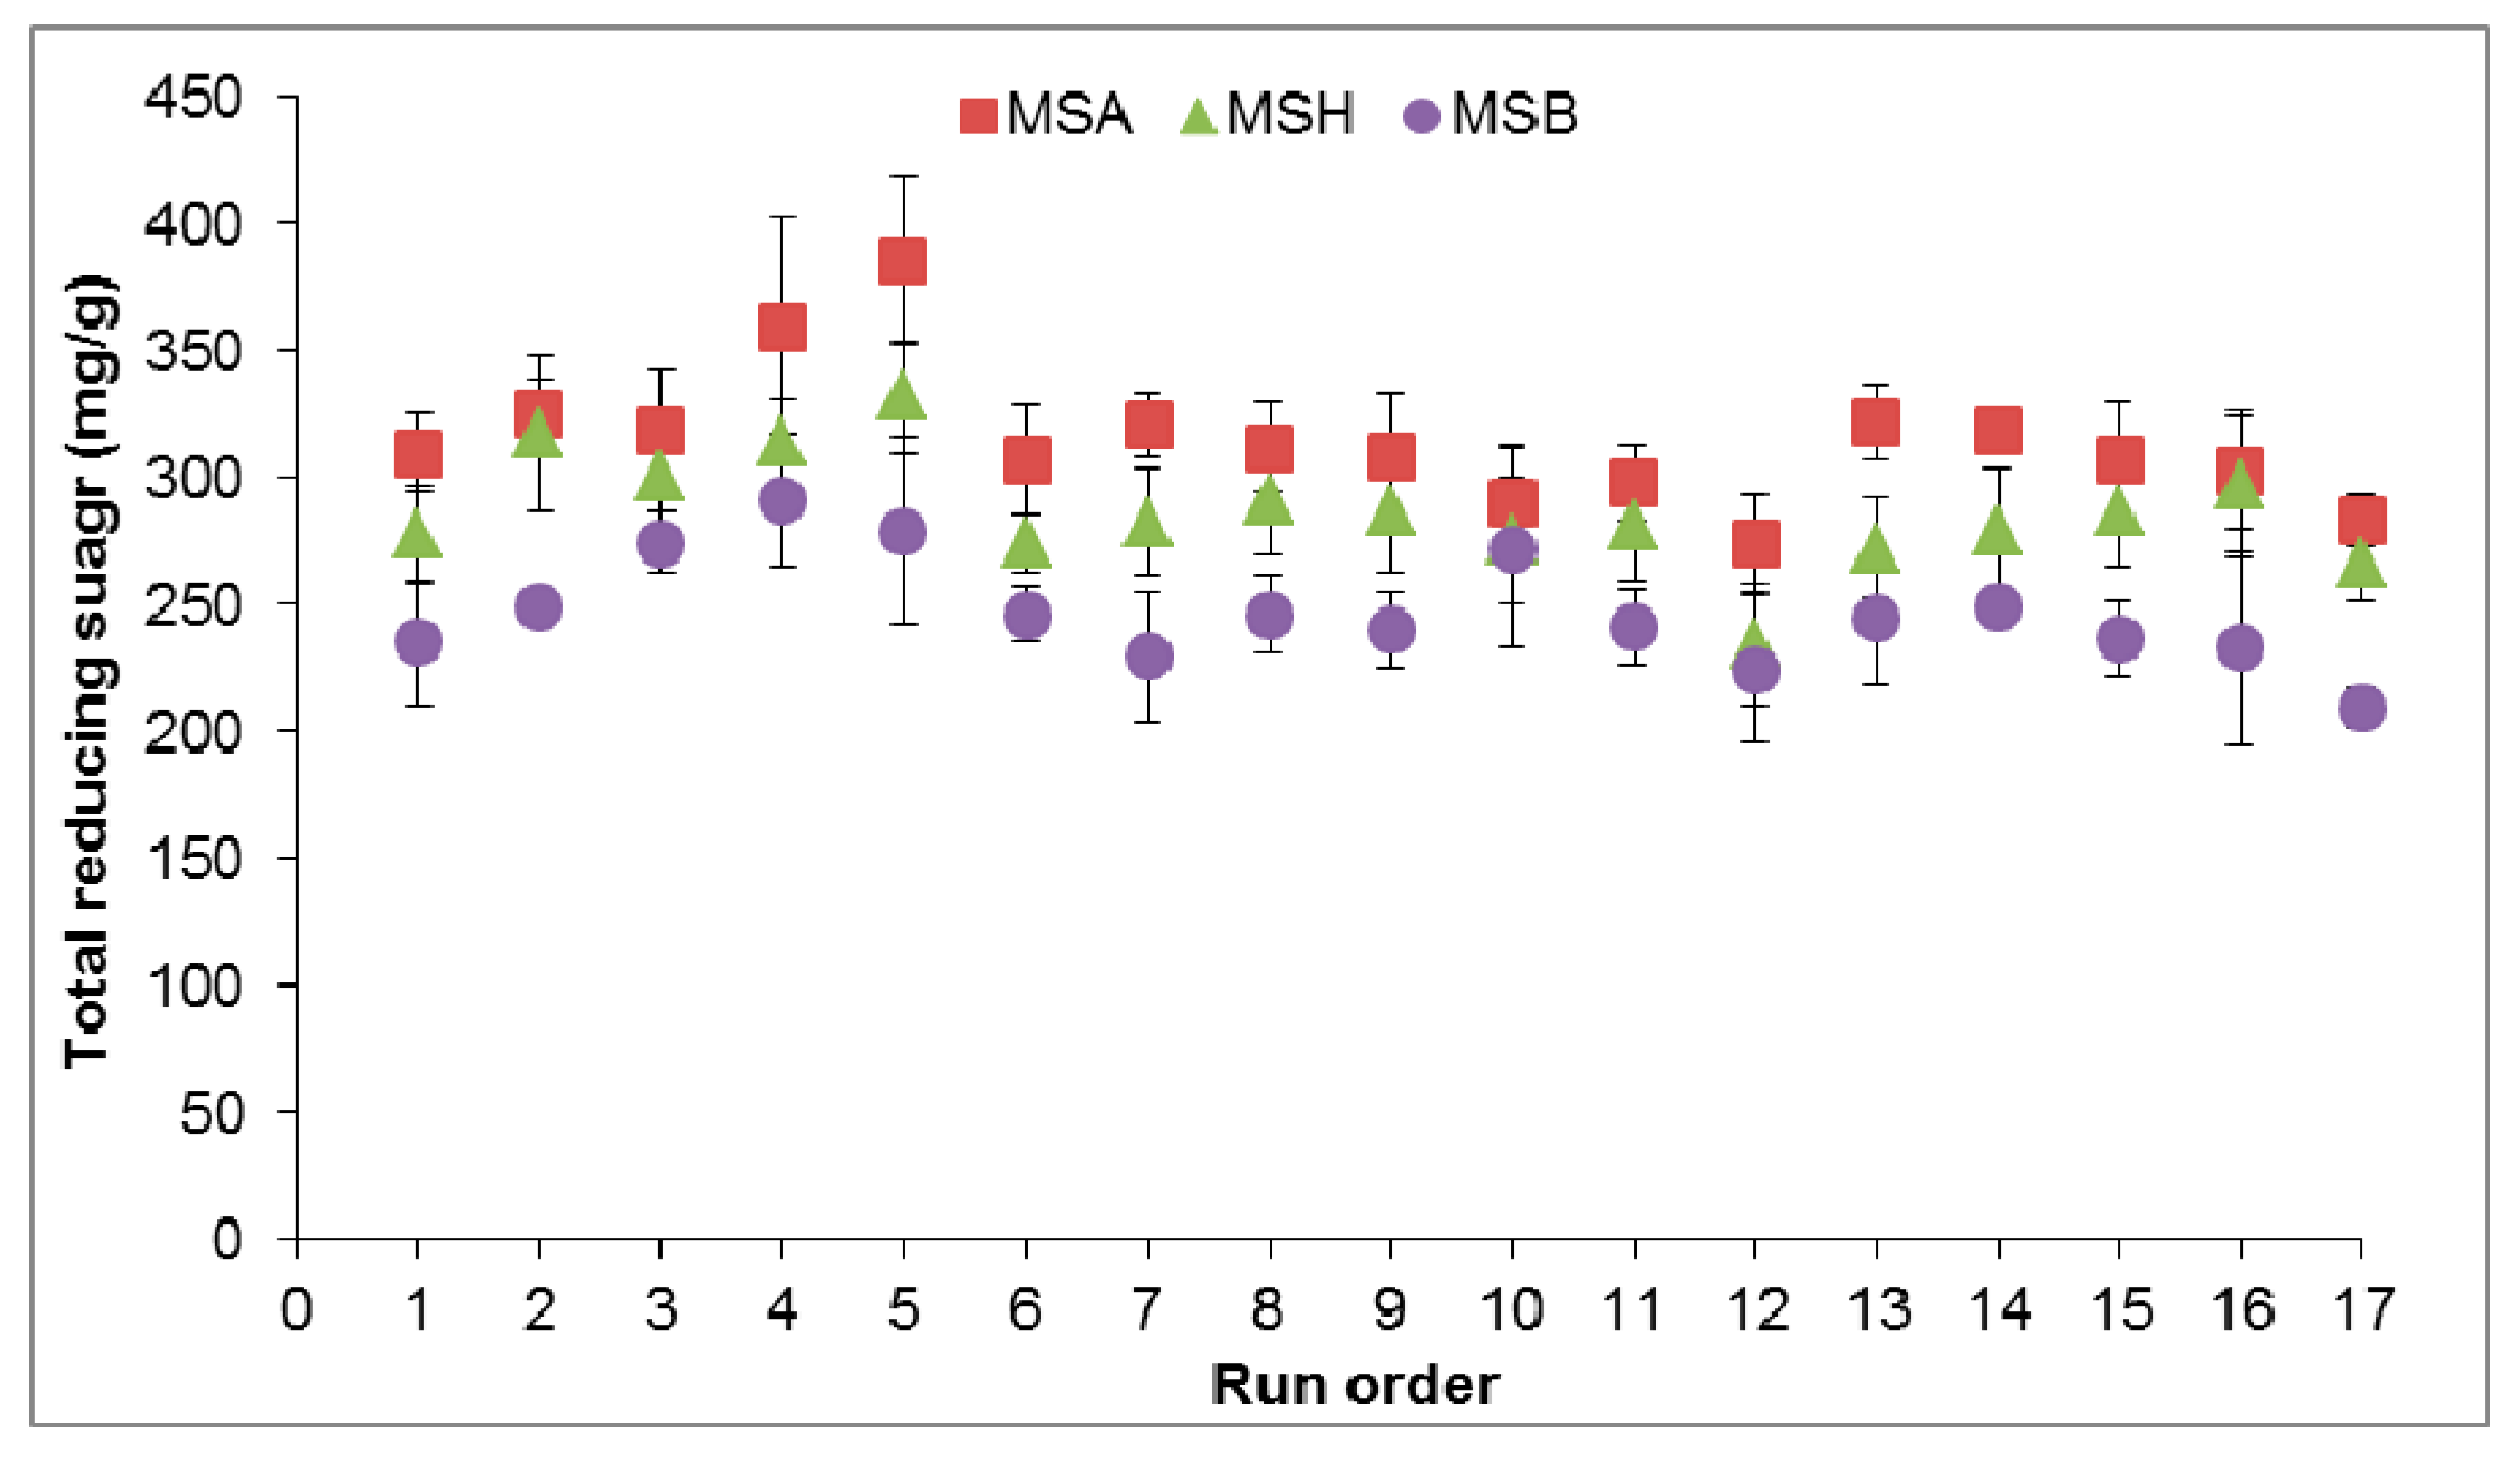
3.1. Effect of Microwave-Assisted Pretreatment Type on Sugar Yield

The effects of MSA, MSH, and MSB pretreatment on the physical and chemical characteristics of SPB were reported and discussed in a previous study by Ethaib et al. [4], and the composition of the pretreated solids is shown in Table 2.
In the current study, the enzymatic hydrolysis of pretreated SPB using MSA, MSH, and MSB was carried out to evaluate the sugar yield and the interactive effect of microwave-assisted pretreatment parameters on sugar yield. In the present section, the sugar yield (mg/g of pretreated solids) and enzymatic hydrolysis efficiency of pretreated SPB were evaluated based on the total reducing sugar content using the DNS method on both glucose and xylose yields. Figure 1 depicts the levels of the total reducing sugar content that was obtained via MSA, MSH, MSB, and enzymatic hydrolysis for the seventeen experiment runs of the design of experiment. The examination of glucose and xylose yields using HPLC analysis are tabulated in Table 3 for MSA, MSH, and MSB based on BBD experiments. The results show that the sugar yield from enzymatic hydrolysis, which was calculated using the DNS method, was higher than the HPLC results. From a chemical standpoint, the DNS reagent reacts with all of the reducing sugars that contain aldehyde groups, which include all monosaccharaides, along with some disaccharides, such as cellobiose, oligosaccharides, and some polysaccharides [25]. In general, the HPLC can be used to detect the individual components of monosaccharaides, in this study, it was limited for glucose and xylose detection.
The results show that, overall, microwave-acid pretreatment (MSA), followed by the enzymatic hydrolysis of SPB gave a higher sugar yield in comparison to both types of alkaline pretreatments (MSH and MSB), as shown in Figure 1. The maximum total reducing sugar was found to be 386 mg/g when SPB was loaded at 5% and soaked in 0.05 M H2SO4 under 440 W for 15 mins. With 0.1 M NaOH and 0.01 M NaCHO3 treatments under the same conditions, the yields were 332 mg/g and 279 mg/g, respectively. The results in Table 3 indicate that the highest glucose yield was found through MSH pretreatment, with an average glucose yield of 1.27—times the pretreatment yields of MSA and MSB, respectively. The highest glucose yield was found at 44.3 ± 4.8 mg/g in run 4 when the SPB underwent MSH pretreatment, loaded at 5% solid and subjected to 800 W for 5 mins. SPB, pretreated under the same conditions with sulphuric acid and bicarbonate sodium, only yielded 24.4 ± 3.3 mg/g and 20.1 ± 1.5 mg/g after the enzyme hydrolysis, respectively. Zhang and his co-workers [26] reported that NaOH solutions can cause the swelling and dissolution of cellulose. The swelling of cellulose causes significant changes in physical properties and an increase in cellulose volume. Moreover, the dissolution of cellulose can destroy the supramolecular structure of cellulose. Therefore, cellulose swelling and the increase in the cellulose content and its volume and the disruption of its structure, caused by the NaOH solution, may lead to an increase in the surface area available for the cellulase enzyme to react, resulting in increased glucose release.
Xylose yield in MSH pretreatment was lower than that of MSA pretreatment; however, a higher xylose yield was found at 43.1 ± 4.2 mg/g in run 7 using MSA pretreatment. The xylose yields for the MSH and MSB pretreatments under the same pretreatment conditions were 22.9 ± 1.4 mg/g and 17.2 ± 1.3 mg/g, respectively. This can be attributed to the ability of sulphuric acid to provide hydrogen ions to breakdown long hemicellulose chains and form shorter chain oligomers, facilitating the liberation of monomeric sugars C5 and C6 [24]. The average xylose yield in SPB hydrolysate via MSA was 1.72, which was 1.95 times the xylose yields of MSH and MSB, respectively.
Table 3 details the glucose and xylose yields for MSA, MSH, and MSB pretreatments, based on the variables SL, ET, and MP. These variables have a significant effect on glucose and xylose yields. For instance, in run 4, the glucose yield was 44.3 ± 2.8 mg/g when SPB underwent MSH pretreatment and was loaded at 5% (SL) and subjected to 800 W (MP) for 5 min. In run 2, increasing the solid loading to 10% at the same microwave power led to a decrease in glucose yield to 35.8 ± 3.9 mg/g, even though the time was increased to 10 min. This means that the SL has a significant effect on sugar yield compared to ET. A similar trend was found with MSA. For more details on the combined effects of these variables on glucose and xylose yield, statistical analysis was performed and a 3D contour plot was created for discussion in the following sections.

3.2. Analysis Effect of Microwave-Assisted Pretreatment Parameters Using ANOVA

In order to understand the effect of the parameters in microwave-assisted pretreatment on glucose and xylose yields, analyses of variance (ANOVA) for the BBD, as shown in Table 3, were performed using Design Expert software. The BBD was used to evaluate the effect of the three microwave-assisted pretreatment independent variables, SL, ET, and MP, on the response variables, glucose and xylose yields, via enzymatic hydrolysis to create models between these variables. Second-order multi regression models were constructed as a function of the three microwave-assisted pretreatment variables, SL (X1), ET (X2), and MP (X3), on the predicted response of glucose yield (Y1) and xylose yield (Y2). The quality of fit of the polynomial model equations and their parameters were evaluated by determining the R2 coefficient. Statistical and regression coefficient significances were checked against the probability (p-value). p-values of less than 0.05 were applied to validate the significant of the models and each of the variables, which, in turn, is necessary to understand the pattern of the mutual interactions between the test variables.
The glucose yield (Y1) and xylose yield (Y2) models for MSA pretreatments and the enzymatic hydrolysis of SPB are illustrated using second-order polynomial equations as follows:
Y 1 = 11.01211 + 0.35256 X 1 + 1.71473 X 2 + 0.035514 X 3 0.15532 X 1 X 2 + 0.000394581 X 1 X 3 0.00120793 X 2 X 3 + 0.032591 X 1 2 + 0.032933 X 2 2 0.0000354291 X 3 2
Y 2 = 35.76288 2.78708 X 1 + 2.91092 X 2 0.022262 X 3 + 0.033276 X 1 X 2 + 0.00138219 X 1 X 3 0.000152006 X 2 X 3 + 0.10210 X 1 2 0.15315 X 2 2 + 0.0000157648 X 3 2
The glucose yield (Y1) and xylose yield (Y2) models for MSH pretreatment and enzymatic hydrolysis are illustrated in Equations (3) and (4), respectively:
Y 1 = 41.5865 3.18614 X 1 + 1.75493 X 2 0.00832057 X 3 0.028987 X 1 X 2 0.0000126471 X 1 X 3 + 0.0000142204 X 2 X 3 + 0.13534 X 1 2 0.060397 X 2 2 + 0.0000186437 X 3 2
Y 2 = 6.19687 + 0.39759 X 1 + 1.65842 X 2 0.00238738 X 3 0.073023 X 1 X 2 0.000906216 X 1 X 3 + 0.0000219542 X 3 2
The regression model for the glucose yield (Y1) and xylose yield (Y2) of MSB pretreatment and the enzymatic hydrolysis of SPB are presented in Equations (5) and (6), respectively:
Y 1 = 9.14903 0.15517 X 1 + 0.91215 X 2 + 0.00852174 X 3 0.022048 X 1 X 2 + 0.000128086 X 1 X 3 0.000514792 X 2 X 3
Y 2 = 8.48181 1.27393 X 1 + 1.55549 X 2 0.00771416 X 3 0.00612675 X 1 X 2 + 0.000498938 X 1 X 3 + 0.000525542 X 2 X 3 0.077275 X 1 2 0.094553 X 2 2 + 0.00000165916 X 3 2
Table 3 and Table 4 display the ANOVA for glucose yields (Y1) and xylose yields (Y2) for MSA, MSH, and MSB pretreatments.
The ANOVA for the glucose models (Y1), pertaining to MSA, MSH, and MSB pretreatments, shows that the p-values are significant, as shown in Table 3. The results show that the p-value for the Y1 of the MSA pretreatment model was 0.012, which means model is significant at a linear regression of R2 0.8901 and a F-value of 6.3. The p-values also revealed that the independent variables, X1 and X2, and the quadratic term X3 had significant effects on glucose yields during MSA pretreatment, as shown in Table 4.
The R2 and associated p-values for the MSH pretreatment of Y1 were 0.8944 and 0.0106, respectively at F-value 6.59, showing that this model is significant. The variables X1 and X2 and the quadratic term of X1 illustrate their significant effect on glucose yields during MSH pretreatment, as shown in Table 4.
For MSB pretreatment, the p-value of the Y1 model is very low (less than 0.0001) reflecting a high R2 value (0.9476) and F-value 30.11. Based on the p-values of the model variables, the variables X1, X2, and X3, and the interaction between X2 and X3, had significant effects on glucose yields during MSB pretreatment, as shown in Table 3.
An ANOVA was also executed for the xylose yield (Y2) models of the three types of pretreatments. The p-values of the generated models are significant, as shown in Table 5. The p-value of 0.0363 for the Y2 model for MSA pretreatment is significant where R2 = 0.8431. This suggests that the interaction between the independent variables X1 and X3, and quadratic terms X1 and X2, had a significant effect on xylose yields during MSA pretreatment.
For MSH pretreatment, the p-value of the Y2 model was 0.0005, which means that this model is highly significant where R2 = 0.9583 and the F-value = 17.89. The variables X1, X2, and X3 are significant, as are the interactions between X1 and X2, and between X2 and X3. The quadratic term X3 has a significant effect on xylose yields during MSH pretreatment, as shown Table 4.
Finally, Table 4 also shows the significance of the Y2 model for MSB pretreatment, where: R2 = 0.8472, p-value = 0.0335. In this table, only the quadratic terms of X1 and X2 are observed as having a significant effect on xylose yield under MSB pretreatment with p-values of 0.01440 and 0.0055, respectively.

3.3. Analysis Effect of Microwave-Assisted Pretreatment Parameters Using RSM Plots

In order to understand the main and interactive effects between the pretreatment parameters on glucose and xylose yields, 3D response surface plots and contour lines were generated for glucose and xylose yields, according to the pretreatment condition (SL, ET and MP). This allows for the examination of the interactive effect of the operating parameters. The shape and color of the surface plot and the contour lines provide information about the relationship between the pretreatment variables and related response. Contour plots are the projection of the response surface on a two-dimensional plane, while 3D surface plots are the projection of the response surface on a three-dimensional plane [27].

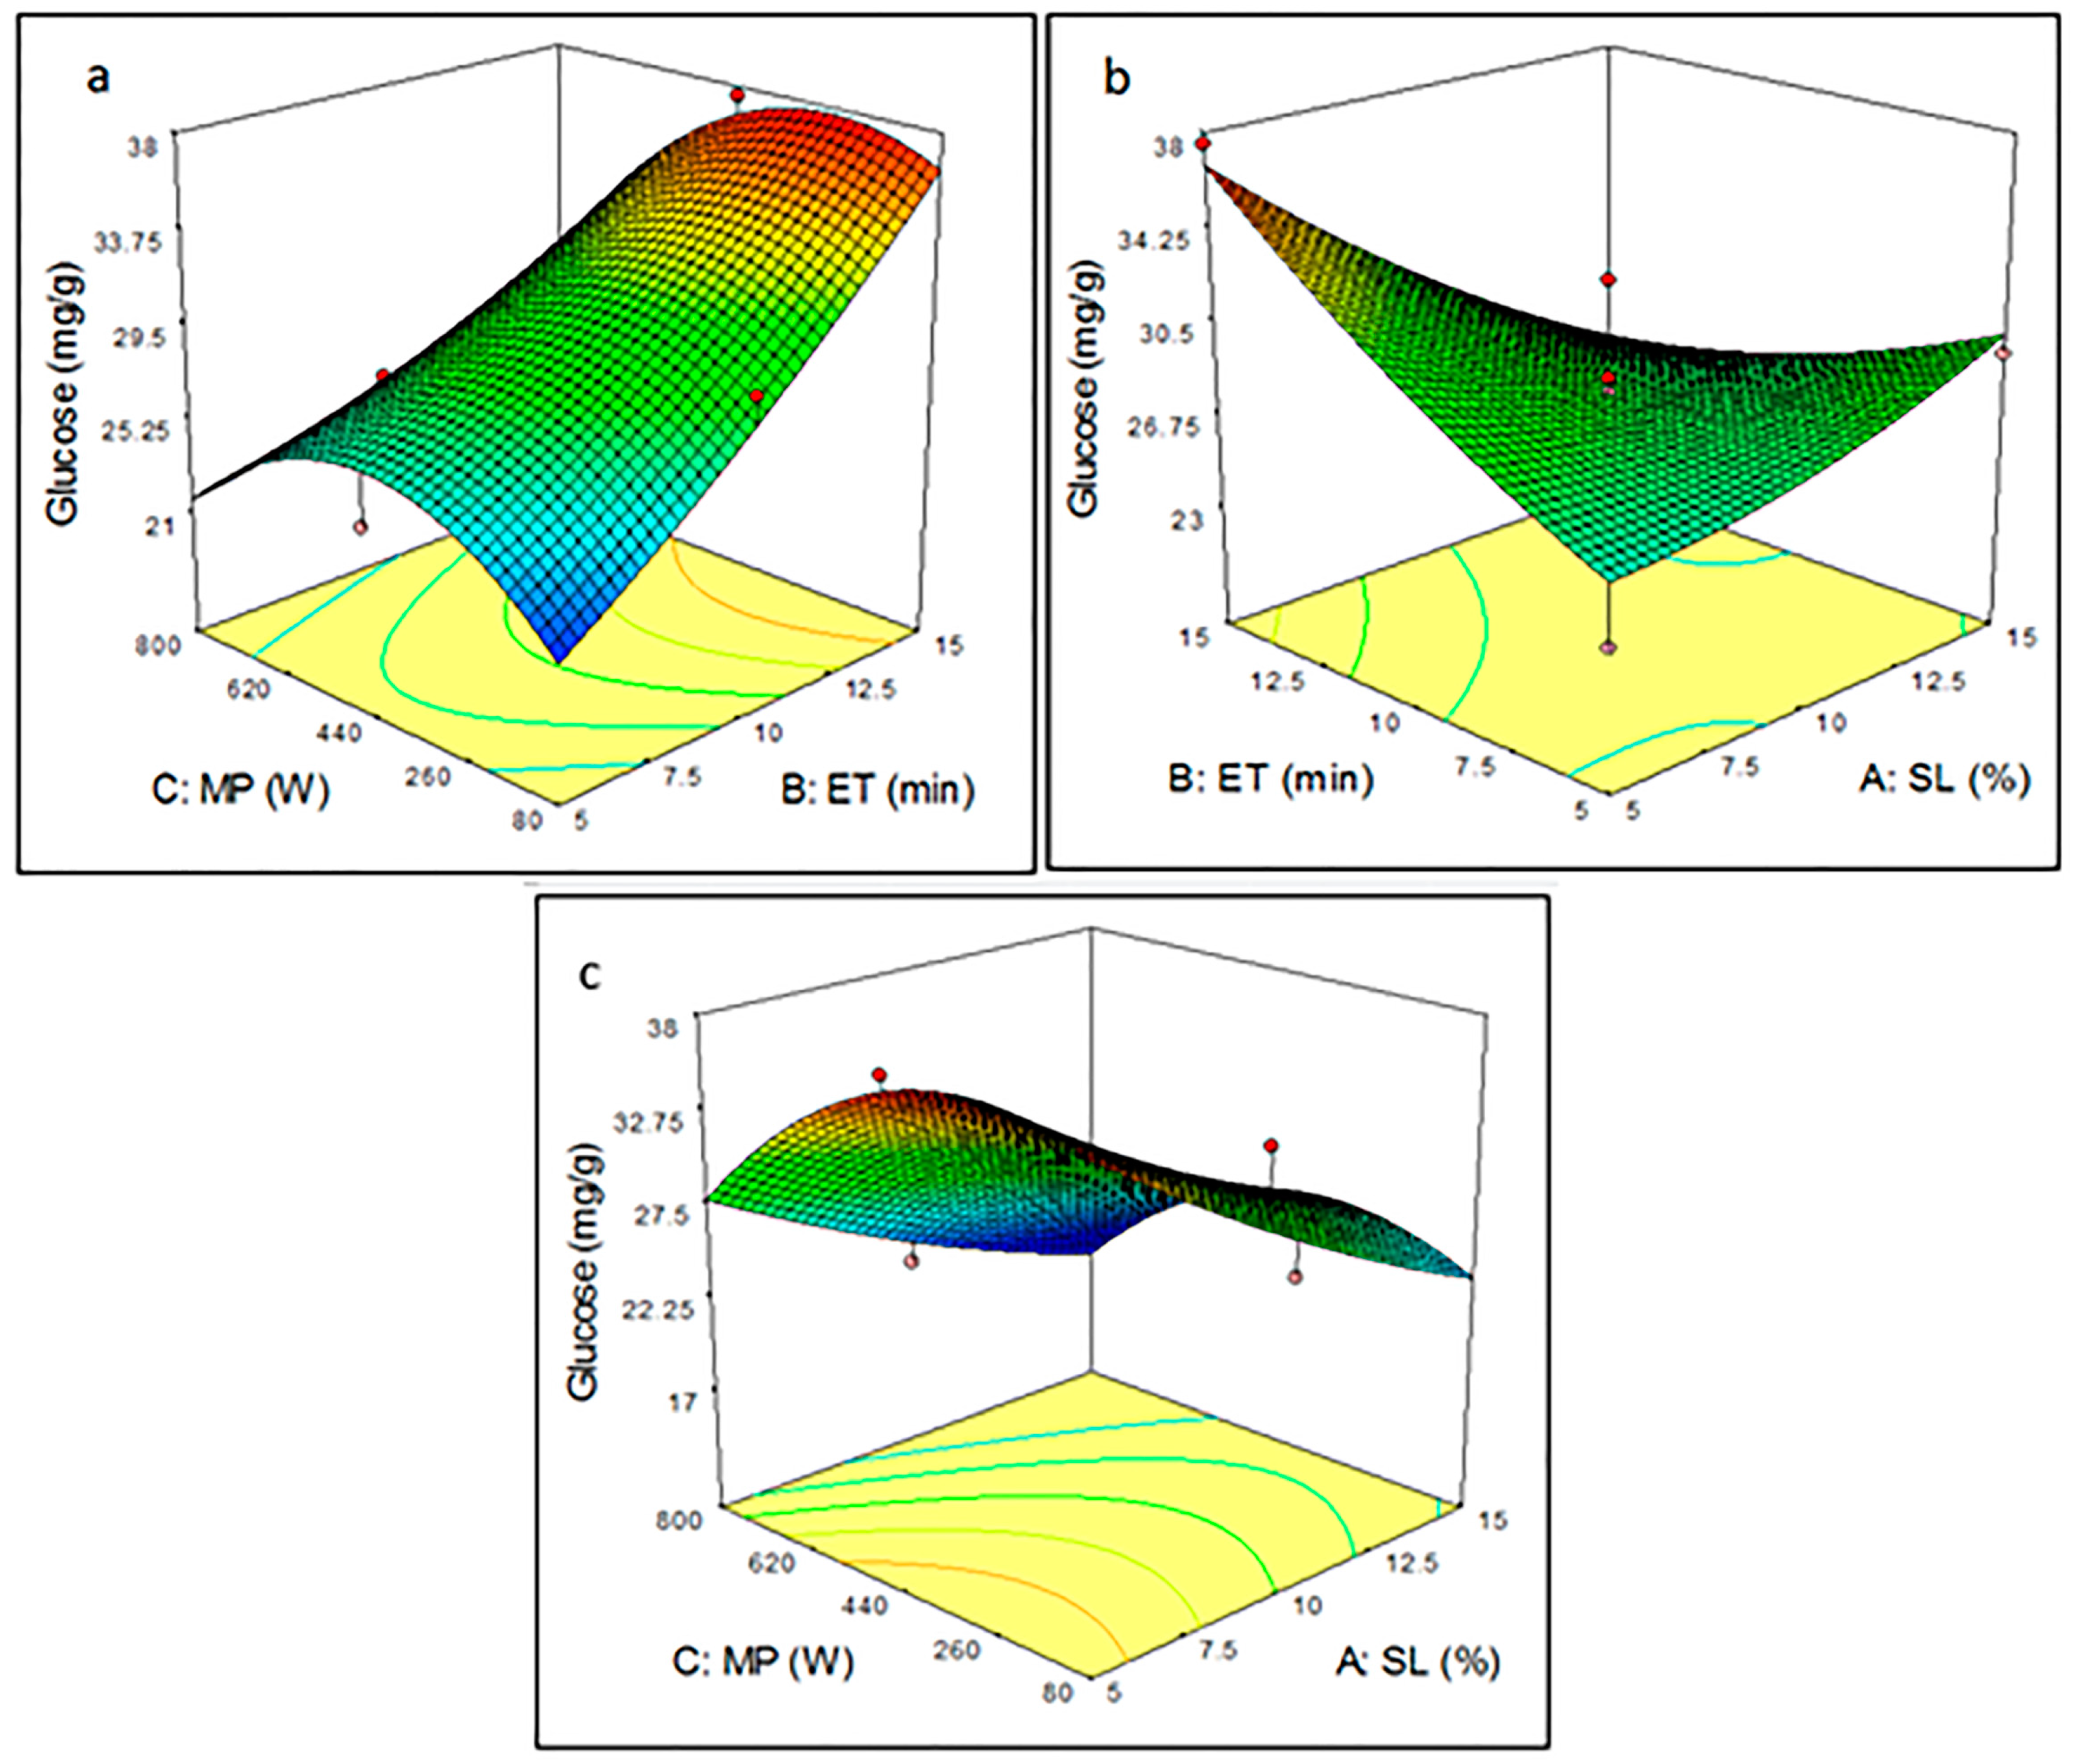
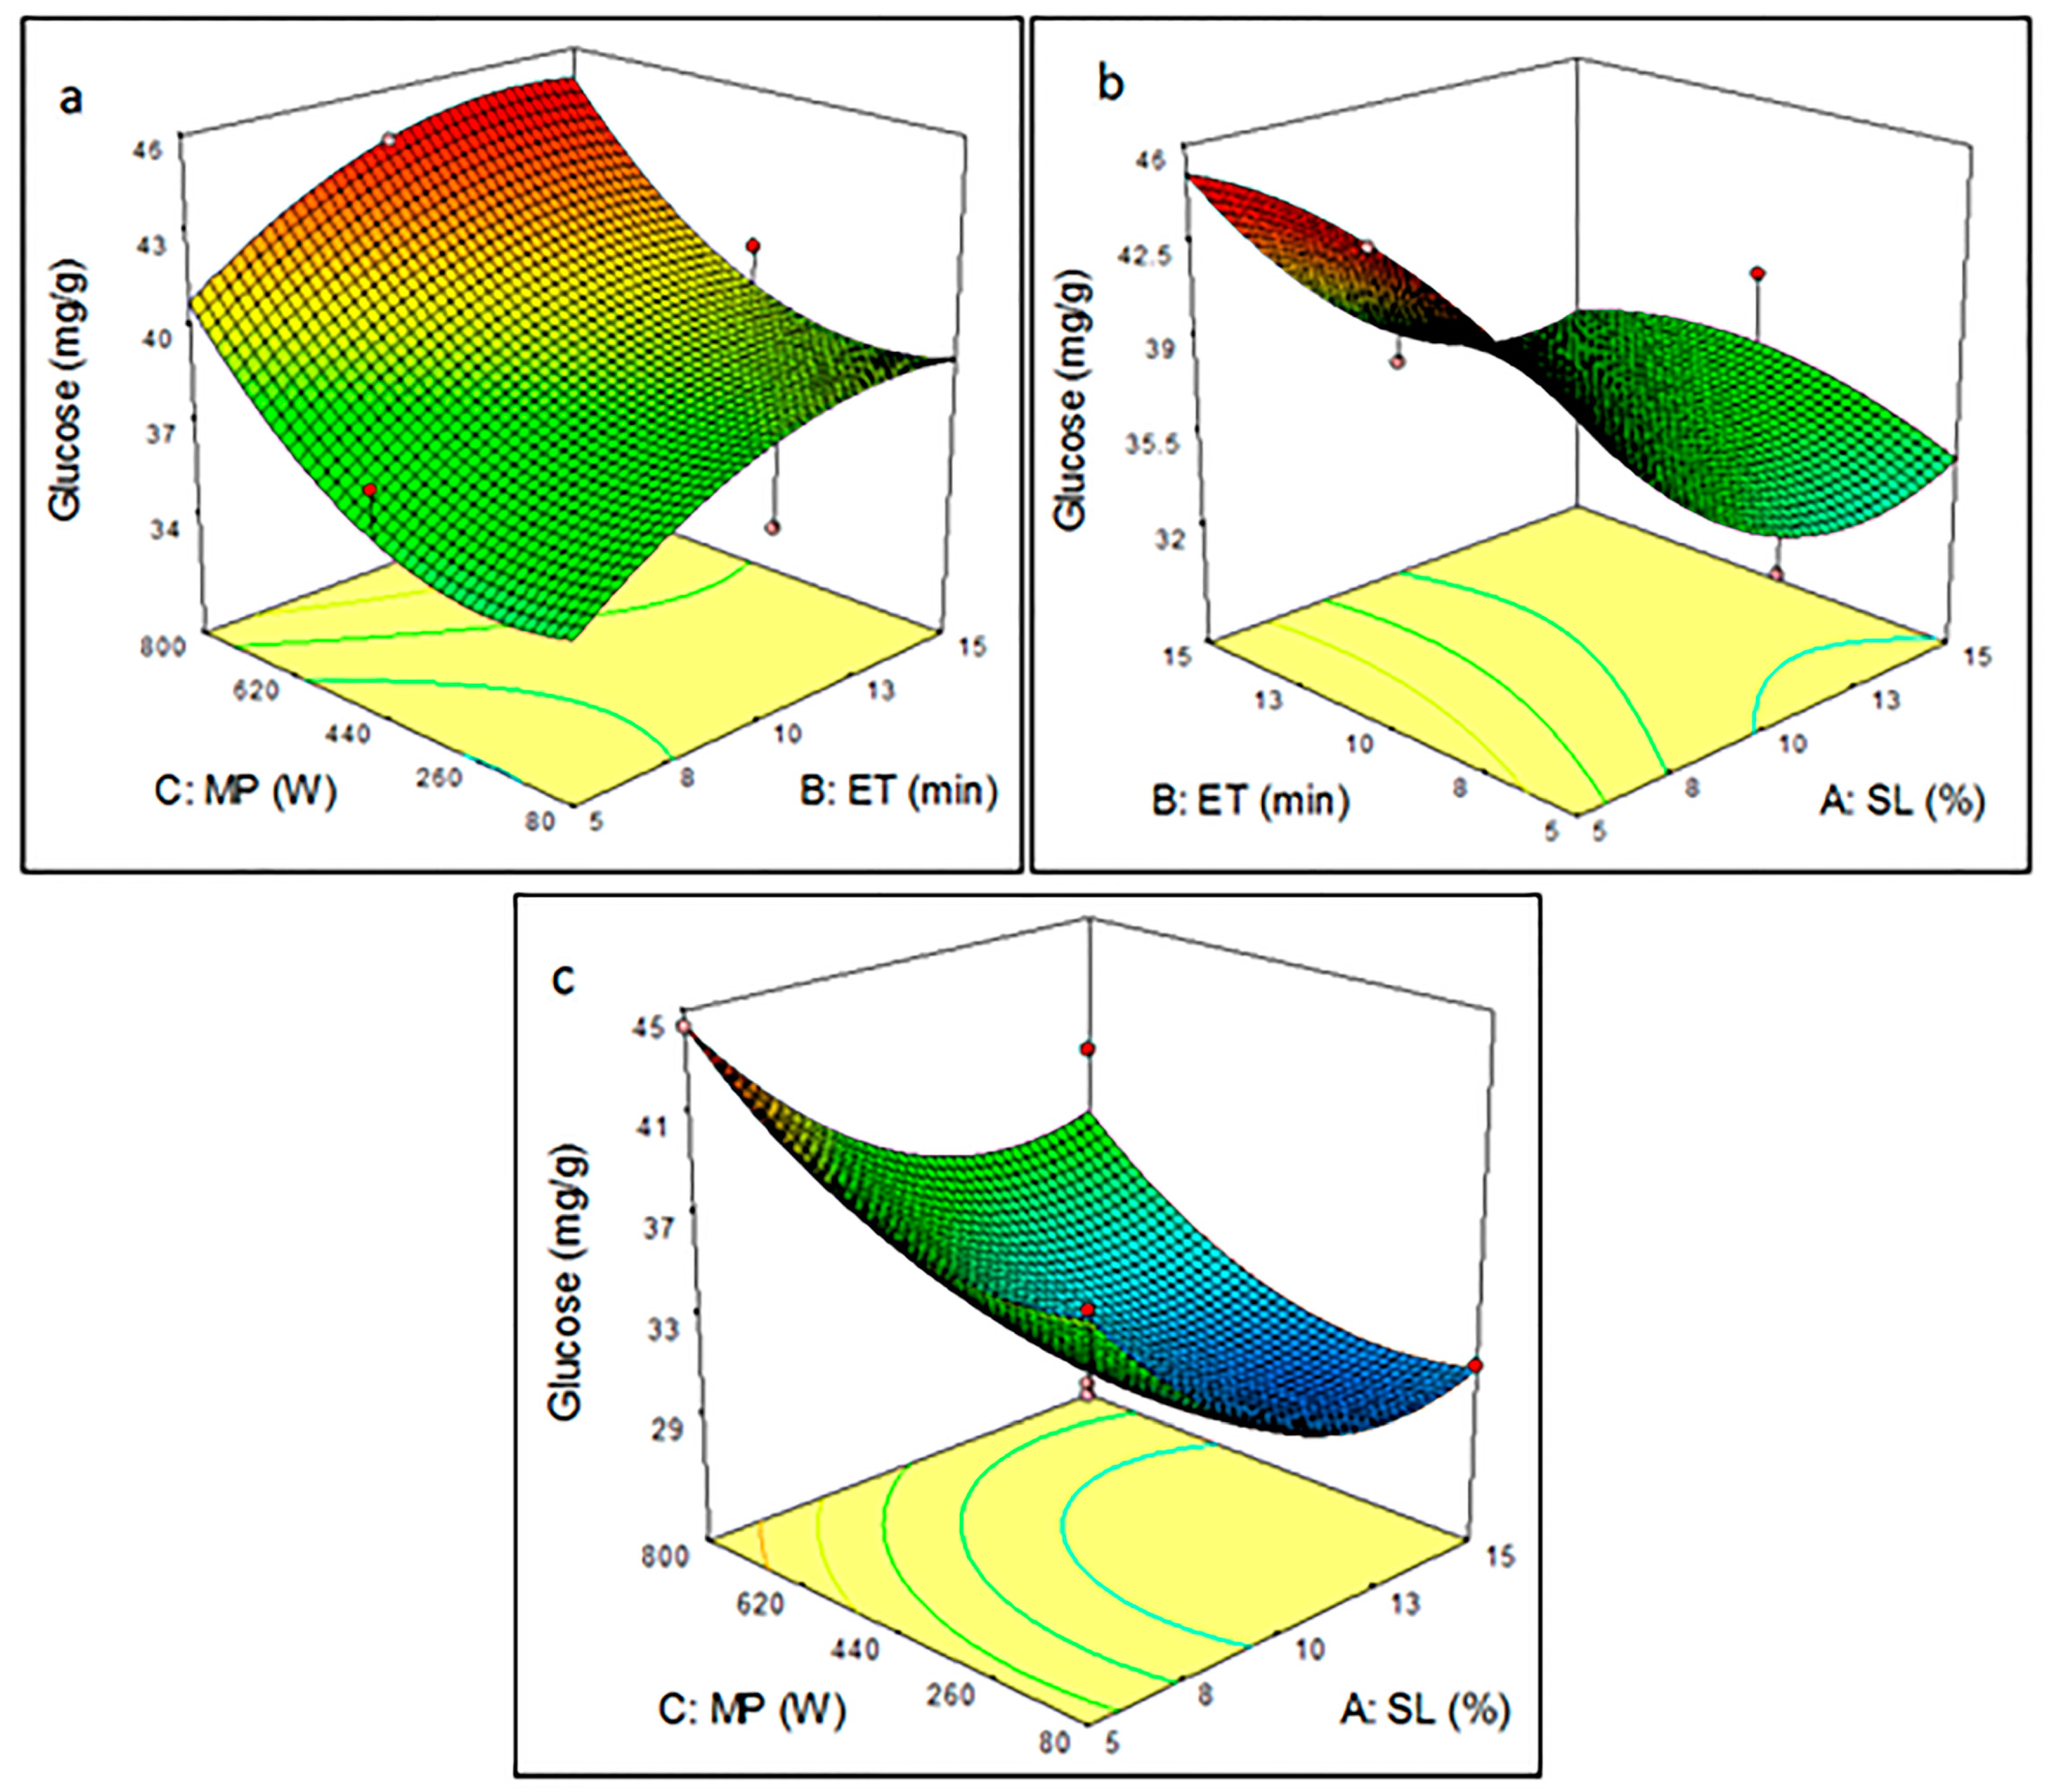
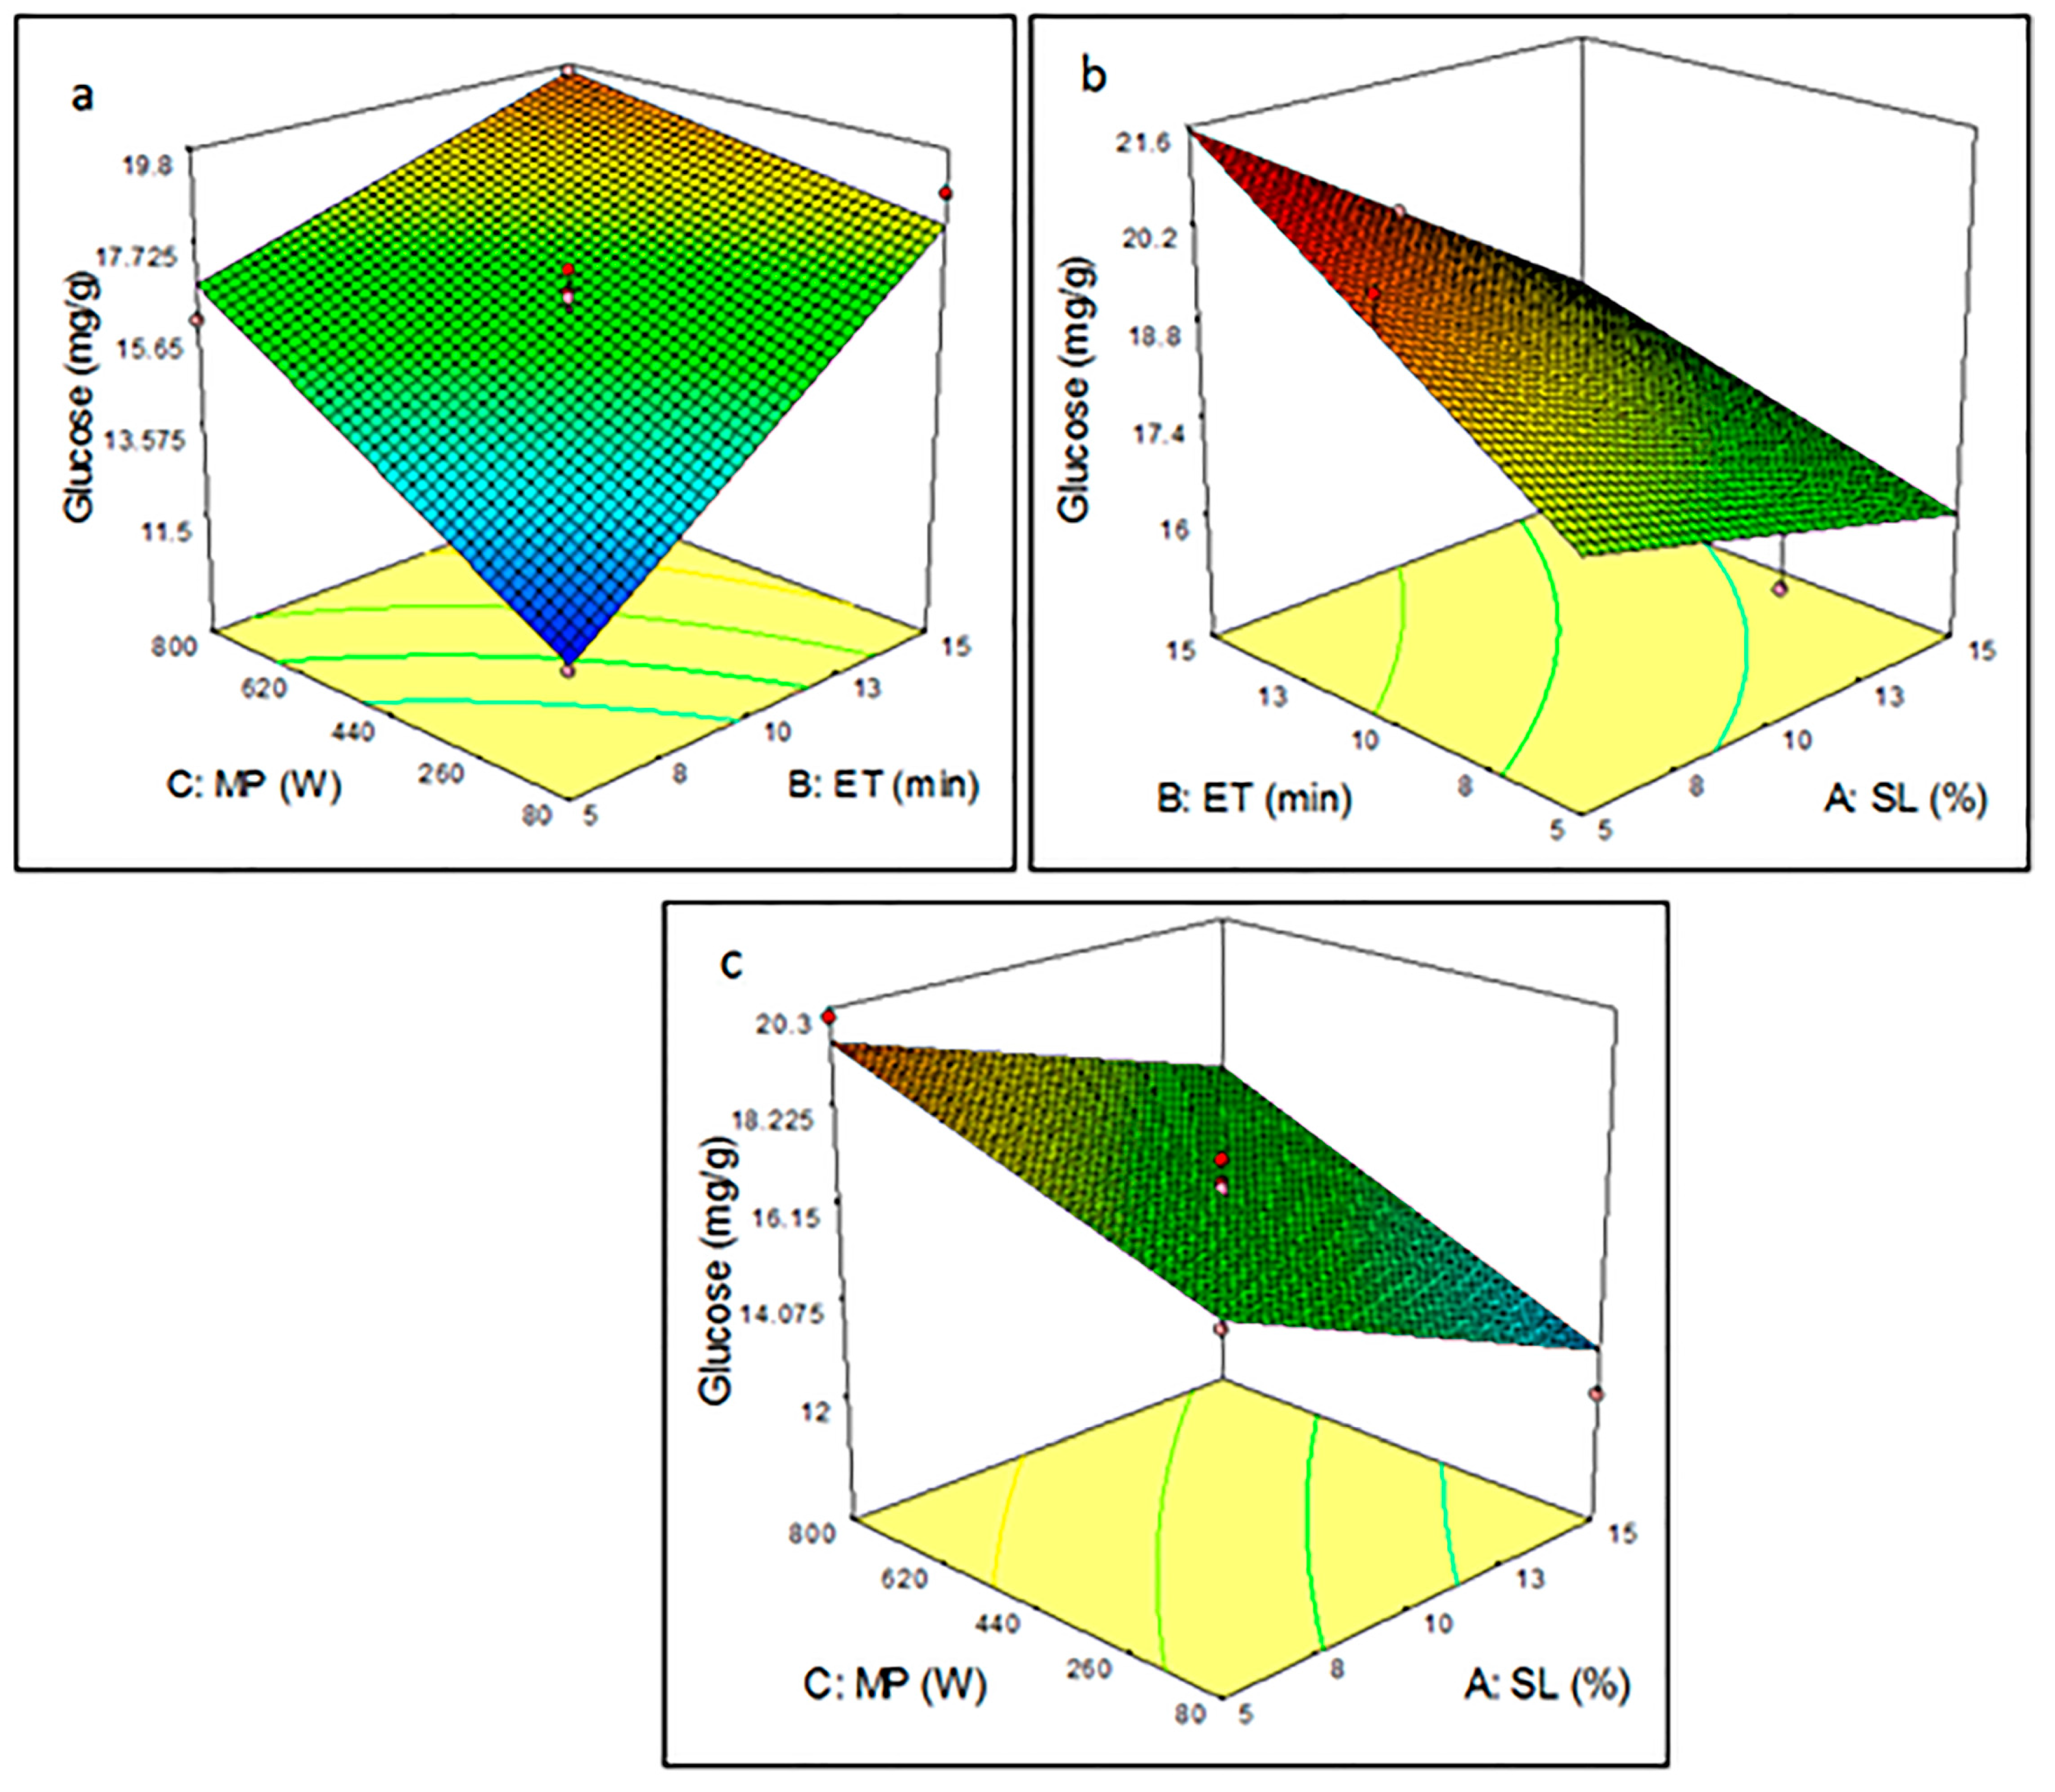
3.3.1. Pretreatment Parameters on Glucose Yield

Figure 2 displays the effect of the pretreatment parameters—solid loading (SL), exposure time (ET), and microwave power (MP)—on glucose yields during microwave-sulphuric acid (MSA) pretreatment. Figure 2a illustrates the response surfaces of the combined effects of MP and ET with a constant SL. The glucose yields gradually increased with an increase in MP and ET. However, after a certain point, further increases in MP caused a decrease in glucose yield. This might be related to the interactive effect of the third parameter (SL) whose effect on MP and ET can be clearly seen in the previous subsection in Table 3 regarding run 2 and run 7. It was reported that the increase in SL level could cause a decrease in the saccharification process. This might be attributed to the different ‘‘energy effect” with different SL. In other words, the samples with a high SL (and thus relatively low pretreatment solvent loading) receive less energy absorbed by the pretreatment solvent, resulting in a decrease in the internal heating and the oscillation of the pretreatment solvent molecules [17].
Figure 2b shows the relationship between ET and SL at a fixed MP. In this figure, the surface plot shows an increase in the glucose yield with an increase in ET, reaching a peak at the lowest SL (5%). An increase in ET allowed the sample (solvent + biomass) to absorb more microwave energy. This, in turn, generated more heat in the sample-breaking cellulose chains, which led to more enzyme accessibility during enzymatic hydrolysis, resulting in increased glucose yields [28].
Figure 2c shows a similar trend between MP and SL, where an increase in solid loading levels led to a gradual decrease in glucose yield. The higher glucose yields were found at the surface plot regions with low and medium SL. This confirms that high solid loadings have a negative effect on glucose yield because more energy is needed to produce a higher yield. A low solid loading allows the sample particles to receive more microwave energy per gram of the solid substrate. Moisture is heated inside the sample particles, evaporates, and generates tremendous pressure on the plant cell walls because of plant cell swelling. The pressure pushes the cell wall from inside, stretching and ultimately rupturing it, which facilitates a leaching out of the active constituents from the ruptured cell to the surrounding solvent, thus improving the yield of sugar [29].
Regarding MSH pretreatment, Figure 3 shows the combined effect of the pretreatment parameters on glucose yield. Figure 3a illustrates that a continuous increase in ET with a lower level of MP does not affect glucose yield, while increasing ET in combination with a high level of MP causes a steady increase in glucose yield due to the increase in heat generation within the sample. This may lead to a high delignification process because of disruptions in the lignin structure during the microwave-alkaline pretreatment [14]. Removing the lignin reduces the mechanical strength of the plant cell which, in turn, helps enzymes to access the cellulosic compounds inside the cell. Figure 3b shows that only lower levels of SL (less than 10%) result in a higher glucose yield at various ET levels. Figure 3c demonstrates that a higher level of microwave power leads to a higher glucose yield at lower levels of SL (5%), while an increase in SL to 15% causes a decrease in glucose yield mg/g (at a fixed ET). This is because samples which have low solid loading absorb more microwave energy, which helps to generate more heat within the sample. This reflects positively on enzymatic hydrolysis, as mentioned in an earlier study by Manaso et al. [28].
Regarding MSB pretreatment, Figure 4 depicts the effect of the operating parameters of this pretreatment on glucose yield. The response surface plot shape and the contour lines in Figure 4a indicate that there is a linear relationship among MP, ET, and glucose yield. An increase in both microwave power and exposure time intensified the generation of heat, enhancing the delignification process, making the lignocellulose more accessible for enzyme action. Figure 4b shows the interaction between ET and SL, where it can be seen that there is a contrasting relationship between the latter parameters and response. Similarly, Figure 4c shows the same relationship among MP, SL, and glucose yield as a result of the “energy effect”, where low solid loaded samples received more microwave energy [30].

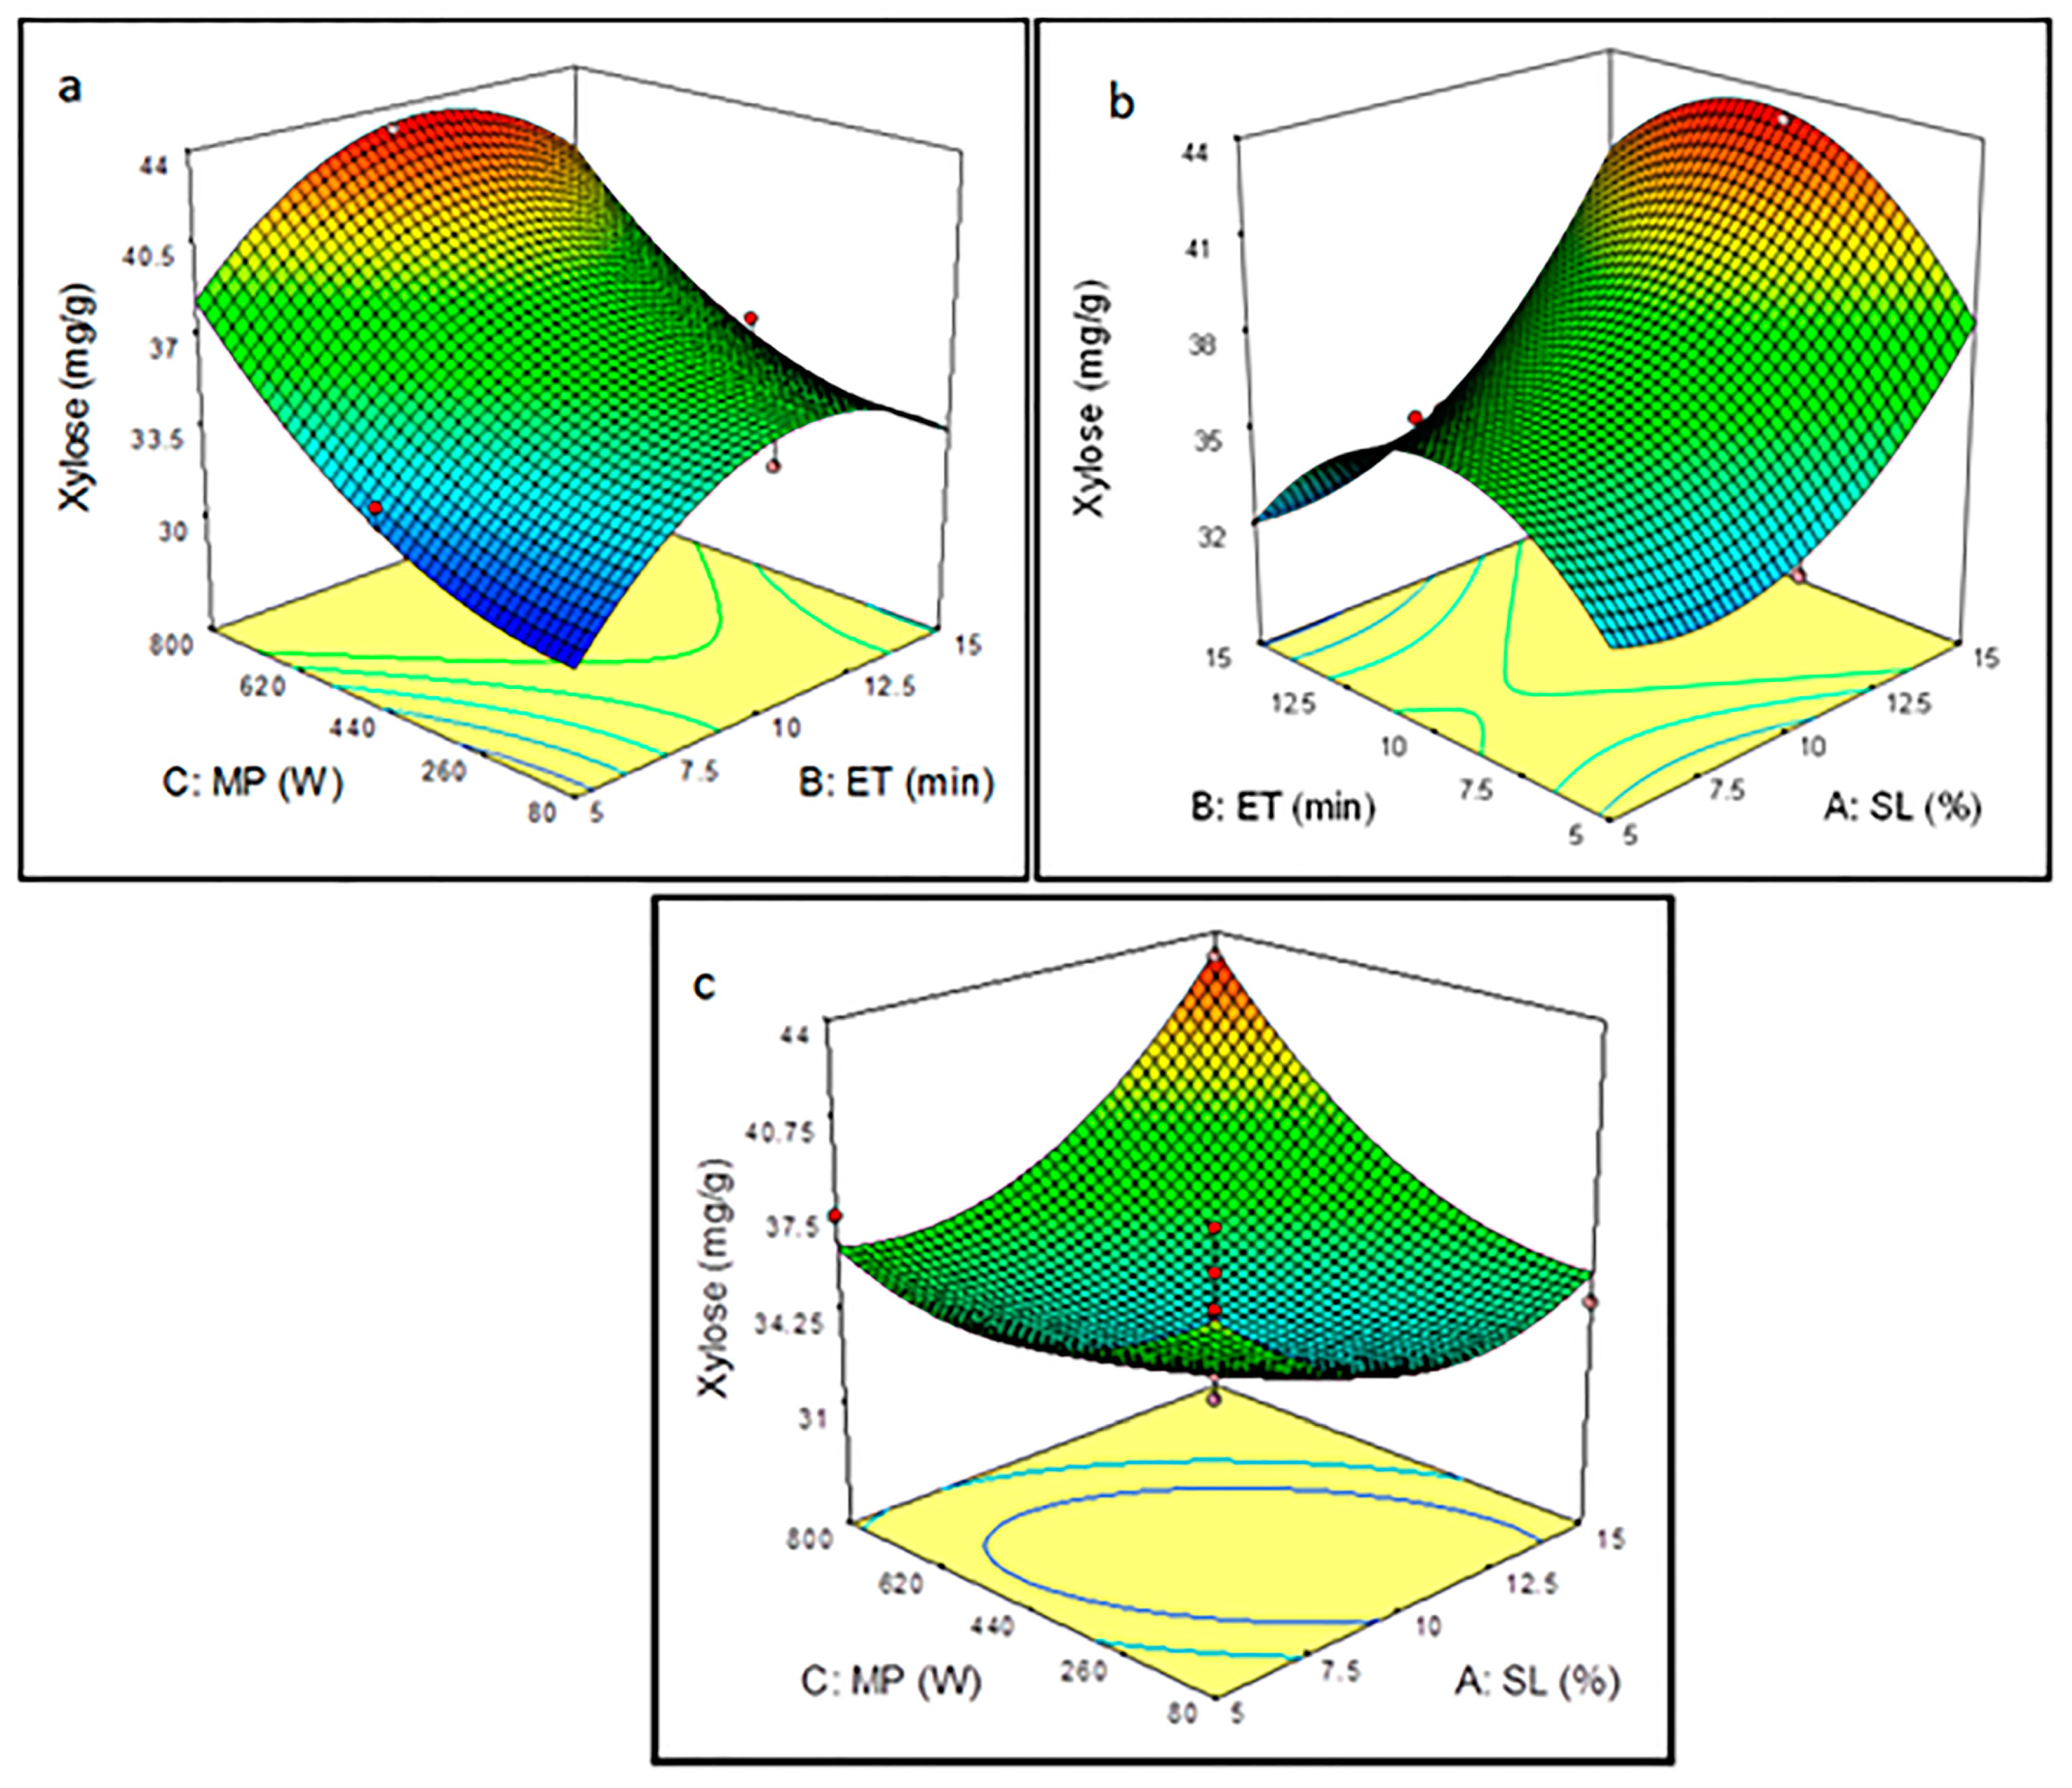
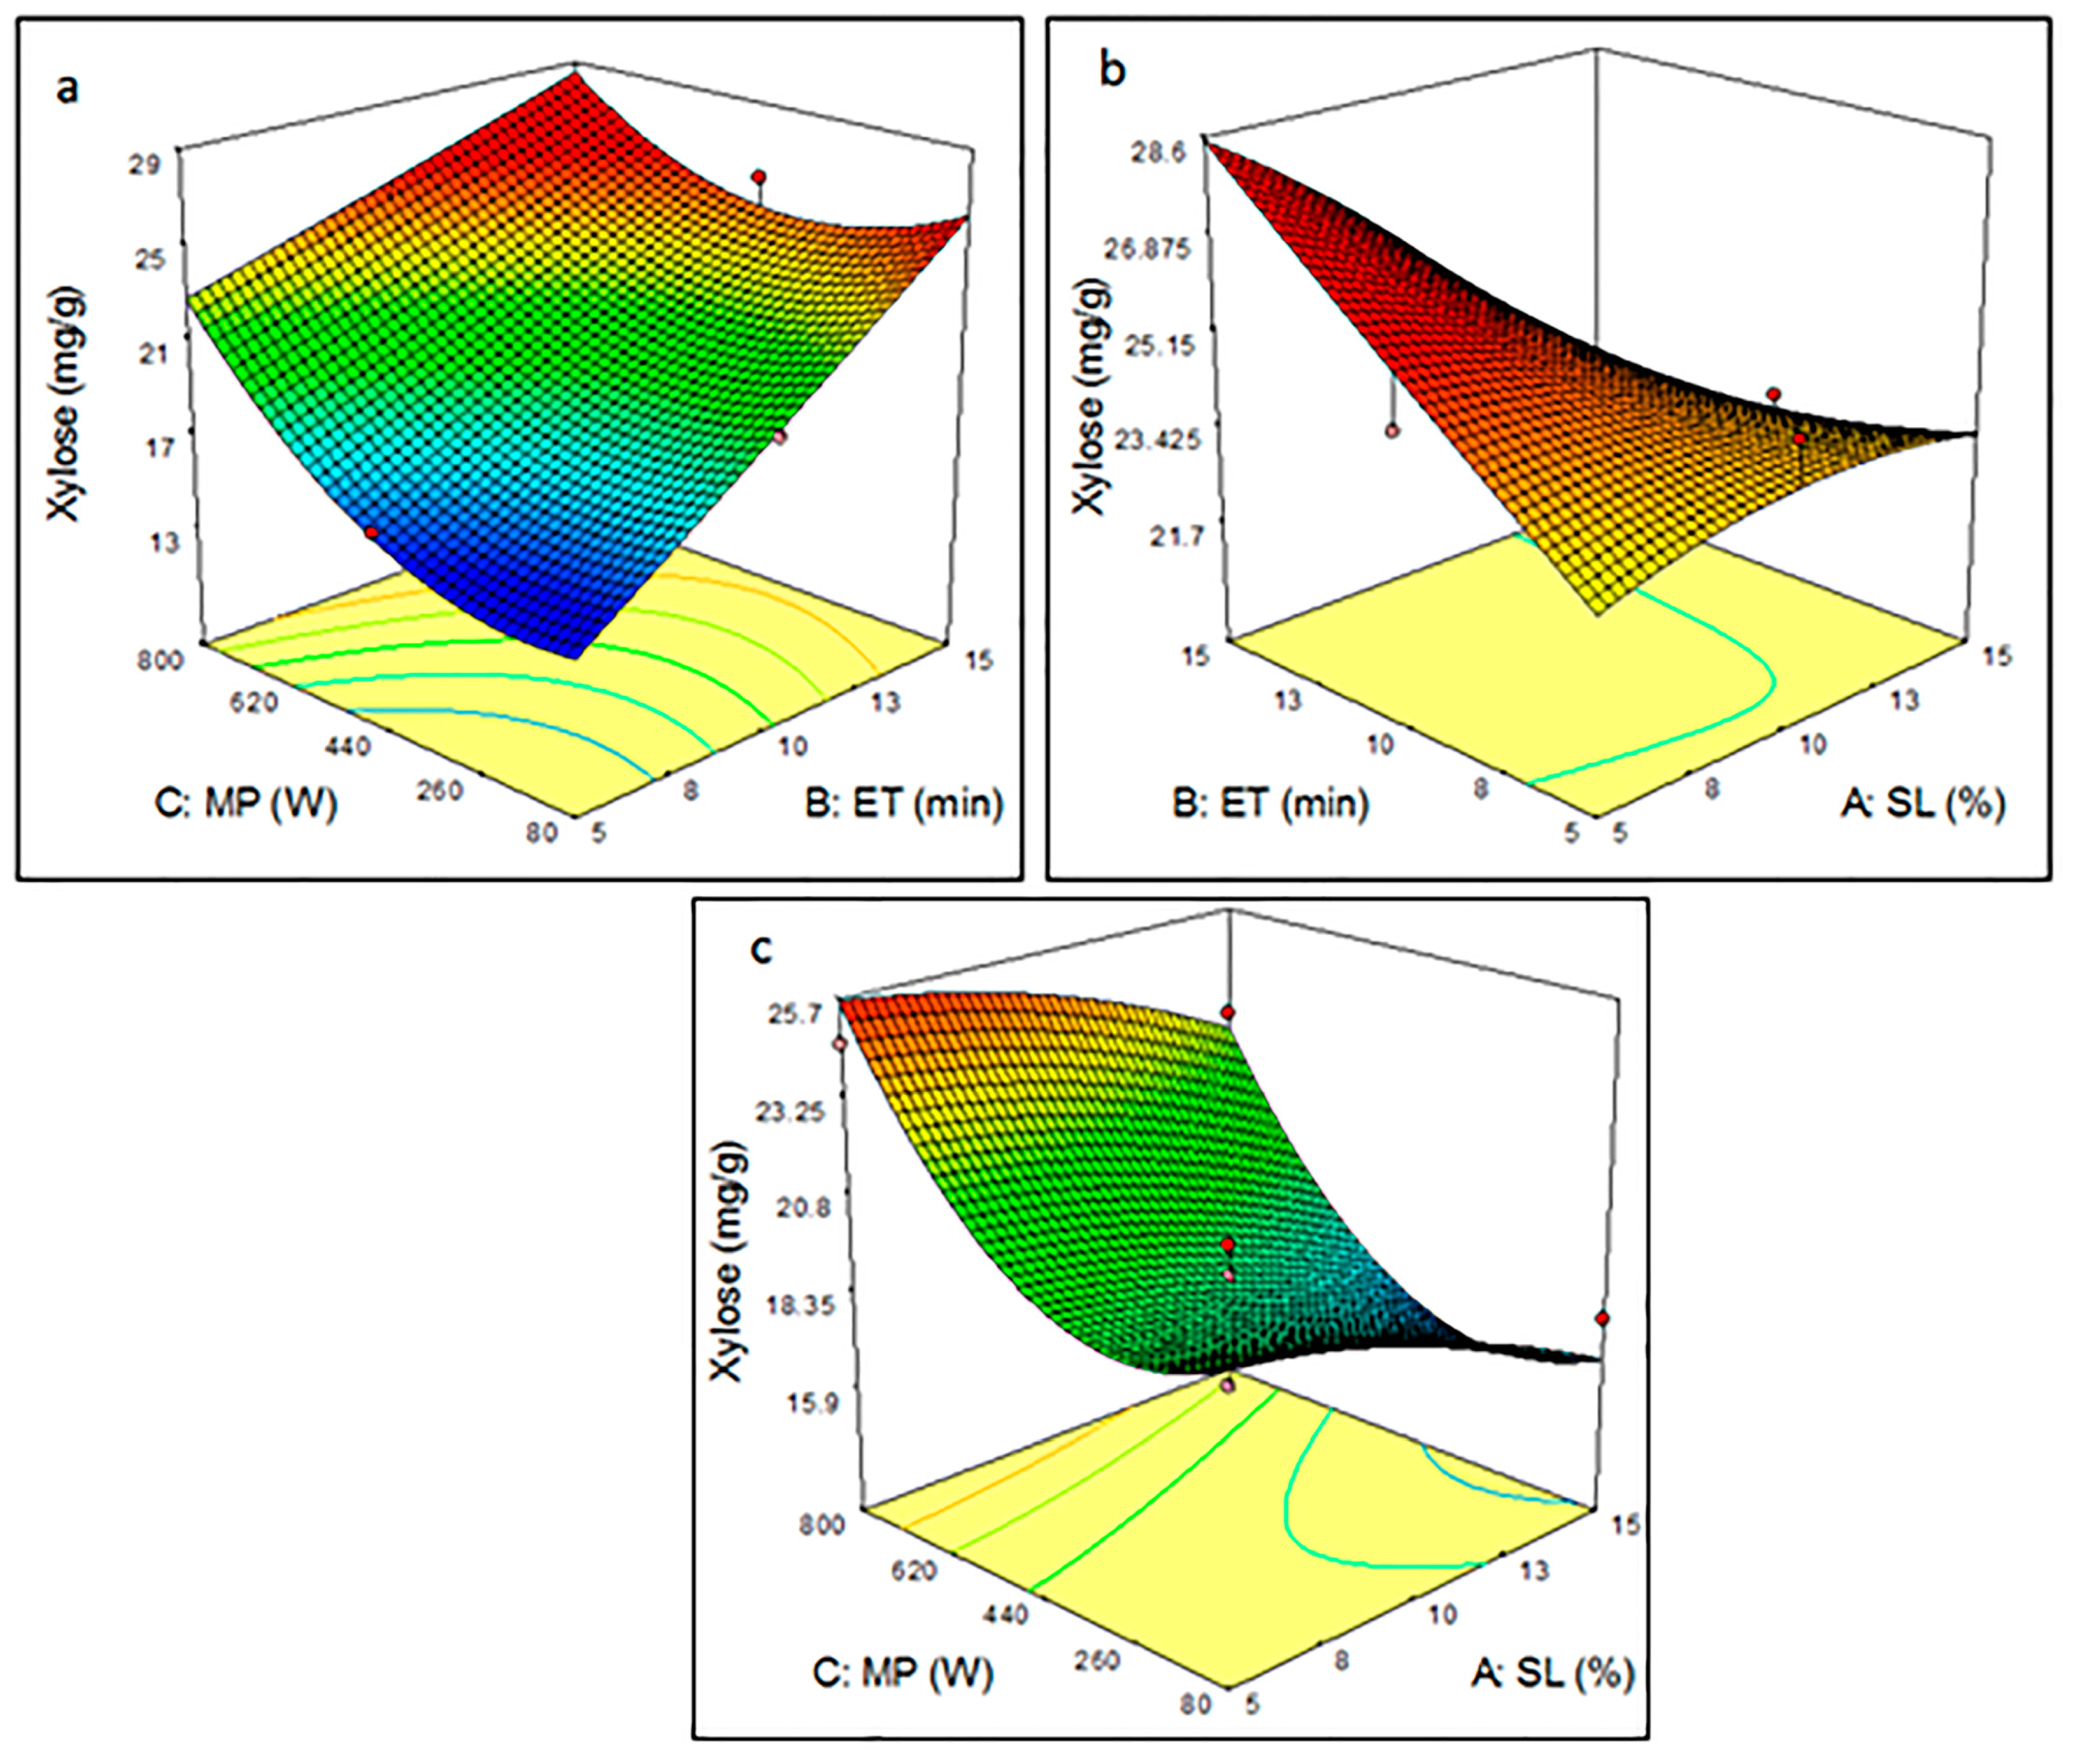
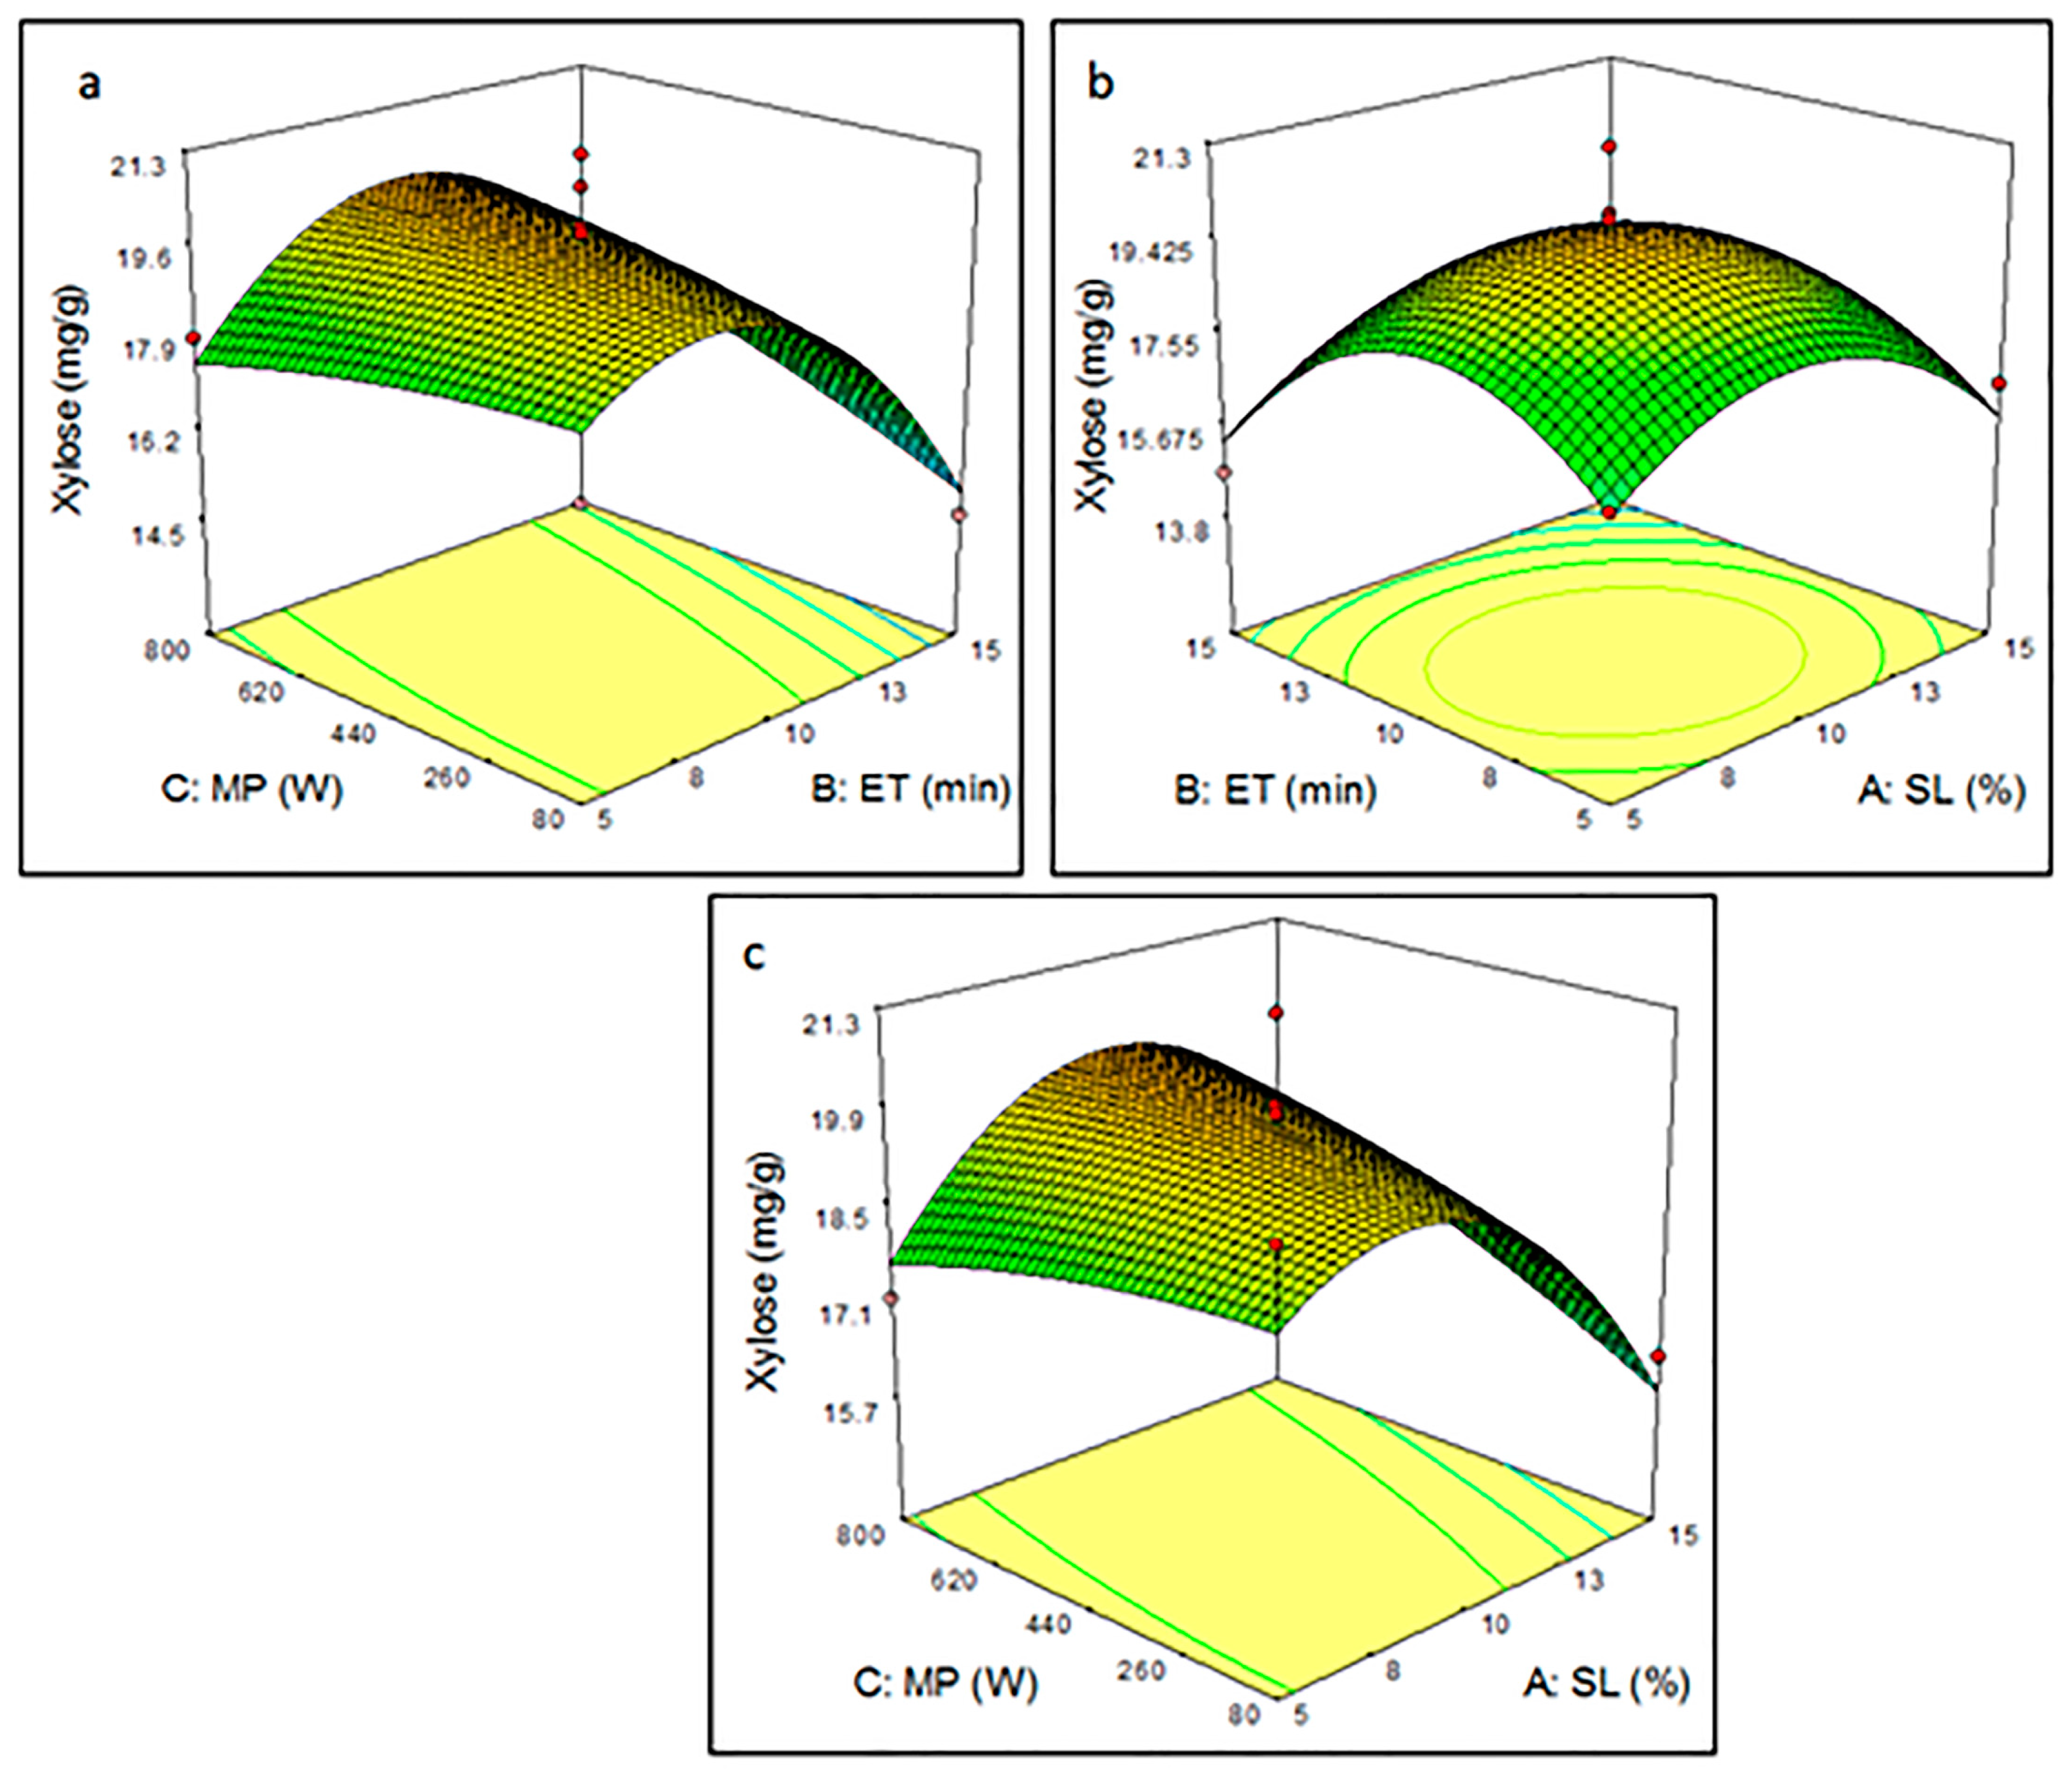
3.3.2. Effect of Pretreatment Parameters on Xylose Yield

Figure 5 illustrates the interactive effects of microwave-assisted pretreatment conditions MP, ET, and SL on xylose yields under MSA pretreatment. Figure 5a points to a strong interaction between MP and ET. It can be observed that the gradual increase in microwave power from 80 to 800 W enhanced the xylose yield from 32 to 43.2 mg/g at low and medium levels of exposure time. A maximum xylose yield (43.2 mg/g) was achieved at 800 W for 10 min. However, increasing the exposure time beyond 10 min caused a decrease in xylose yield, a similar finding to that of Ma et al. [17]. This interactive effect between irradiation time and microwave power level increased biomass digestibility by enhancing hemicellulose removal. However, an extended exposure time with a higher microwave power may lead to a decline in biomass digestibility, as this increases irradiation time and microwave power cause high temperatures within the sample, which could initiate the decomposition of released sugar [31].
By the same token, as seen in Figure 5b, ET has a stronger influence on xylose yield compared to SL. The xylose yield is less influenced by increases in SL, while the increase in ET results in a higher xylose yield until a specific point. Ma et al. [17] reported that the elliptical nature of the contour plots refers to a prominent interaction between the pretreatment variables, as seen between MP and SL in Figure 5c. An increase in solid loading causes a decrease in biomass digestibility at low and medium levels of MP; an increase in microwave power to 800 W mitigates the negative effect of the increase in solid loading. These results can be attributed to the energy effect for high solid loading samples. By increasing microwave power, the sample is able to receive more energy absorbed by the solvent, which helps to disturb the hemicellulose structure, impacting positively on xylose yield [32].
Similarly, Figure 6a shows the significant interaction between MP and ET at a constant solid loading on xylose yields under MSH pretreatment. The gradual increase in microwave power and exposure time causes a gradual increase in xylose yield. Extending the exposure time and increasing the microwave power, in addition to the high dielectric constant of NaOH (6.8 Debay) [33], can lead to higher heat generation within the sample which, in turn, enhances sugar yield. These results support the view that to facilitate partial hemicellulose fractionation may require a strong pretreatment condition during alkaline pretreatment [34].
Figure 6b suggests a significant relationship between exposure time and solid loading; a high xylose yield (25.7 mg/g) was found with a longer exposure time (15 min) and a low solid load (5%). Extended exposure time and low solid loadings allow the samples to absorb more energy, which intensifies the generation of heat within the biomass particles. This increases hemicellulose destruction and enhances its hydrolysis, resulting in the swelling of the biomass particles and the improvement of carbohydrate accessibility to enzymes [34]. It has been suggested that alkaline pretreatments may need more time to reach the same level of digestibility offered by other pretreatments [5]. Figure 6c shows that the xylose yield found at a high microwave power and low solid loading decreased when the microwave power was reduced, and solid loading was increased. These results can also be explained by energy absorption, where higher microwave power provided more energy, causing an increase in reaction temperature. In summary, it can now be stated that high microwave power, longer exposure time, and low solid loading during MSH pretreatment can enhance xylose yield during the enzymatic hydrolysis step.
Figure 7a shows that a gradual increase in microwave power and exposure time can increase xylose yield until a tipping point is reached where further increments cause a decrease in xylose yield. This may be related to the formation of carbonic acid in NaHCO3 aqueous solutions which, coupled with heat, cause sodium bicarbonate to act as a raising agent by releasing carbon dioxide [35]. This enhances biomass destruction. However, extended exposure time and microwave power does not enhance the sugar yield; this may be due to loss of carbon dioxide because of the conversion of sodium bicarbonate. The circular contour nature between exposure time and solid loading, as shown Figure 7b, suggests a less prominent or negligible interaction between these two parameters [17]. Figure 7c also illustrates a minor interactive effect between MP and SL, as there is no significant difference in xylose yield (between 5% and 15%) or increase in microwave power (from 80 to 800 W). In other words, the xylose yield is less affected by the interaction of pretreatment variables during MSB pretreatment.

4. Conclusions

The results revealed that MSA pretreatment is the most efficient sago palm bark pretreatment technique, compared to the two other types of microwave-alkali pretreatment (MSH and MSB), for the release of reducing sugar and the yield of xylose. However, MSH pretreatment methods resulted in the higher glucose yield. The analyses of the effects of the pretreatment parameters MP, ET, and SL on the glucose and xylose yield from SPB revealed that microwave-assisted pretreatment parameters showed different patterns of influence on glucose and xylose yield via enzymatic hydrolysis for MSA, MSH, and MSB pretreatment. From this, it can be interfered that variation in microwave-assisted pretreatment parameters and the pretreatment solution play a crucial role on the sugar yield from lignocellulosic biomass. For further studies, the performance of conventional sulphuric acid pretreatments using the same solvent level and same exposure time is recommended. Moreover, the base cost analysis is useful when exploring new technology. Therefore, conducting overall mass-energy balance and economic analyses will help the microwave-assisted pretreatment to be commercialized. Additionally, performing the microwave-assisted pretreatment in a microwave system equipped with a temperature sensor will be useful to develop the kinetic models for sugar yield. Moreover, this will enable the identification of appropriate process parameters that will be useful in the scale-up of microwave-assisted pretreatment processes.

Author Contributions

Conceptualization, S.E.; data curation, S.E. and R.O.; formal analysis, S.E.; R.O.; M.K.S.M. and A.B.D.R.; investigation, S.E.; methodology, S.E.; R.O.; M.K.S.M. and A.B.D.R.; project administration, R.O.; resources, S.E.; R.O.; M.K.S.M. and A.B.D.R.; software, S.E.; M.K.S.M.; supervision, R.O.; M.K.S.M. and A.B.D.R.; writing—original draft, S.E.; writing—review and editing, S.E. and R.O.; funding acquisition, R.O. All authors have read and agreed to the published version of the manuscript.

Funding

This research was funded by IPMS, grant number 9446900.

Acknowledgments

The authors are grateful for the support of the University Putra Malaysia and the University of Thi-Qar for their financial support.

Conflicts of Interest

The authors declare that there is no conflict of interest regarding the publication of this paper.

References

  1. Ethaib, S. Solid Waste Situation in Thi-Qar Governorate. In IOP Conference Series: Material Science Engineering; IOP Publishing: Bristol, UK, 2019; p. 584012023. [Google Scholar]
  2. Ethaib, S.; Omar, R.; Mazlina, M.; Radiah, A.; Syafiie, S.; Harun, M.Y. Effect of microwave-assisted acid or alkali pretreatment on sugar release from Dragon fruit foliage. Int. Food Res. J. 2016, 23, S149–S154. [Google Scholar]
  3. Ethaib, S.; Erabee, I.K.; Abdulsahib, A.A. Removal of Methylene Blue Dye from Synthetic Wastewater using Kenaf Core and Activated Carbon. Int. J. Eng. Technol. 2018, 7, 909–913. [Google Scholar] [CrossRef] [Green Version]
  4. Ethaib, S.; Omar, R.; Mustapa Kamal, S.M.; Awang Biak, D.R.; Syam, S.; Harun, M.Y. Microwave-assisted pretreatment of sago palm bark. J. Wood Chem. Technol. 2017, 37, 26–42. [Google Scholar] [CrossRef]
  5. Jørgensen, H.; Kristensen, J.B.; Felby, C. Enzymatic conversion of lignocellulose into fermentable sugars: Challenges and opportunities. Biofuels Bioprod. Biorefin. 2007, 1, 119–134. [Google Scholar] [CrossRef]
  6. Öhgren, K.; Bura, R.; Saddler, J.; Zacchi, G. Effect of hemicellulose and lignin removal on enzymatic hydrolysis of steam pretreated corn stover. Bioresour. Technol. 2007, 98, 2503–2510. [Google Scholar] [CrossRef]
  7. Blue, D.; Fortela, D.L.; Holmes, W.; LaCour, D.; LeBoeuf, S.; Stelly, C.; Revellame, E.D. Valorization of Industrial Vegetable Waste Using Dilute HCl Pretreatment. Processes 2019, 7, 853. [Google Scholar] [CrossRef]
  8. Han, L.; Feng, J.; Zhang, S.; Ma, Z.; Wang, Y.; Zhang, X. Alkali pretreated of wheat straw and its enzymatic hydrolysis. Braz. J. Microbiol. 2012, 43, 53–61. [Google Scholar] [CrossRef]
  9. Min, D.Y.; Xu, R.S.; Hou, Z.; Lv, J.Q.; Huang, C.X.; Jin, Y.C.; Yong, Q. Minimizing inhibitors during pretreatment while maximizing sugar production in enzymatic hydrolysis through a two-stage hydrothermal pretreatment. Cellulose 2015, 22, 1253–1261. [Google Scholar] [CrossRef]
  10. Ethaib, S.; Omar, R.; Mustapa Kamal, S.M.; Awang Biak, D.R. Comparison of sodium hydroxide and sodium bicarbonate pretreatment methods for characteristic and enzymatic hydrolysis of sago palm bark. Energy Source Part A Recovery Util. Environ. Eff. 2020, 1–11. [Google Scholar] [CrossRef]
  11. Ethaib, S.; Omar, R.; Kamal, S.M.; Biak, D.A. Microwave-assisted pretreatment of lignocellulosic biomass: A review. J. Eng. Sci. Technol. 2015, 2, 97–109. [Google Scholar]
  12. Mokhtar, N.M.; Ethaib, S.; Omar, R. Effects of microwave absorbers on the products of microwave pyrolysis of oily sludge. J. Eng. Sci. Technol. 2018, 13, 3313–3330. [Google Scholar]
  13. Rahimi, M.A.; Omar, R.; Ethaib, S.; Mazlina, M.S.; Biak, D.A.; Aisyah, R.N. Microwave-Assisted Extraction of Lipid from Fish Waste. In IOP Conference Series: Material Science Engineering; IOP Publishing: Bristol, UK, 2017; Volume 206, p. 012096. [Google Scholar]
  14. Komolwanich, T.; Tatijarern, P.; Prasertwasu, S.; Khumsupan, D.; Chaisuwan, T.; Luengnaruemitchai, A. Comparative potentiality of Kans grass (Saccharum spontaneum) and Giant reed (Arundo donax) as lignocellulosic feedstocks for the release of monomeric sugars by microwave/chemical pretreatment. Cellulose 2014, 21, 1327–1340. [Google Scholar] [CrossRef]
  15. Alexandre, A.M.; Matias, A.A.; Bronze, M.R.; Cocero, M.J.; Mato, R. Phenolic Compounds Extraction of Arbutus unedo L.: Process Intensification by Microwave Pretreatment. Processes 2020, 8, 298. [Google Scholar] [CrossRef] [Green Version]
  16. Ethaib, S.; Omar, R.; Mazlina, M.K.S.; Radiah, A.B.D.; Syafiie, S. Microwave-assisted Dilute Acid Pretreatment and Enzymatic Hydrolysis of Sago Palm Bark. BioResources 2016, 11, 5687–5702. [Google Scholar] [CrossRef] [Green Version]
  17. Ma, H.; Liu, W.; Chen, X.; Wu, Y.; Yu, Z. Enhanced enzymatic saccharification of rice straw by microwave pretreatment. Bioresour. Technol. 2009, 100, 1279–1284. [Google Scholar] [CrossRef]
  18. Vani, S.; Binod, P.; Kuttiraja, M.; Sindhu, R.; Sandhya, S.V.; Preeti, V.E.; Pandey, A. Energy requirement for alkali assisted microwave and high pressure reactor pretreatments of cotton plant residue and its hydrolysis for fermentable sugar production for biofuel application. Bioresour. Technol. 2012, 112, 300–307. [Google Scholar] [CrossRef]
  19. Chan, C.H.; Yusoff, R.; Ngoh, G.C.; Kung, F.W.L. Microwave-assisted extractions of active ingredients from plants. J. Chromatogr. A 2011, 1218, 6213–6225. [Google Scholar] [CrossRef]
  20. Ethaib, S.; Omar, R.; Mazlina, M.K.S.; Radiah, A.B.D.; Syafiie, S. Development of a hybrid PSO–ANN model for estimating glucose and xylose yields for microwave-assisted pretreatment and the enzymatic hydrolysis of lignocellulosic biomass. Neural Comput. Appl. 2018, 30, 1111–1121. [Google Scholar] [CrossRef]
  21. Bouras, M.; Chadni, M.; Barba, F.J.; Grimi, N.; Bals, O.; Vorobiev, E. Optimization of microwave-assisted extraction of polyphenols from Quercus bark. Ind. Crop. Prod. 2015, 77, 590–601. [Google Scholar] [CrossRef]
  22. Chadni, M.; Bals, O.; Ziegler-Devin, I.; Brosse, N.; Grimi, N. Microwave-assisted extraction of high-molecular-weight hemicelluloses from spruce wood. Comptes Rendus Chim. 2019, 22, 574–584. [Google Scholar] [CrossRef]
  23. Adney, B.; Baker, J. Measurement of Cellulase Activities. In Laboratory Analytical Procedure; National Renewable Energy Laboratory (NREL): Golden, CO, USA, 1996; Volume 6. [Google Scholar]
  24. Miller, G.L. Use of dinitrosalicylic acid reagent for determination of reducing sugar. Anal. Chem. 1959, 31, 426–428. [Google Scholar] [CrossRef]
  25. Jeffries, T.W.; Yang, V.W.; Davis, M.W. Comparative study of xylanase kinetics using dinitrosalicylic, arsenomolybdate, and ion chromatographic assays. Appl. Biochem. Biotechnol. 1998, 70, 257–265. [Google Scholar] [CrossRef] [PubMed]
  26. Zhang, S.; Wang, W.C.; Li, F.X.; Yu, J.Y. Swelling and dissolution of cellulose in NaOH aqueous solvent systems. Cellul. Chem. Technol. 2013, 47, 671–679. [Google Scholar]
  27. Box, G.E.; Hunter, J.S. Multi-factor experimental designs for exploring response surfaces. Ann. Math. Stat. 1957, 1, 195–241. [Google Scholar] [CrossRef]
  28. Manaso, J.; Luengnaruemitchai, A.; Wongkasemjit, S. Optimization of two-stage pretreatment combined with microwave radiation using response surface methodology. World Academy of Science, Engineering and Technology World Academy of Science, Engineering and Technology (WASET). Int. J. Chem. Mol. Eng. 2013, 76, 599. [Google Scholar]
  29. Mandal, V.; Mohan, Y.; Hemalatha, S. Microwave assisted extraction—An innovative and promising extraction tool for medicinal plant research. Pharmacogn. Rev. 2007, 1, 7–18. [Google Scholar]
  30. Lu, X.; Xi, B.; Zhang, Y.; Angelidaki, I. Microwave pretreatment of rape straw for bioethanol production: Focus on energy efficiency. Bioresour. Technol. 2011, 102, 7937–7940. [Google Scholar] [CrossRef]
  31. Kabel, M.A.; Bos, G.; Zeevalking, J.; Voragen, A.G.; Schols, H.A. Effect of pretreatment severity on xylan solubility and enzymatic breakdown of the remaining cellulose from wheat straw. Bioresour. Technol. 2007, 98, 2034–2042. [Google Scholar] [CrossRef]
  32. Yang, B.; Wyman, C.E. Effect of xylan and lignin removal by batch and flowthrough pretreatment on the enzymatic digestibility of corn stover cellulose. Biotechnol. Bioeng. 2004, 86, 88–98. [Google Scholar] [CrossRef]
  33. Keshwani, D.R. Microwave Pretreatment of Switchgrass for Bioethanol Production. Ph.D. Thesis, North Carolina State University, Raleigh, NC, USA, 2009. [Google Scholar]
  34. Modenbach, A. Sodium Hydroxide Pretreatment of Corn Stover and Subsequent Enzymatic Hydrolysis: An Investigation of Yields, Kinetic Modeling and Glucose Recovery. Ph.D. Thesis, University of Kentucky, Lexington, KY, USA, 2013. [Google Scholar]
  35. Greenwood, N.N.; Earnshaw, A. Chemistry of the Elements, 2nd ed.; Butterworth-Heinemann Publications Elsevier Ltd.: Oxford, UK, 2012. [Google Scholar]
Figure 1. Total reducing sugar measured after enzymatic hydrolysis of sago palm bark for MSA, MSH, and MSB pretreatments.
Processes 08 00787 g001
Figure 2. The effect of pretreatment parameters in MSA pretreatment on the glucose yield (a) with MP and ET at a constant SL, (b) with ET and SL at a constant MP, and (c) with MP and SL at a constant ET.
Processes 08 00787 g002
Figure 3. The effect of pretreatment parameters of MSH pretreatment on the glucose yield (a) with MP and ET at a constant SL, (b) with ET and SL at a constant MP, and (c) with MP and SL at a constant ET.
Processes 08 00787 g003
Figure 4. The effect of pretreatment parameters of MSB pretreatment on glucose yield (a) with MP and ET at a constant SL, (b) with ET and SL at a constant MP, and (c) with MP and SL at a constant ET.
Processes 08 00787 g004
Figure 5. The effect of pretreatment parameters of MSA pretreatment on the xylose yield (a) with MP and ET at a constant SL, (b) with ET and SL at a constant MP, and (c) with MP and SL at a constant ET.
Processes 08 00787 g005
Figure 6. The effect of pretreatment parameters of MSH pretreatment on the xylose yield (a) with MP and ET at a constant SL, (b) with ET and SL at a constant MP, and (c) with MP and SL at a constant ET.
Processes 08 00787 g006
Figure 7. The effect of pretreatment parameters of MSB pretreatment on the xylose yield (a) with MP and ET at a constant SL, (b) with ET and SL at a constant MP, and (c) with MP and SL at a constant ET.
Processes 08 00787 g007
Table 1. Number and Conditions of Experiments According RSM and BBD.
RUNX1X2X3SL (%)ET (min)MP (W)
10−11105800
20111015800
301−1101580
4−101510800
5−110515440
6−1−1055440
71011510800
80001010440
90001010440
1010−1151080
110001010440
121−10155440
13−10−151080
140001010440
150001010440
161101515440
170−1−110580
Table 2. The chemical composition of solids before and after pretreatment [4].
Component
% w/w
SPB
UntreatedMSAMSHMSB
Cellulose40.7947.2347.144.92
Hemicellulose22.3219.5524.2127.18
Lignin
(Removal)
25.8517.68 (31.6%)20.21
(21.8%)
18.83
(27.1%)
others11.0415.478.489.07
Table 3. Glucose and xylose yield after enzymatic hydrolysis of sago palm bark for MSA, MSH, and MSB pretreatments.
RunPretreatment ConditionsMSA PretreatmentMSH PretreatmentMSB Pretreatment
SL(%)ET (min)MP (W)Glucose (mg/g)Xylose (mg/g)Glucose (mg/g)Xylose (mg/g)Glucose (mg/g)Xylose (mg/g)
110580025.5 ± 5.832.7 ± 2.832.9 ± 1.524.5 ± 0.016.0 ± 2.017.9 ± 1.5
2101580020.8 ± 1.433.6 ± 5.835.8 ± 7.925.5 ± 0.219.6 ± 1.818.9 ± 0.3
310158027.1 ± 0.732.1 ± 7.632.5 ± 4.722.4 ± 1.418.8 ± 2.014.6 ± 2.3
451080024.4 ± 3.337.5 ± 5.744.3 ± 4.824.6 ± 0.720.1 ± 1.517.2 ± 2.4
551544037.5 ± 5.730.6 ± 3.240.9 ±3.424.7 ± 0.020.6 ± 0.314.7 ± 0.1
65544023.6 ± 0.831.4 ± 3.337.0 ± 1.015.8 ± 3.813.6 ± 1.916.8 ± 2.4
7151080020.4 ± 2.143.1 ± 4.239.3 ± 1.022.9 ± 1.416.6 ± 1.017.2 ± 1.3
8101044028.3 ± 2.433.8 ± 0.432.2 ± 1.419.6 ± 1.017.1 ± 2.021.2 ± 3.4
9101044027.6 ± 2.237.1 ± 5.533.2 ± 1.718.3 ± 1.716.2 ± 1.319.9 ± 0.3
1015108022.4 ± 2.334.5 ± 4.930.9 ± 5.317.7 ± 0.313.0 ± 2.616.3 ± 0.8
11101044027.6 ± 0.831.1 ± 0.630.2 ± 1.418.2 ± 1.416.2 ± 1.319.0 ± 0.2
1215544029.3 ± 3.933.0 ± 1.328.0 ± 1.414.7 ± 1.514.4 ± 0.716.5 ± 0.8
135108029.3 ± 1.538.9 ± 7.535.9 ± 3.819.7 ± 1.616.5 ± 0.319.8 ± 0.2
14101044027.7 ± 3.735.5 ± 2.031.2 ± 2.619.6 ± 1.016.5 ± 0.319.8 ± 0.6
15101044028.3 ± 3.032.0 ± 2.932.2 ± 1.318.8 ± 1.416.6 ± 1.818.9 ± 0.6
16151544027.7 ± 3.935.5 ± 2.028.9 ± 0.917.3 ± 0.917.1 ± 1.013.9 ± 0.3
171058023.1 ± 1.230.1 ± 0.629.7 ± 1.014.9 ± 1.011.5 ± 2.417.4 ± 1.9
Table 4. ANOVA for glucose of MSA, MSH, and MSB pretreatments.
Pretreatment.Source of VariationsSum of SquaresDegree of FreedomMean SquareF-Valuep-ValueR2
MSAModel232.76925.866.300.01200.8901
X1 (SL)28.16128.166.860.0345
X2 (ET)16.67116.674.060.0837
X3 (MP)14.95114.953.640.0980
X1X260.31160.3114.690.0064
X1X32.0212.020.490.5058
X2X318.91118.914.610.0690
X1^22.8012.800.680.4365
X2^22.8512.850.700.4319
X3^288.77188.7721.630.0023
MSHModel286.65931.856.590.01060.8944
X1 (SL)120.081120.0824.850.0016
X2 (ET)13.82113.822.860.1347
X3 (MP)68.05168.0514.080.0071
X1X22.1012.100.430.5308
X1X30.0207310.020730.0042890.9841
X2X30.0262110.026210.054220.9821
X1^248.20148.209.970.0160
X2^29.6019.601.990.2016
X3^224.58124.585.090.0587
MSBModel90.99615.1730.11<0.00010.9476
X1 (SL)20.39120.3940.49<0.0001
X2 (ET)43.28143.2885.93<0.0001
X3 (MP)22.46122.4644.61<0.0001
X1X21.2211.222.410.1514
X1X30.2110.210.420.5305
X2X33.4313.436.820.0260
Table 5. ANOVA for xylose models of MSA, MSH, and MSB pretreatments.
PretreatmentSourceSum of SquaresDegree of FreedomMean SquareF-Valuep-ValueR2
MSA PretreatmentModel155.51917.284.180.03630.8431
X1 (SL)7.6817.681.860.2152
X2 (ET)2.5912.590.630.4545
X3 (MP)15.88115.883.840.0909
X1X22.7712.770.670.4402
X1X324.76124.765.990.0443
X2X30.3010.300.0720.7956
X1^227.43127.436.630.0367
X2^261.72161.7214.930.0062
X3^217.58117.584.250.0782
MSH PretreatmentModel201.90922.4317.890.00050.9583
X1 (SL)22.13122.1317.650.0040
X2 (ET)56.07156.0744.720.0003
X3 (MP)64.22164.2251.220.0002
X1X213.33113.3310.630.0138
X1X30.02410.0240.0190.8931
X2X310.64110.648.490.0225
X1^21.2011.200.960.3605
X2^20.01110.0110.088550.9277
X3^234.73134.7327.700.0012
MSB PretreatmentModel58.3996.494.310.03350.8472
X1 (SL)2.5712.571.710.2328
X2 (ET)5.4915.493.640.0979
X3 (MP)1.1911.190.790.4037
X1X20.09410.0940.0620.8100
X1X33.2313.232.140.1866
X2X33.5813.582.380.1669
X1^215.71115.7110.440.0144
X2^223.53123.5315.630.0055
X3^20.1910.190.130.7297

