Article

Dust Suppression Analysis of a New Spiral Hopper Using CFD-DEM Simulations and Experiments

1
School of Logistics Engineering, Wuhan University of Technology, Wuhan 430063, China
2
School of Mechanical Engineering, Hubei University of Technology, Wuhan 430068, China
*
Author to whom correspondence should be addressed.
Processes 2020, 8(7), 783; https://doi.org/10.3390/pr8070783
Submission received: 10 June 2020 / Revised: 1 July 2020 / Accepted: 2 July 2020 / Published: 5 July 2020
(This article belongs to the Section Process Control and Monitoring)

Abstract

:
A new dust suppression hopper with a spiral guide plate embedded in the conventional hopper is proposed for the dust suppression of hopper transfer processes in this article. The Computational Fluid Dynamics-Discrete Element Method (CFD-DEM) coupling numerical method is used to investigate the particle motion and flow field distribution of the hopper transfer process. The experiment is undertaken to determine dust suppression performance. The results show that the maximum particle velocity for the spiral hopper is dropped by 1.6 m/s compared to the conventional hopper, which means the collision of the particles and the spiral hopper is weakened. The axial airflow velocity of the spiral is reduced. In addition, the maximum dust concentration of the spiral hopper inlet is reduced by 56.9% due to the impact velocity of particles is small, and the secondary fugitive dust is controlled inside a semi-closed space formed by the spiral guide plate. It is thus concluded that the spiral hopper provides an effective way in dust control.

1. Introduction

Hoppers are widely used in the transfer process of bulk material such as coal and grain, but it is easy for the dust to escape from the upper hopper, which is harmful to the health of workers [1]. Pneumoconiosis is easily triggered for the people who work in high-concentration dust environments. A dusty atmosphere increases risk of the dust explosions that can be much more dangerous [2]. Thus, it is essential to control dust generation. Currently, the main methods of dust suppression include water spray, foam, and dust collector [3,4,5]. However, these methods need external energy and equipment or suppressants. Therefore, passive dust control without external energy and equipment is required to develop by considering the characteristic of dust generation. For example, Wheeler et al. [6] designed ship loading chutes to reduce dust emissions. Chen et al. [7] analyzed the performance of different belt conveyor transfer chutes to reduce dust emissions in bulk material handling plants. Although these chutes can effectively suppress dust emissions for belt conveyors, the transfer process for the hopper is not considered.
The dust emissions mainly occur in the transport area and the impact area [8]. In the transport area, the dusty airflow is formed around the core of bulk material when material stream moves, and dust easily escapes due to the high turbulence of induced airflow [9]. The induced airflow is closely related to the drop height [10]. In the impact area, a high turbulent region and secondary dust pollution are generated due to the airflow changing its movement direction instantly [8].
Generally, there are two methods for the gas–solid mixing flow problem that are Eulerian-Eulerian methods and Eulerian-Lagrangian methods. In Eulerian-Eulerian methods, both the particle and gas phases are treated as continuous phases—for instance, the two-fluid model (TFM). For Eulerian-Lagrangian methods, however, the particle phase is treated as a discrete element, and each particle is tracked separately [11,12,13]. The Computational Fluid Dynamics-Discrete Element Method (CFD-DEM) is a common Eulerian-Lagrangian approach. Compared with the TFM, a more accurate prediction for the particle is obtained by DEM [14]. For the dust emission problem, Hilton and Cleary [15] presented a method for simulating dust release by a coupled CFD-DEM. The DEM is used to model the large-scale granular dynamics, and the CFD is used to model the flow of gas and dust. The coupled CFD-DEM multiphase approach is used to predict the dust emissions of transfer chute [16] and rotating drum [17], respectively. Chu et al. [18] studied air entrainment in falling particle plumes using CFD-DEM. The characteristics of cyclone separator are simulated and optimized by CFD-DEM [19,20,21,22]. The disadvantage of the CFD-DEM method is that its computational cost is much higher due to the number of calculated particles being large while the particle number is reduced using a coarse grain model [23,24,25,26].
According to the characteristic of dust generation, a new hopper with the spiral guide plate is presented by minimizing the drop height to reduce the volume of entrained air in this research. Moreover, the CFD-DEM coupling method is used to simulate the transfer processes of the conventional hopper and the spiral hopper, and then the particle velocity and airflow are investigated. The dust suppression performance of the spiral hopper is verified by analyzing the experiment and the movement of particle and airflow.

2. CFD-DEM Numerical Simulation

2.1. CFD-DEM Governing Equations

The gas phase obeys the Navier–Stokes equations. The continuity equation and the momentum conservation equation are given as:
t ( ε g ρ g ) + ( ε g ρ g u g ) = 0
t ( ε g ρ g u g ) + ( ε g ρ g u g u g ) = ε g p + ( ε g τ g ) + ε g ρ g g F g - p
where ρg, ug, p, and τg are the density, velocity, pressure, and viscous stress tensor of gas, respectively. g is the gravitational acceleration, Fg-p is the force between particle phase and gas phase, and εg is the volume fraction of gas.
According to Newton’s second law, with the consideration of collision between particle–particle and particle–wall, the governing equations of solid phase can be written as:
m i d v i d t = m i g + f p - g , i + j = 1 k i f c o n t a c t , i j ,
I i d ω i d t = j = 1 k i T i j ,
where Ii, mi, vi, and ωi are the moment of inertia, mass, translational velocity, and rotational velocity of particle i, respectively. ki is the number of particles in contact with particle i, Tij is torque, and fp-g,I and fcontact,ij are the gas–solid interaction force and contact force of particles, respectively.
For particle–fluid flow, the finite volume method (FVM) is widely used due to the robustness in transient flow, especially the highly turbulent one. Zhou et al. [27] presented a workable FVM framework on the unstructured triangular grid to simulate the Oldroyd-B fluid flows. Javanmard et al. [28] investigated the behavior of fluid flow around an optimized surface-piercing propeller using CFD based FVM. The method is widely applied to the simulation of applications such as fluidized bed, pneumatic conveying, pipeline flow, and cyclone [29]. The FVM is used to obtain the fluid information of averaged velocity and pressure for each cell by solving the locally-averaged Navier–Stokes equation, and subsequently calculate fluid–particle interaction forces at a time-step, when the simulation model is solved by the CFD-DEM coupling method. The position and velocity of particles are calculated based on the interphase momentum exchange term. According to the particle information, the volume fraction of each fluid cell is updated to calculate the momentum exchange term of the next time-step. The looping calculation stops when the simulation is completed.

2.2. Fluid–Particle Interaction Forces

According to the empirical correlations for pressure drop, the particle–fluid drag force can be represented by the interphase momentum transfer coefficient and the slip velocity, which is written as:
F d = β ( u g u p ) ρ g ,
where ug and up are the velocity of gas and particle, respectively. β is the interphase momentum transfer coefficient. A proper drag model for the description of β is vital in CFD-DEM simulation. A combination of the Ergun [30] and the Wen and Yu [31] correlations is often used [25]. β is given by:
β = { 150 ( 1 ε g ) 2 μ g ε g d p 2 + 1.75 ( 1 ε g ) ρ g d p | u g u p | , ε g 0.8 3 4 C D ( 1 ε g ) ρ g d p | u g u p | ε g 2.65 , ε g > 0.8 ,
where dp, μg, and CD are the particle diameter, gas viscosity, and drag coefficient, respectively. The drag coefficient CD is given by:
C D = { 24 R e ( 1 + 0.15 R e 0.687 ) , R e 1000 0.44 , R e > 1000 ,
where Re is written as:
R e = ε g ρ g d p | u g u p | μ g ,
The gas pressure gradient force is given by:
F p = V p p ,
where Vp and p are the particle volume and the gas pressure, respectively.

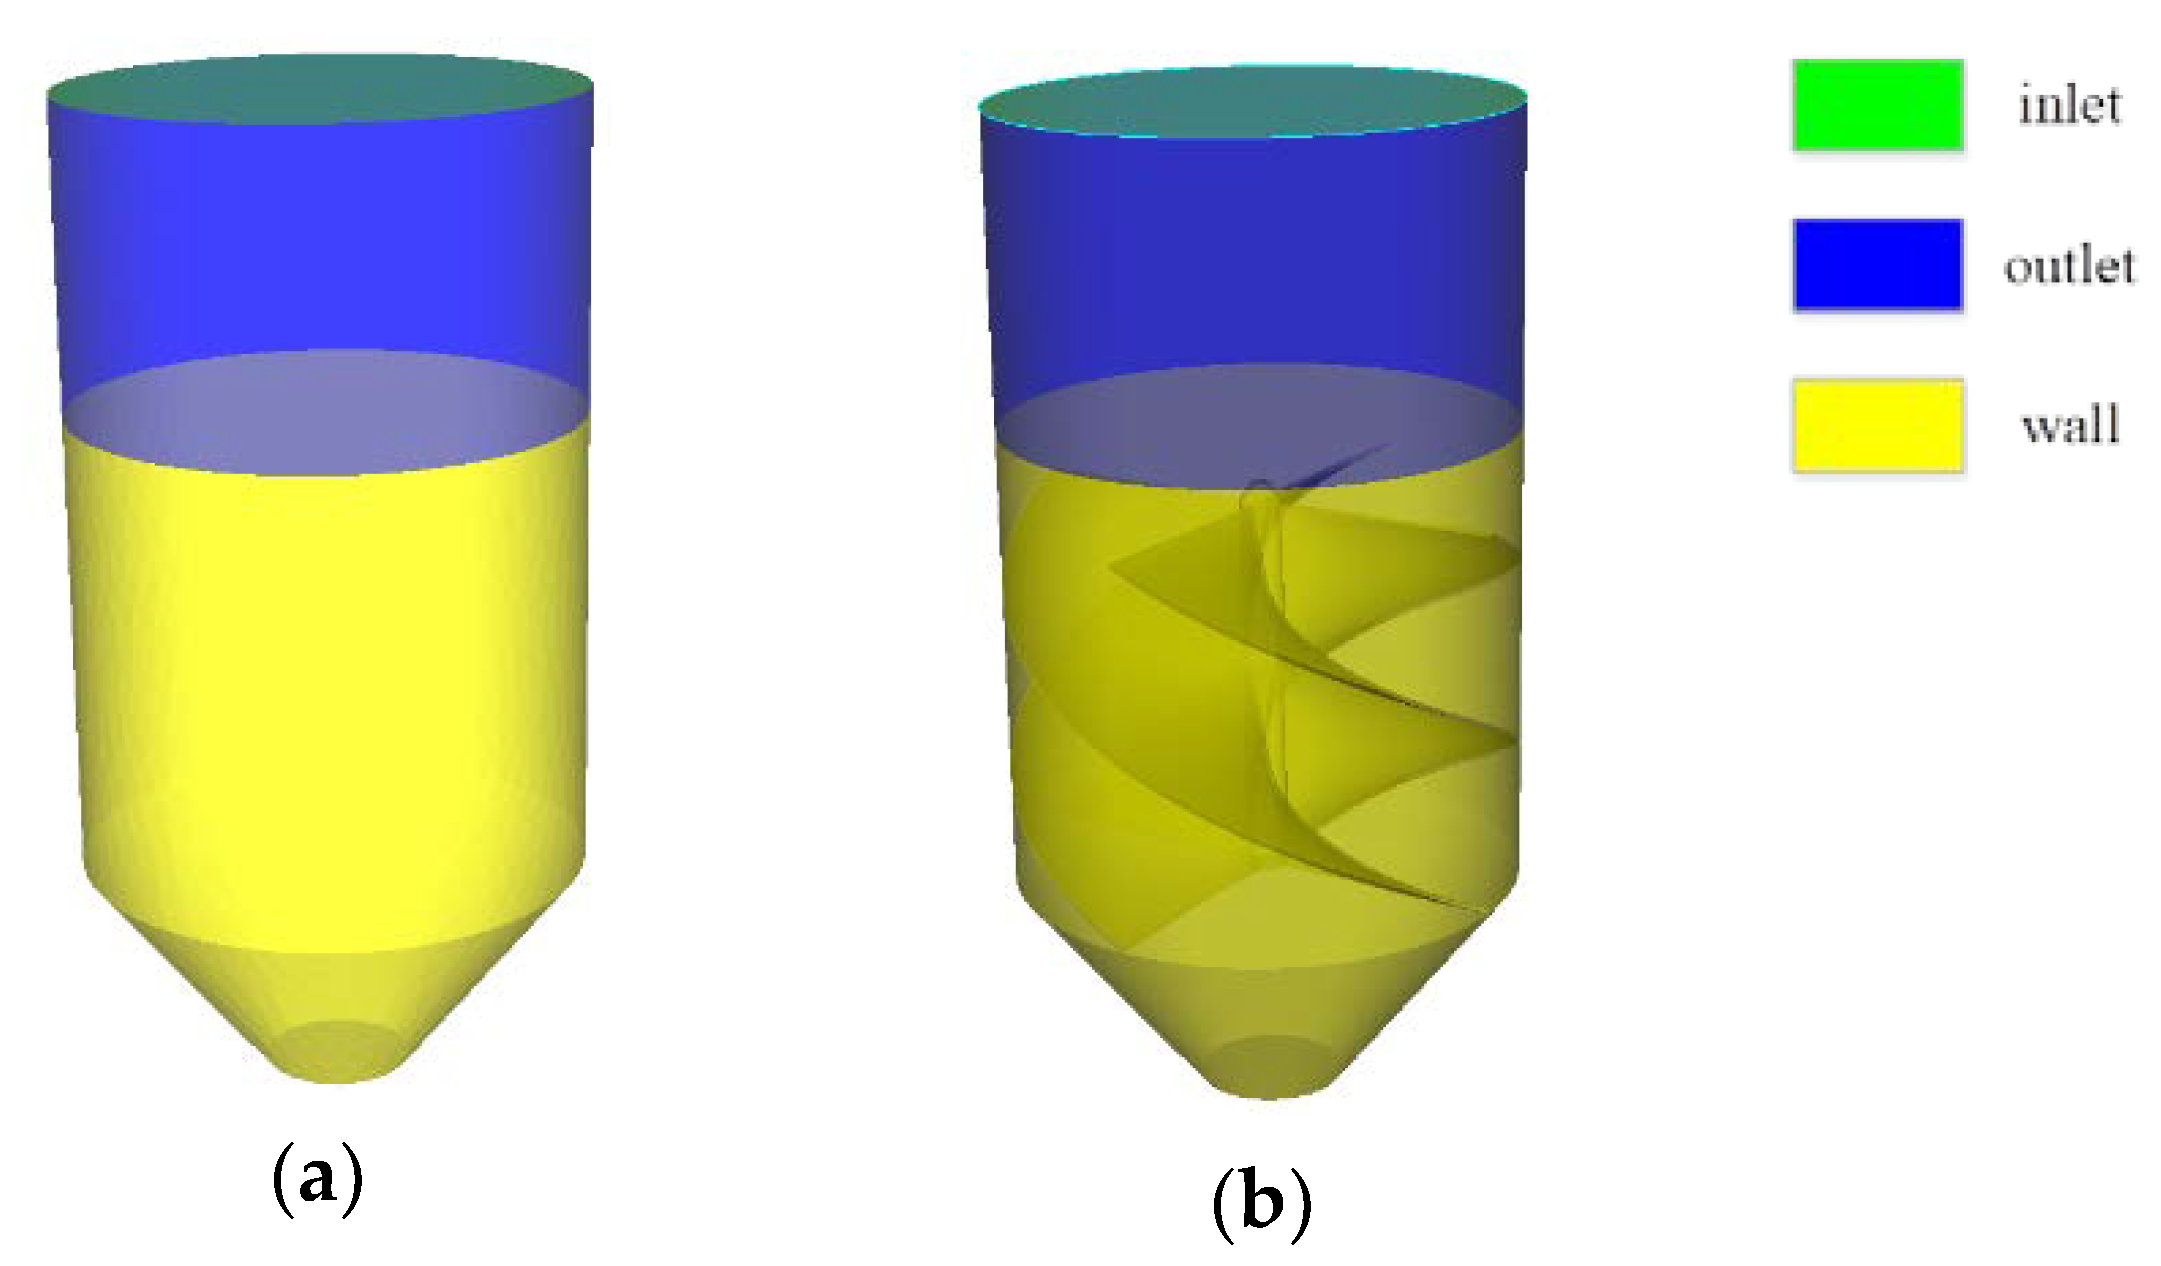
2.3. Simulation Conditions
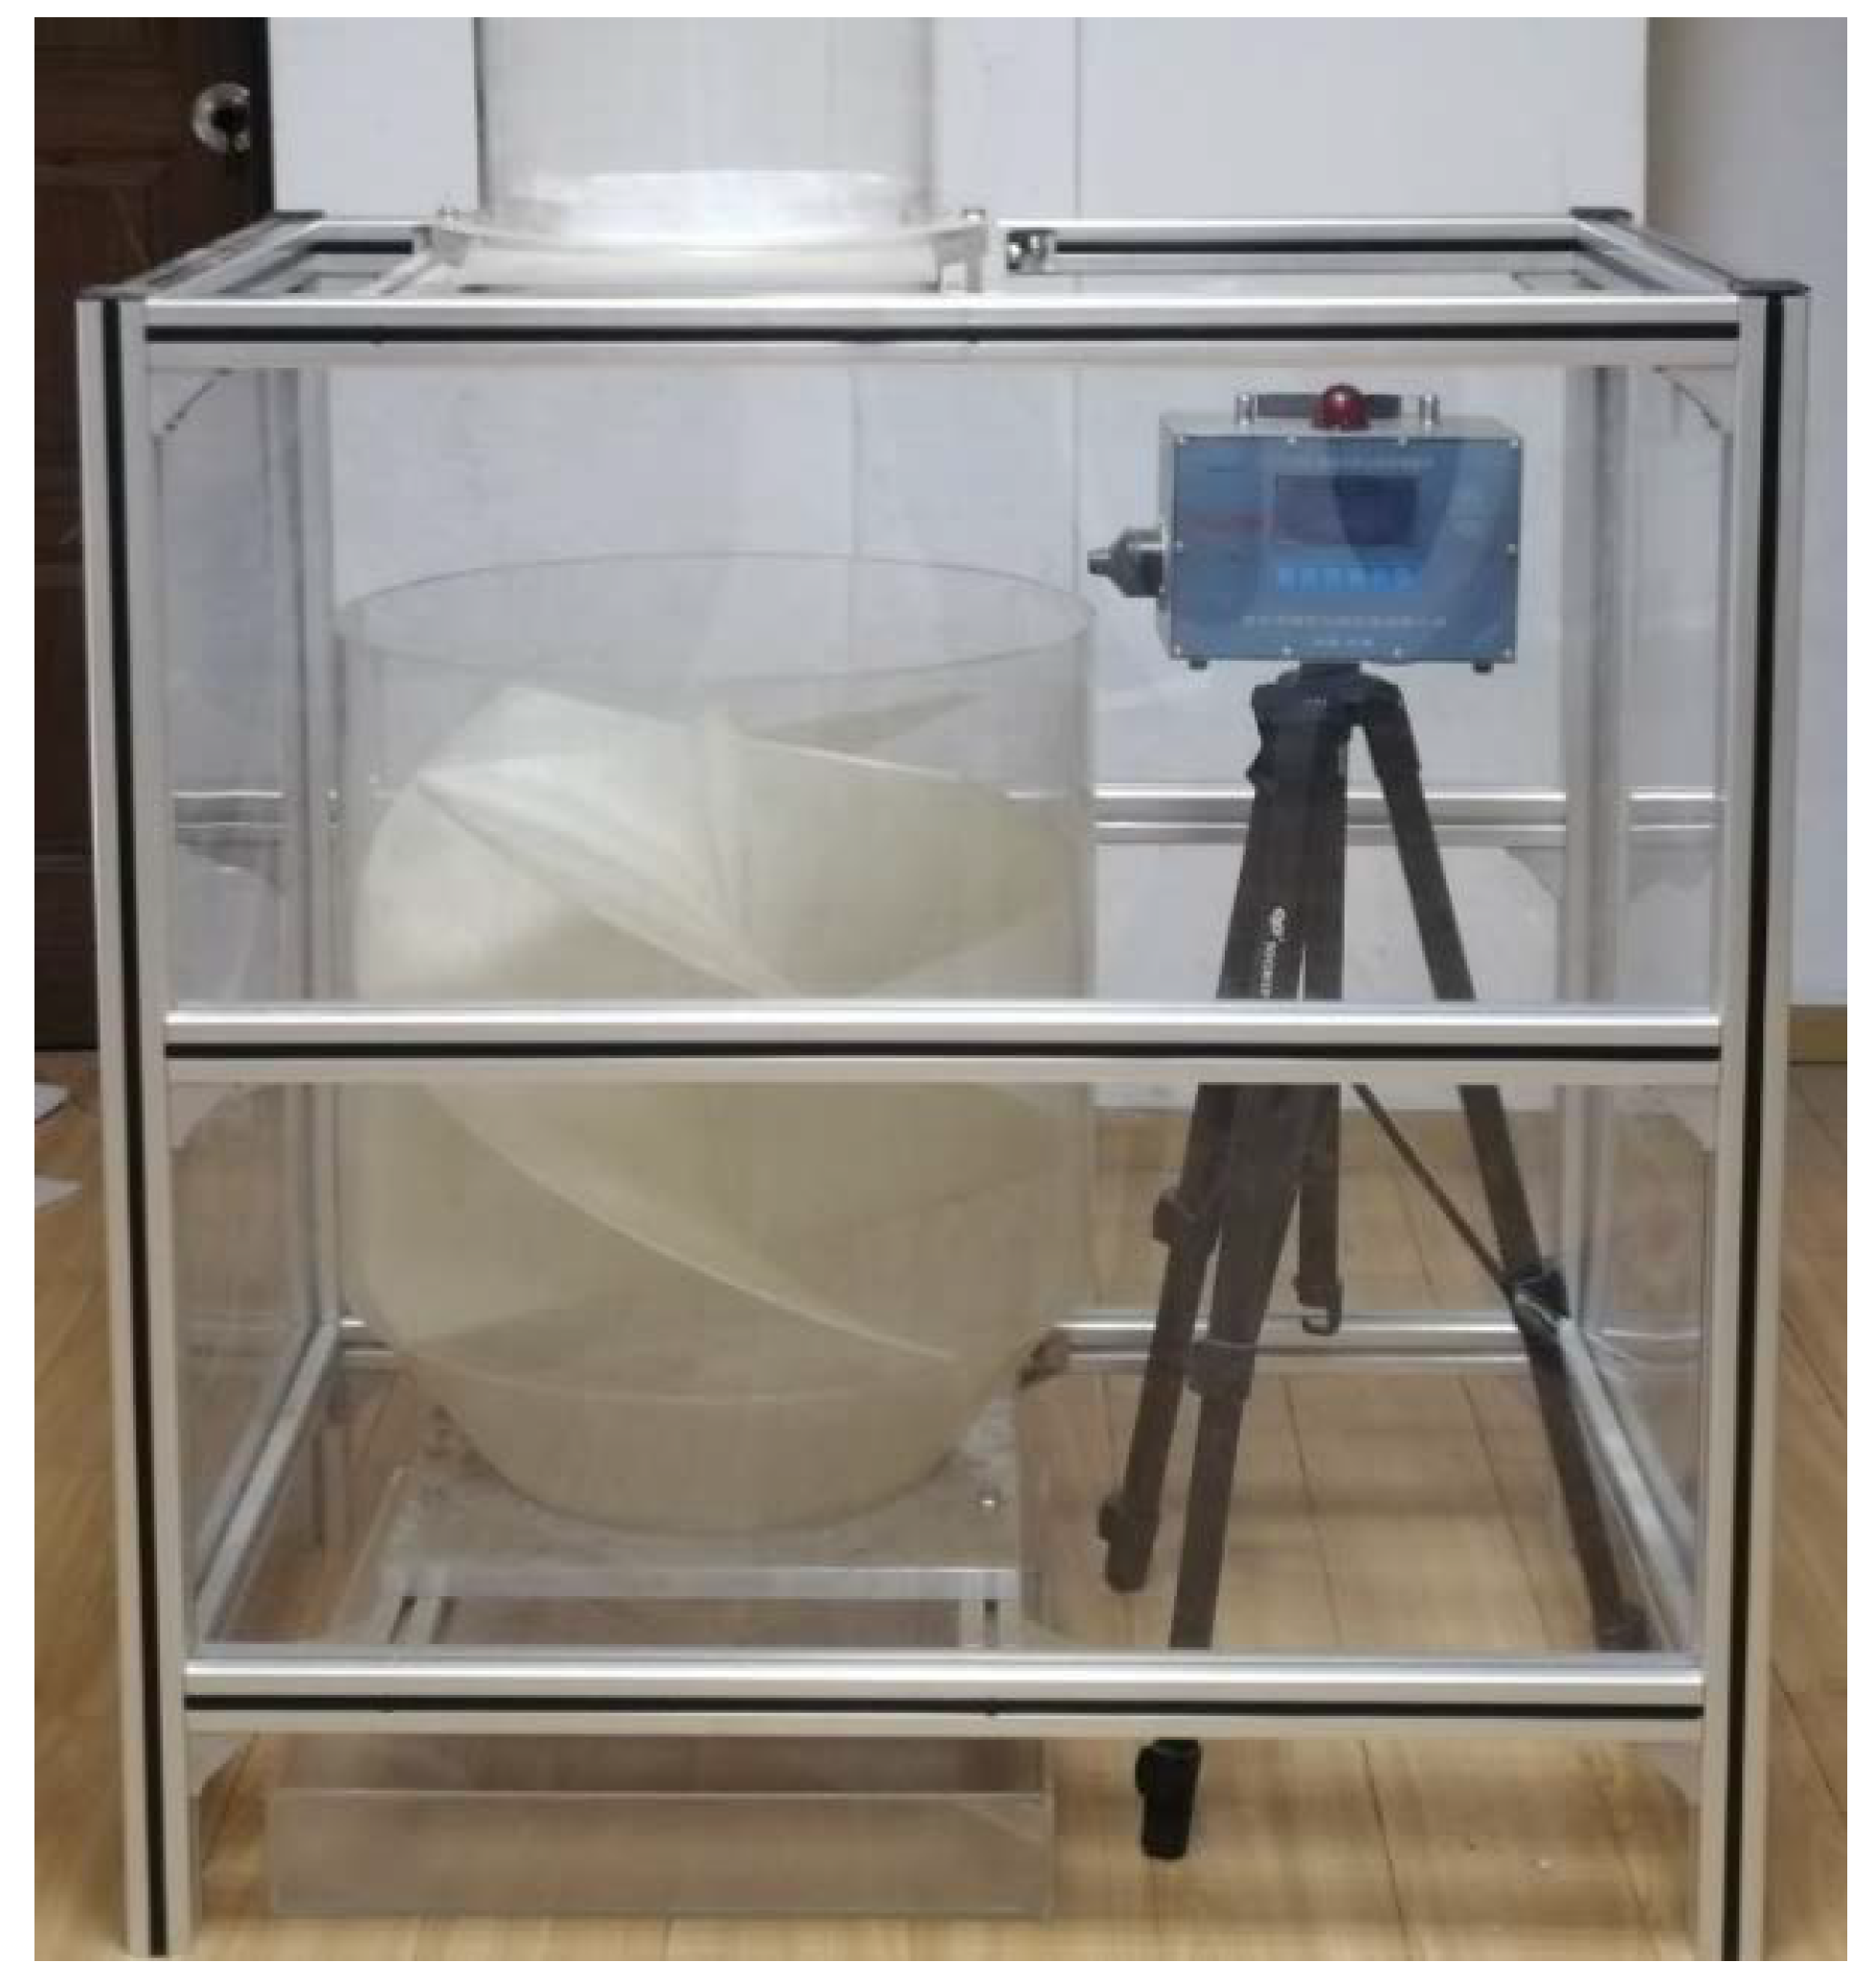
The calculation domain of two hoppers is shown in Figure 1, which contains the flow field of the hopper and 0.3 m above it. The tetrahedral mesh is used for the simulation model of the spiral hopper and the conventional hopper. The models and boundary conditions are shown in Table 1. The system is under the situation of normal temperature and pressure. The inlet and outlet are the pressure inlet and the pressure outlet of 1.01 MPa, respectively. The setting of wall is no slip. The pressure-based solver and the Realizable k-ε turbulence model are selected to solve the governing equation of the flow field since the flow field in the transfer process is considered to be incompressible and slow [32,33]. The gas is treated as a continuum. The gas density is 1.225 kg/m3, and the viscosity is 1.8 × 10⁻⁵ Pa·s. The commercial CFD-package ANSYS Fluent is used and coupled to the DEM.
A mesh dependency study is performed to determine the most suitable mesh for CFD models. The mesh size of fluid is 5–10 times that of particle size [34]. The conventional hopper and spiral hopper are analyzed using four different mesh sizes. As shown in Figure 2, air velocity of different radial positions at the bottom of the hopper is compared. A maximum face sizes of 18 mm, 15 mm, 12 mm, and 10 mm are used for the coarse mesh, intermediate mesh, fine mesh, and finer mesh, respectively. The air velocities of fine and finer mesh are similar. A fine mesh is used in subsequent simulations due to the limitation of computational time. The total number of CFD cells is 283,663 and 494,875 for the conventional hopper and spiral hopper, respectively.
The geometric parameters of the hopper model are presented in Table 2. The spiral guide plate has 0.72 m pitch, 0.004 m thickness, and 25.3° inclination. The spiral hopper consists of a conventional hopper, four spiral guide plates, and an intermediate cylinder of 0.04 m diameter. The spherical sand particle is selected as the particle in the transfer process. The interaction of particle–particle and particle–geometry use the Hertz–Mindlin (no slip) model. The relevant parameters, which are used for DEM simulations, are summarized in Table 3. The scale particle is selected in the simulation process as the limitation of computational time, and the particle diameter is 1.6 mm with a ratio of 2. The DEM time step is not large due to the limitation of the natural oscillation period, and the DEM time step is smaller than that of CFD [34]. The CFD time step is selected at 100 times that of the DEM time step. Thus, the CFD and DEM time-steps are set as 1.0 × 10⁻³ s and 1.0 × 10⁻⁵ s, respectively.

3. Experiment

A dust-suppression experimental system via spiral hopper is designed to measure the dust concentration of hopper inlet, as shown in Figure 3. The system is mainly composed of the spiral hopper with four guide plates, discharge hopper, and dust concentration analyzer. The hopper parameters are summarized in Table 2. The discharge hopper has a diameter of 0.3 m, which is 0.26 m above the spiral hopper. The dust concentration of the spiral hopper inlet is measured and recorded using CCZ3000, which has an error of 15% and the precision of 0.1 mg/m3. The dusty airflow is suctioned into the CCZ3000 with a 7.2 L/min, the dust concentration of which is measured based on the principle of the light scattering method [35]. The dust concentration is determined by measuring the intensity of scattered light. The system is placed in the experimental platform with 0.9 m long, 0.52 m wide, and 1 m high. The experimental platform is surrounded by transparent plastic with 1 mm thick.
Dry sand is chosen as the bulk material for experiments, and the particle diameter is 0.4–0.8 mm by the sieving of vibration sieve. The 6 kg sand sample is divided into six samples, and each sample is used for independent tests. The experimental error is eliminated by three sets of the same sample; thus, it can be used in the following experiments.

4. Results and Discussion

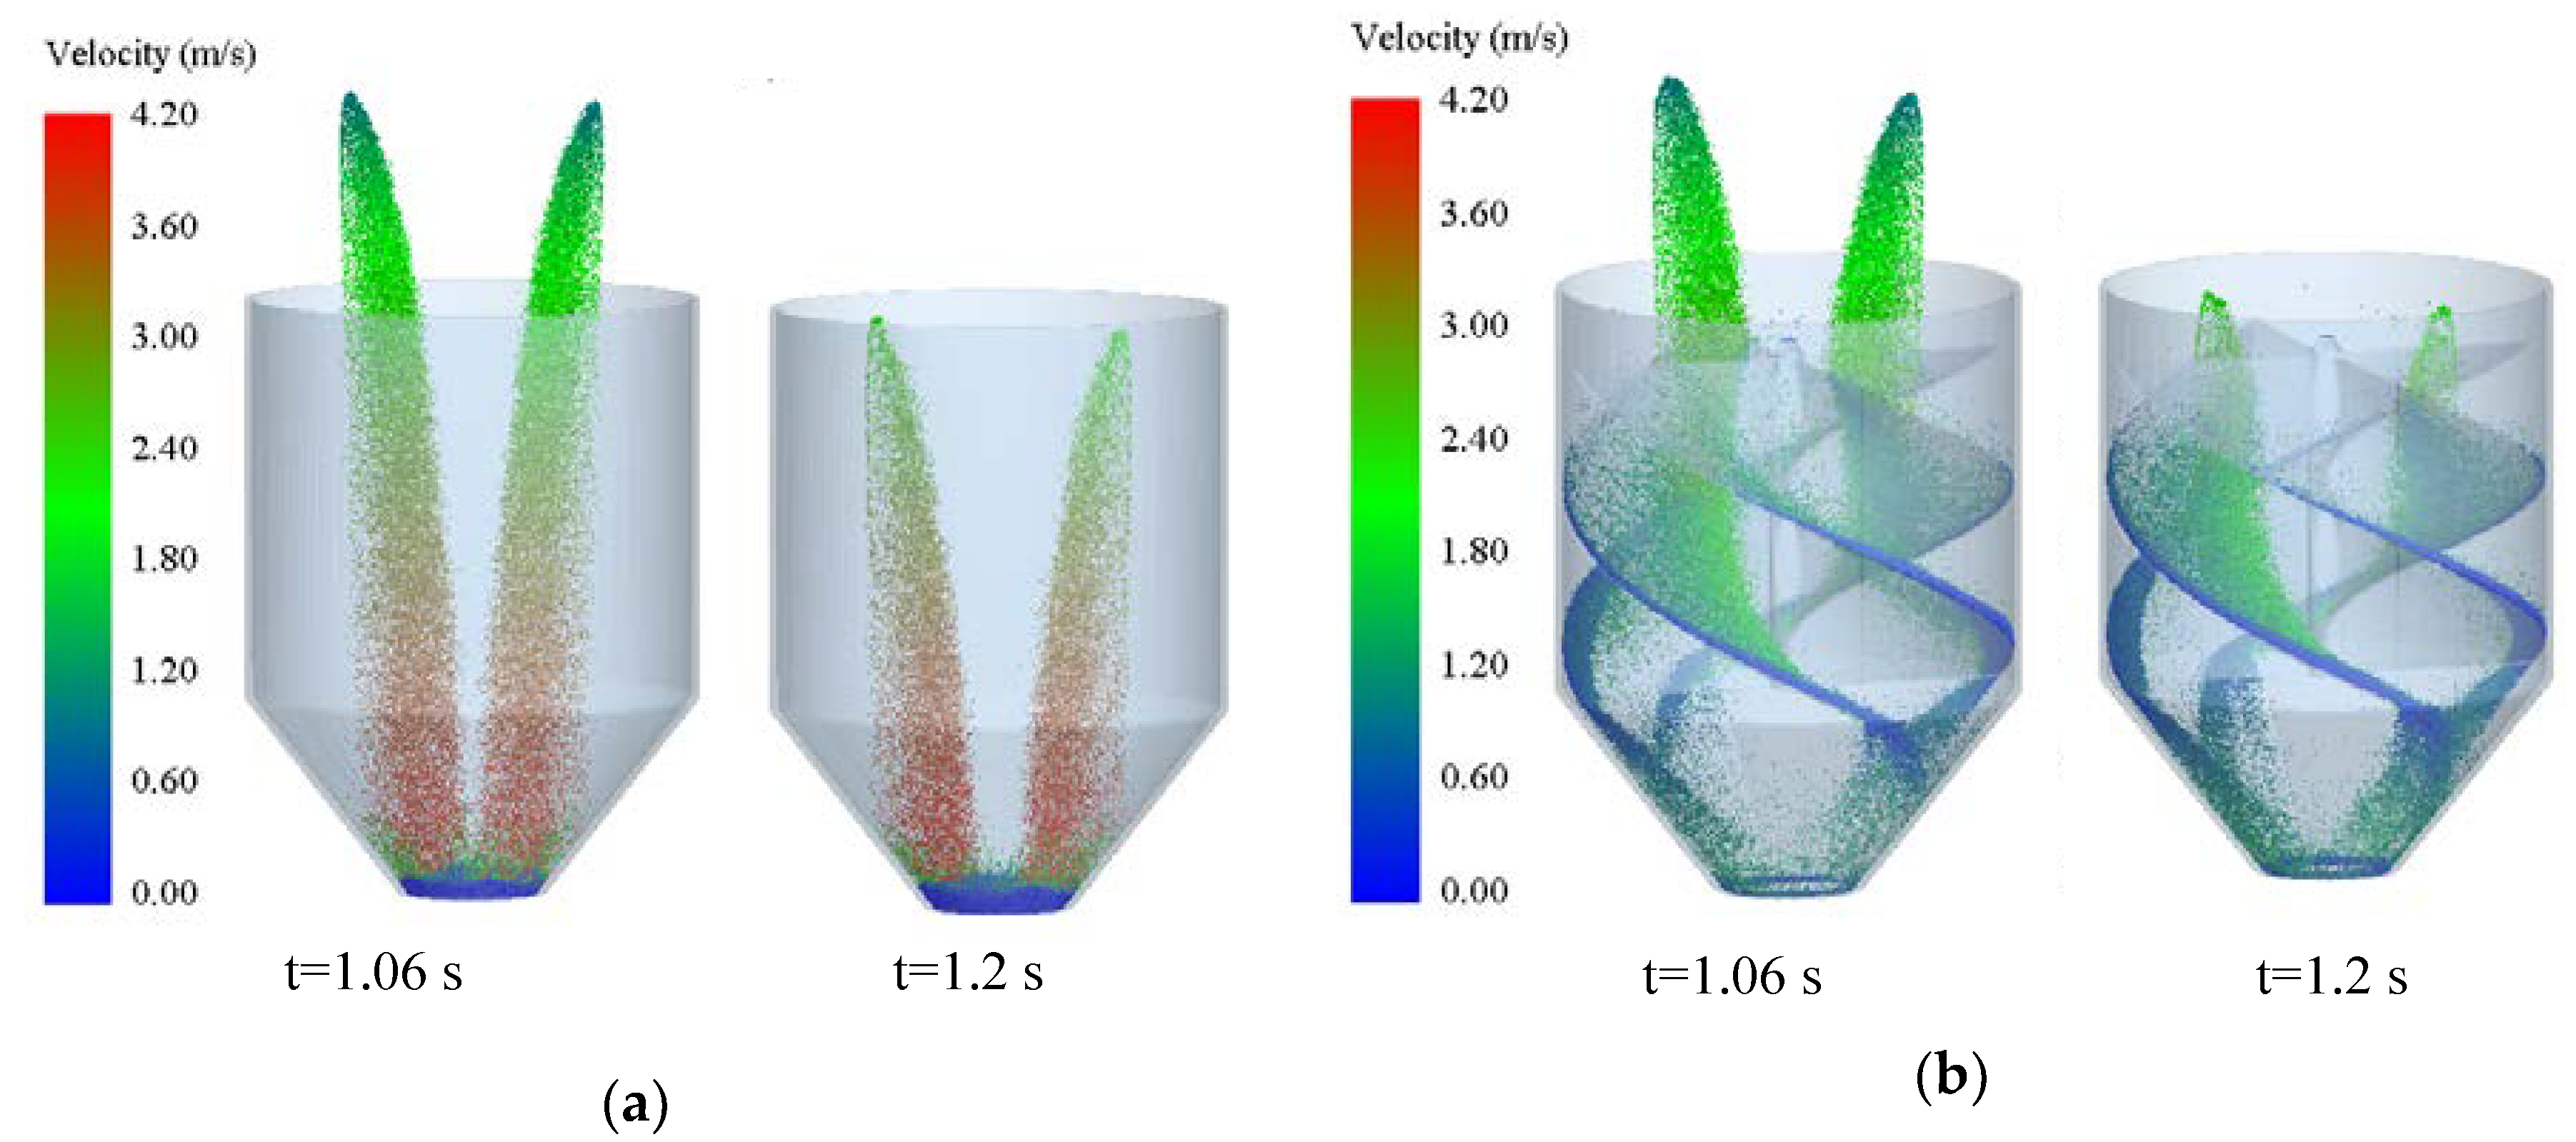
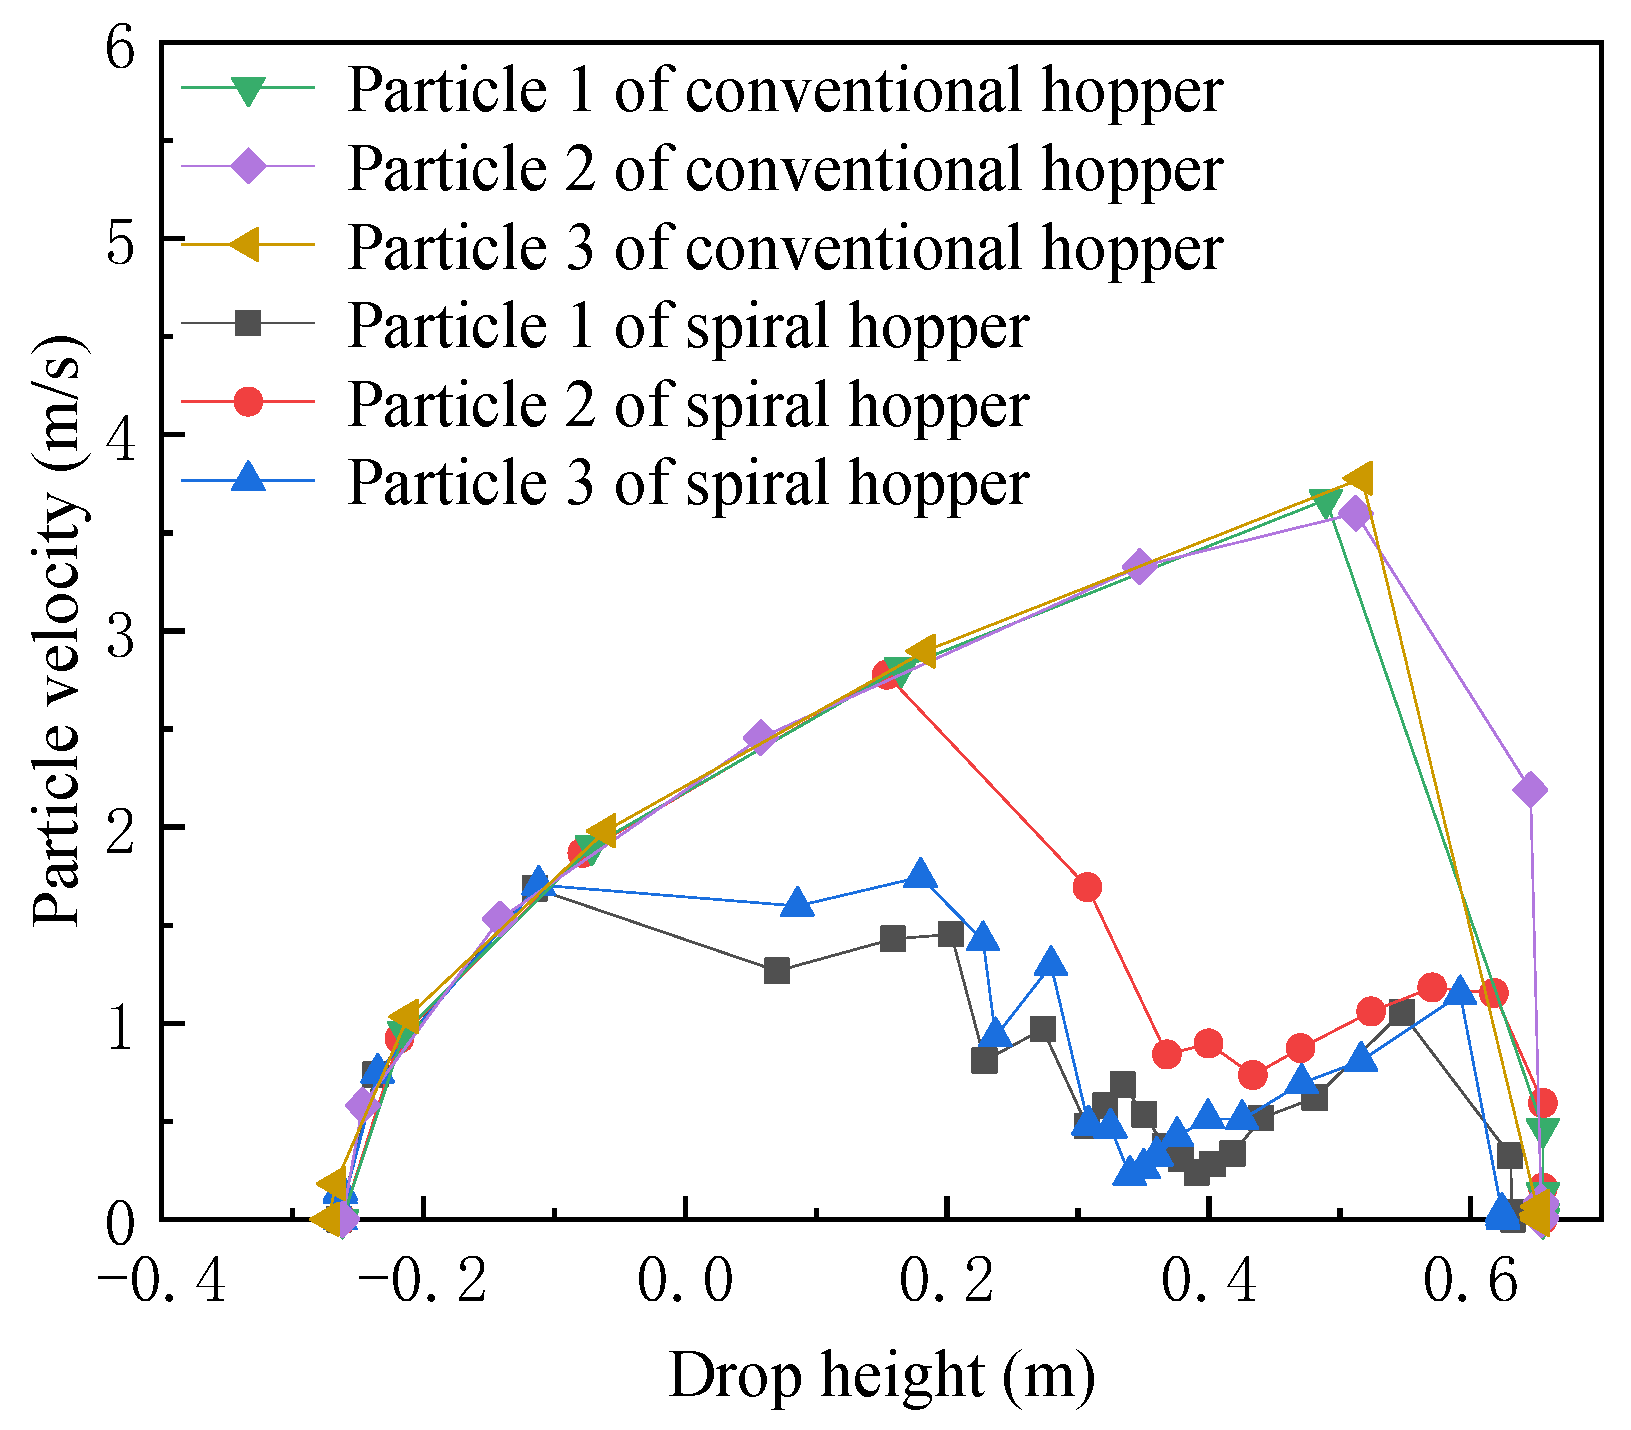
4.1. Profile of Particle Motion

The particle distributions for the conventional hopper and the spiral hopper are shown in Figure 4. Figure 4a shows that the material stream is loosened as the drop height increases. For the spiral hopper, however, the particle flow is divided and directed by four spiral guide plates, as shown in Figure 4b.
The drop velocity of sand particles is an important factor for dust emissions. Thus, the particle movement of three cases, which are the particles sliding down directly from different guide plates and the particles colliding with the intermediate cylinder and falling, are tracked. The characteristics of particle velocity for two hoppers are shown in Figure 5. Particle 1 collides with the intermediate cylinder and falls, and particles 2,3 slide directly from two different guide plates. The height of the hopper inlet is selected as 0. Clearly, the particle velocity is suppressed due to the effect of the spiral guide plate. As the drop height increases, the deviation of particle velocity is increased. When entering the spiral hopper, the particles close to the intermediate cylinder collide with the wall surface in advance to reduce the velocity, while the particles away from the intermediate cylinder fall on the guide plate and slow down. The maximum velocity is decreased by 1.6 m/s. The collision of the particles and the spiral hopper is weakened. The secondary fugitive dust is reduced.

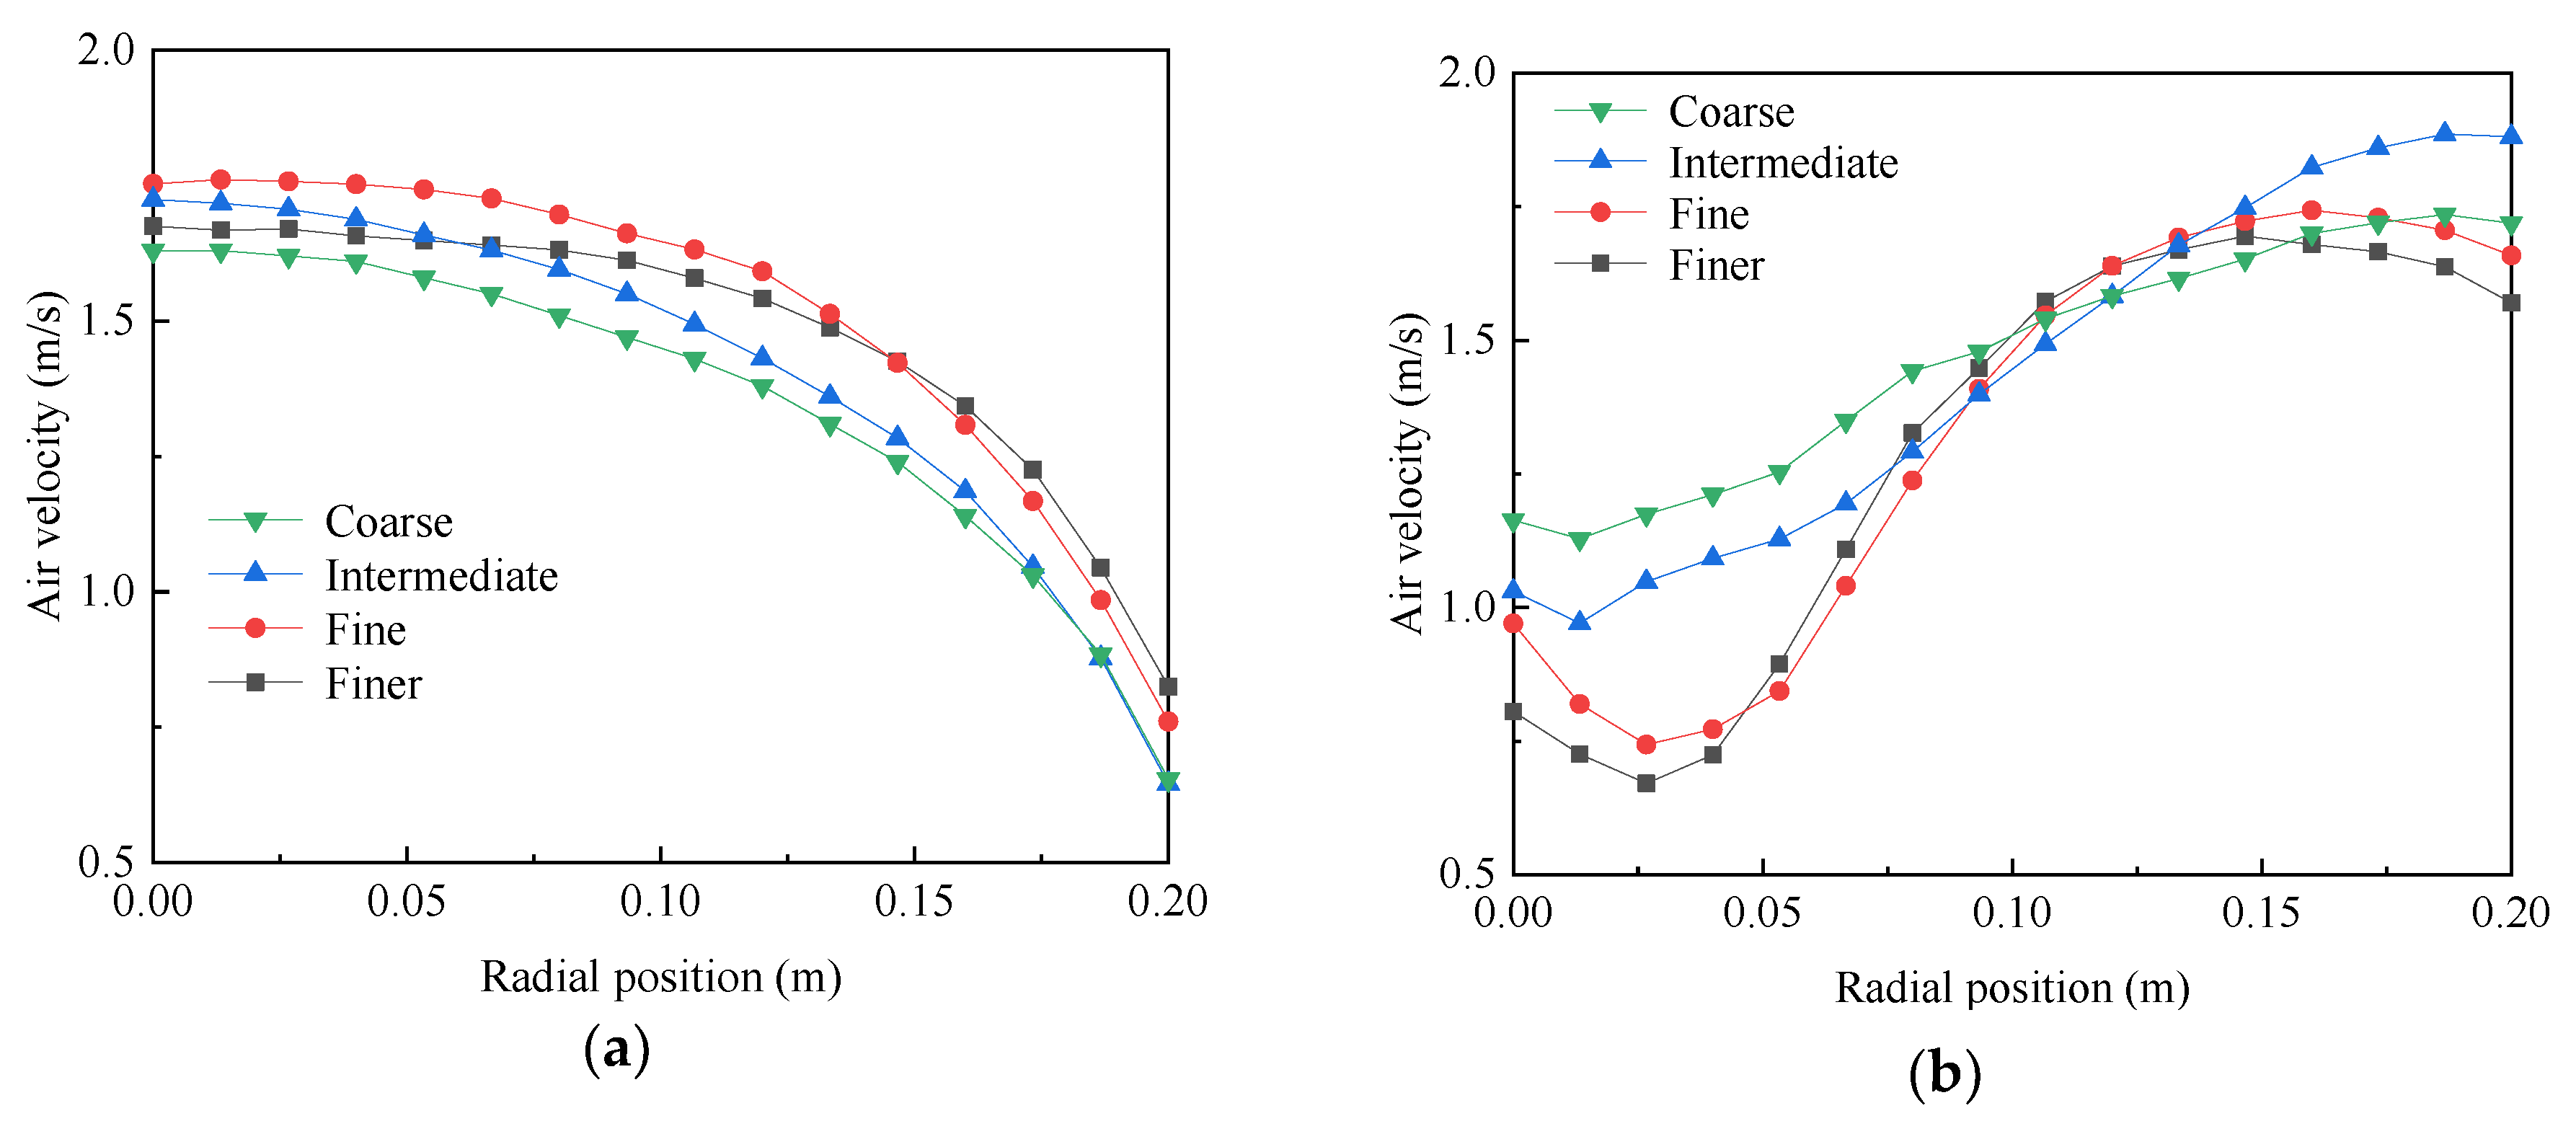
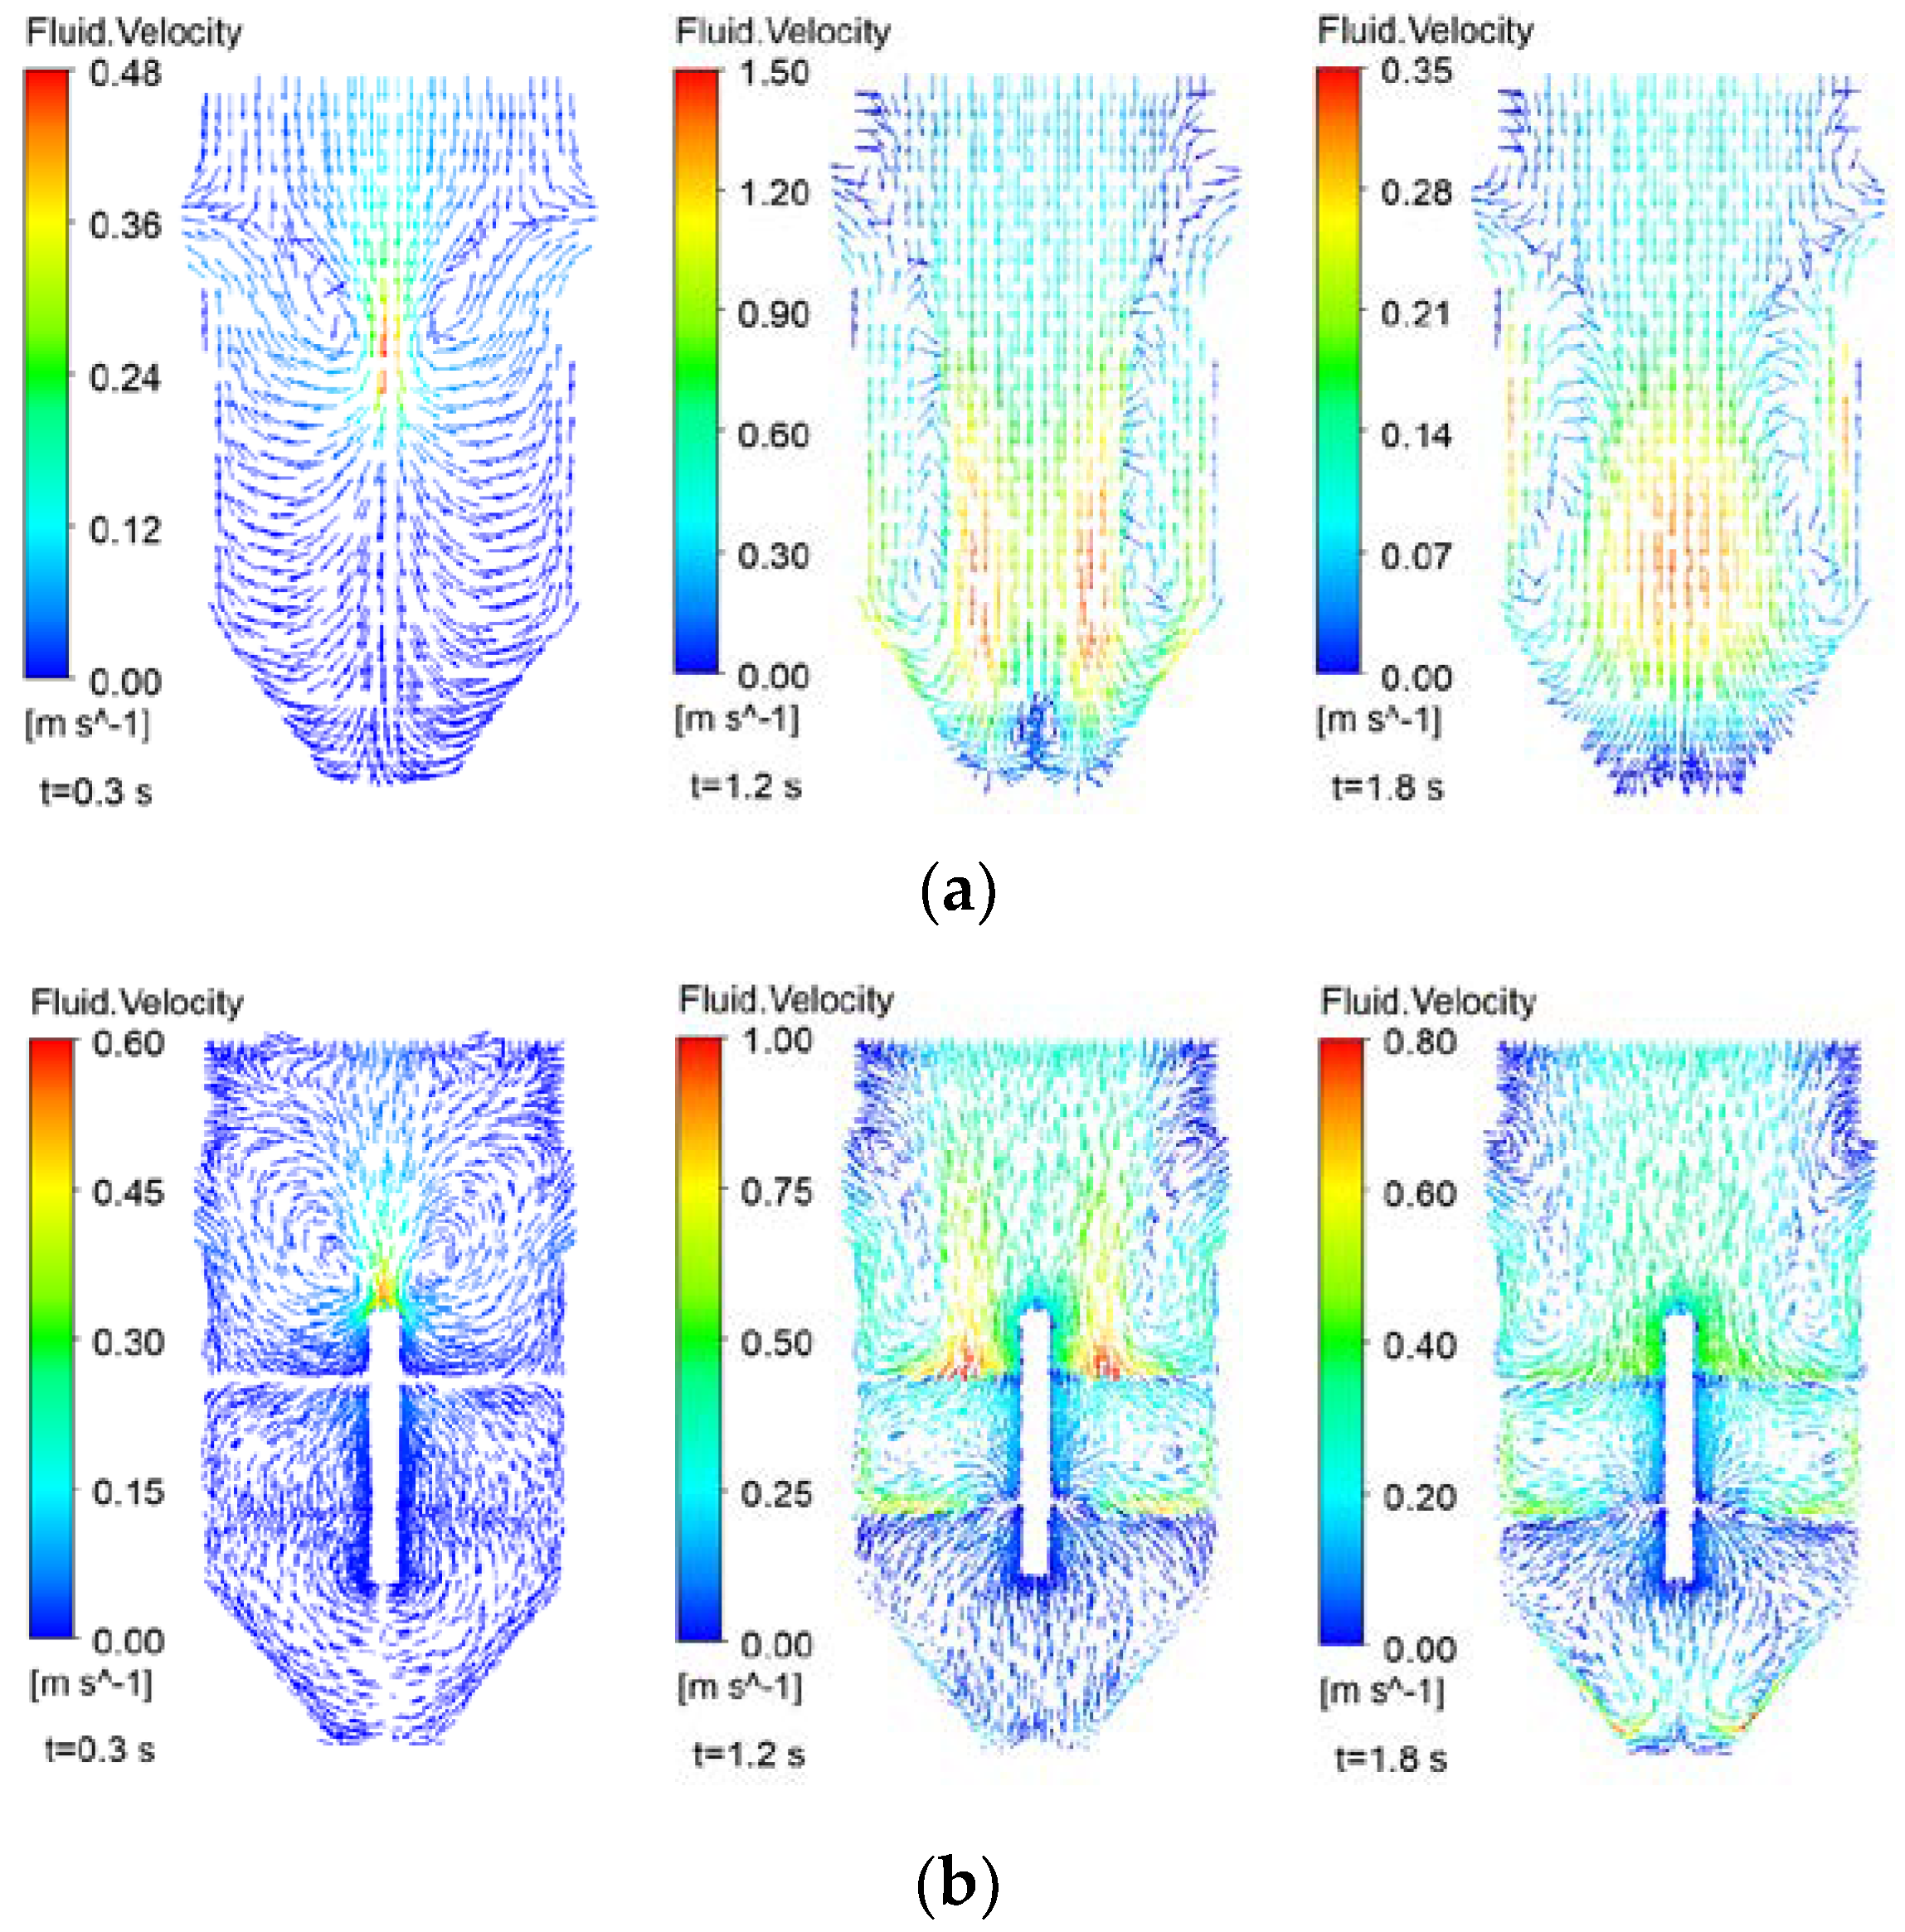
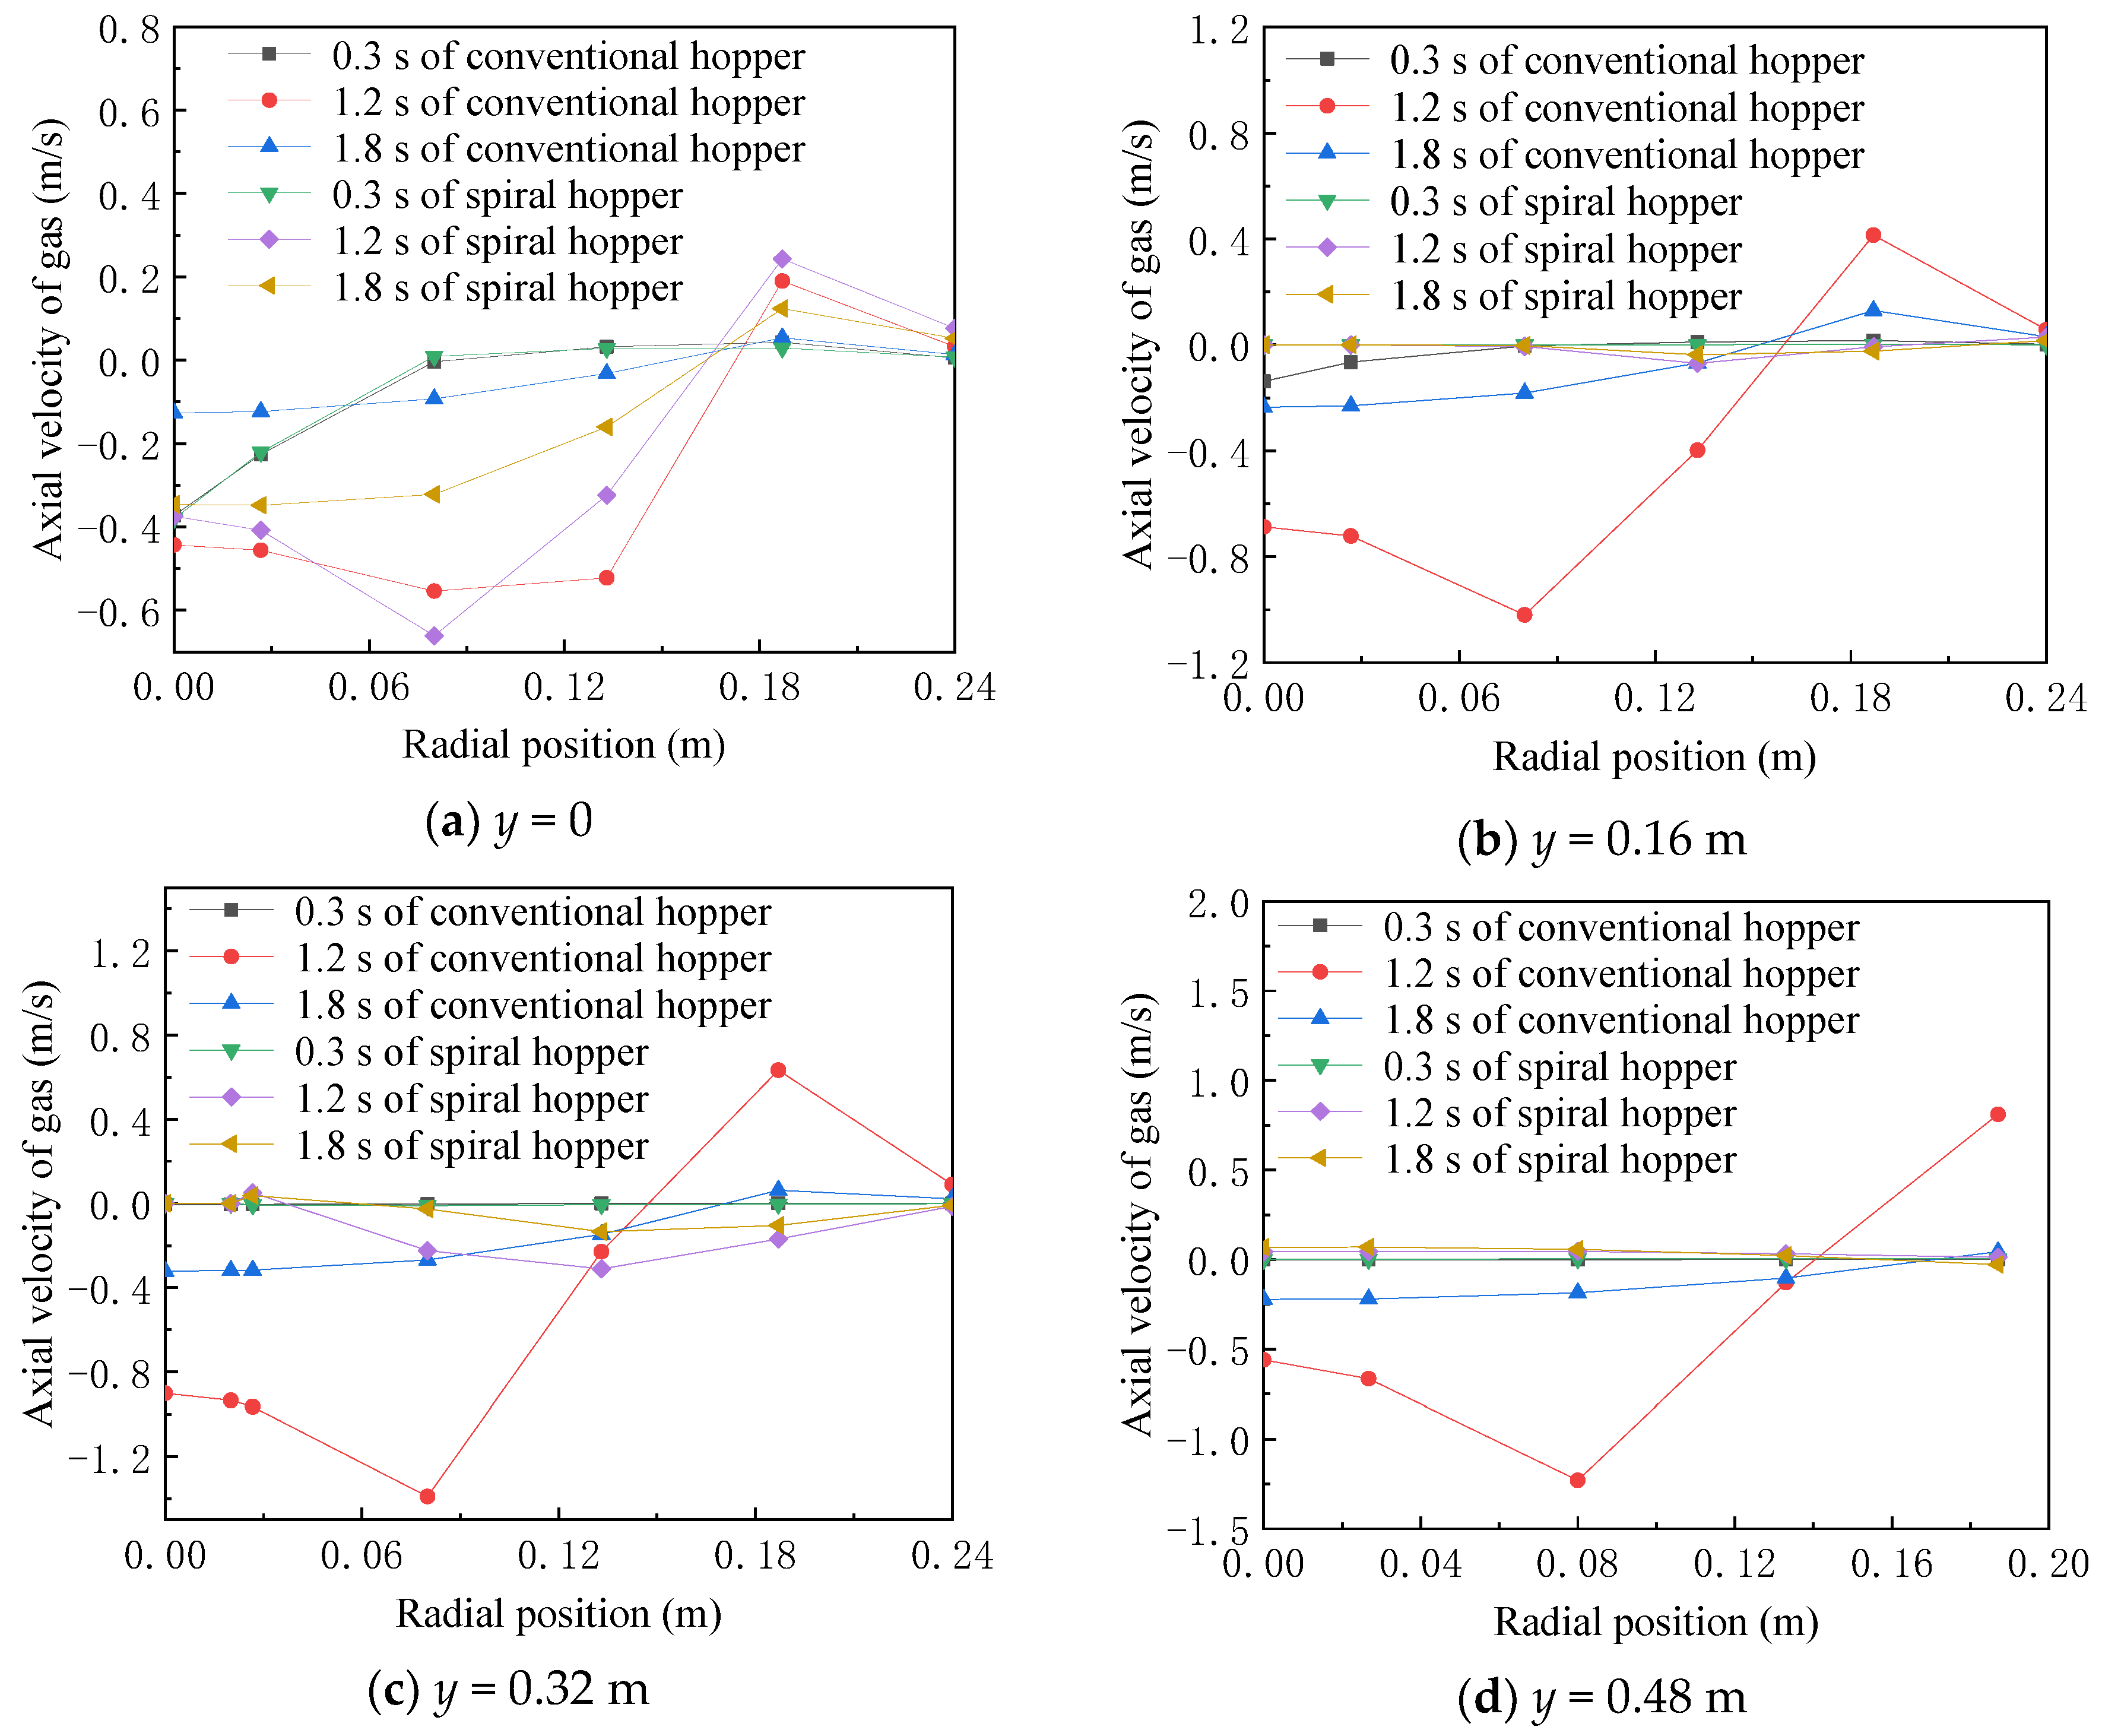
4.2. Distribution of Flow Field

Due to the dust being obviously affected by the drag of airflow, the flow field information is analyzed. The velocity vectors of the flow field for different times are investigated at a symmetry plane, as shown in Figure 6. From Figure 6a, due to the fact that particle flow moves down, the induced airflow is formed by the surrounding air. When reaching the bottom of the conventional hopper, the induced airflow rebounds and moves upwards because of the structure of conventional hopper. A part of induced airflow flows out of the hopper inlet and takes away dust particles. The other part forms an eddy inside conventional hopper. Figure 6b is velocity vectors of the spiral hopper at a symmetry plane. At 0.3 s, the particles mainly collide with the spiral hopper, and this is the main stage of dust escape in the transfer process of the spiral hopper. The collision between the material stream and spiral hopper leads some dust particles to leave the material stream in advance. Then, the material stream slides along the spiral guide plate at 1.2 s, as shown in Figure 4b. An eddy is formed in the semi-closed space. Thus, only a few dust particles flow out of the spiral hopper. At 1.8 s, the material accumulates at the bottom of the spiral hopper. The dusty airflow is controlled in the semi-closed space due to the barrier of the spiral guide plate.
In order to further analyze the internal flow characteristics of the conventional hopper and the spiral hopper, four cross-sections are selected with a distance of 0, 0.16 m, 0.32 m, and 0.48 m from the hopper inlet inside the hopper. The axial velocity of four cross-sections is investigated for the conventional hopper and the spiral hopper at different times, as shown in Figure 7. It can be found in Figure 7a that the gas axial velocity of the spiral hopper is higher than that of the conventional hopper at the stage of the material stream entering the spiral hopper due to the collision. As the material stream enters the hopper inside, the axial velocity of rising airflow is obviously reduced, and the dust is not easy to escape.

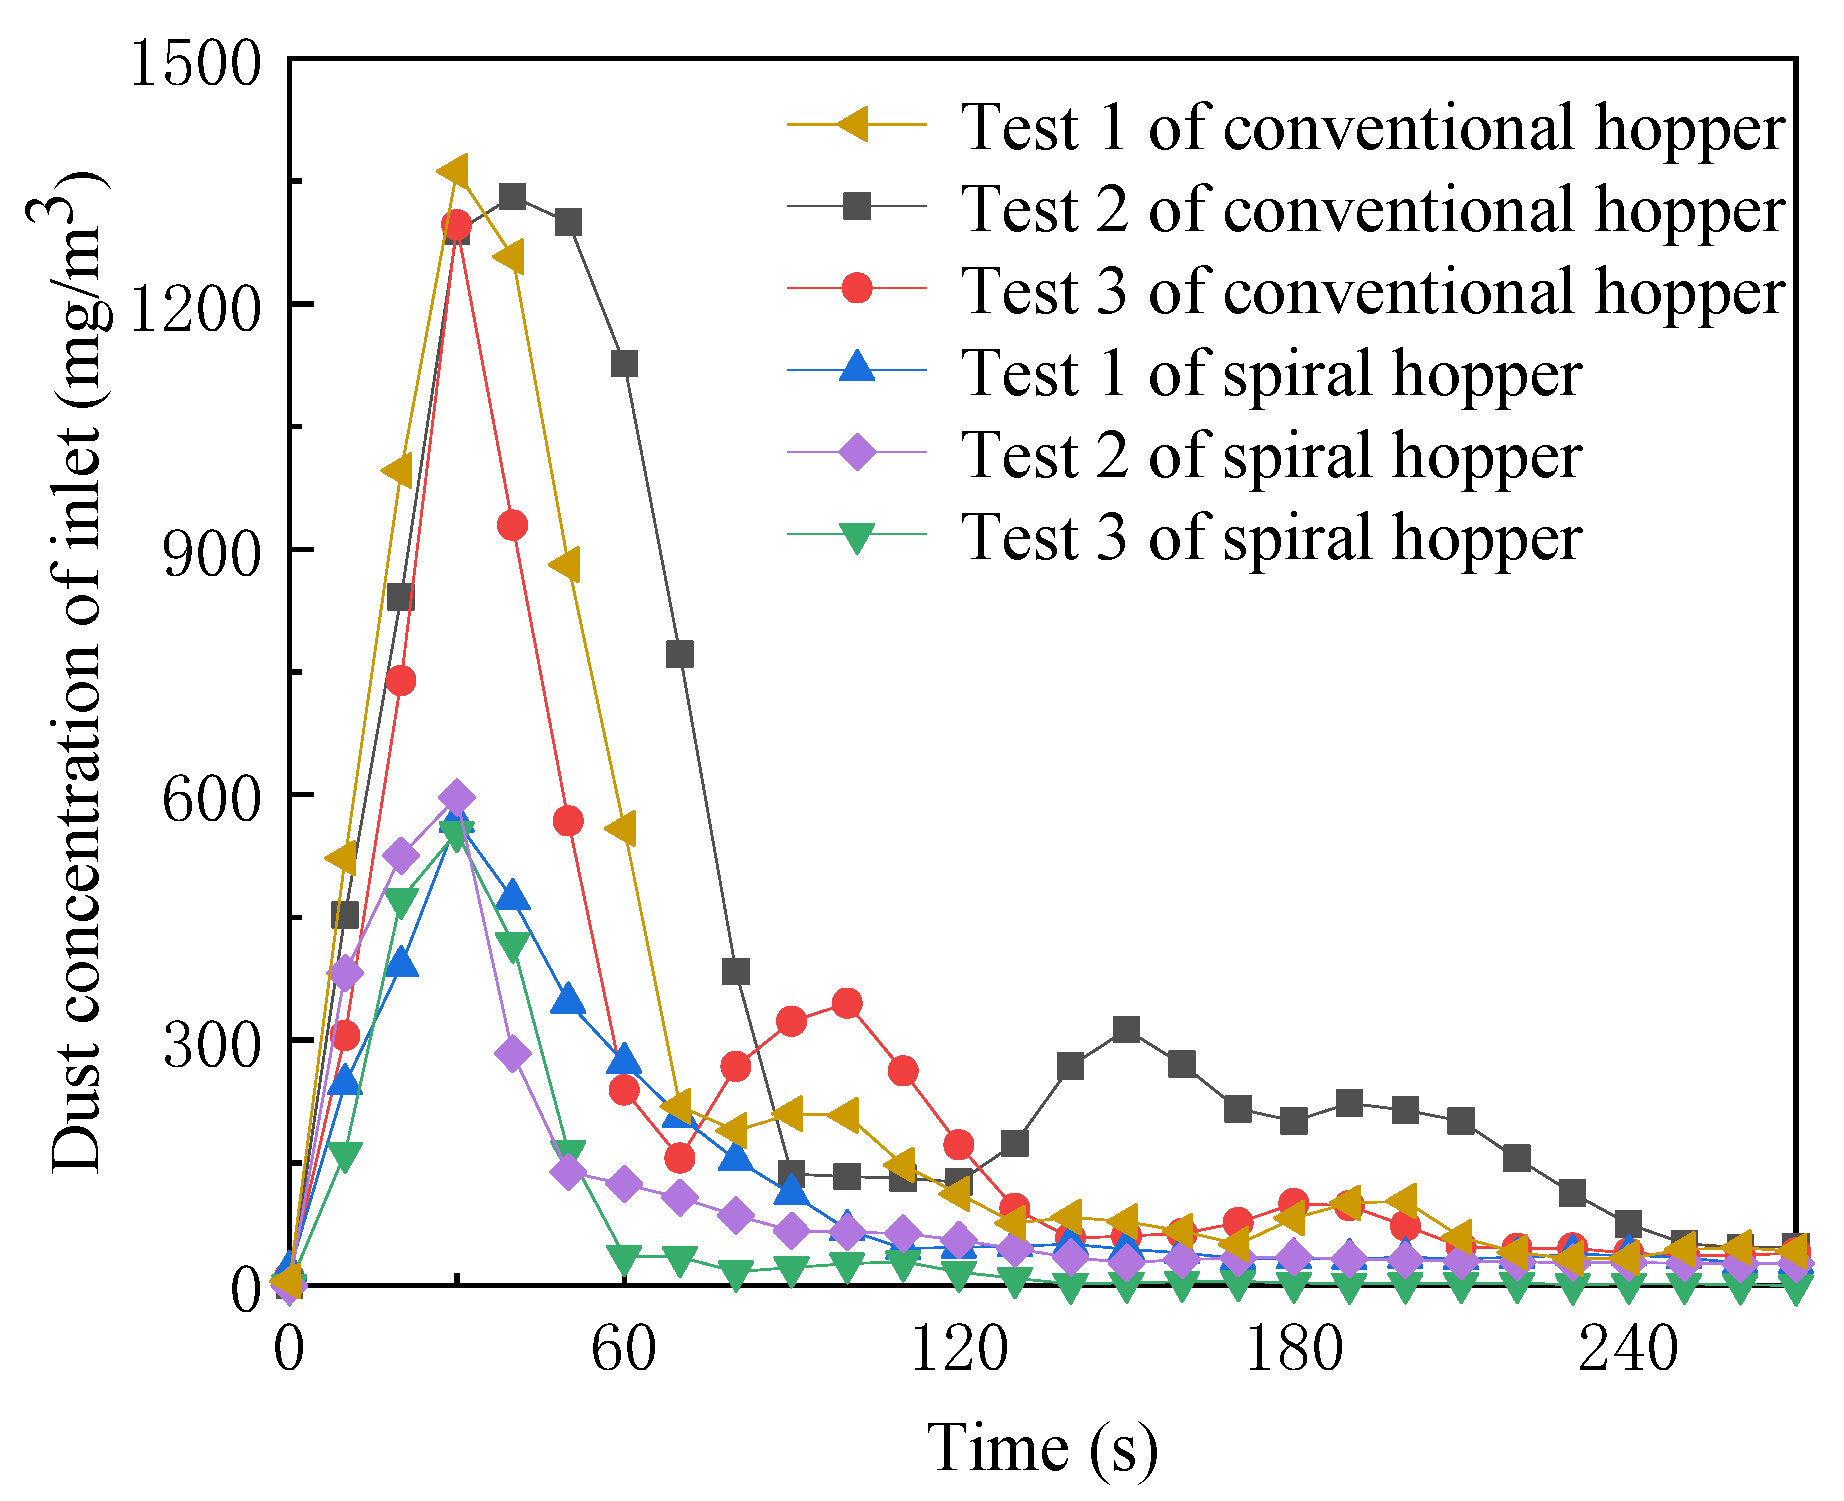
4.3. Performance of Dust Suppression

In order to further verify the effect of dust suppression, the experiments are studied and discussed. The dust concentrations and emission situations of the conventional hopper inlet and the spiral hopper inlet are shown in Figure 8 and Figure 9, respectively. The maximum dust concentrations of the conventional hopper inlet are 1362.0 mg/m3, 1330.9 mg/m3, and 1296.8 mg/m3, respectively. However, the maximum dust concentrations for the spiral hopper are 596.8 mg/m3, 554.1 mg/m3, and 567.5 mg/m3, respectively. Clearly, the maximum dust concentration for the spiral hopper is lower than that of the conventional hopper. The maximum dust concentration is decreased by 56.9%. It can be found that dust emissions decrease due to material stream impacts on the spiral guide at a low speed. The upward movement of induced airflow is blocked by the spiral guide plate when the material stream enters the spiral hopper. Therefore, the dust concentration of the spiral hopper inlet is decreased continuously and quickly. For the conventional hopper, the dust concentration of inlet has two peaks due to the effect of induced airflow. The dust concentration of the spiral hopper inlet is not increased with the experiment process. It can be seen that the secondary fugitive dust is controlled inside the spiral hopper.

5. Conclusions

In this article, a new passive dust suppression method about spiral hopper is proposed for the dust control in the hopper transfer process. It can be seen from the results and discussion above that:
  • The particle velocity is obviously reduced through the spiral hopper, and the collision between the particle and hopper is weakened. A semi-closed space is formed by the spiral guide plate so that the dusty airflow forms an eddy in the spiral hopper. The axial velocity of the spiral hopper inside is obviously reduced. The flow field of the spiral hopper is effectively improved.
  • Compared with the dust concentration of the spiral hopper inlet and the conventional hopper inlet, the maximum dust concentration of spiral hopper inlet is reduced by 56.9%. The secondary fugitive dust is controlled due to the induced airflow is blocked by a spiral guide plate.
It is therefore concluded that the dusty airflow is effectively suppressed by the spiral hopper. It is a simple device of passive dust suppression without external energy and equipment. According to the mobility of particles, a proper spiral inclination makes the material fall easily without clogging. In addition, the cost of the spiral hopper is lower than other dust suppression equipment. However, the additional spiral guide plates increase the weight of hopper, and the local dust concentration is increased due to the construction of the spiral hopper.

Author Contributions

J.Y., C.J. and F.Y. envisioned and designed the research; H.C. performed the data collection; J.Y., C.J., F.Y., Z.H. and H.C. analyzed the results; F.Y. wrote the original manuscript; J.Y. and Z.H. reviewed the manuscript. All authors have read and agreed to the published version of the manuscript.

Funding

This research was funded by the National Science and Technology Support Project (Project No. 2015BAF06B05).

Conflicts of Interest

The authors declare no conflict of interest.

References

  1. Petsonk, E.L.; Rose, C.; Cohen, R. Coal mine dust lung disease new lessons from an old exposure. Am. J. Respir. Crit. Care Med. 2013, 187, 1178–1185. [Google Scholar] [CrossRef] [PubMed]
  2. Amyotte, P.R.; Clouthier, M.P.; Khan, F.I. Dust explosions: An overview. In Methods in Chemical Process Safety; Amyotte, P.R., Khan, F.I., Eds.; Elsevier: Amsterdam, The Netherlands, 2019; Volume 3, pp. 1–5. [Google Scholar]
  3. Azarov, A.V.; Zhukova, N.S.; Antonov, F.G. Water-spray systems reducing negative effects of fine-dispersion dust at operator’s workplaces of machine-building industries. Procedia Eng. 2017, 206, 1407–1414. [Google Scholar] [CrossRef]
  4. Lu, X.; Zhu, H.; Wang, D. Investigation on the new design of foaming device used for dust suppression in underground coal mines. Powder Technol. 2017, 315, 270–275. [Google Scholar] [CrossRef]
  5. Arya, S.; Sottile, J.; Rider, J.P.; Colinet, J.F.; Novak, T.; Wedding, C. Design and experimental evaluation of a flooded-bed dust scrubber integrated into a longwall shearer. Powder Technol. 2018, 339, 487–496. [Google Scholar] [CrossRef]
  6. Wheeler, C.; Krull, T.; Roberts, A.; Wiche, S. Design of ship loading chutes to reduce dust emissions. Process Saf. Prog. 2007, 26, 229–234. [Google Scholar]
  7. Chen, X.L.; Wheeler, C.A.; Donohue, T.J.; McLean, R.; Roberts, A.W. Evaluation of dust emissions from conveyor transfer chutes using experimental and CFD simulation. Int. J. Miner. Process 2012, 110–111, 101–108. [Google Scholar] [CrossRef]
  8. Zhang, X.; Wang, H.; Chen, X.; Fan, C.; Tian, K.; Zhang, X. Experimental study on dust suppression at transhipment point based on the theory of induced airflow dust production. Build. Environ. 2019, 160, 106200. [Google Scholar] [CrossRef]
  9. Ansart, R.; de Ryck, A.; Dodds, J.A. Dust emission in powder handling: Free falling particle plume characterization. Chem. Eng. J. 2009, 152, 415–420. [Google Scholar]
  10. Wypych, P.; Cook, D.; Cooper, P. Controlling dust emissions and explosion hazards in powder handling plants. Chem. Eng. Process. 2005, 44, 323–326. [Google Scholar] [CrossRef]
  11. Chu, K.W.; Yu, A.B. Numerical simulation of complex particle-fluid flows. Powder Technol. 2008, 179, 104–114. [Google Scholar] [CrossRef]
  12. Zhu, H.P.; Zhou, Z.Y.; Yang, R.Y.; Yu, A.B. Discrete particle simulation of particulate systems: Theoretical developments. Chem. Eng. Sci. 2007, 62, 3378–3396. [Google Scholar] [CrossRef]
  13. Ma, H.; Zhao, Y.; Cheng, Y. CFD-DEM modeling of rod-like particles in a fluidized bed with complex geometry. Powder Technol. 2019, 344, 673–683. [Google Scholar] [CrossRef]
  14. Marchelli, F.; Moliner, C.; Bosio, B.; Arato, E. A CFD-DEM study of the behaviour of single-solid and binary mixtures in a pyramidal spouted bed. Particuology 2019, 42, 79–91. [Google Scholar] [CrossRef]
  15. Hilton, J.E.; Cleary, P.W. Dust modelling using a combined CFD and discrete element formulation. Int. J. Numer. Meth. Fluids 2013, 72, 528–549. [Google Scholar] [CrossRef]
  16. Goniva, C.; Kloss, C.; Chen, X.; Donohue, T.J.; Katterfeld, A. Transfer chutes: Predicting dust emissions by multiphase CFD and coupled DEM-CFD simulations. Bulk Solids Handl. 2014, 34, 55–57. [Google Scholar]
  17. Schulz, D.; Schwindt, N.; Schmidt, E.; Jasevičius, R.; Kruggel-Emden, H. Investigation of the dust release from bulk material undergoing various mechanical processes using a coupled DEM/CFD approach. Powder Technol. 2019, 355, 37–56. [Google Scholar] [CrossRef]
  18. Chu, K.W.; Wang, Y.; Zheng, Q.J.; Yu, A.B.; Pan, R.H. CFD-DEM study of air entrainment in falling particle plumes. Powder Technol. 2020, 361, 836–848. [Google Scholar] [CrossRef]
  19. El-Emam, M.A.; Shi, W.; Zhou, L. CFD-DEM simulation and optimization of gas-cyclone performance with realistic macroscopic particulate matter. Adv. Powder Technol. 2019, 30, 2686–2702. [Google Scholar] [CrossRef]
  20. Wang, S.; Li, H.; Wang, R.; Wang, X.; Tian, R.; Sun, Q. Effect of the inlet angle on the performance of a cyclone separator using CFD-DEM. Adv. Powder Technol. 2019, 30, 227–239. [Google Scholar] [CrossRef]
  21. Elsayed, K.; Lacor, C. The effect of cyclone inlet dimensions on the flow pattern and performance. Appl. Math. Model. 2011, 35, 1952–1968. [Google Scholar] [CrossRef] [Green Version]
  22. Huang, A.-N.; Maeda, N.; Shibata, D.; Fukasawa, T.; Yoshida, H.; Kuo, H.-P.; Fukui, K. Influence of a laminarizer at the inlet on the classification performance of a cyclone separator. Sep. Purif. Technol. 2017, 174, 408–416. [Google Scholar] [CrossRef]
  23. Sakai, M.; Koshizuka, S. Large-scale discrete element modeling in pneumatic conveying. Chem. Eng. Sci. 2009, 64, 533–539. [Google Scholar] [CrossRef]
  24. Chu, K.; Chen, J.; Yu, A. Applicability of a coarse-grained CFD–DEM model on dense medium cyclone. Miner. Eng. 2016, 90, 43–54. [Google Scholar] [CrossRef]
  25. Sakai, M.; Takahashi, H.; Pain, C.C.; Latham, J.-P.; Xiang, J. Study on a large-scale discrete element model for fine particles in a fluidized bed. Adv. Powder Technol. 2012, 23, 673–681. [Google Scholar] [CrossRef]
  26. Hilton, J.E.; Cleary, P.W. Comparison of non-cohesive resolved and coarse grain DEM models for gas flow through particle beds. Appl. Math. Model. 2014, 38, 4197–4214. [Google Scholar] [CrossRef]
  27. Zhou, W.; Ouyang, J.; Wang, X.; Su, J.; Yang, B. Numerical simulation of viscoelastic fluid flows using a robust FVM framework on triangular grid. J. Non-Newton. Fluid Mech. 2016, 236, 18–34. [Google Scholar] [CrossRef]
  28. Javanmard, E.; Yari, E.; Mehr, J.A.; Mansoorzadeh, S. Hydrodynamic characteristic curves and behavior of flow around a surface-piercing propeller using computational fluid dynamics based on FVM. Ocean Eng. 2019, 192, 106445. [Google Scholar] [CrossRef]
  29. Zhu, H.P.; Zhou, Z.Y.; Yang, R.Y.; Yu, A.B. Discrete particle simulation of particulate systems: A review of major applications and findings. Chem. Eng. Sci. 2008, 63, 5728–5770. [Google Scholar] [CrossRef]
  30. Ergun, S. Fluid flow through packed columns. Chem. Eng. Prog. 1952, 48, 89–94. [Google Scholar]
  31. Wen, C.Y.; Yu, Y.H. Mechanics of fluidization. Chem. Eng. Prog. Symp. Ser. 1966, 62, 100–111. [Google Scholar]
  32. Guardo, A.; Coussirat, M.; Larrayoz, M.A.; Recasens, F.; Egusquiza, E. Influence of the turbulence model in CFD modeling of wall-to-fluid heat transfer in packed beds. Chem. Eng. Sci. 2005, 60, 1733–1742. [Google Scholar] [CrossRef]
  33. Chen, Z.J.; Przekwas, A.J. A coupled pressure-based computational method for incompressible/compressible flows. J. Comput. Phys. 2010, 229, 9150–9165. [Google Scholar] [CrossRef]
  34. Liu, D.; Bu, C.; Chen, X. Development and test of CFD-DEM model for complex geometry: A coupling algorithm for Fluent and DEM. Comput. Chem. Eng. 2013, 58, 260–268. [Google Scholar] [CrossRef]
  35. Chen, D.; Liu, X.; Han, J.; Jiang, M.; Xu, Y.; Xu, M. Measurements of particulate matter concentration by the light scattering method: Optimization of the detection angle. Fuel Process. Technol. 2018, 179, 124–134. [Google Scholar] [CrossRef]
Figure 1. Simulation models: (a) conventional hopper; (b) spiral hopper.
Processes 08 00783 g001
Figure 2. Quantitative comparison for different mesh sizes of (a) conventional hopper; (b) spiral hopper.
Processes 08 00783 g002
Figure 3. The experimental system of a spiral hopper.
Processes 08 00783 g003
Figure 4. Particle distribution of (a) conventional hopper; (b) spiral hopper at DEM simulations. Particles are colored by velocity magnitude.
Processes 08 00783 g004
Figure 5. Particle velocity in the transfer process.
Processes 08 00783 g005
Figure 6. CFD results show velocity vectors at different times of (a) conventional hopper; (b) spiral hopper. Airflow is colored by velocity magnitude.
Processes 08 00783 g006
Figure 7. CFD results show gas axial velocity of different time at the cross-section of (a) y = 0; (b) y = 0.16 m; (c) y = 0.32 m; (d) y = 0.48 m. y is the distance from the hopper inlet to the cross-section of the hopper inside.
Processes 08 00783 g007
Figure 8. Dust concentration of hopper inlet at different times.
Processes 08 00783 g008
Figure 9. Dust emissions situation of (a) conventional hopper and (b) spiral hopper.
Processes 08 00783 g009
Table 1. CFD model description.
DescriptionModel
SolverPressure-based
Viscous modelRealizable k-ε
InletPressure inlet
OutletPressure outlet
WallNo slip
Table 2. Geometric parameters of the hopper.
ParametersValue
Diameter of cylinder (m)0.5
Height of cylinder (m)0.44
Total height of hopper (m)0.66
Bottom diameter (m)0.16
Pitch of spiral guide plate (m)0.72
Table 3. DEM parameters used in simulations.
ParametersValuesParametersValues
Sand Poisson ratio0.5Geometric shear modulus (Pa)3.0 × 10⁹
Sand shear modulus (Pa)1.0 × 10⁷Sand–sand restitution coefficient0.48
Sand density (kg/m3)2650Sand–sand static friction coefficient0.57
Sand size (mm)1.6Sand–sand rolling friction coefficient0.07
Number of sands 176,000Sand–geometry restitution coefficient0.45
Geometric Poisson ratio0.3Sand–geometry static friction coefficient0.58
Geometric density (kg/m3)1200Time step (s)1.0 × 10⁻⁵

