Article

The Development of a Waste Tyre Pyrolysis Production Plant Business Model for the Gauteng Region, South Africa

1
Department of Chemical Engineering Technology, University of Johannesburg, Johannesburg 2001, South Africa
2
Department of Chemical, Materials and Metallurgical Engineering, Botswana International University of Science and Technology, Private Mail Bag 16, Palapye, Botswana
3
Department of Chemical Engineering, College of Science, Engineering and Technology, University of South Africa, Christian de Wet and Pioneer Avenue, Private Bag X6, Florida, Johannesburg 1710, South Africa
*
Author to whom correspondence should be addressed.
Processes 2020, 8(7), 766; https://doi.org/10.3390/pr8070766
Submission received: 11 March 2020 / Revised: 29 April 2020 / Accepted: 8 May 2020 / Published: 30 June 2020
(This article belongs to the Special Issue Gas, Water and Solid Waste Treatment Technology)

Abstract

:
Some of today’s modern life challenges include addressing the increased waste generation and energy deficiencies. Waste tyres have been identified as one of the key environmental concerns due to their non-biodegradable nature and bulk storage space demand. Pyrolysis is a thermochemical process with the potential to address the growing waste tyre problem, energy deficits, and material recovery by converting waste tyres to pyrolysis oil that can be used as a fuel. This study seeks to critically evaluate the feasibility of constructing and operating a waste tyre processing facility and then subsequently marketing and selling the pyrolysis secondary end products by developing a financial business model. The model encompasses costing, procurement, installation, commissioning, and operating a batch pyrolysis plant in Gauteng, South Africa. To achieve the study objectives, an order of magnitude costing method was used for model construction. The results showed the feasibility and sustainability of operating a 3.5 tonne per day batch waste tyre pyrolysis plant in Gauteng Province, South Africa, with a 15-year life span and a projected payback period of approximately 5 years. It was concluded that for the pyrolysis plant to be successful, further treatment steps are required to improve the process economics; also, a stable and sustainable product market should exist and be regulated in South Africa.

1. Introduction

South Africa is burdened with 30 million waste tyres that are either landfilled or illegally dumped in open fields [1]. The generation rates are escalating at a rate of approximately 200,000 tonnes, equating to a million waste tyres annually [2]. In the 2016/2017 financial year, The Department of Environmental Affairs (DEA) reported that 31% of waste tyres have been diverted from landfills to be repurposed in reuse, recycling, and material or energy recovery industries [1]. In addition, through the Recycling and Economic Development Initiative of South Africa (REDISA), approximately 170,000 tonnes of waste tyres were recycled in 2016 [3]. In 2013, approximately 16,037 waste tyres were channeled to recycling, recovery, and reuse initiatives. Subsequently, in 2014 and 2015, the recorded figures of waste tyres allocated to recycling, energy recovery and reuse initiatives were 31,448 and 71,806, respectively [3], showing a significant increase over the years. South Africa is successfully directing waste tyres to different markets of which 25% of waste tyres are reused, 23% are designated for cutting and shredding to be used for spongy mats or playground material, 18% are converted to oil and carbon black through pyrolysis for various applications, and 16% are incinerated for energy recovery in cement or brick manufacturing kilns [3]. The remainder, which is about 18% of waste tyres, are redirected to landfills; this is still very high, and it gives more evidence to the case for repurposing more waste tyres. The characteristics of tyres, waste tyre pyrolysis, the associated primary and valuable secondary products, and the waste tyre management challenges have been comprehensively discussed by several authors in the literature. Muzenda [4] comprehensively detailed the various thermochemical processes such as pyrolysis, gasification, and liquefaction that waste tyres can undergo. The literature was utilised to formulate a detailed understanding of the different thermochemical technologies. Rodriguez [5], Islam [6], and Williams [7] discussed the waste tyre pyrolysis process in great detail as well as the different forms of products that the process can yield. Furthermore, Parthasarathy et al. [8] investigated the effect of process conditions on the product yield of waste tyre pyrolysis. Laresgoiti et al. [9] critically analysed the gases obtained in tyre pyrolysis; Cunliffe and Williams [10] as well as Islam et al. [11] assessed the composition of oils resulting from the pyrolysis of tyres, and Shah et al. [12] examined waste tyre-derived carbon black and its use as an adsorbent. The referenced literature has assisted the authors with the understanding of waste tyre pyrolysis chemistry, final product quantity, and quality as well as possible markets and applications. This paper aims to assess the economic viability of operating a waste tyre batch pyrolysis plant as well as the potential of producing high-value primary and secondary final products. This can significantly contribute towards addressing South Africa’s waste tyre challenges, energy, and material recovery, thus contributing to socioeconomic development. In addition, this study taps into the current socioeconomic ills currently experienced in South Africa, such as unemployment and the lack of successful small medium and micro enterprises (SMMEs) [13]. The results of this study can also be adopted by developing countries such as Thailand, Nigeria, and Brazil, who also face the same waste tyre problem as South Africa. In 2012, Thailand reported the energy recovery of waste tyres in the form of pyrolysis to be at 30.23% [14]. Similarly, Nigeria and Brazil are assessing the socioeconomic benefits to be derived from waste tyre management. Waste tyre pyrolysis is yet to be fully explored in these countries [15,16].

1.1. Waste Tyre Pyrolysis Product Compositions, Characteristics, and Application

The waste tyre pyrolysis process yields a gaseous fraction of mainly non-condensable gases, an oily fraction mainly composed of organic substances, and a solid fraction that comprises of mainly carbon, metal, and other inert material. The composition of the primary pyrolysis products is influenced by process operating parameters such as the feed size, temperature and pressure, residence time, heating rate, and reactor configuration, as well as the presence of catalytic medium [17]. Reactor design has been reported as one of the significant factors that affects product output, gas and oil characteristics, and process parameters [18]. The most generally used designs are fixed-bed, rotary/screw kiln, stirred tank, vacuum and fluidised-bed reactor types [18]. Fixed-bed reactors are commonly utilised for slow pyrolysis in batch systems with oil yield ranging from 35% to 50%, while fluidised bed reactors are commonly employed in the fast pyrolysis process and require small particle sizes, with oil yields ranging from 65% to 70% [18]. A rotary kiln reactor is slightly inclined (1°–10°) to progress the waste material forward; the added advantages are that the processing speed of turning, the extent of filling, and particle dimensions can be optimised to improve product yield [19]. Stirred tank reactors are designed for processing whole tyres, resulting in a considerable energy saving on size reduction costs [20]. The vacuum pyrolysis reactor is designed to accommodate larger tyre particles at low pressure and minimum temperature [21].
The approximate yield of gas from waste tyre pyrolysis is about 10–30% by weight and has a heating value of around 30–40 MJ/Nm3 [22]. Pyrolytic gas is commonly used as a source of fuel and can be adequate to provide the energy required to run a small-scale pyrolysis plant. The gas has high concentrations of methane (CH4, 44.50 vol %) and ethane (C2H4, 4.4 vol %), akin to natural gas (84.6 vol % CH4 and 6.4 vol % C2H4). However, the large quantities of carbon monoxide (2.41 vol %) hinders its blending with natural gas (0 vol % CO) [23]. The tyre-derived oil (40–50%) is composed mainly of alkylated benzenes, naphthalenes, phenanthrenes, n-alkanes from C11 to C24, and alkenes from C8 to C15, with small quantities of nitrogen (N2), sulphur (S), and oxygenated compounds [23]. The liquid fraction contains valuable chemicals such as aromatics, d-limonene, and BTX (benzene, toluene, xylenes). BTX compounds play a critical role in the production of chemicals, dyes, plastics, and synthetic fibres; their markets are projected to upsurge at a compound annual growth rate of 5.9% from 2019 to 2027 [24]. Additionally, tyre-derived oil has the potential to be used as automotive fuel after the removal of metal and metalloid contaminants such as zinc, aluminium, iron, titanium, sodium, lead, nickel, and traces of arsenic, chromium, and cobalt [23]. Pyrolytic oil has a high calorific value of about 44 MJ/kg as compared to waste tyres, 33 MJ/kg [23]; wood, 12.4 MJ/kg; coal, 30.2 MJ/kg; and it is close to that of diesel oil, which is 45.5 MJ/kg [25]. Pyrolytic char is a valuable energy source and contributes 30–35% of the product mix with a heating value close to 30.5 MJ/kg [12]. Its heating value is higher than that of South African lignite coals (16.7 MJ/kg) and compares well with petroleum coke (34.9 MJ/kg) [26]. Thus, the char can substitute coal as a source of energy in briquettes and industrial boilers, or it can be co-fired together with coal. Carbon black has the potential to be used as an adsorbent in the removal of heavy metals from industrial and municipal wastewater and as a precursor for activated carbon generation [27]. Furthermore, carbon black can be used as a filler and pigment for making printing inks, tyres, etc. [28]. The commercial viability of steel wire derived from the pyrolytic process which constitutes 10–15 wt % of product mix depends on its cleanliness, quantity, and packaging. Steel with less than 10% of rubber contamination is considered commercially viable [29].
These overwhelming advantages have motivated the authors to undertake this study with the aim of determining the business model for waste tyre pyrolysis in South Africa.

1.2. Waste Tyre Pyrolysis in South Africa

The waste tyre pyrolysis process is not a new concept in South Africa; however, it has not been fully explored to yield any significant successes. Several attempts have been made to operate profitable plants that adhere to environmental laws. Such attempts include the Pretoria-based pyrolysis plant (Innovative Recycling Pty Ltd.), which used to process 25 tonnes of waste tyres daily. The company capitalised on the opportunity of using excess waste tyres by erecting a waste rubber and plastic conversion to fuel plant. The facility ceased operations because it failed to adhere to environmental regulations and laws. In late 2018, another waste tyre pyrolysis facility, Milvinetix in Rosslyn Pretoria was shut down. This plant operated intermittently from March 2012 and processed 10 tonnes per day of the waste tyre employing a batch operation. It produced 40 wt % pyrolysis oil, 30–35 wt % carbon black, 15 wt % steel cords, and 10 wt % uncondensed gases [30]. The oil was sold as crude for industrial applications, such as a source of fuel for kilns and furnaces [30]. In recent years, more pyrolysis businesses have been established that produce a variety of end products. The IRR Manufacturing facility processes waste tyres, waste wood, and waste polyolefin plastics in a 1000 kg/hour pyrolysis plant in Rosslyn, Pretoria, to produce pyrolytic gas, oil, and carbon black [31]. Recor-Waste to Energy Solutions is a South-Gauteng-based pyrolysis plant that converts a variety of wastes such as municipal solids, agricultural, medical, abattoir, and sawdust, converting them to energy. Additionally, waste tyres are converted to energy, oil, and char, while plastic and waste oils are processed to yield a variety of diesel grades [32]. Lastly, Trident Fuels Pty Ltd., located in Germiston, Gauteng, processes waste tyres to produce crumb rubber and carbon black [33].
The pyrolysis oil specifications and properties of the Milvinetix oil were benchmarked against local and international oil standards before application. As a result, an oil sample obtained from Milvinetix was analysed against international standards. Moreover, an additional sample of crude pyrolytic oil was obtained from Pace Oil, which is an oil refinery company that purifies crude oils obtained from different sources. Oil specifications for both Milvinetix and Pace oil are presented in Table 1. A comparison between the different oils shows that the pyrolysis characteristics conform to the American Society for Testing and Material International (ASTM) standards [34] for density and viscosity. However, both oils exhibit a low flash point requiring specific storage measures to meet insurance and fire prevention requirements. As a result, additives and blending would be required to increase the flashpoint and reduce the water content [35]. The two oils were observed as containing excess contaminants, although there was minute metallic contamination. Furthermore, both oils are out of specification regarding the octane index and micro carbon residue, thus limiting their application. The Milvinetix oil is not further treated due to the economics of the business model not being sound when purified [31,36]; thus, it is sold in its crude form.
Carbon black obtained from Milvinetix showed a high calorific value, making it possible for fuel applications, as shown in Table 2. However, it does not conform to the ASTM standards [37] for ash and volatile matter content, meaning the char cannot be considered for industrial use in its virgin form after pyrolysis. The fixed carbon content is about 60%, which is an indication that the char will require a longer combustion time. Consequently, further chemical or physical purification of the carbon black is required to improve its marketing and standardisation potential. Activation agents such as ZnCl2, KOH, and H3PO4 are frequently used to chemically treat the carbon black; also, traditional gases such as steam/H2O, CO2 and air/O2 are employed during physical activation [27].

2. Materials and Methods

This work seeks to critically evaluate the profitability of constructing and operating a waste tyre processing facility and subsequently marketing the pyrolysis secondary end products. This was achieved through a desktop study involving comprehensive literature analysis, the evaluation of waste tyre treatment options from the literature as well as local companies doing pyrolysis, and in-depth studies of the pyrolysis process, as well as pyrolysis plant model construction through the costing of major equipment. Telephonic interviews to local-based companies were also used where appropriate and convenient to both parties.

2.1. Costing Data

Before commencing with the costing of equipment, a simplified process flow diagram, Figure 1, was prepared for the aim of identifying all the process steps and all the major equipment to be sized. This was deduced from the literature search for both local and international companies, plant visits, and/or telephonic interviews with local company representatives. Capital cost estimates are differentiated into three types based on their precision and purpose. The Authorisation (Budgeting) Estimates, with 10–15% precision, is utilised when a preliminary Piping and Instrumentation Diagram (P&ID) of all major equipment is available. The Detailed (Quotation) Estimates, with 5–10% precision, is based on acquired quotations for all equipment and estimations of construction costs [41]. Lastly, The Order of Magnitude Estimate is used in the initial feasibility studies of the project and is based on production rates and major equipment requirements. It may also be used as a tool to estimate the profitability of the project and has ±30% estimation precision [1]. The corrections used in the study and the calculation data were obtained from references [41,42]. The order of magnitude costing method was utilised due to the unavailability of literature information and lack of documented data as well as the existence of a small pyrolysis process industry that is still in its infancy stages in South Africa. In addition, the currently operating pyrolysis facilities are independently owned and ideally protect their intellectual property.
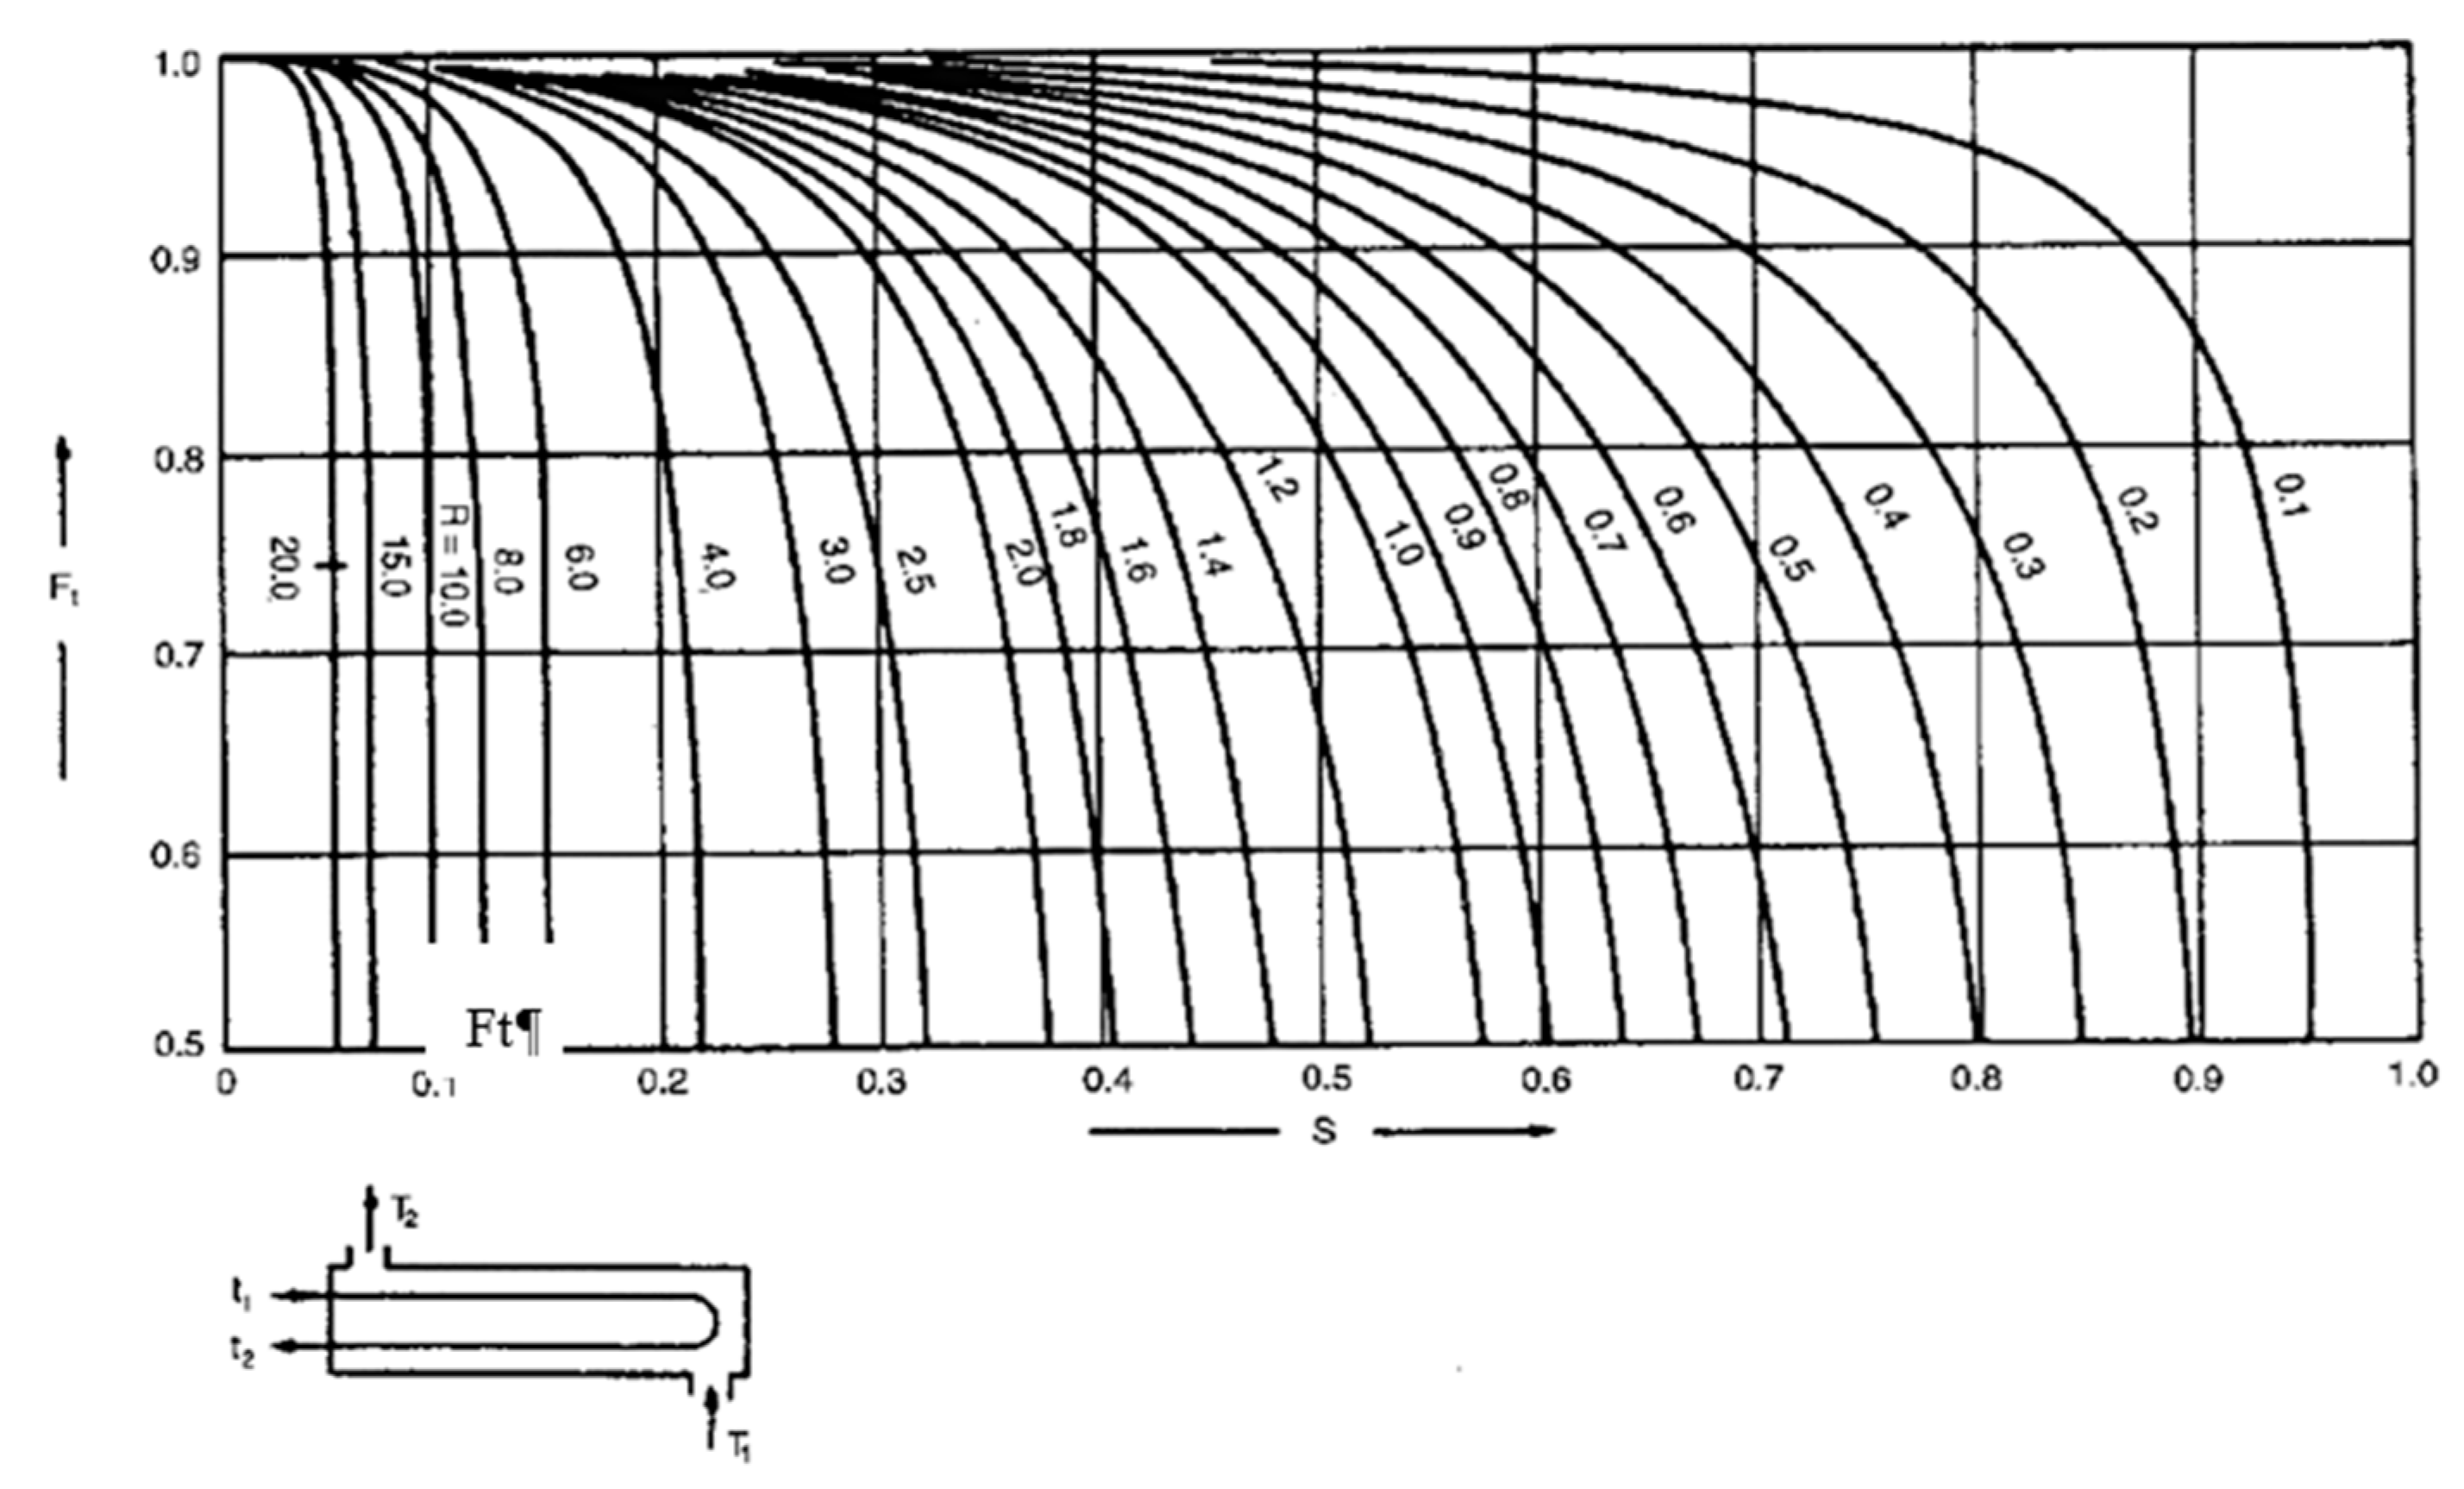
Literature from Sinnott [41] and Sila [42] was used to obtain the base cost equipment data as presented by Equations (1) to (4). Equation (1) is used to obtain the base cost of major equipment using [41], while Equation (2) is utilised to obtain the costs of all equipment except the heat exchanger from [42]. Furthermore, the temperature, pressure, and material of construction correction factors when sizing equipment were derived as provided by [42], as shown in Table 3. From Equation (1), the size parameter (S) is limited to a specific equipment size range and should be factored in during equipment costing. Figure 2 shows the temperature correction factor to be considered during the costing of a heat exchanger, as provided by [41]. The cost literature contains equipment costs at specified capacities; thus, to scale the equipment cost to the required capacities, the standard design limit (Q1) is introduced in Equation (3) as provided by [42]. To obtain the recent year cost of equipment, such as shell and tube heat exchangers, reactors, boilers etc., for a certain year, the base year index and recent year index are considered. Equation (4) is utilised to obtain a recent price using the Engineering Plant Cost Index (CEPCI). In this regard, the mid-2004 CEPCI values, used as the base year by [41], together with the annual average CEPCI values for 2019 were used to obtain the cost of plant equipment. The final equipment costs are presented in Table 4. Additionally, detailed quotations were obtained for certain process equipment utilised mainly during pre-pyrolysis.
Equipment costing equations
CE = CSn
CE = FT FP FM C2
C1 = Cb (Q1/Qb)n
C2 = C1(I2/I1)

2.2. Economic Feasibility Analysis

The project’s economic feasibility analysis is performed subsequent to the costing of all major equipment. This is selectively done to determine the financial performance of the project during its lifespan. Several methods are used to determine the profitability of the project and these are also compared with values provided in literature. The following project profitability parameters are used and represented by Equations (5) to (11).
  • Net present value (NPV)—the present time value of money used in investment planning to analyse the profitability of a project.
  • Rate of return (ROR)—the gain or loss of an investment compared to the cost of an initial investment, expressed as a percentage.
  • Return of assets (ROA)—indicates the profitability of a company relative to its total assets.
  • Depreciation—the rate at which fixed assets are reduced uniformly over their useful life.
Labour costs = hourly rate × total number of hours worked
Operating costs = labour costs + Fixed costs + variable cost
Revenue = quantity × price
Cumulative cash flow = revenue − operating costs − taxes
Return of asset = (net income)/(total assets)
Net   present   value = ( initial   investment ) / ( ( i = 1 time ( Cash   flow ) / ( 1 + discounted   rate ) )
Rate of return = cumulative cash and the end of project/(project life × original investment)

3. Results and Discussions

3.1. Pyrolysis Parameters and End Products

The literature analysis regarding the feasibility of constructing and operating a batch pyrolysis plant in Gauteng as previously highlighted shows that to a large extent, the reactor temperature, heating rate, and reactor design determine the yield of solid, gas, and liquid products. In this regard, the operation of a fixed-bed reactor at 550 °C, ambient pressure and constant heating rate would allow for the production of 45% oil, 5% pyrolysis gas, 35% carbon black, and 15% steel wires as final products. Upon completion of the pyrolysis process, pyrolytic gas is cooled and further condensed to form pyrolytic oil. This oil is classified as No. 6 oil, which is a thick, syrupy heavy crude oil and has an acid smell. To increase the economics of this product that would facilitate a viable waste tyre pyrolysis facility, purification steps, such as desulphurisation and/or distillation will be integrated into the process. This treatment step improves the quality of the oil, thus increasing its application potential. The crude pyrolysis oil is distilled to form light tyre-derived distillate fuel and residual fuel oil fractions. The residual oil is blended with diesel, while the distillate fraction is utilised in agricultural vehicles. Alternatively, the oil can be treated to derive some important chemicals such as BTX and D-limonene and this value addition contributes to the improvement of the process economics. The uncondensed gases are recycled back to the system for use as fuel to sustain the process, thereby reducing the energy input. This contributes to making the process thermally self-sufficient. The emissions from the reactor burners are chemically treated using a gas absorption process. The solid fractions consist of a mixture of carbon black and steel wires. A magnetic separation is used to remove ferrous metals to isolate the two components. The carbon black is further milled to obtain different grades and fractions of the char. The following fractions can be obtained: N220 (24–33 nm) used in rubber and rubber products; N770 (70–96 nm) used in paints and pigments; N990 (250–350 nm) used as activated carbon, and the residue fraction can be used for briquettes. The steel component is sold to steel manufacturers or dealers. However, in the South African context, no records of such applications have been reported.

3.2. Process Description

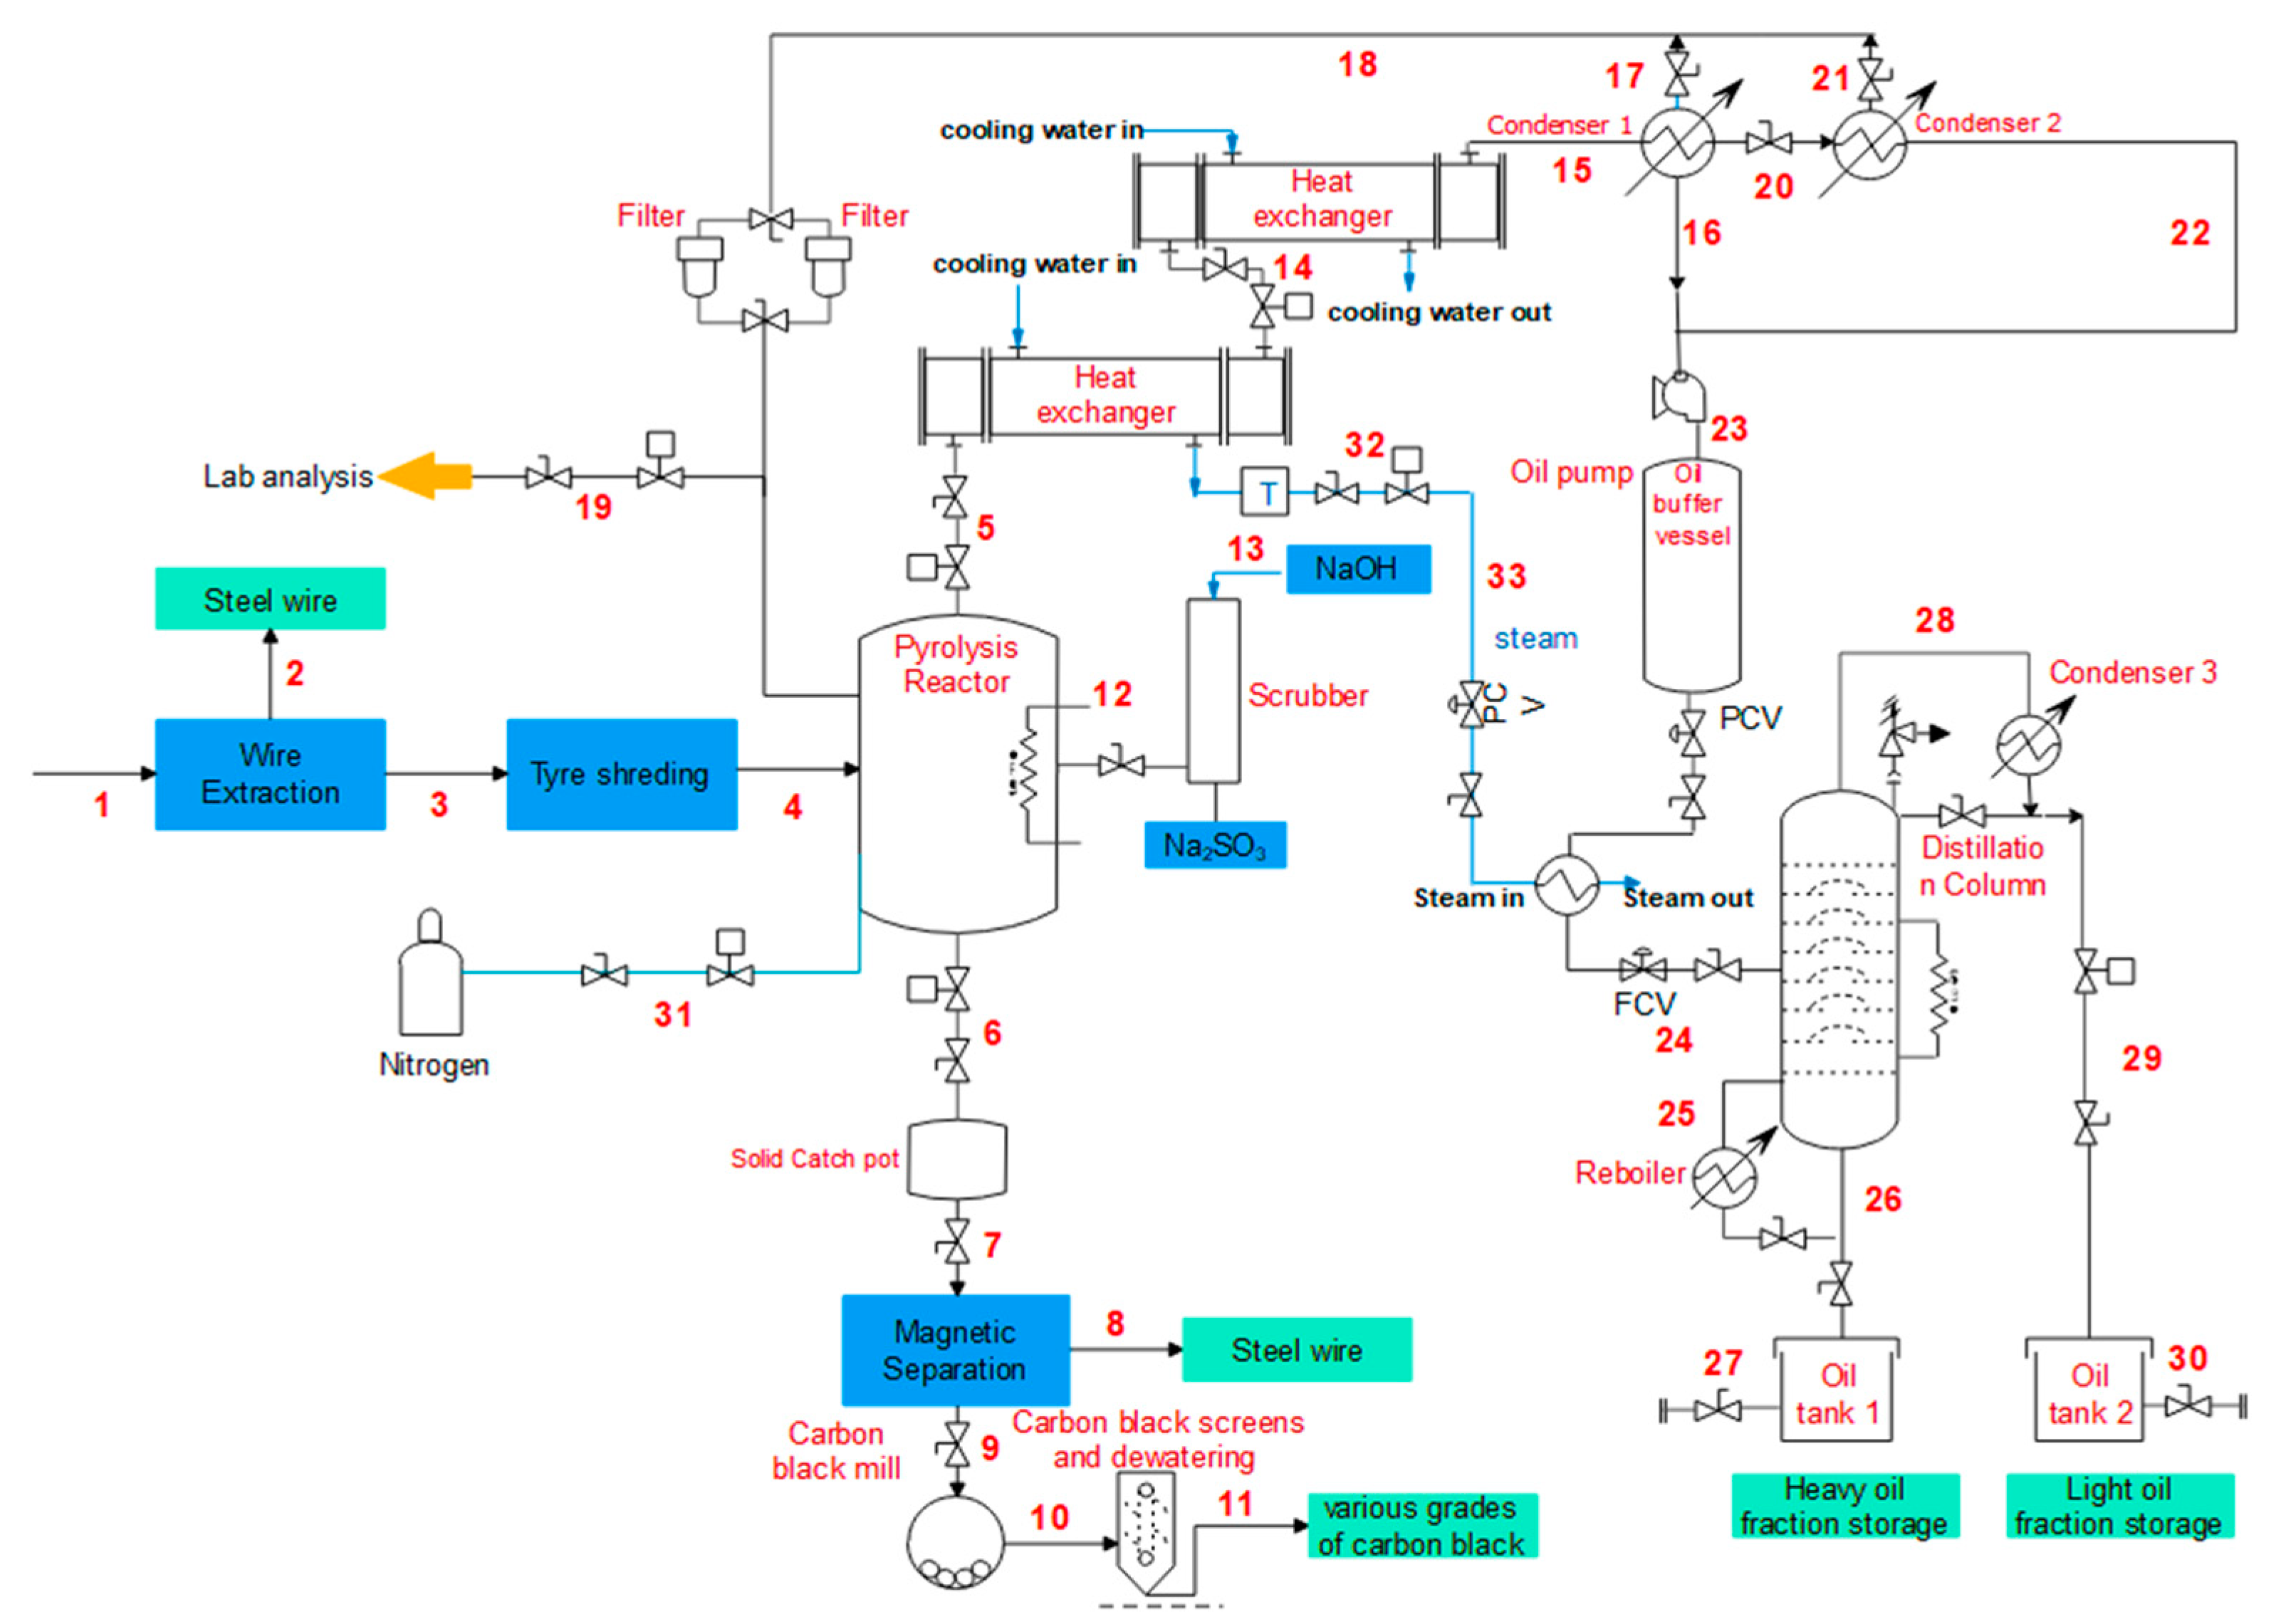
The pyrolysis process P&ID is shown in Figure 3, and the process description is explained in accordance with the process streams in the P&ID. Waste tyres are transported onsite and stored in a designated storage area. At the beginning of each shift, tyres are quantified using a weighing system, and the obtained figures are kept as record. Reinforcing wire is subsequently removed from the tyre, which is represented by process line 2 in the P&ID, and it is baled to be sold to recyclers as a form of revenue. Then, tyres are allowed to pass through a mechanical shredder, which will minimise their size to particle sizes of between 15 and 40 mm as recommended by [43] and denoted by process line 3. The shredded tyre chips are introduced into the reactor chamber where nitrogen is purged into the system to allow for an inert environment, as shown in process line 4. Pyrolysis is an endothermic process; thus, an electrical heater will be utilised to provide thermal energy up to 550 °C, which is required to initiate the decomposition of the tyre chips in the pyrolysis reactor. The vaporised gases are cooled using two heat exchangers in series (process line 5 and 14); thereafter, condensation of the oil is facilitated and is represented by process lines 15 and 20. The non-condensable gases, as shown in process line 18, are recycled back into the reactor to sustain the process. The oil fraction is further distilled into light distillate oils, as shown in process line 29, for application in agricultural vehicle or blended with commercial diesel containing low sulphur content. The heavy residue oils, as shown in process line 26, will be sold to fire up furnaces, boilers, and kilns. The solid char is collected at the end of each batch process and later segregated from the unextracted steel cords using a magnetic separator, as shown in process line 8. The char will be further milled into different grades, as seen in process line 11, and sold for profit. The flue gas that remains in the reactor chamber after each batch will be channeled to the absorption column for abatement, as presented by line 12 in the P&ID.
The material and energy balances are presented in Table 5. The material balance gives an indication that a material feed rate of 145 kg/h produces a gas fraction at 50.86 kg/h. Consequently, approximately 54 and 20 litres per hour of distillate and heavy oils will be produced respectively during the process. In addition, steel wire and carbon black will be produced at a rate of 21.79 and 50.86 kg/h respectively. Apart from the thermal energy provided in the reactor to facilitate the reaction, the feed material and products generated during pyrolysis will also aid in providing the process energy requirements, as highlighted by the energy balance in Table 5.

3.3. Pyrolysis Utilities

The process requires process water for cooling equipment such as heat exchangers, cooling towers, condensers, and carbon black wet grinding as well as general use in the plant. Approximately 8500 L of water will be used monthly in the plant. The energy requirement for the plant for all the different process energy demands is shown in Table 6. The available fuel is the 5% gas produced during pyrolysis, which is subsequently recycled back into the process to help sustain the process. This is power supplied to components such as the tyre shredder, heaters, pumps, and control systems as well as large mechanical and heating equipment. Sodium hydroxide (NaOH) is used as the scrubbing reagent at a cost of R9.55/kg per bag. Nitrogen is required in the process to purge out the oxygen (O2) and create an inert environment; the N2 cost estimate is approximately R485.79 per 13 kg cylinder.

3.4. Gas Emission Scrubbing

The flue gas emissions are confined and scrubbed through a gas absorption tower using NaOH solution. The typical flue gas composition is sulphur dioxide (SO2), carbon dioxide (CO2), nitrogen oxides (NOx), hydrocarbons (H-C), moisture (H2O), CO, N2, and O2 [45]. Carbon dioxide is reacted with sodium hydroxide to form water and sodium carbonate, as denoted by Equation (12). In the presence of excess SO2, sodium sulfite (Na2SO3) is formed as a final stable product, as shown in Equation (13). Sodium sulfite is primarily used in the pulp and paper industry, food preservatives, and pharmaceuticals [46]. The sale of Na2SO3 can potentially add another income stream into the business model.
NaOH + CO2 → Na2CO3 + H2O
SO2 + H2O + Na2CO3 → Na2SO3 + CO2

3.5. Pyrolysis Production Plant Model

The economic model is based on a 15-year pyrolysis plant life span consisting of 4 rotating shifts with 3 shifts operating daily. The processing facility operates as a batch process of 303 days per year; the remaining days are utilised for maintenance as shown in Table 7. The available plant capacity is 1056.5 tonnes/year, with a shutdown period of 62 days/year. The initial process assumptions, input, and input costs for the project are also given in Table 7.
Four income streams will be the core revenues to be considered for the project. In this regard, a tyre gate fee of R14.10 per tyre is collected. Distilled pyrolysis oil is sold at R14.65 per litre, taking into account the annual average 2019 fuel price of R15.81 per litre with fluctuation allowance. The oil will be mainly sold to agricultural businesses for use in agricultural vehicles and machinery. Overall revenues of R2.21 million and R1.85 million per annum of pyrolysis oil and various carbon black grades (N220, N770, N990, and briquettes) respectively will be collected at the end of the first financial year. Lastly, the residual steel wires are sold to appropriate dealers at a rate of R2500 per tonnes, thus contributing approximately R0.5 million towards the first-year revenues. The 5% uncondensed gasses are recycled back into the process to sustain the plant.
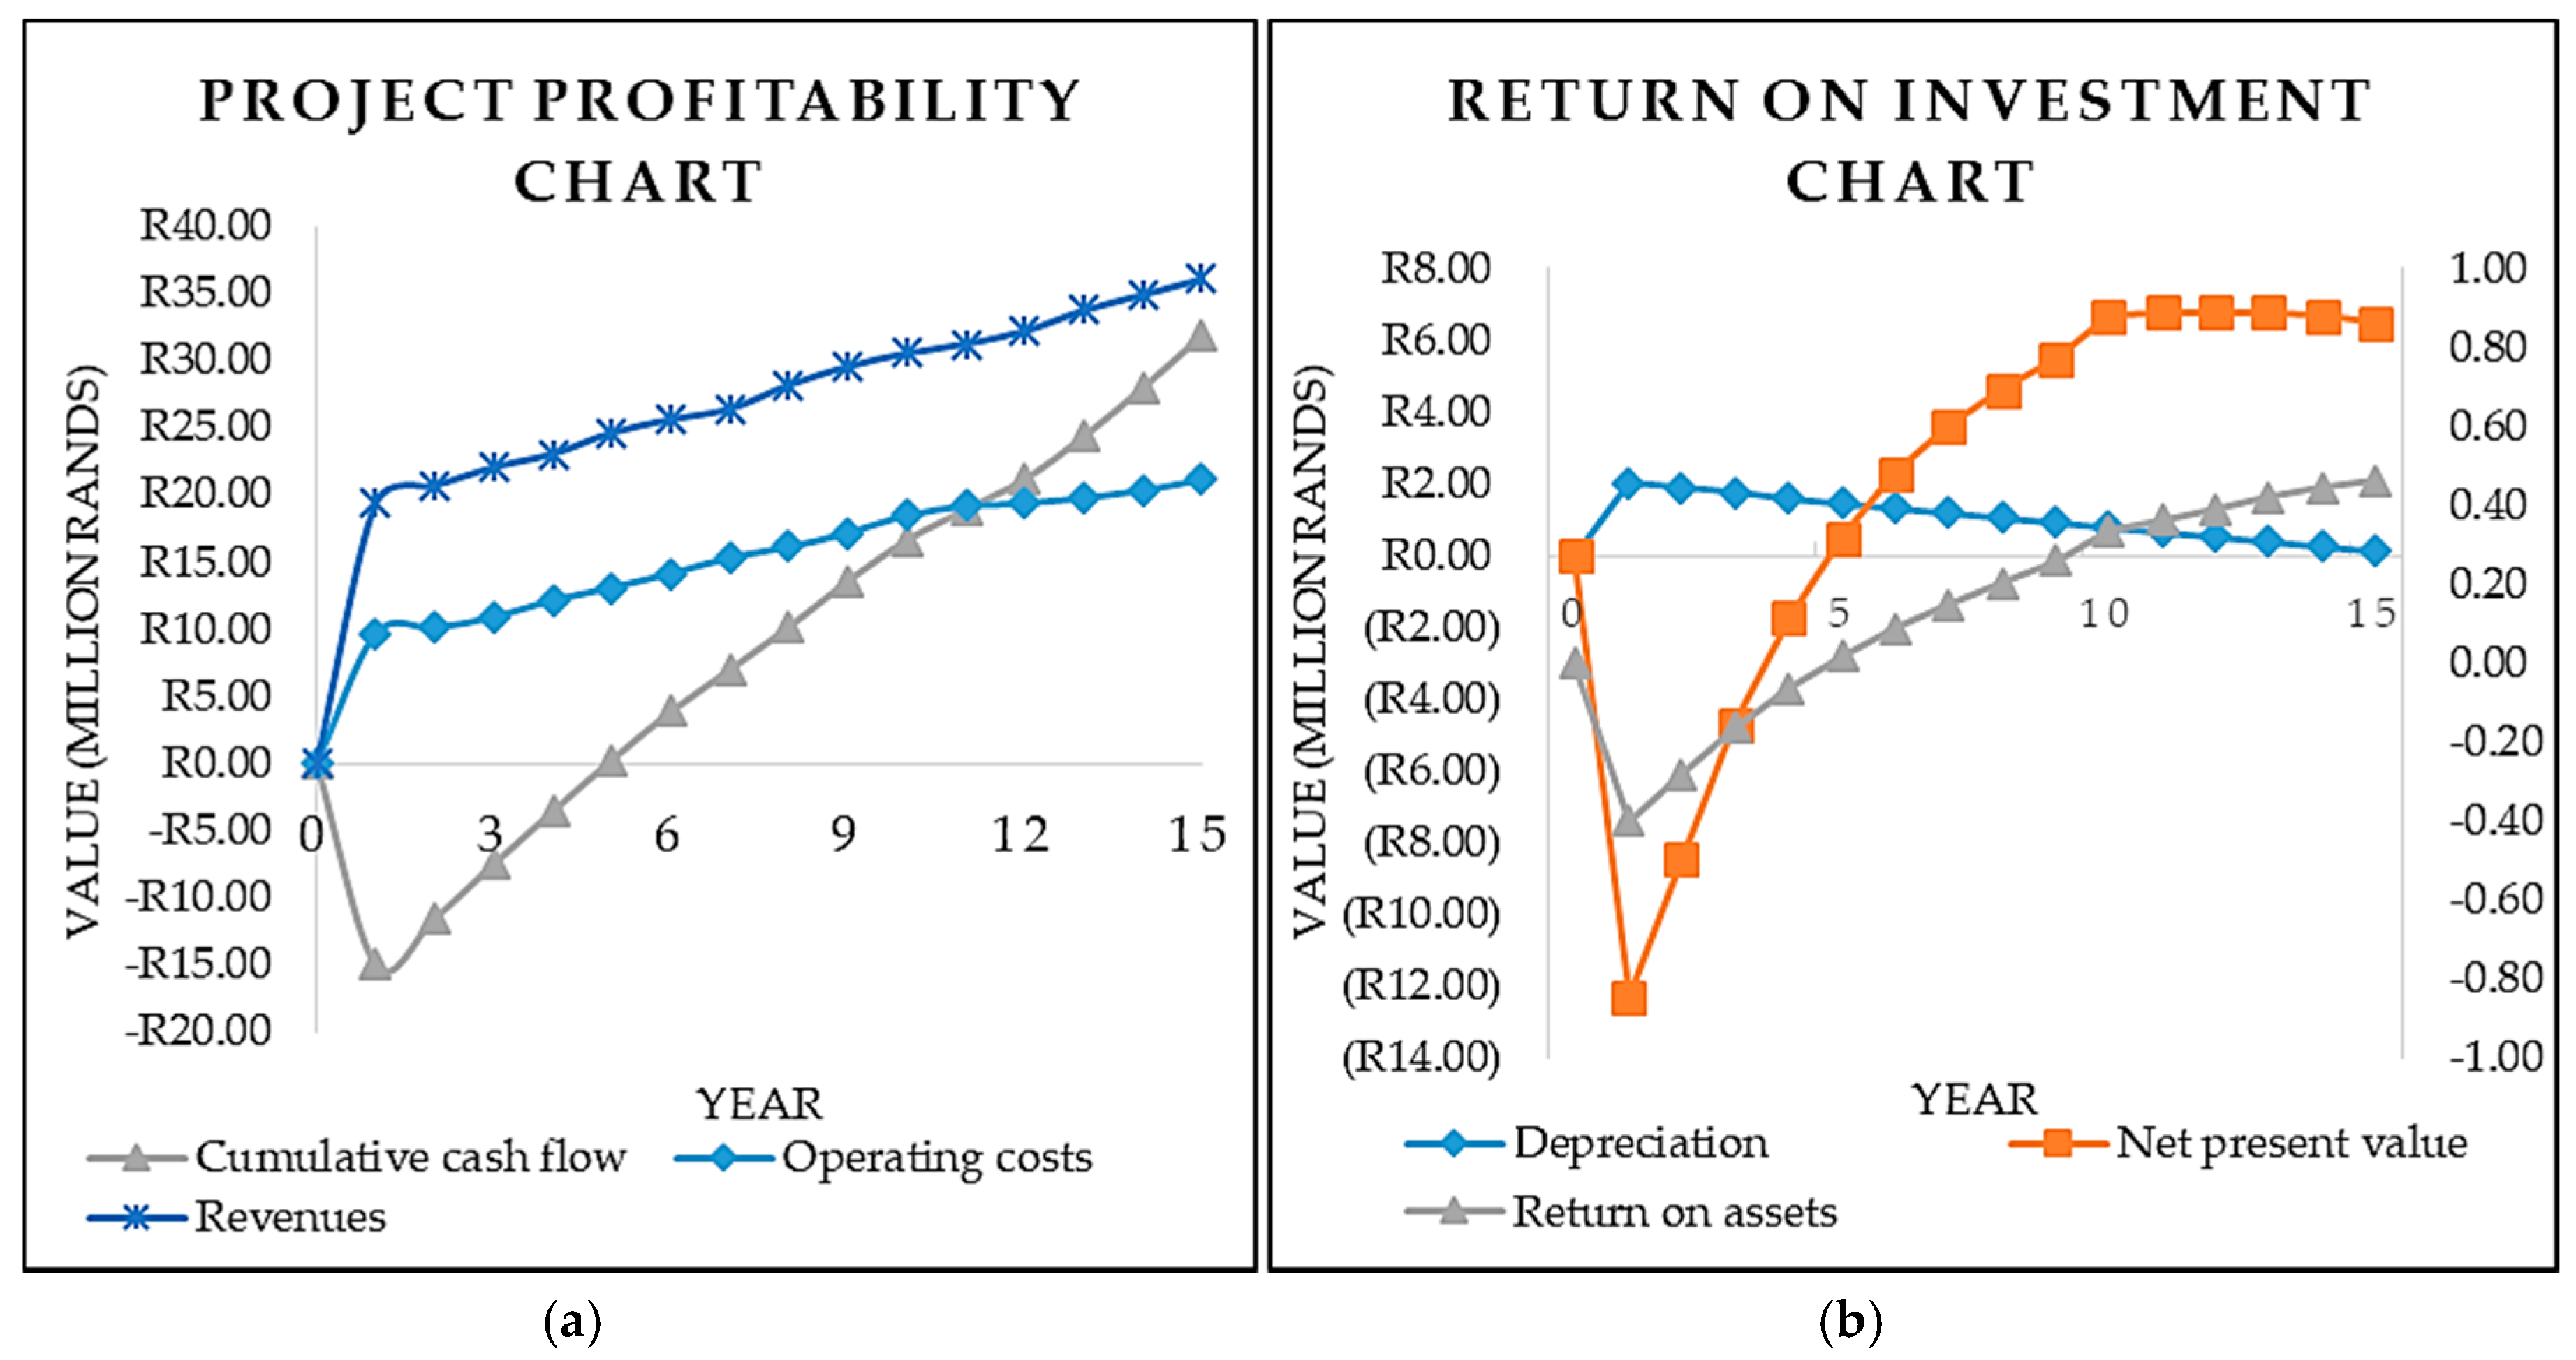
As highlighted previously, the order of magnitude estimate method was used to cost all major equipment. Using project evaluation methods, represented by Equations (1) to (4), it can be concluded that the project is worth investing in with a projected payback period of approximately 5 years, as shown in Figure 4a. Consequently, the project requires a capital incentive of R 17.5 million during year 0; this total includes all major equipment, plant assessment costs (accounting for 12.5% of the capital expenditure, Capex); building and structure (accounting for 25% of Capex), engineering and construction (accounting for 30% of Capex) as well as other costs such as contingency fees (accounting for 15% of the total initial investment). The required Capex can be solely funded by a financial institution with a pay period of 5 years based on an annual interest rate of 10%.
During year 1, annual operating costs that can be further categorised into fixed costs and variable costs need to be factored in before operations can commence. Fixed operating costs are inclusive of maintenance (labour and materials); operating labour; land rental, laboratory costs; supervision; rates (and any other local taxes), medical and insurance cost. An incentive of approximately R10 million is required during year 1 to accommodate all fixed and variable operating costs. A tax rate and value-added tax (VAT) rate of 28% and 15% respectively are considered for the annual revenues. An annual straight-line depreciation rate is applied over the 15-year plant lifespan. This tally’s up to initial cash injection of R27.5 million required to successfully set up the business. Detailed operating costs, labour costs, revenues, and revenues after-tax projection from year 0 to the end of the project are shown in Table 8.
Figure 4a shows a general increasing trend for all the plotted variables (cumulative cash flow, operating costs, and annual revenue) from year 0 to year 15. A steady increase in the net profit is projected predominantly around year 5; this is due to the business ending its Capex loan repayment period after year 4. The cumulative cash flow can be used to indicate the projected plant life. Revenues are flowing into the business; however, the cumulative cash flow remains negative until the initial investment required to design, build, and start up the plant is paid off. Year 0 to year 4 is classified as the payback period of the project. As a result, the business only breaks even after 5 years due to the high capital investment accompanied by an annual 10% interest on loan repayment. However, due to the availability of raw materials at no cost and the sale of high-value end products, the plant is seen to be highly profitable thereafter. In the literature, [41] highlights that a payback time of 2 to 5 years is expected for projects estimates using cost data [41], thus showing that the obtained results agree with the literature. An average inflation rate of 7.3% for the end-products sale price, operating costs, and raw material prices is factored in annually.
Figure 4b provides the profitability predictions of the project; it shows stabilisation in the accumulated annual revenue and production costs towards the end of the project. This is expected, as a high increase in revenue is realised from year 5 onwards. The net present value (NPV) of money has also been used to determine whether the project is a worthwhile investment, in terms of profit yield and breakeven period. In this regard, Figure 4b shows that the project is worth investing in due to the NPV proceeding from being negative to being positive over the increasing duration of the project; this is also depicted in Table 8. In addition, the NPV curve also indicates the projected plant life, which agrees very well with the plotted plant life curve given in Figure 4a. The return of assets (ROA) curve in Figure 4b is also in agreement with the NPV and shows an increasing trend in Table 8. The project is shown to gradually depreciate over time from year 1 to year 15 at an acceptable rate. This is highly influenced by the scheduled plant maintenance, which will ensure proper plant preservation and the regular servicing of all plant equipment. According to [41], 20% to 30% for the rate of return (ROR) can be used roughly as a guide for evaluating small projects and the higher a project’s return, the more attractive it is [41]. The ROR for this project is projected to be 31.9%, as shown in Table 8; this figure is in strong agreement with the literature, thus confirming that the project is a viable investment that will yield profits and longevity during its projected lifespan.

4. Conclusions

Based on the pyrolysis plant business model and all relevant data collected through literature analysis, site visits as well as telephonic, and personal interviews, the following conclusions can be drawn. (i) The waste tyre plant business model shows that a 3.5 tonne per day plant yields a reasonable payback period of 5 years and a plant life of 15 years is projected. (ii) Further treatment steps are required to improve the process economics by creating valuable products; however, further optimisation studies can be performed with the aim of increasing plant productivity. (iii) For a successful business model, a stable and sustainable product market should exist and be regulated in South Africa. For further work, the authors recommend a detailed analysis of the environmental impact and policy framework on operating pyrolysis plants in South Africa.

Author Contributions

This paper is part of the work presented in the first author’s Master’s dissertation at the University of Johannesburg. N.N. conceptualised the research work presented under the supervision and guidance of E.M., M.B. and B.P. The methodology followed during the compilation of the final work included literature research, site visits, telephonic and personal interviews. A combined effort by N.N. and E.M. was undertaken to validate and authenticate the obtained data. Formal data analysis and interpretation was carried out for the aim of fitting the work within the defined scope of the project. N.N. and E.M. were involved in the writing of the original draft for this work; subsequently, M.B., B.P., and T.A.M. reviewed and edited the final draft submitted. All authors have read and agreed to the published version of the manuscript.

Funding

This research was funded by the University of Johannesburg, The Global Stature 4.0.

Acknowledgments

The Universities of Johannesburg and South Africa and as well as the Botswana International University of Science and Technology.

Conflicts of Interest

The authors declare no conflict of interest.

Nomenclature

C E =   Purchased   equipment   cost   ( US   Dollar )
F T =   Temperature   correction   factor   ( degrees   celsius )
F P =   Pressure   correction   factor   ( atmosphere )
f M =   Material   of   construction   correction   factor
n =   Equipment   type   index
C =   Cost   constant
S =   Size   parameter
C b =   Base   cost   ( US   Dollar )
C 1 =   Base   year   cost   ( US   Dollar )
C 2 =   Recent   year   cost   ( US   Dollar )
Q b =   Equipment   design   value
l Q 1 =   Standard   design   limit
I 1 =   Base   year   index
I 2 =   Recent   year   index

References and Notes

  1. Targets for Diverting Waste Tyres from Landfill Sites, Parliament of the Republic of South Africa. Available online: http://pmg-assets.s3-website-eu-west-1.amazonaws.com/180417Waste_Tyre.pdf (accessed on 14 July 2019).
  2. Burger, S. Creamer Media’s Engineering News. Available online: https://www.engineeringnews.co.za/searchadvanced_en.php?is_id=81&sortOrder=DESC&st=i&searchAll=on&searchStartDate=&searchEndDate=&searchSortBy=sr_date&searchString=false+start+Redisa (accessed on 27 February 2020).
  3. Hartley, F.; Caetano, T.; Daniels, R.C. Economic Benefits of Extended Producer Responsibility Initiatives in South Africa: The Case of Waste Tyres; Springer: Berlin, Germany, 2016. [Google Scholar]
  4. Muzenda, E. A comparative review of waste tyre pyrolysis, gasification and liquefaction (PGL) processes. In Proceedings of the International Conference on Chemical Engineering Advanced Computational Technologies, Pretoria, South Africa, 24–25 November 2014. [Google Scholar]
  5. Rodriguez, E.; Laresgoiti, M.F.; Torres, A.; Chomo’n, M.J.; Caballero, B. Pyrolysis of scrap tyres. Fuel Process. Technol. 2001, 72, 9–22. [Google Scholar] [CrossRef]
  6. Islam, R.M. Innovation in pyrolysis technology for management of scrap tire: A solution of energy and environment. Int. J. Environ. Sci. Dev. 2010, 1, 89–96. [Google Scholar] [CrossRef]
  7. Williams, P.T. Pyrolysis of waste tyres: A review. Waste Manag. 2013, 33, 1714–1728. [Google Scholar] [CrossRef] [Green Version]
  8. Parthasarathy, P.; Choi, H.S.; Park, H.C.; Hwang, J.G.; Yoo, H.S.; Lee, B.K.; Upadhyay, M. Influence of process conditions on product yield of waste tyre pyrolysis-A review. Korean J. Chem. Eng. 2016, 33, 2268–2286. [Google Scholar] [CrossRef] [Green Version]
  9. Laresgoiti, M.F.; Marco, I.; Torres, A.; Caballero, B.; Cabrero, M.A.; Chomo´n, M.J. Chromatographic analysis of the gases obtained in tyre pyrolysis. J. Anal. Appl. Pyrolysis 2000, 55, 43–54. [Google Scholar] [CrossRef]
  10. Cunliffe, A.M.; Williams, P.T. Composition of oils derived from the batch pyrolysis of tyres. J. Anal. Appl. Pyrolysis 1998, 44, 131–152. [Google Scholar] [CrossRef]
  11. Islam, M.R.; Haniu, H.; Beg, M.R.A. Liquid fuels and chemicals from pyrolysis of motorcycle tire waste: Product yields, compositions and related properties. Fuel 2008, 8, 3112–3122. [Google Scholar]
  12. Shah, J.; Jan, M.R.; Mabood, F.; Shahid, M. Conversion of waste tyres into carbon black and their utilization as adsorbent. J. Chin. Chem. Soc. 2006, 53, 1085–1089. [Google Scholar] [CrossRef]
  13. Chimucheka, T. Overview and performance of the SMMEs sector in South Africa. Mediterr. J. Soc. Sci. 2013, 4, 783–795. [Google Scholar] [CrossRef]
  14. Jacob, P.; Kashyap, P.; Suparat, T.; Visvanathan, C. Dealing with emerging waste streams: Used tyre assessment in Thailand using material flow analysis. Waste Manag. Res. 2014, 32, 918–926. [Google Scholar] [CrossRef]
  15. Obi, C. Environmental impact of end of life tyre (ELT) or scrap tyre waste pollution and the need for sustainable waste tyre disposal and transformation mechanism in Nigeria. Nnamdi Azikiwe Univ. J. Int. Law Jurisprud. 2019, 10, 60–70. [Google Scholar]
  16. Neto, G.C.; Chaves, L.E.; Pinto, L.F.; Santana, J.C.; Amorim, M.P.; Rodrigues, M.J. Economic, environmental and social benefits of adoption of pyrolysis process of tires: A feasible and ecofriendly mode to reduce the impacts of scrap tires in Brazil. Sustainability 2019, 11, 2076. [Google Scholar] [CrossRef] [Green Version]
  17. Fortuna, F. Pilot-scale experimental pyrolysis plant: Mechanical and operational aspects. J. Anal. Appl. Pyrolysis 1997, 40, 403–417. [Google Scholar] [CrossRef]
  18. Martínez, J.D. Waste tire pyrolysis–A review. Renew. Sust. Energ. Rev. 2013, 23, 179–213. [Google Scholar] [CrossRef]
  19. Alsaleh, A.; Sattler, M.L. Waste Tire Pyrolysis: Influential Parameters and Product Properties. Curr. Sustain. Renew. Energy Rep. 2014, 1, 129–135. [Google Scholar] [CrossRef] [Green Version]
  20. Bianchi, M.; Bortolabi, G.; Cavazzoni, M.; de Pascale, A.; Montanari, I.; Peretto, A.; Tosi, C.; Vecci, R. Preliminary design and numerical analysis of a scrap tires pyrolysis system. Energy Procedia 2014, 45, 111–120. [Google Scholar] [CrossRef] [Green Version]
  21. Rowhani, A.; Thomas, J. Scrap tyre management pathways and their use as a fuel—A review. Energies 2016, 9, 888. [Google Scholar] [CrossRef]
  22. Czajczyńska, D.; Krzyżyńska, R.; Jouhara, H.; Spencer, N. Use of pyrolytic gas from waste tire as a fuel: A review. Energy 2017, 134, 1121–1131. [Google Scholar]
  23. Roy, C.; Chala, A.; Darmstadt, H. The vacuum pyrolysis of used tires End-uses for oil and carbon black products. J. Anal. Appl. Pyrolysis 1999, 51, 201–221. [Google Scholar] [CrossRef]
  24. Report and Data. Available online: http://www.reportsanddata.com/report-detail/btx-benzene-toluene-and0xylene-matket (accessed on 28 March 2020).
  25. Ahmed, R.; van de Klundert, A.; Lardinois, I. Rubber Waste Options for Small-Scale Resource Recovery in Urban Solid Waste; Waste: Gouda, The Netherlands, 1996. [Google Scholar]
  26. Edward, L.; Danny, C.; Gordon, M. Production of active carbons from waste tyres––A review. Carbon 2004, 42, 2789–2805. [Google Scholar]
  27. Hageman, N.; Spokas, K.; Schmidt, H.T.; Ralf, R.; Böhler, M.A.; Bucheli, T.D. Activated carbon, biochar and charcoal: Linkages and synergies across pyrogenic Carbon’s ABCs. Water 2018, 10, 182. [Google Scholar] [CrossRef] [Green Version]
  28. Li, S.Q.; Yao, Q.; Chi, Y.; Yan, J.H.; Cen, K.F. Pilot-scale pyrolysis of scrap tires in a continuous rotary kiln reactor. Ind. Eng. Chem. Res. 2004, 43, 5133–5145. [Google Scholar] [CrossRef]
  29. California Integrated Waste Management Board. Technology Evaluation and Economic Analysis of Waste Tire Pyrolysis, Gasification, and Liquefaction; University of California Riverside: Riverside, CA, USA, 2006.
  30. Nkosi, N.P. Site Visit at Milvinetix, Rosslyn and Interview with Brandon; Pretoria, South Africa, 2013. [Google Scholar]
  31. IRR Manufacturing. Available online: http://irrmanufacturing.com/pyrolysis/ (accessed on 2 March 2020).
  32. Recor. Available online: https://www.recor.co.za/waste-to-energy-solutions (accessed on 2 March 2020).
  33. Trident Fuels. Available online: http://www.tridentfuels.co.za/ (accessed on 2 March 2020).
  34. American Society for Testing and Material International. ASTM D86-12 in Standard Test Method for Distillation of Petroleum Products at Atmospheric Pressure; ASTM International: West Conshohocken, PA, USA, 1996. [Google Scholar]
  35. Li, D.; Zhen, H.; Xingcai, L.; Wu-gao, Z.; Jian-guang, Y. Physico-chemical properties of ethanol–diesel blend fuel and its effect on performance and emissions of diesel engines. Renew. Ener. 2005, 30, 967–976. [Google Scholar] [CrossRef]
  36. Nkosi, N.P. Site Visit and Telephonic Interview with Pace Oil Personnel: Justice; 2013. [Google Scholar]
  37. American Society for Testing and Material International. International Designation Index, Rubber Standards, in D5900–13, Standard Specification for Physical and Chemical Properties of Industry Reference Materials (IRM); ASTM International: West Conshohocken, PA, USA, 1996. [Google Scholar]
  38. SGS Pyrolysis Diesel Oil Analysis Report; SGS: Randburg, Johannesburg, South Africa, 2012.
  39. Wear Check Diesel Analysis Report; Wear Check: Isando, Johannesburg, South Africa, 2012.
  40. Coal and Minerals Laboratory. Carbon Black Sample; Council of Science and Industrial Research: Lynwood, Pretoria, South Africa, 2012. [Google Scholar]
  41. Sinnott, R.K. Costing and project evaluation. In Chemical Engineering Design, Coulson & Richardson’s Chemical Engineering, 4th ed.; Elsevier Butterworth-Heinemann: London, UK, 2005; Volume 6, pp. 243–280. [Google Scholar]
  42. Silla, H. Production and capital cost estimation. In Chemical Process Engineering: Design and Economics; Heinemann, H., Ed.; Marcel Dekker, Inc.: New York, NY, USA, 2003. [Google Scholar]
  43. Oyedun, A.; Lam, K.L.; Fittkau, M.; Hui, C.W. Optimisation of particle size in waste tyre pyrolysis. Fuel 2012, 96, 417–424. [Google Scholar] [CrossRef]
  44. Murillo, R.; Aranda, A.; Aylo´n, E.; Calle´n, M.S.; Mastral, A.N. Process for the separation of gas products from waste tire pyrolysis. Ind. Eng. Chem. Res. 2006, 45, 1734–1738. [Google Scholar]
  45. Schrenk, H.H.; Berger, L.B. Composition of Diesel Engine Exhaust Gas. Am. J. Public Health Nations Health 1941, 31, 669–681. [Google Scholar] [CrossRef]
  46. Weil, E.D.; Sandler, R. Kirk-Othmer Concise Encyclopedia of Chemical Technology, 4th ed.; John Wiley & Sons: New York, NY, USA, 1999. [Google Scholar]
Figure 1. Process flow diagram.
Processes 08 00766 g001
Figure 2. Temperature correction factor: two shell passes, four or multiples of four tube passes [41].
Processes 08 00766 g002
Figure 3. Pyrolysis process piping and instrumentation diagram.
Processes 08 00766 g003
Figure 4. Project cost evaluation: (a) Cumulative cash flow, revenues and operating costs projections; (b) Net present value, return of assets, and depreciation rate projection.
Processes 08 00766 g004
Table 1. Pyrolysis oil specifications.
Test DescriptionTest Method [34]Specification [34]Milvinetix [38]Pace Oil [39]
Density @20 °C, kg/LASTM D40520.800 min0.8950.8772
Viscosity @40 °C, cStASTM D4452.2–5.32.8682.1
Flash point, °CASTM D9355 min˂2526
Water Content, ppmASTM 6304500 max673600
Sulphur content, ppmASTM 6304500 max810012,400
Total Contamination number, mg/kgASTM 630424 max3138.6
Distillation °C: 90% Recovery, °CASTM D 86362 max378.8360
Micro Carbon ResidueASTM D45300.2 max4.52
Cetane IndexASTM D473751 min32.0134.2
Table 2. Pyrolysis carbon black specifications.
Test DescriptionTest Method [37]Milvinetix [40]ASTM Test Method (ASTM, 1996)
Calorific ValueSANS 1928:200931.18 MJ/kg
Moisture ContentSANS 15325:20071.30%
Ash contentISO 1171:201014.50%0.5% Max
Volatile Matter ContentISO 582:201024.30%0.3% Max
Fixed CarbonBy difference59.90%
Total SulphurASTM 4239:20102.61%
Table 3. Temperature (FT), pressure (Fp), and material of construction correction factor (FM) [42].
Design Pressure, (atm)Correction Factor
0.0051.3
0.0141.2
0.0481.1
0.54 to 6.81.0
481.1
2041.2
4081.3
Design Temp, °CCorrection Factor
−801.3
01.0
1001.05
6001.1
50001.2
10001.4
Material of ConstructionCorrection Factor
Carbon steel (mild)1.0
Bronze1.05
Carbon/molybdenum1.065
Steel
Aluminium1.075
Cast steel1.11
Stainless steel1.28 to 1.5
Worthite alloy1.41
Hastelloy C alloy1.54
Monel alloy1.65
Titanium2.0
Table 5. Pyrolysis mass and energy balances.
StreamDescriptionMass Flow (kg/hour)Process Conditions (Temperature and Pressure)Volume Flow (m3/hour)Energy, Qin (MJ/s)Energy, Qout (MJ/s)
1Tyres145.3125 °C 87 kPa 1.29
2 + 8Steel wire21.7925 °C, 87 kPa
3Tyre chips130.7825 °C, 87 kPa 1.161.16
5Pyrolysis gas72.66550 °C, 300 kPa [44]90.830.50.5
9Carbon black50.8625 °C, 87 kPa 0.40.4
12Flue gas0.727150 °C, 200 kPa0.91
18Uncondensed pyrolysis gas7.27105 °C, 200 kPa9.10 0.0076
24Pyrolysis oil65.39350 °C, 350 kPa0.074 0.73
26Residual oils18.0840 °C, 200 kPa0.02 0.2
29Distillate oils47.3140 °C, 200 kPa0.054 0.53
Table 6. Total plant power and energy requirement.
Energy TypeAmount Unit
Heating121.05kW
Mechanical151.79kW
Cooling10.5kW
Electrical81.75kW
Available fuel139.56kW
Energy efficiency0.8
Total supply317.53kW
Yearly energy requirements1,846,957.70kWhr/year
Table 7. Pyrolysis plant process assumptions, inputs, and costs.
VariableUnitValue
Weight of rimless tyreKg7.75
Single tyre gate feeR/tyre13
Operating hoursDays/year302.95
Plant shut down timeDays/year62.05
Operating shiftsPer day3
Loading cyclesPer shift3
Treated tyreston/day3.5
Annual working hourshour/year8760
Downtimehour/year1489.2
Plant operating timehour/year7270.8
Actual plant capacityton/hour1056.54
Available plant capacityton/hour1272.94
Actual annual productionton/hour1056.5
Process input costs
Electrical energyR/kWh1.18
WaterR/L0.029
NaOH (scrubber reagent)R/tonR9550.00
NitrogenR/13 kgR485.79
Table 8. Annual project profitability projections.
YearAnnual Cash Flow (×106)Revenues After Tax (×106)Cumulative Cash Flow (×106)Operating and Labour Costs (×106)Revenues (×106)NPV (×106)Depreciation (×106)Depreciation %ROAROR %
0−R17.49R0.00R0.00R0.00R0.00R0.00R0.000R0.0031.91
1−R28.93R13.96−R14.96R15.88R19.39−R13.60R2.190.125R2.19
2−R26.40R14.90−R11.50R16.55R20.70−R9.51R2.040.117R2.04
3−R23.36R15.90−R7.46R17.88R22.08−R5.61R1.890.108R1.89
4−R20.14R16.61−R3.53R19.83R23.06−R2.41R1.750.100R1.75
5R13.93R17.74R0.28R20.76R24.64R0.18R1.600.092R1.60
6R14.86R18.45R3.88R22.20R25.63R2.19R1.460.083R1.46
7R15.91R19.02R6.99R23.95R26.42R3.59R1.310.075R1.31
8R17.10R20.30R10.19R25.51R28.19R4.75R1.170.067R1.17
9R17.88R21.29R13.59R27.42R29.57R5.76R1.020.058R1.02
10R18.94R22.00R16.65R29.74R30.55R6.42R0.870.050R0.87
11R20.23R22.49R18.91R31.10R31.24R6.63R0.730.042R0.73
12R20.92R23.19R21.18R31.41R32.20R6.75R0.580.033R0.58
13R21.12R24.30R24.36R32.04R33.75R7.06R0.440.025R0.44
14R21.50R25.13R28.00R33.00R34.90R7.37R0.290.017R0.29
15R22.09R25.96R31.87R34.32R36.06R7.63R0.150.008R0.15
Table 4. Plant major equipment cost.
DescriptionCostCommentsCosting Reference
Pre-Pyrolysis
1.1Magnetic separatorR60,976.801.1 kW motor, 550 kg[Quote]
1.2Tyre shreddingR315,900.0060–80 tyres per hour, 15 hp[Quote]
1.3weighing systemR10,649.88SABS approved, with readout screen[Quote]
Total R387,526.68
Pyrolysis
2.1Reaction chamberR1,635,822.26D2.8 m, L6 m, 15 KW, 380 V, struc steel[42]
2.2Heat exchangerR475,422.06CS tubes, TEMA B std, 16.88 KW[41]
2.3Heat exchangerR394,254.99CS tubes, TEMA B standards[41]
2.4ReboilerR405,998.85High carbon steel[41]
2.5CondenserR596,748.87Mild carbon steel[41]
2.6Storage tanksR206,162.66Steel fuel tank and plastic water tank[41]
2.7Cooling towerR1,125,640.00Stainless steel/galvanised steel
2.8PumpsR207,777.26Carbon steel[42]
2.9Instrumentation and controlsR2,058,487.70 [41]
2.10Interconnecting pipes and valvesR230,216.33 [41]
TotalR7,336,530.97
Post -Pyrolysis
3.1Distillation columnR335,142.20Carbon steel/stainless steel[41]
3.2Column platesR149,795.00Plate (bubble cap)[41]
3.3Micro ball millR839,878.00Stainless steel[Quote]
3.4Gas scrubberR685,844.00Carbon steel/stainless steel[41]
TotalR2,010,659.2
Total equipmentR9,734,716.85