The Effects of pH Change through Liming on Soil N2O Emissions

 ,
, 

 ,
,
Abstract
1. Introduction
2. Materials and Methods
2.1. Soil and Liming Materials
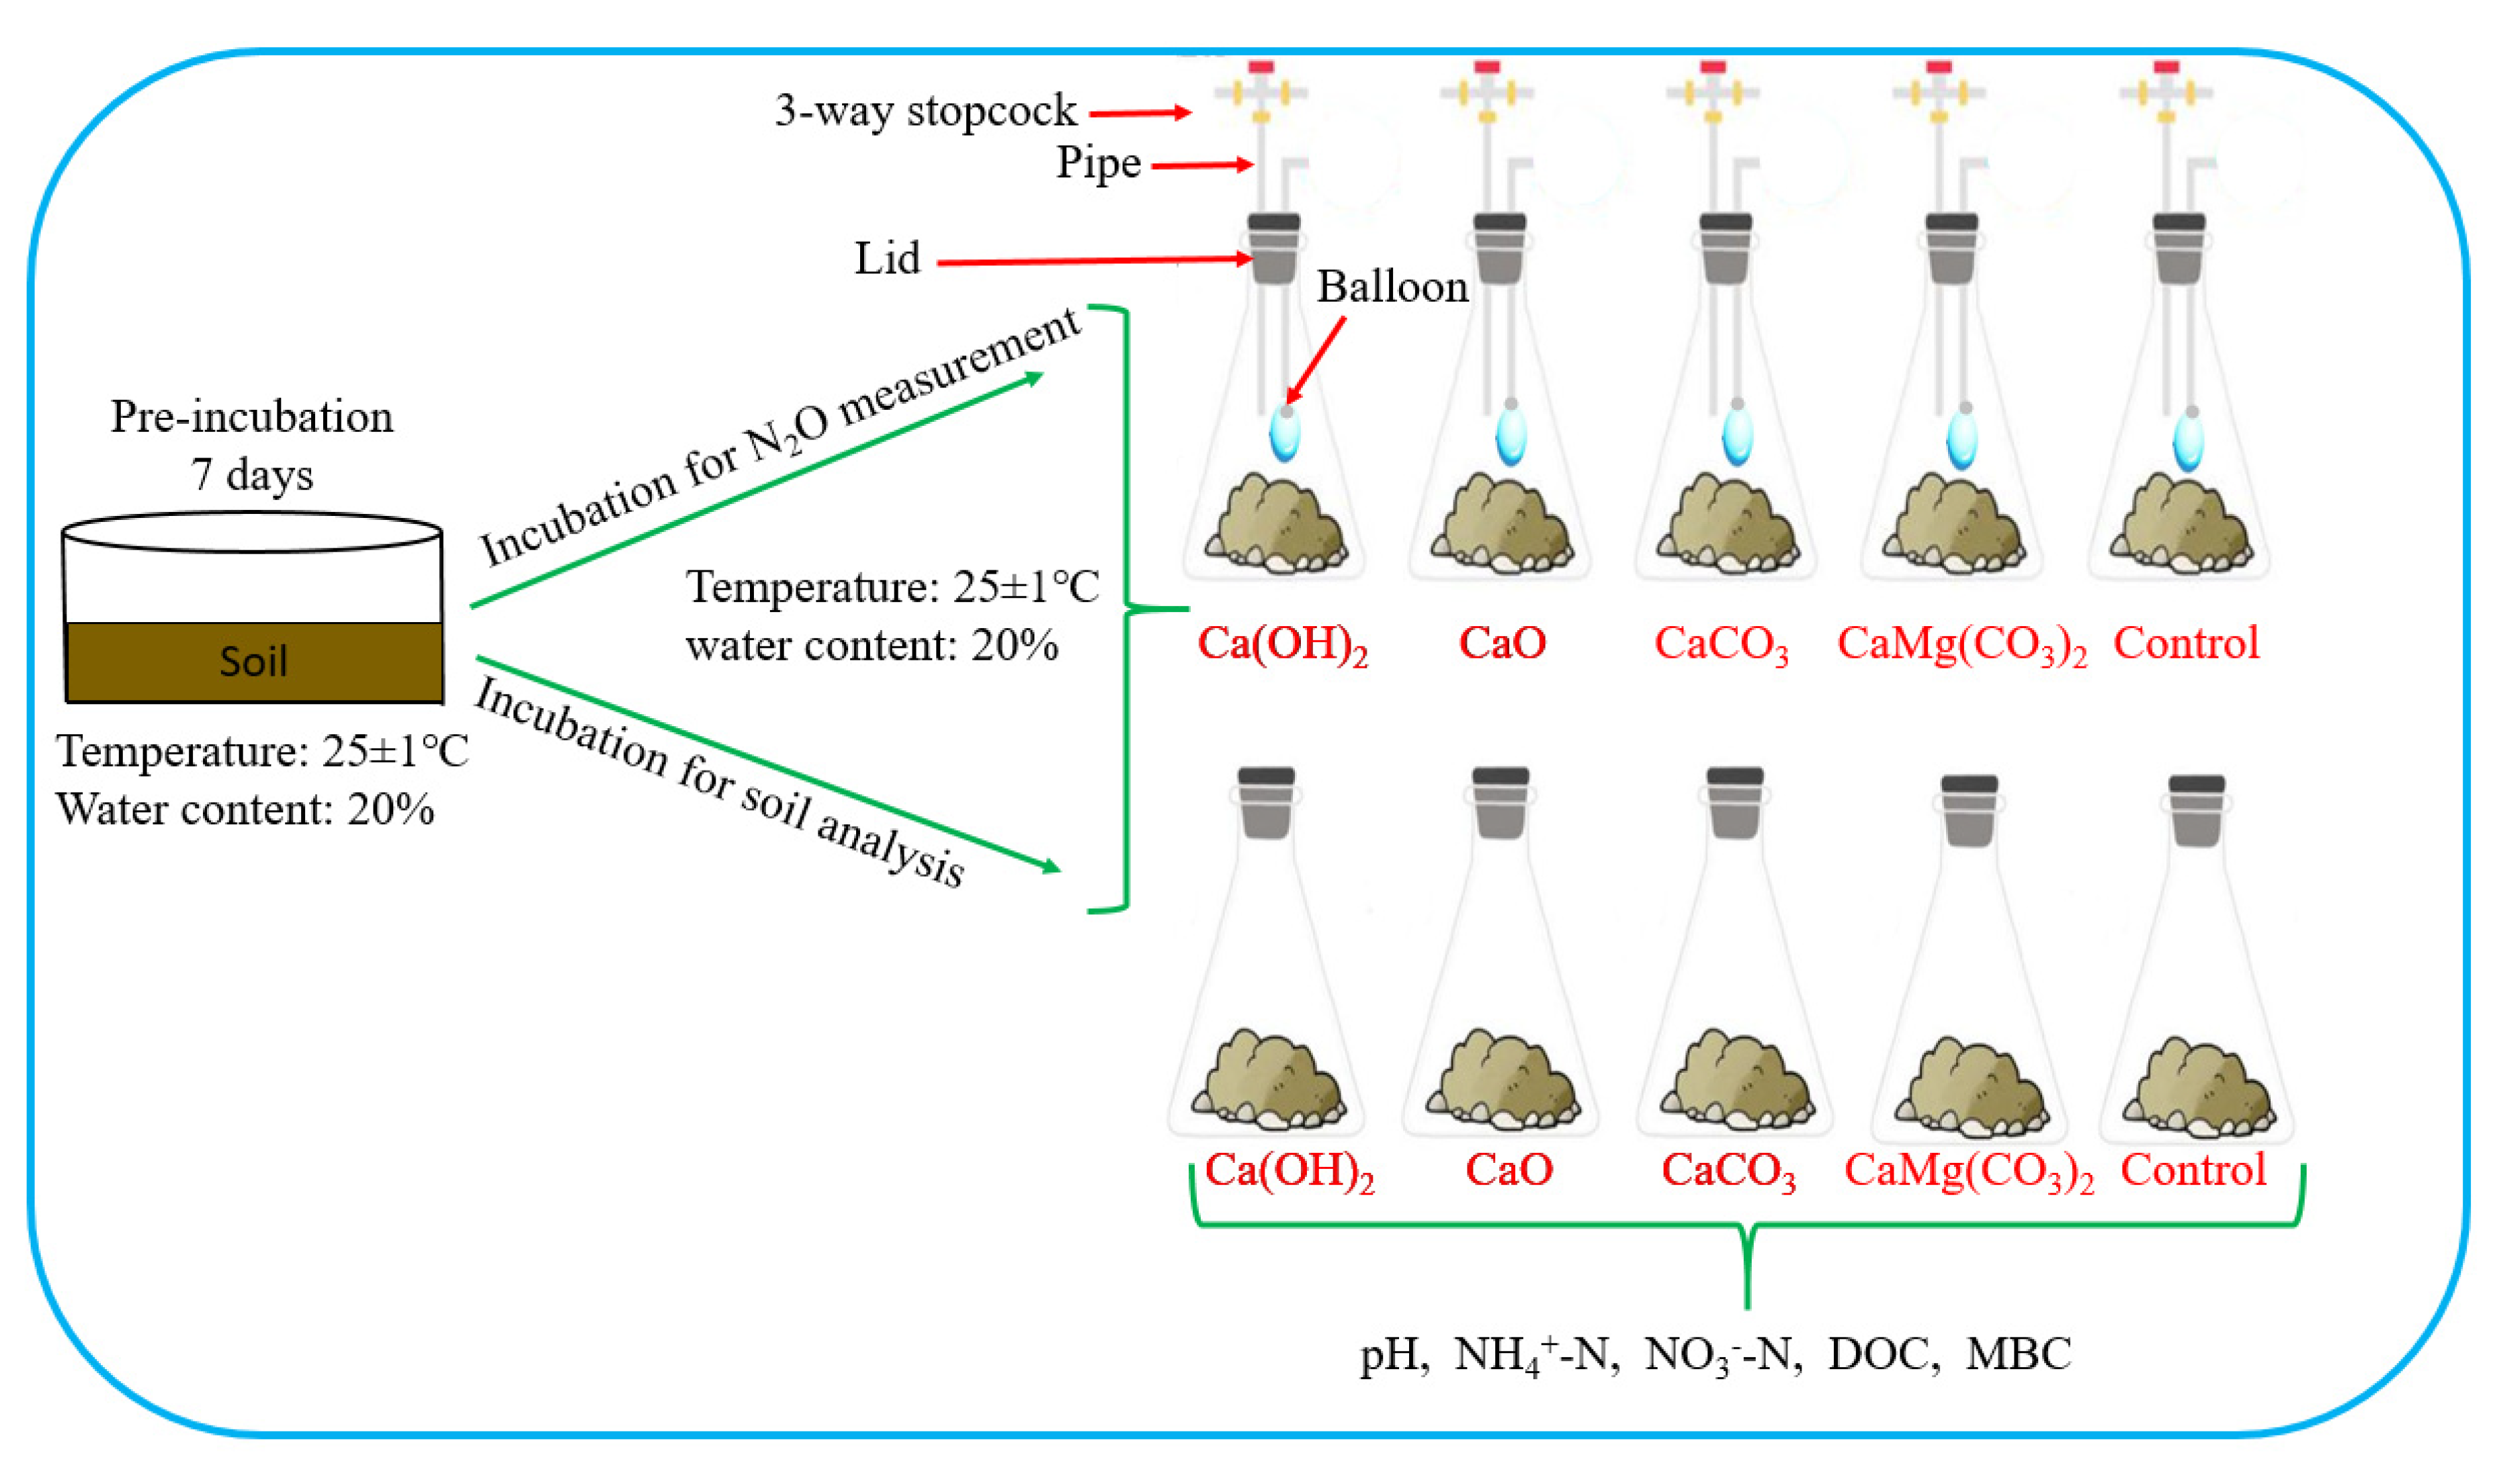
2.2. Experimental Setup for Collection and Analysis of N2O
2.3. Experimental Setup for Soil Analysis
2.4. Data Analysis
3. Results
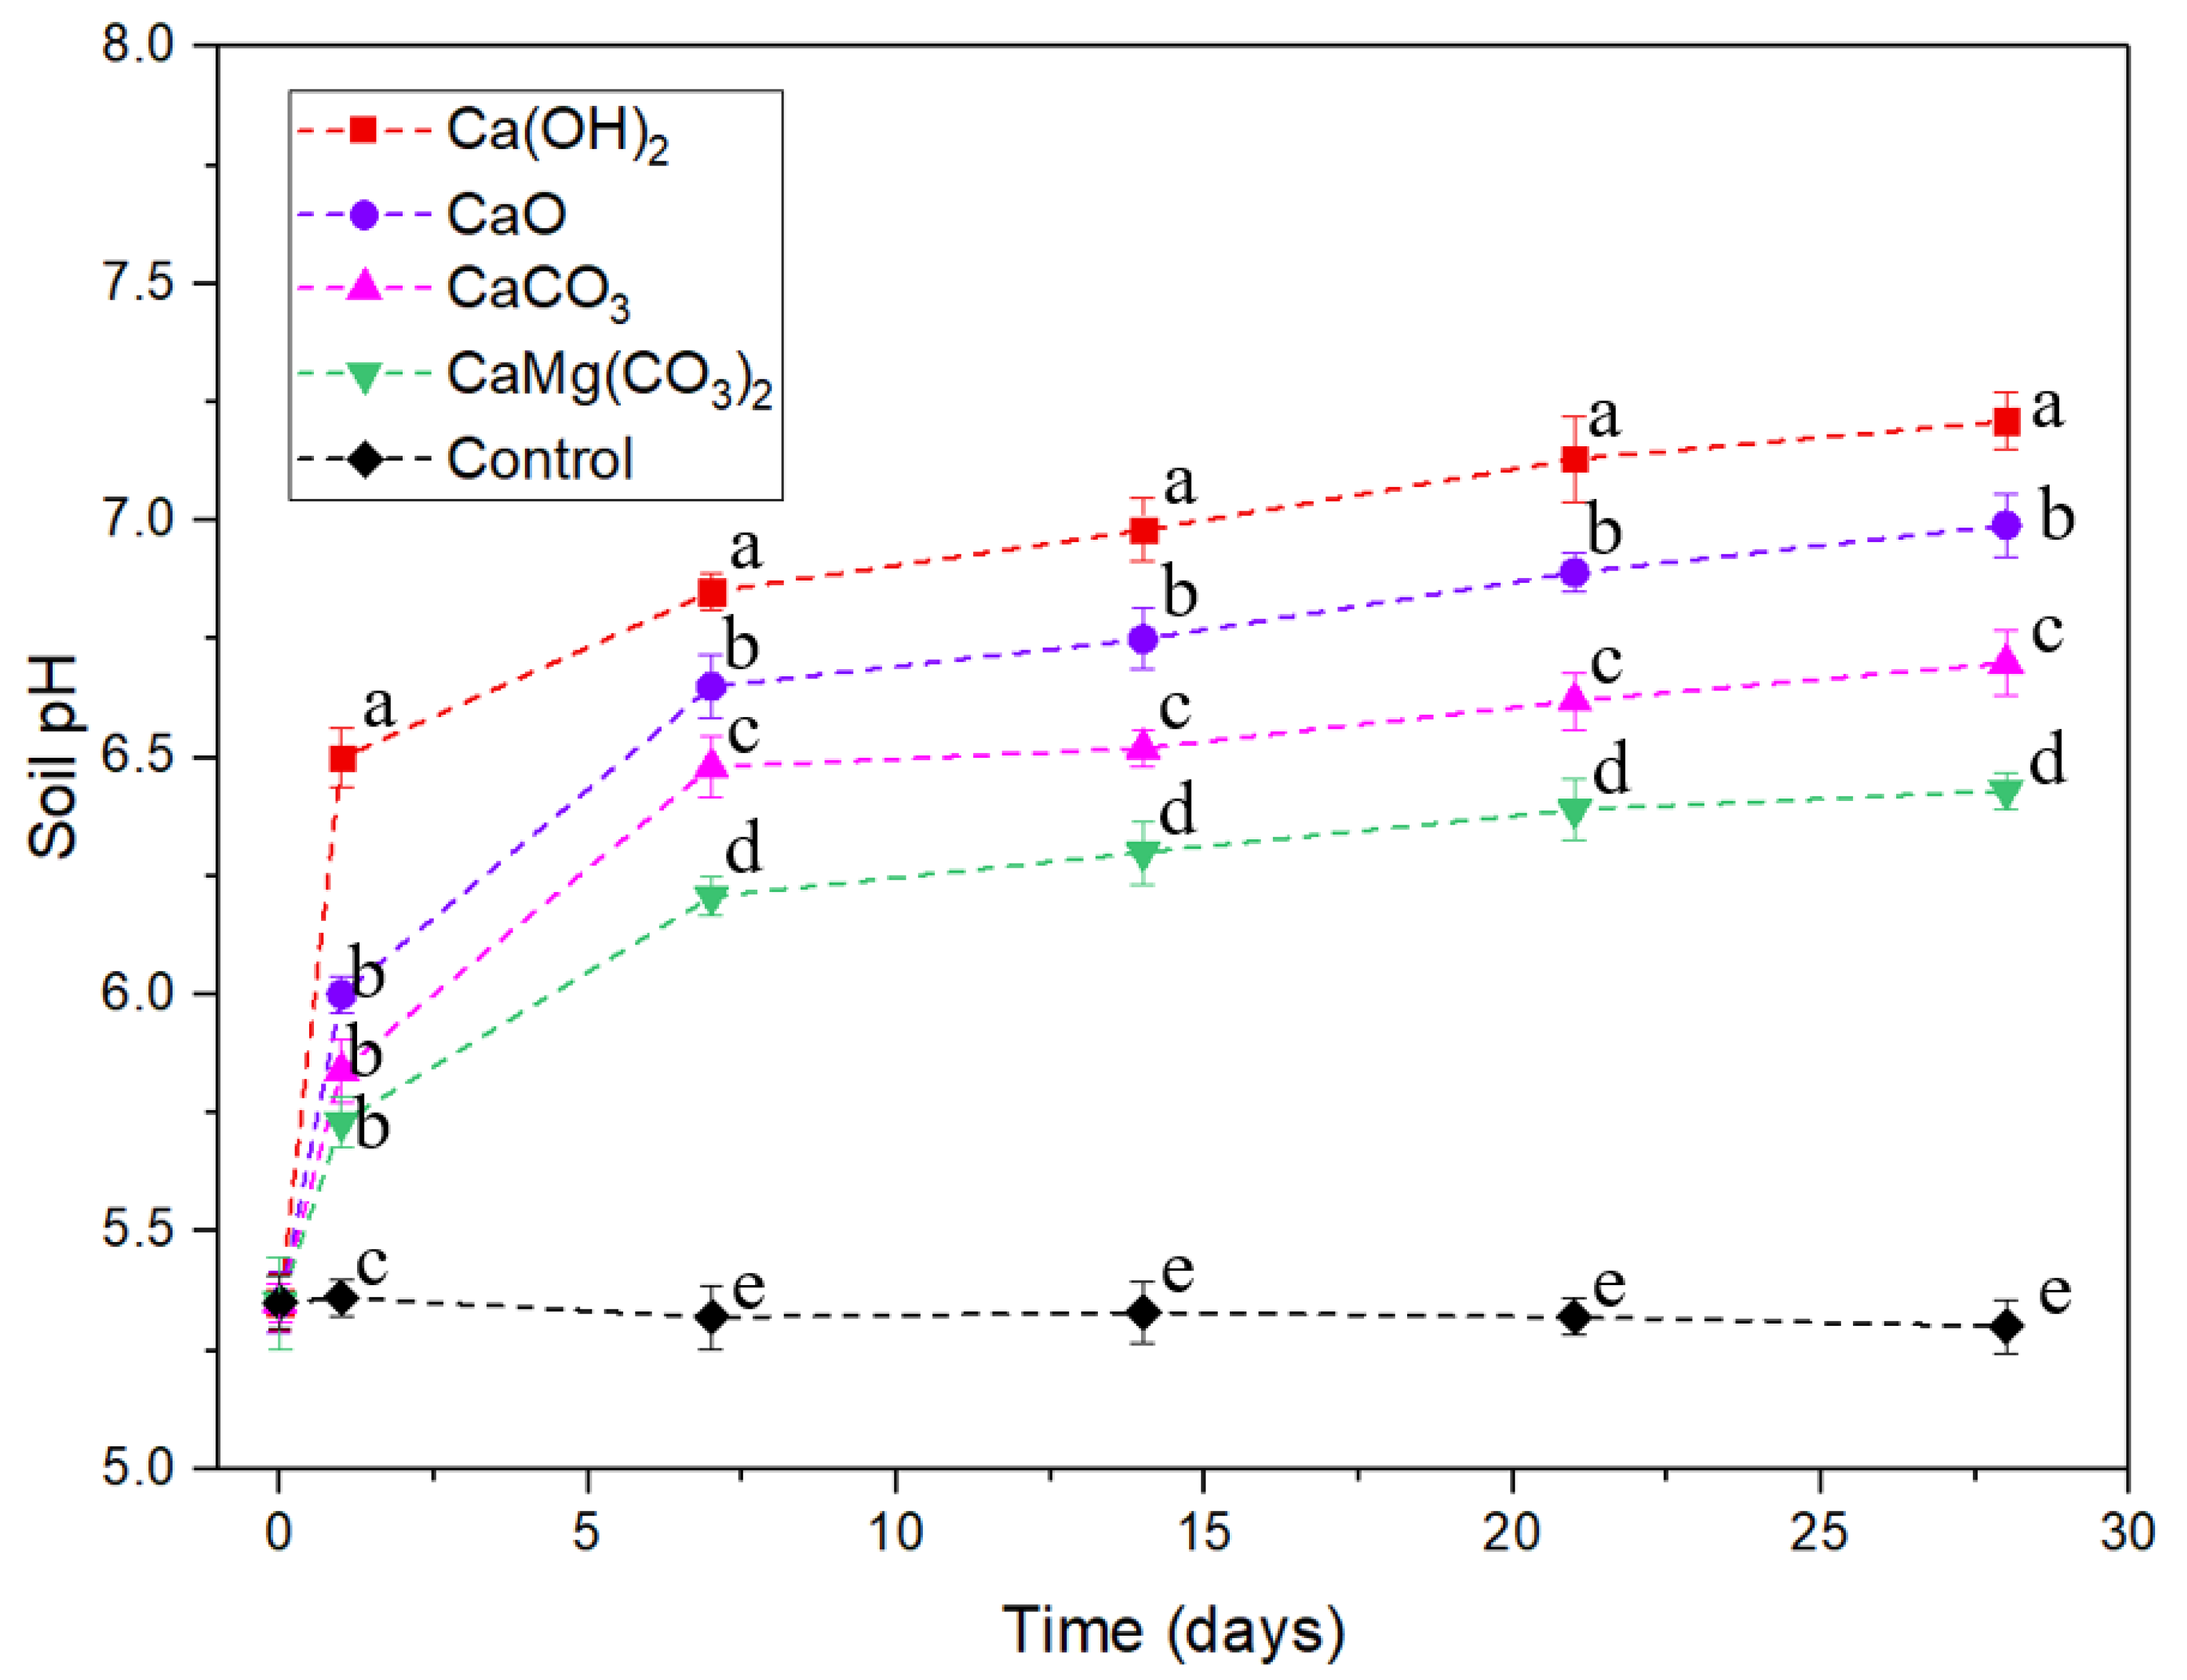
3.1. Soil pH
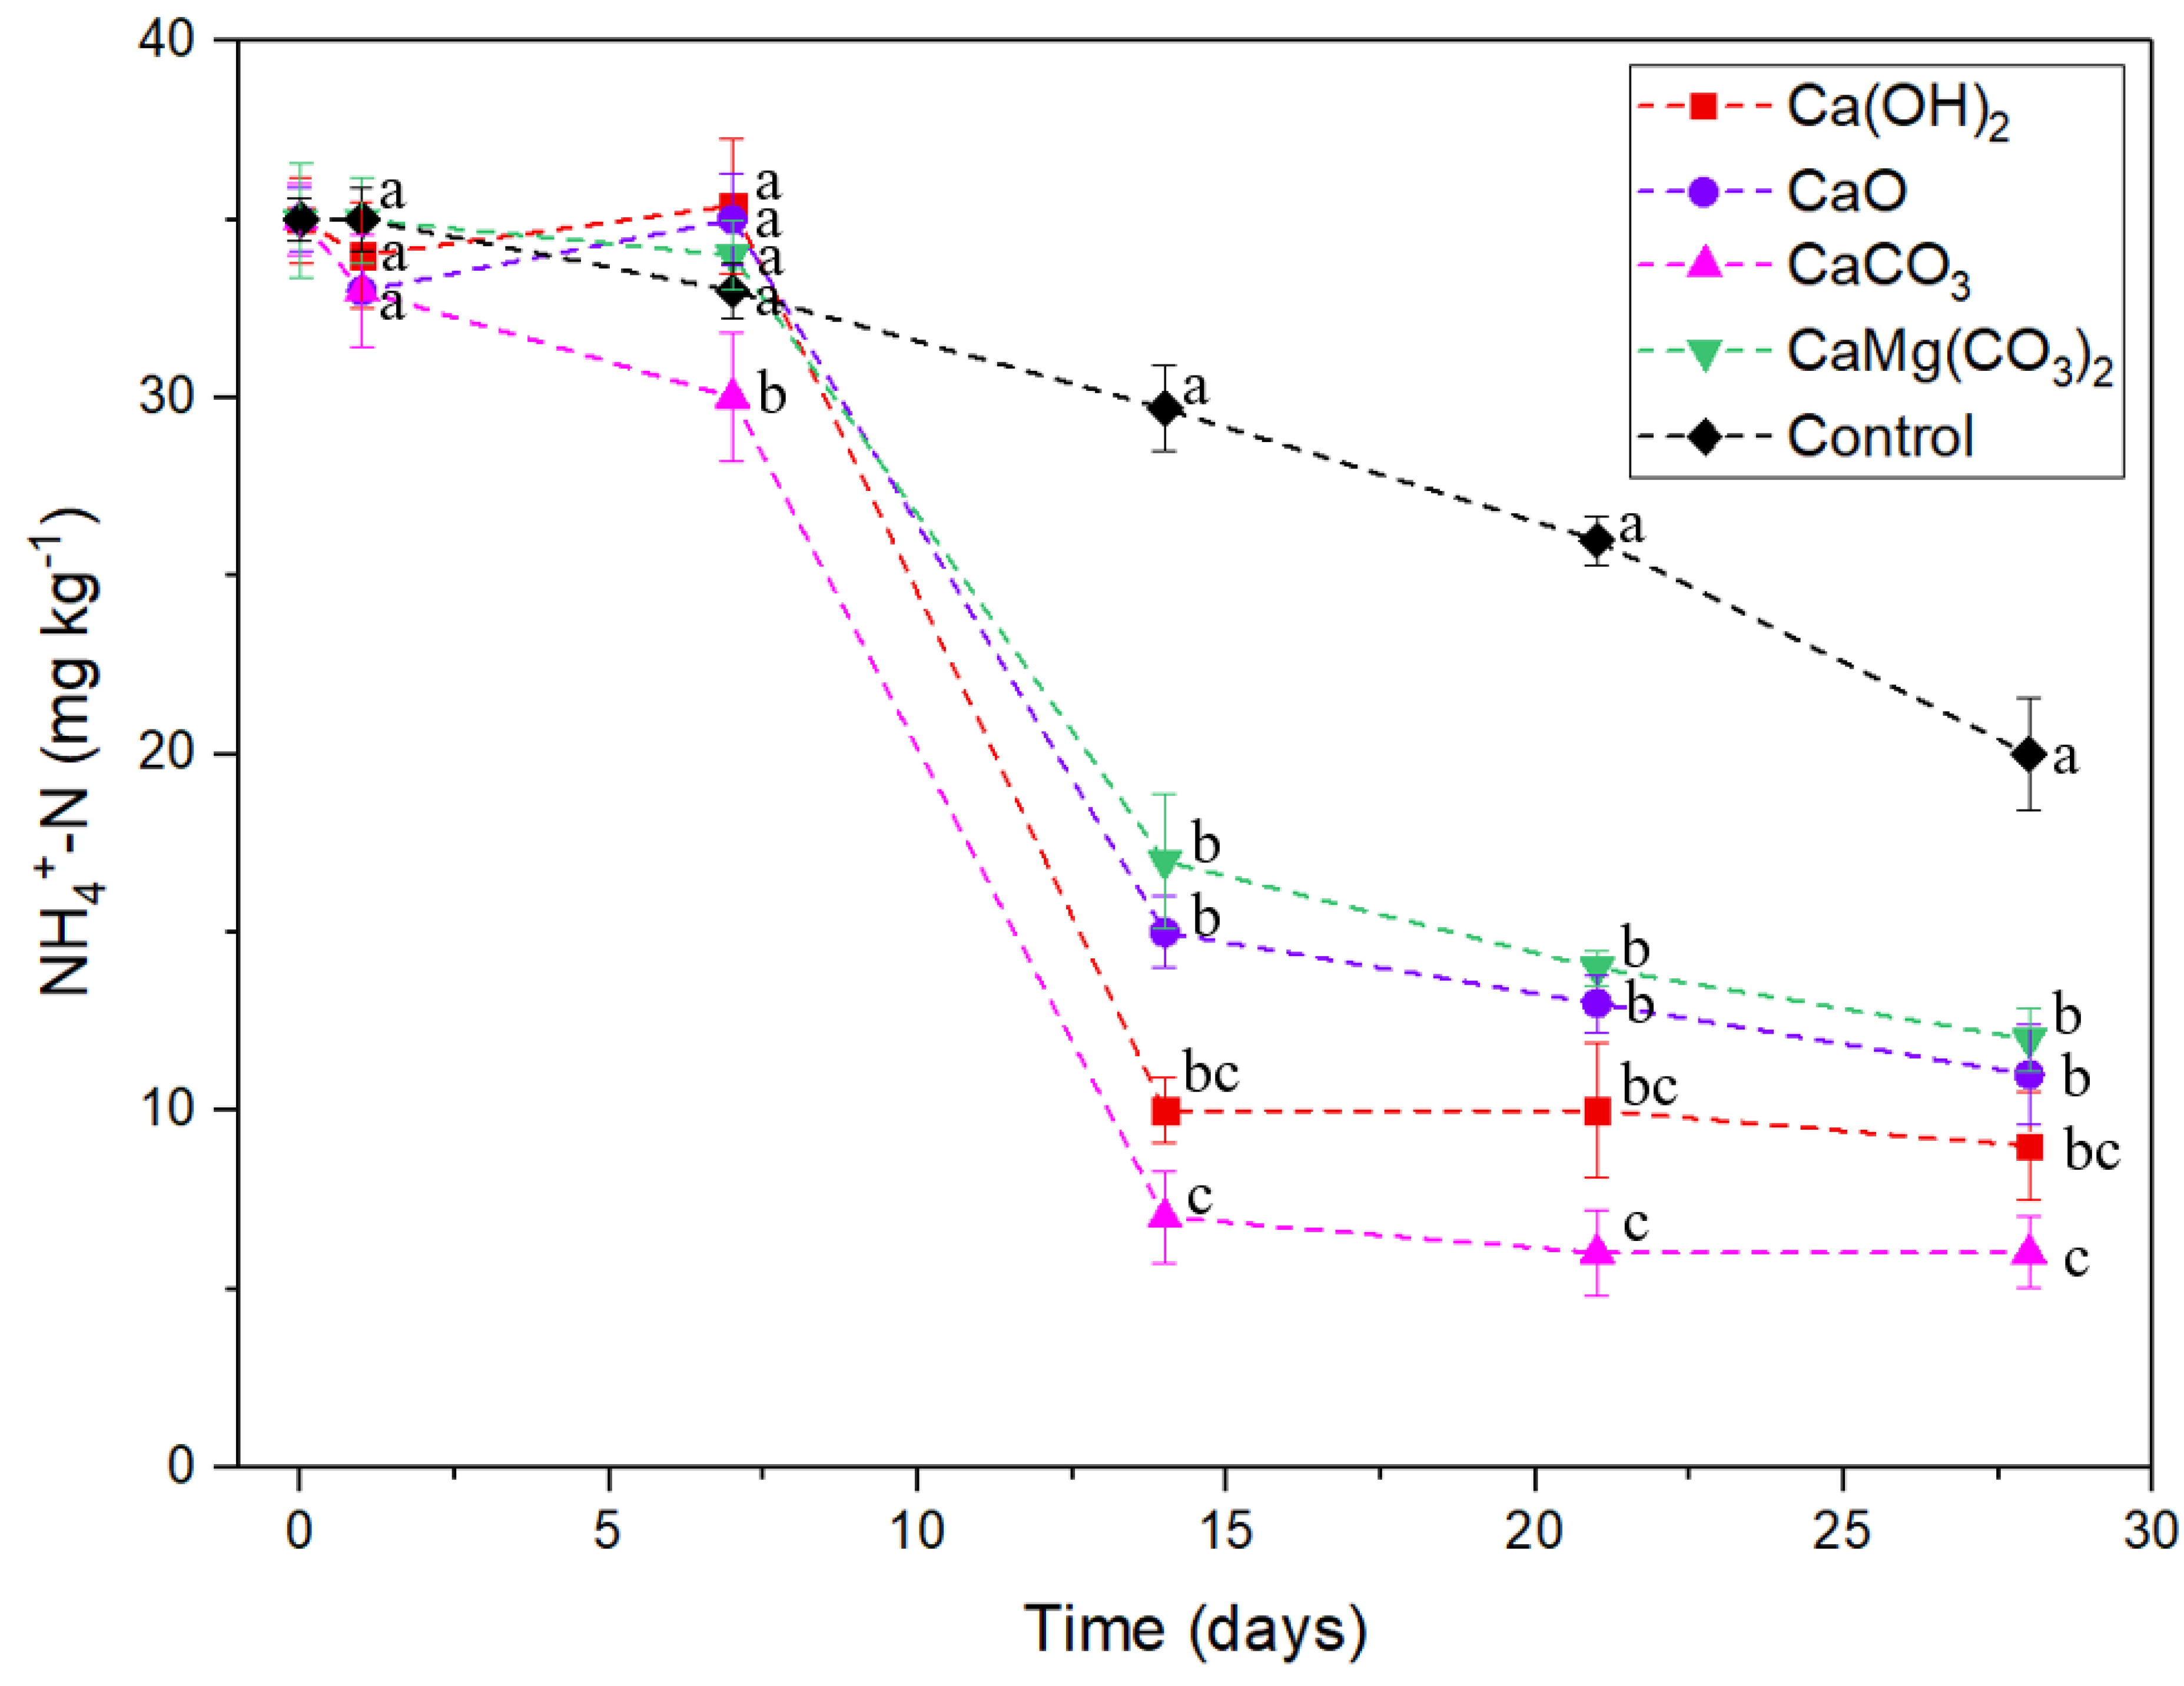
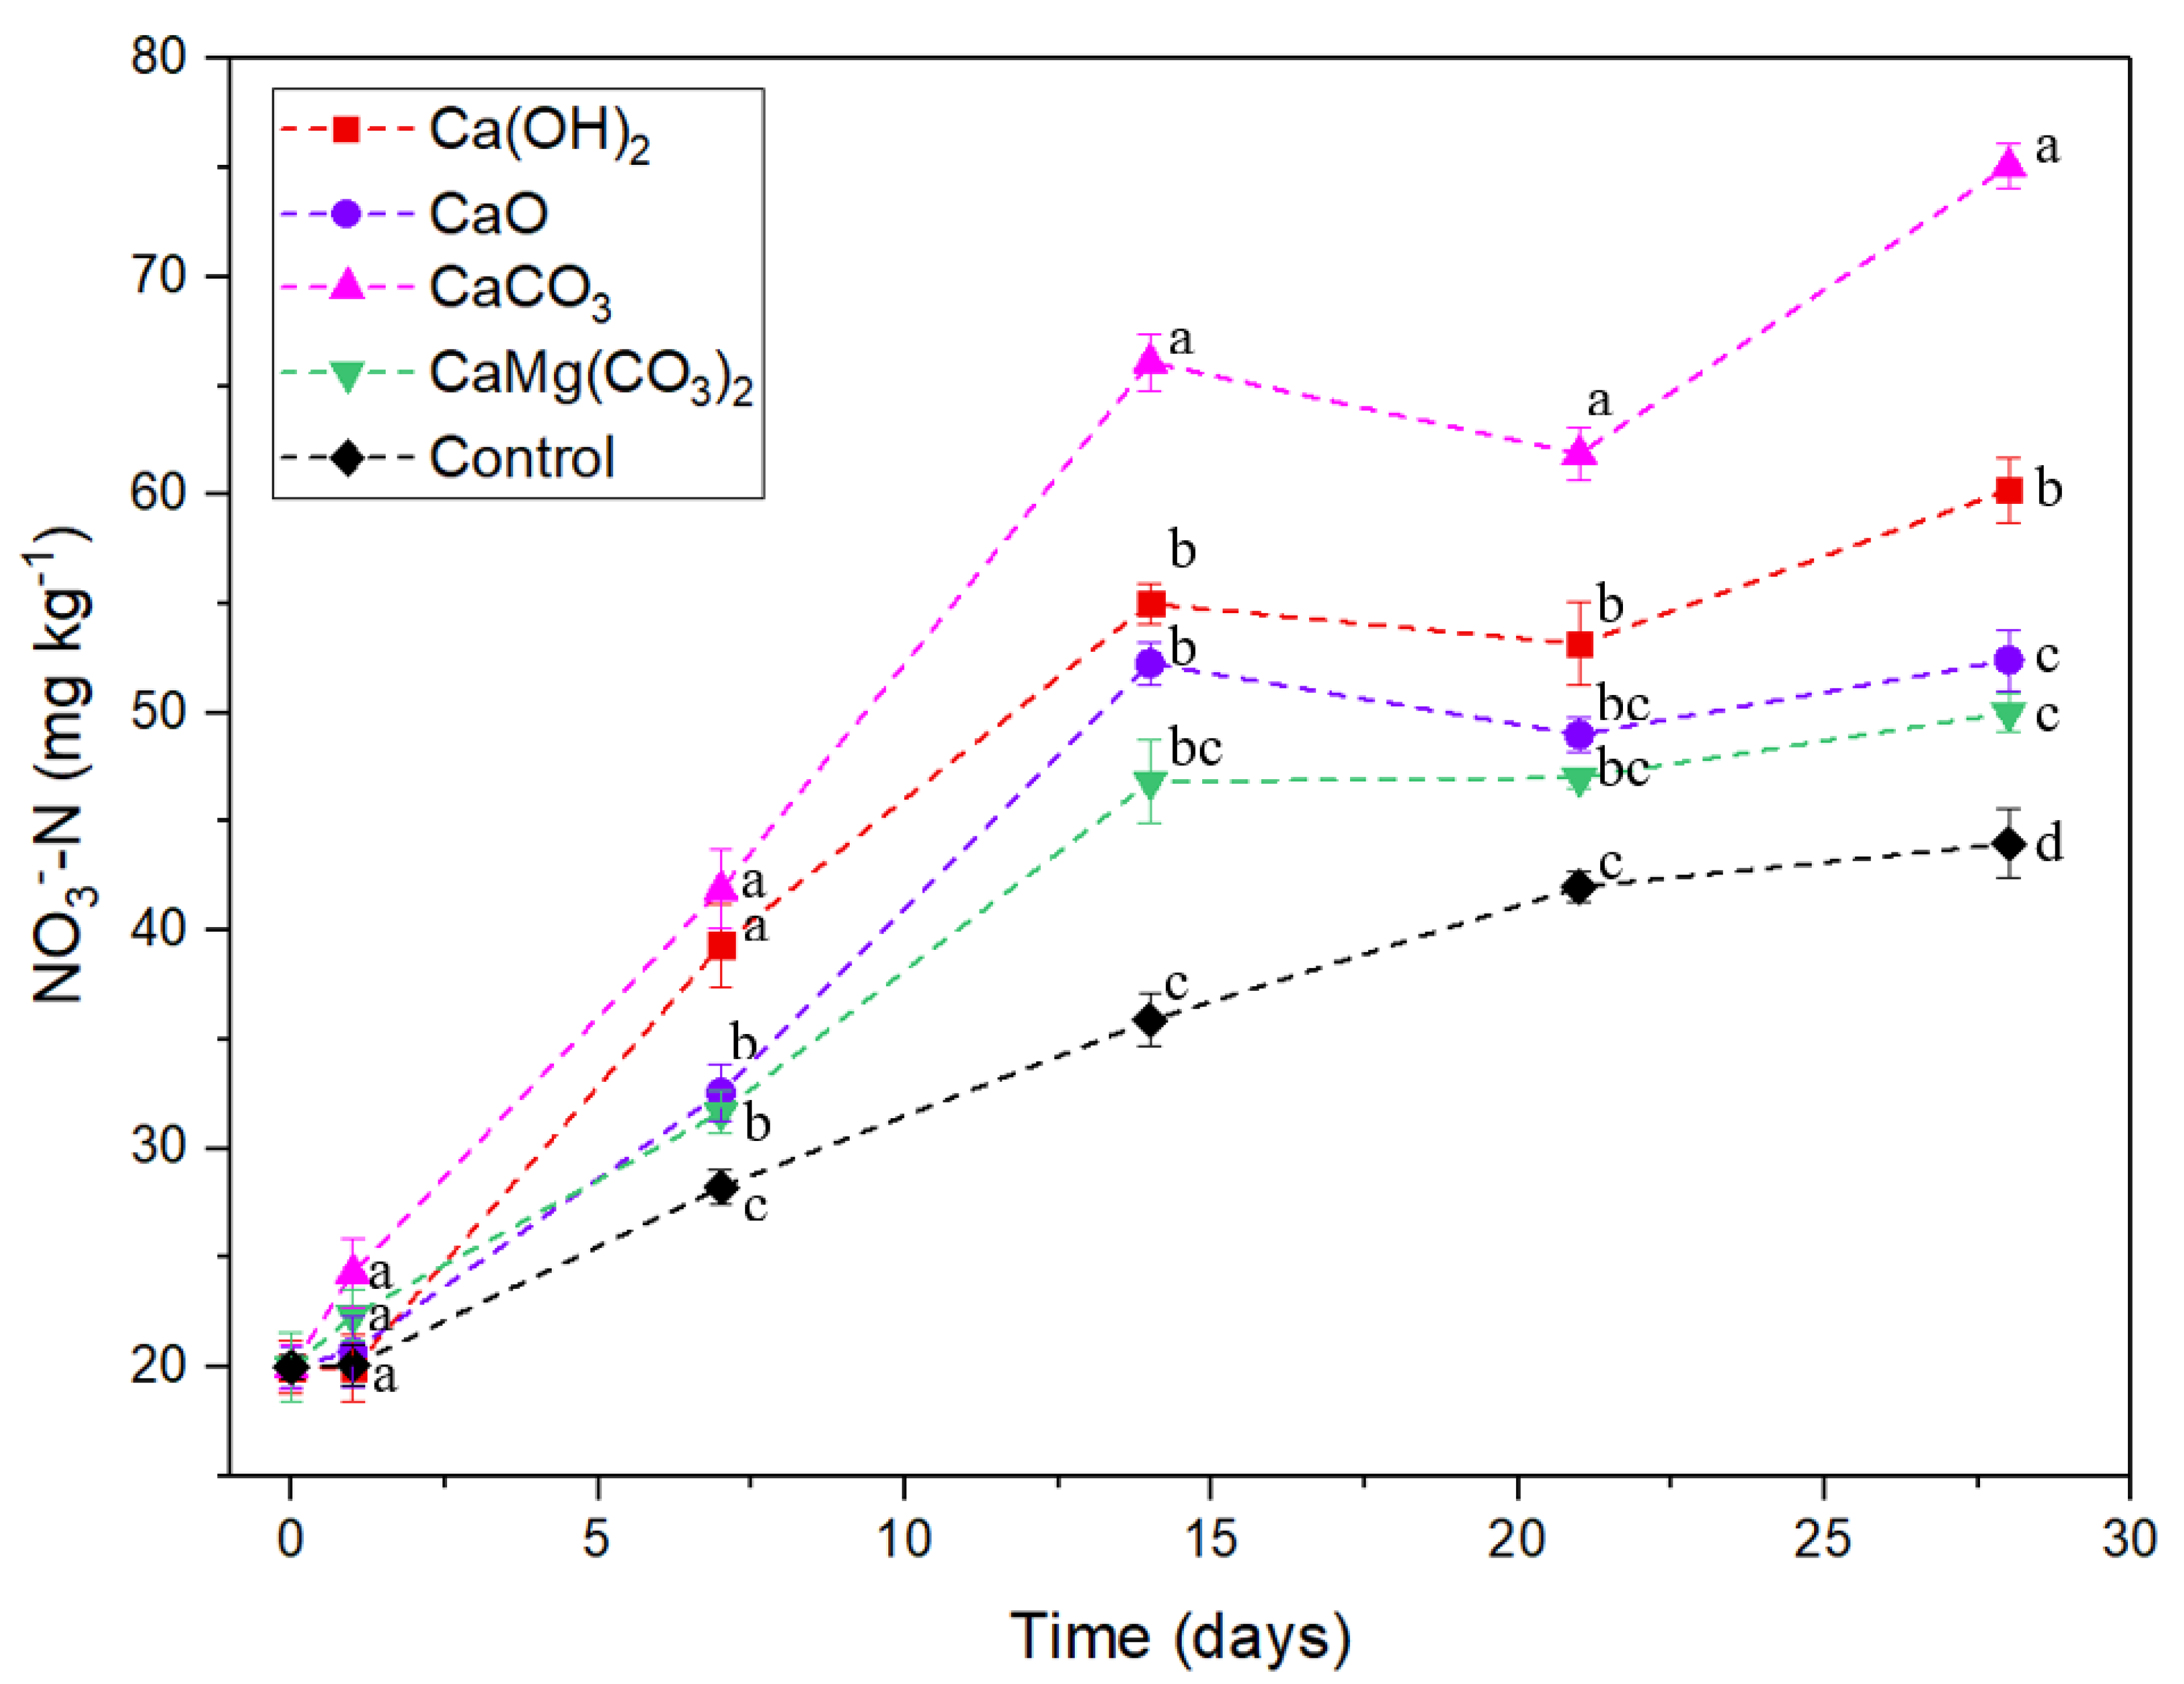
3.2. Soil Mineral–N (NH4+–N and NO3−–N)
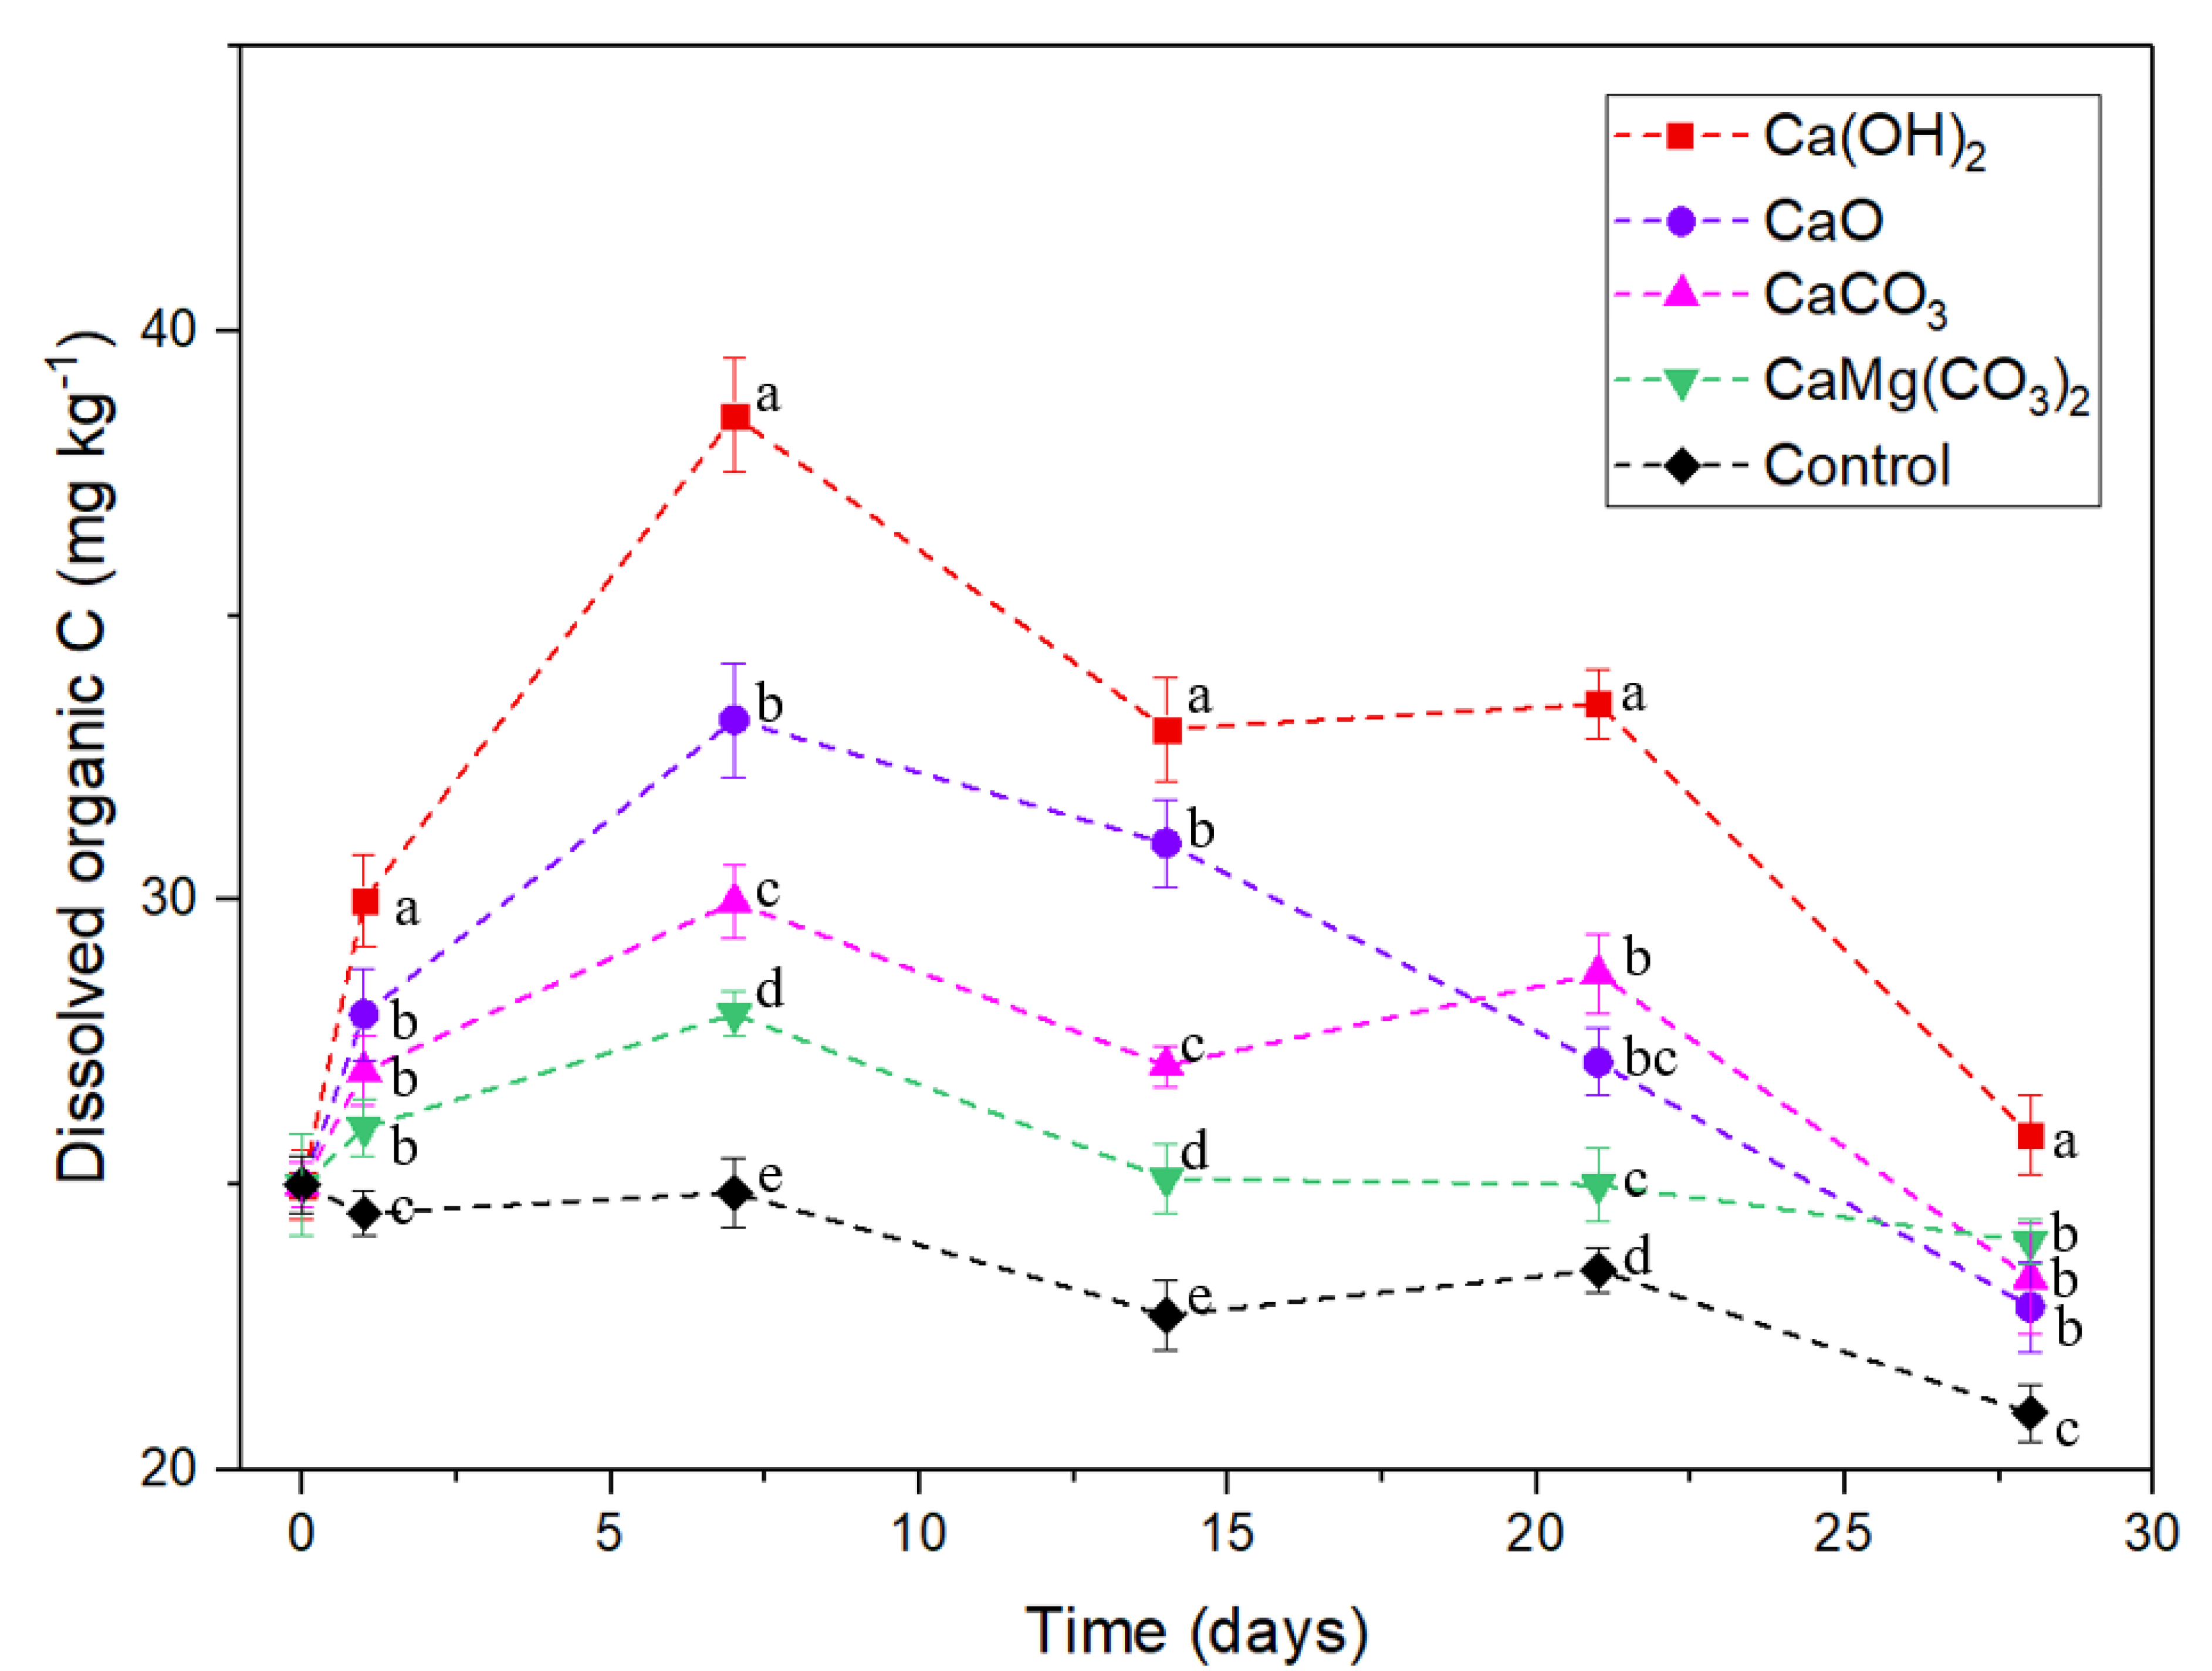
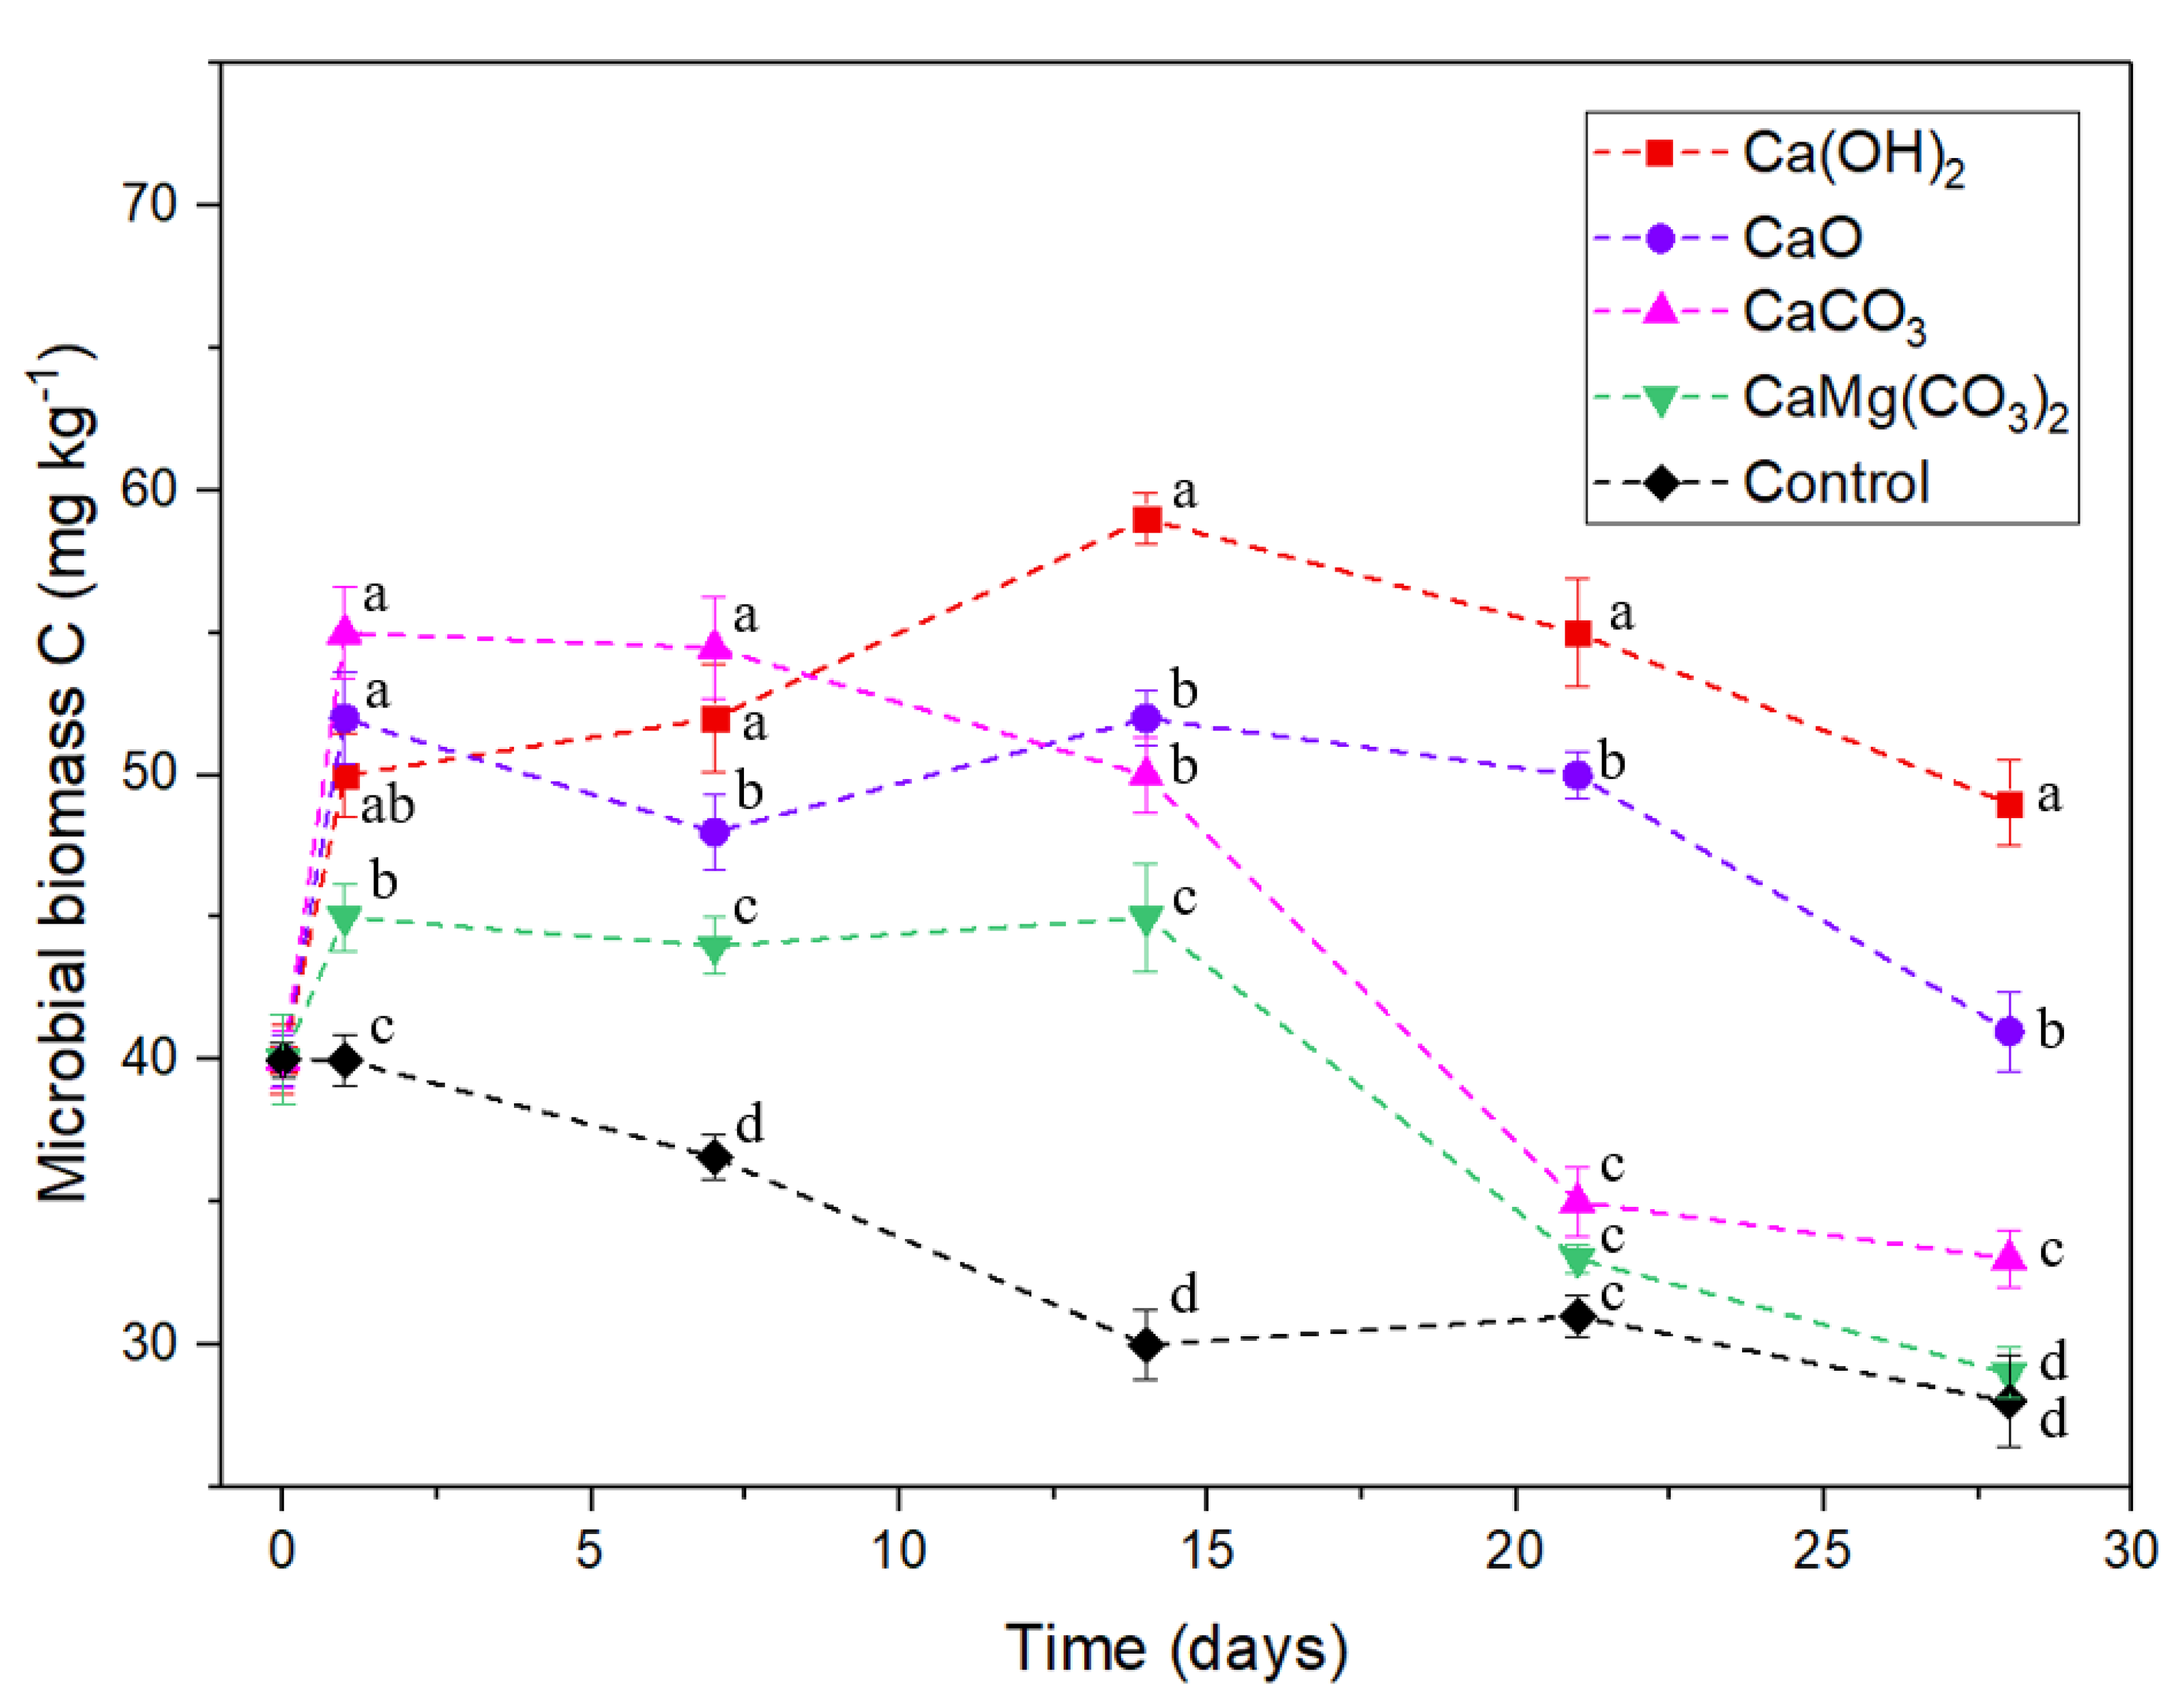
3.3. Dissolved Organic C and Microbial Biomass C
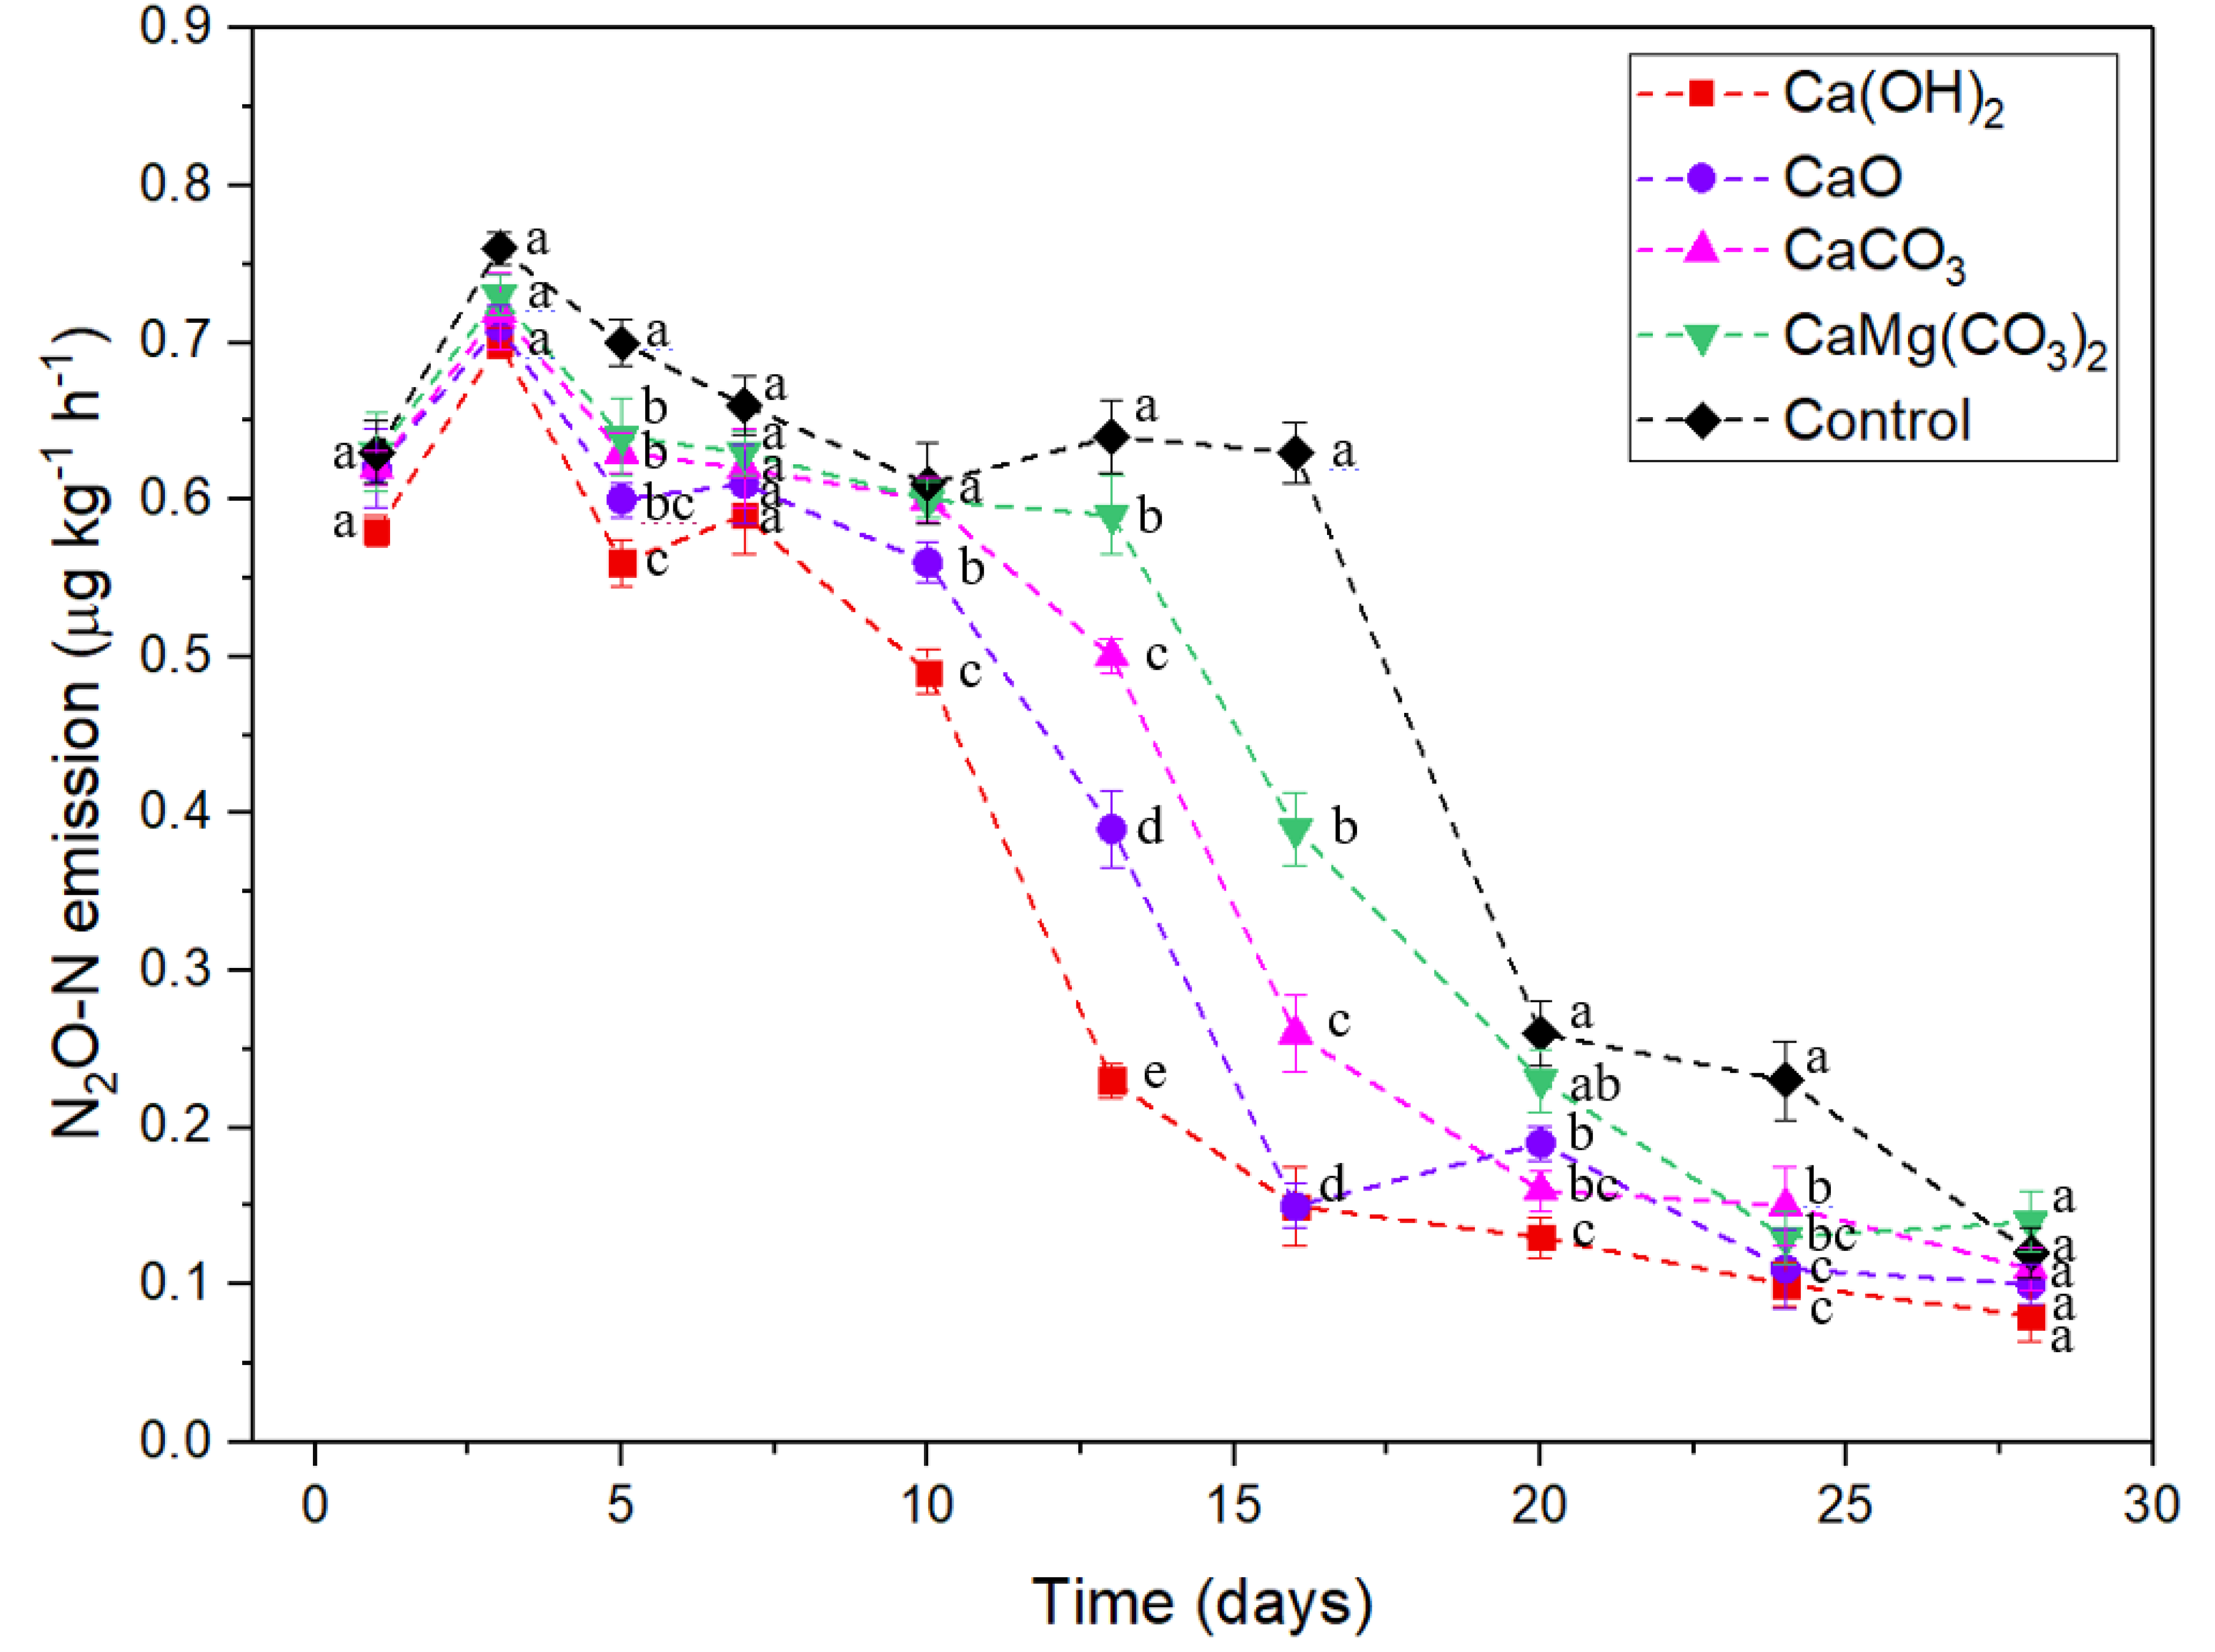
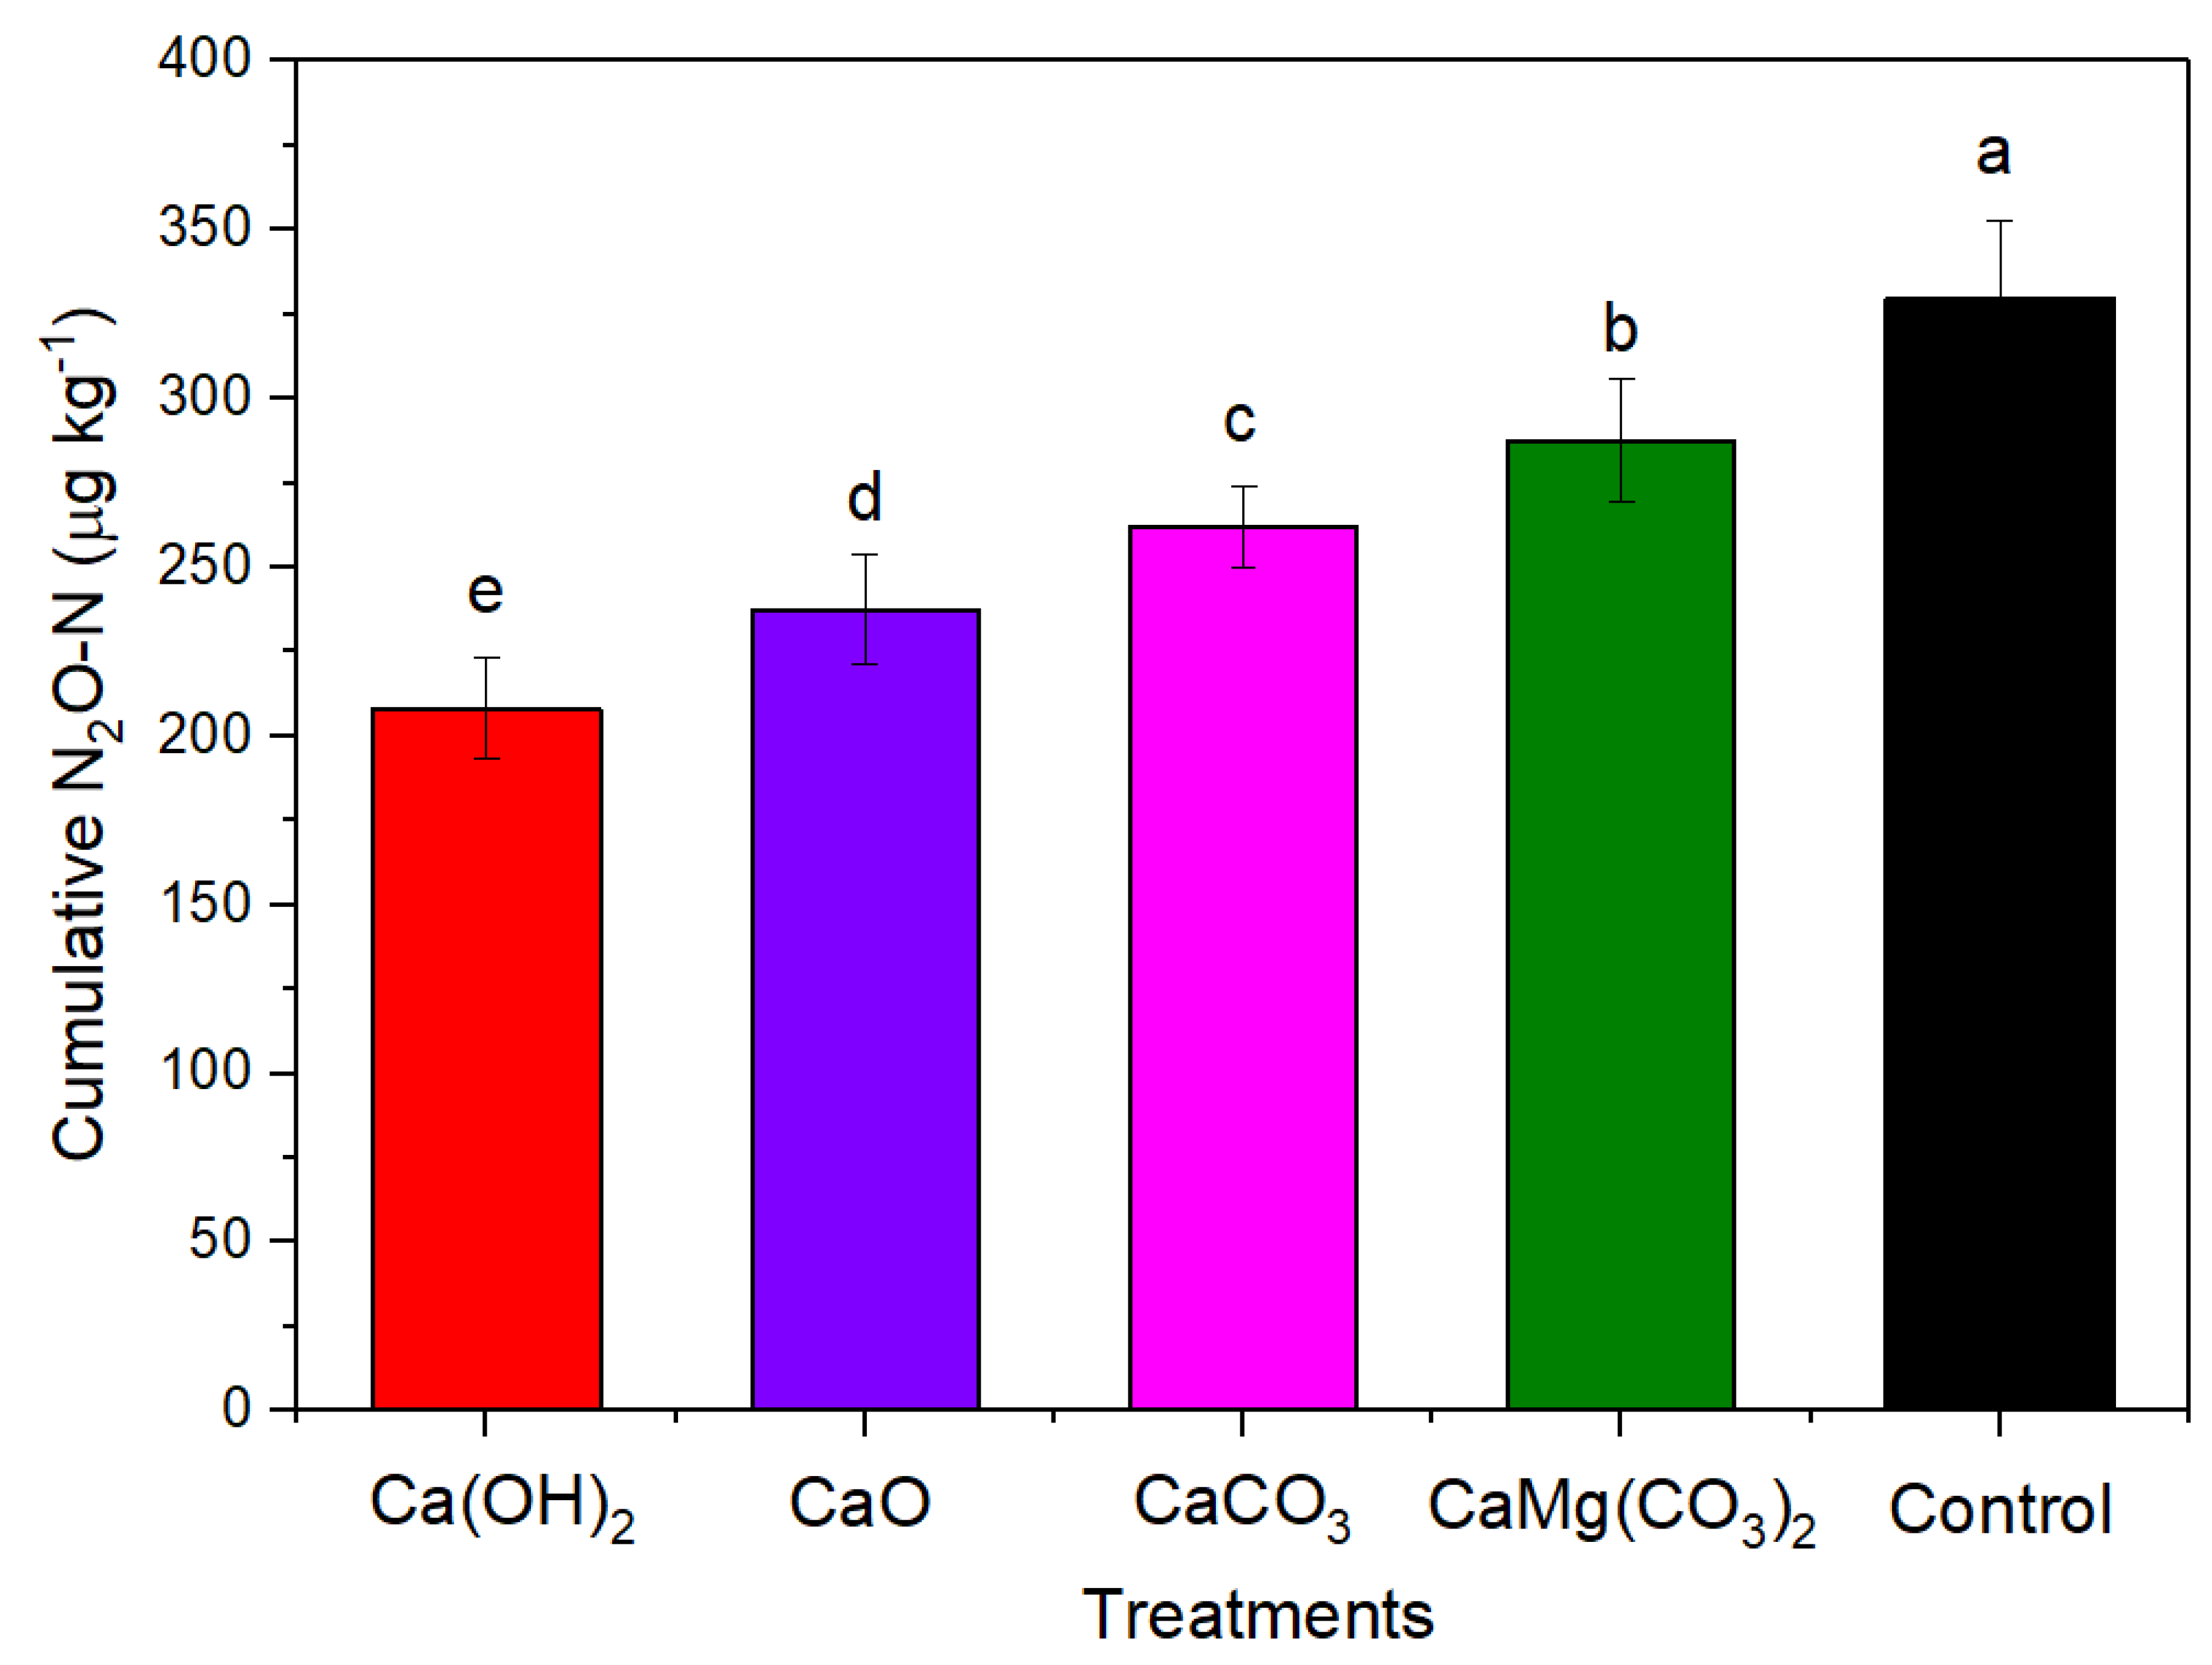
3.4. Nitrous Oxide (N2O) Emissions
4. Discussion
5. Conclusions
Author Contributions
Funding
Conflicts of Interest
References
- von Uexküll, H.R.; Mutert, E. Global extent, development and economic impact of acid soils. Plant. Soil 1995, 171, 1–15. [Google Scholar] [CrossRef]
- Goulding, K. Soil acidification and the importance of liming agricultural soils with particular reference to the United Kingdom. Soil Use Manag. 2016, 32, 390–399. [Google Scholar] [CrossRef] [PubMed]
- Guo, J.; Liu, X.; Zhang, Y.; Shen, J.; Han, W.; Zhang, W.; Christie, P.; Goulding, K.; Vitousek, P.; Zhang, F. Significant acidification in major Chinese croplands. Science 2010, 327, 1008–1010. [Google Scholar] [CrossRef] [PubMed]
- 4 Shaaban, M.; Peng, Q.; Lin, S.; Wu, Y.; Zhao, J.; Hu, R. Nitrous oxide emission from two acidic soils as affected by dolomite application. Soil Res. 2014, 52, 841–848. [Google Scholar] [CrossRef]
- Smith, V.H.; Tilman, G.D.; Nekola, J.C. Eutrophication: Impacts of excess nutrient inputs on freshwater, marine, and terrestrial ecosystems. Environ. Pollut. 1999, 100, 179–196. [Google Scholar] [CrossRef]
- Erisman, J.W.; Galloway, J.N.; Seitzinger, S.; Bleeker, A.; Dise, N.B.; Petrescu, A.R.; Leach, A.M.; de Vries, W. Consequences of human modification of the global nitrogen cycle. Philos. Trans. R. Soc. B Biol. Sci. 2013, 368, 20130116. [Google Scholar] [CrossRef]
- Shaaban, M.; Peng, Q.; Hu, R.; Lin, S.; Wu, Y.; Ullah, B.; Zhao, J.; Liu, S.; Li, Y. Dissolved organic carbon and nitrogen mineralization strongly affect CO2 emissions following lime application to acidic soil. J. Chem. Soc. Pak. 2014, 36, 875–879. [Google Scholar]
- Shaaban, M.; Hu, R.; Wu, Y.; Younas, A.; Xu, X.; Sun, Z.; Jiang, Y.; Lin, S. Mitigation of N2O emissions from urine treated acidic soils by liming. Environ. Pollut. 2019, 255, 113237. [Google Scholar] [CrossRef]
- Nägele, W.; Conrad, R. Influence of pH on the release of NO and N2O from fertilized and unfertilized soil. Biol. Fertil. Soils 1990, 10, 139–144. [Google Scholar]
- Feng, K.; Yan, F.; Hütsch, B.W.; Schubert, S. Nitrous oxide emission as affected by liming an acidic mineral soil used for arable agriculture. Nutr. Cycl. Agroecosyst. 2003, 67, 283–292. [Google Scholar] [CrossRef]
- Soil Survey Staff. Keys to Soil Taxonomy, 11th ed.; USDA Natural Resources Conservation Service: Washington, DC, USA, 2010.
- Tan, K.H. Soil Sampling, Preparation, and Analysis; Marcel Dekker: New York, NY, USA, 1996. [Google Scholar]
- Hu, R.; Hatano, R.; Kusa, K.; Sawamoto, T. Soil respiration and net ecosystem production in an onion field in central Hokkaido, Japan. Soil Sci. Plant Nutr. 2004, 50, 27–33. [Google Scholar] [CrossRef]
- Jin, T.; Shimizu, M.; Marutani, S.; Desyatkin, A.R.; Iizuka, N.; Hata, H.; Hatano, R. Effect of chemical fertilizer and manure application on N2O emission from reed canary grassland in Hokkaido, Japan. Soil Sci. Plant Nutr. 2010, 56, 53–65. [Google Scholar] [CrossRef]
- Kachurina, O.; Zhang, H.; Raun, W.; Krenzer, E. Simultaneous determination of soil aluminum, ammonium-and nitrate-nitrogen using 1 M potassium chloride extraction. Commun. Soil Sci. Plant. Anal. 2000, 31, 893–903. [Google Scholar] [CrossRef]
- Vance, E.D.; Brooks, P.C.; Jenkinson, D.S. An extraction method for measuring soil microbial biomass. Soil Biol. Biochem. 1987, 19, 703–707. [Google Scholar] [CrossRef]
- Razali, N.M.; Wah, Y.B. Power comparisons of Shapiro–Wilk, Kolmogorov–Smirnov, Lilliefors and Anderson–Darling tests. J. Stat. Model. Anal. 2011, 2, 21–33. [Google Scholar]
- Flessa, H.; Wild, U.; Klemisch, M.; Pfadenhauer, J. Nitrous oxide and methane fluxes from organic soils under agriculture. Eur. J. Soil Sci. 1998, 49, 327–335. [Google Scholar]
- Šimek, M.; Cooper, J. The influence of soil pH on denitrification: Progress towards the understanding of this interaction over the last 50 years. Eur. J. Soil Sci. 2002, 53, 345–354. [Google Scholar] [CrossRef]
- Shaaban, M.; Wu, Y.; Peng, Q.-a.; Lin, S.; Mo, Y.; Wu, L.; Hu, R.; Zhou, W. Effects of dicyandiamide and dolomite application on N2O emission from an acidic soil. Environ. Sci. Pollut. Res. 2016, 23, 6334–6342. [Google Scholar] [CrossRef] [PubMed]
- Kunhikrishnan, A.; Thangarajan, R.; Bolan, N.S.; Xu, Y.; Mandal, S.; Gleeson, D.B.; Seshadri, B.; Zaman, M.; Barton, L.; Tang, C.; et al. Functional relationships of soil acidification, liming, and greenhouse gas flux. Adv. Agron. 2016, 139, 1–71. [Google Scholar]
- Bakken, L.R.; Bergaust, L.; Liu, B.; Frostegard, A. Regulation of denitrification at the cellular level: A clue to the understanding of N2O emissions from soils. Philos. Trans. R. Soc. B-Biol. Sci. 2012, 367, 1226–1234. [Google Scholar] [CrossRef]
- Samad, M.S.; Bakken, L.R.; Nadeem, S.; Clough, T.J.; de Klein, C.A.M.; Richards, K.G.; Lanigan, G.J.; Morales, S.E. High-resolution denitrification kinetics in pasture soils link N2O emissions to pH, and denitrification to C mineralization. PLoS ONE 2016, 11, e0151713. [Google Scholar] [CrossRef] [PubMed]
- Senbayram, M.; Chen, R.; Mühling, K.H.; Dittert, K. Contribution of nitrification and denitrification to nitrous oxide emissions from soils after application of biogas waste and other fertilizers. Rapid Commun. Mass Spectrom. 2009, 23, 2489–2498. [Google Scholar] [CrossRef] [PubMed]
- Stevens, R.; Laughlin, R. Measurement of nitrous oxide and di-nitrogen emissions from agricultural soils. Nutr. Cycl. Agroecosyst. 1998, 52, 131–139. [Google Scholar] [CrossRef]
- Qu, Z.; Wang, J.; Almøy, T.; Bakken, L.R. Excessive use of nitrogen in Chinese agriculture results in high N2O/(N2O+N2) product ratio of denitrification, primarily due to acidification of the soils. Glob. Chang. Biol. 2014, 20, 1685–1698. [Google Scholar] [CrossRef] [PubMed]
- Khan, S.; Clough, T.; Goh, K.; Sherlock, R. Influence of soil pH on NOx and N2O emissions from bovine urine applied to soil columns. N. Z. J. Agric. Res. 2011, 54, 285–301. [Google Scholar] [CrossRef]
- Clough, T.J.; Kelliher, F.M.; Sherlock, R.R.; Ford, C.D. Lime and soil moisture effects on nitrous oxide emissions from a urine patch. Soil Sci. Soc. Am. J. 2004, 68, 1600–1609. [Google Scholar] [CrossRef]
- Mkhabela, M.; Gordon, R.; Burton, D.; Madani, A.; Hart, W. Effect of lime, dicyandiamide and soil water content on ammonia and nitrous oxide emissions following application of liquid hog manure to a marshland soil. Plant. Soil 2006, 284, 351–361. [Google Scholar] [CrossRef]
- Galbally, I.E.; Meyer, C.P.; Wang, Y.-P.; Smith, C.J.; Weeks, I.A. Nitrous oxide emissions from a legume-pasture and the influences of liming and urine addition. Agric. Ecosyst. Environ. 2016, 230, 353. [Google Scholar] [CrossRef]
- Page, K.; Allen, D.; Dalal, R.; Slattery, W. Processes and magnitude of CO2, CH4, and N2O fluxes from liming of Australian acidic soils: A review. Soil Res. 2010, 47, 747–762. [Google Scholar] [CrossRef]
- Di, H.; Cameron, K. How does the application of different nitrification inhibitors affect nitrous oxide emissions and nitrate leaching from cow urine in grazed pastures? Soil Use Manag. 2012, 28, 54–61. [Google Scholar] [CrossRef]


| pH(H2O) | Total C (g/kg) | Total N (g/kg) | NO3—N (mg/kg) | NH4+-N (mg/kg) | Bulk Density (g/cm3) | Cation Exchange Capacity (cmolc/kg) |
|---|---|---|---|---|---|---|
| 5.35 | 11.5 | 1.2 | 15.6 | 46.9 | 1.39 | 10.8 |
© 2020 by the authors. Licensee MDPI, Basel, Switzerland. This article is an open access article distributed under the terms and conditions of the Creative Commons Attribution (CC BY) license (http://creativecommons.org/licenses/by/4.0/).
Share and Cite
Shaaban, M.; Wu, Y.; Wu, L.; Hu, R.; Younas, A.; Nunez-Delgado, A.; Xu, P.; Sun, Z.; Lin, S.; Xu, X.; et al. The Effects of pH Change through Liming on Soil N2O Emissions. Processes 2020, 8, 702. https://doi.org/10.3390/pr8060702
Shaaban M, Wu Y, Wu L, Hu R, Younas A, Nunez-Delgado A, Xu P, Sun Z, Lin S, Xu X, et al. The Effects of pH Change through Liming on Soil N2O Emissions. Processes. 2020; 8(6):702. https://doi.org/10.3390/pr8060702
Chicago/Turabian StyleShaaban, Muhammad, Yupeng Wu, Lei Wu, Ronggui Hu, Aneela Younas, Avelino Nunez-Delgado, Peng Xu, Zheng Sun, Shan Lin, Xiangyu Xu, and et al. 2020. "The Effects of pH Change through Liming on Soil N2O Emissions" Processes 8, no. 6: 702. https://doi.org/10.3390/pr8060702
APA StyleShaaban, M., Wu, Y., Wu, L., Hu, R., Younas, A., Nunez-Delgado, A., Xu, P., Sun, Z., Lin, S., Xu, X., & Jiang, Y. (2020). The Effects of pH Change through Liming on Soil N2O Emissions. Processes, 8(6), 702. https://doi.org/10.3390/pr8060702