Abstract
This paper aims to compute the performances of a smaller version of Solana power plant, with half the solar field, and 1 of 2 turbines in the power cycle, that can be built in Amman or Ma’an in Jordan. The climate conditions for both Amman and Ma’an are discussed thoroughly in the paper. Furthermore, a preliminary validation exercise performed by using measured monthly average values of electricity production from existing plants, a system advisor model (SAM) is used to predict the performances of the proposed Solana-like plants in Ma’an and Amman. The validation shows a good agreement with the measured data for different existing power plants. The simulation results including the monthly capacity factors suggest the annual operation in Ma’an maybe even better than the operation in Gila Bend, for an annual average capacity factor of about 41% for Ma’an vs. a capacity factor of about 39% for Gila Bend. This is mainly due to the best combination of direct normal irradiance (DNI) and the dry bulb temperature across the year in Ma’an versus Gila Bend.
1. Introduction
The Hashemite Kingdom of Jordan (latitude 32 N) which is located in the middle east has scarce fossil fuel resources. The electricity industry began in Jordan in 1937. Since then, the electricity generation capacity in Jordan has been increasing to meet industrial and social developments, where in 2018 it was reported to be 5236 MW and the total generated electricity mounted to 19.73 TWh in the same year [1]. More than 89.3% of this quantity was generated using traditional energy sources, where 45% of the primary energy in Jordan was allocated for electricity generation [1,2]. The electricity load in Jordan usually follows the two-peak pattern [2]. However, the maximum of those two peaks alternates from year to year based on weather conditions and fuel and electricity prices. For example, in 2015 Jordan had a summer peak of 3300 MW, while in 2016 it had a winter peak of 3250 MW. It should be noted that in light of the recent prices of fuel and electricity, the winter peak has dominated in the last three years. Nonetheless, an (expected) increase in the electricity prices will push consumers once again towards fuel-based heating, and the summer peak in electricity will become once again dominant [2]. In all cases, renewable energy-based electricity generation is a necessity for the success of achieving future energy security. This is to emphasize that the presented work, by all means, does not serve as an energy policy paper for country Jordan. However, it shows that deploying a different renewable energy technology in a large scale will help in securing the energy sector.
The recent years had witnessed a rapid increase in Jordan’s population, where the high rate of natural population growth coupled with the Syrian refugee waves guaranteed that. This added more pressure on the electricity system in Jordan. In 2018, the total electrical energy consumption in Jordan was 17.985 TWh, which amounts to 95% of the total electricity generated for which the majority of the losses occurring at the electrical distribution stage [1].
Jordan has a significant solar resource. Located within the solar belt of the world, it receives a daily average solar radiation ranging between 5 and 7 kWh/m2, and yearly global radiation of more than 2000 kWh/m2 with a sunshine duration of 3000 h per year [3,4]. Henceforth, many research works have targeted leveraging this vast renewable energy source under local conditions for applications ranging from water desalination such as those summarized in [5], to heating, ventilation, and air conditioning (HVAC) such as the efforts in [6,7] to power generation which assumed the lion’s share, with efforts investigating high level decision making and selection (policy) to efforts investigating specific performances of selected components. For example, analysis of the factors impacting the performance of the PV systems locally are available in [8,9]. High level power generation decisions also under local conditions are investigated in [10,11].
The majority of the power generation concentrated on the standard photovoltaic power plants, contributing 7% of the total generated electricity in 2018 [1]. The concentrated solar power (CSP) plants have not been attempted yet on a large scale, mainly because of the relatively large capital investment required in comparison to the modular PV systems, the uncertainty in the success as will be elaborated later, and the lack of investigative studies such as the one the authors are offering here. The economic and environmental questions of CSP vs. PV are certainly elusive ones, but several works concluded that; while PV enjoys more popularity; a direct statement of PV being better is not at all accurate [12,13]. Therefore, continuous attempts at arriving at the successful implementation of CSP plants have been ongoing globally.
One of the most successful (in reality and not simulation) ever built CSP plant worldwide is the Solana CSP plant in Gila Bend, AZ with thermal energy storage (TES). Details highlighting this success are discussed in the next sections of the paper. In theory, and if the technical experience is correctly transferred through adequate modeling to certain locations in Jordan, similar success can be achieved as the ambient conditions such as air temperature and humidity, and the superior solar irradiance values are very comparable. For example, the condenser of the CSP power block that operates on a low maximum temperature steam Rankine cycle is usually air-cooled or operates on evaporative cooling. Both of which rely heavily on local ambient conditions, such as temperature and humidity, where they directly affect the steam cycle’s minimum temperature and the performance in general. Thus, the potential of a CSP plant in Jordan is clear. The heavy energy importer country which is facing a continuous increase in the electricity demand with monthly, daily, and hourly trends requiring a readily dispatchable energy source [2] can certainly benefit from such prospect.
The main objective of this paper is to establish this prospect, by computing the potential performance of a smaller version of Solana power plant (Gila Bend), with half the solar field, and 1 of 2 turbines in the power cycle. Prospect locations were chosen to be Amman and Ma’an. The former because it is the economic and political capital and where the majority of the electricity consumption occurs [2], which will save costs in transmission and grid stability. The latter represents the highest solar energy receiving location in all Jordan (and one of the highest worldwide). Despite its remote location, it has the potential for one of the best CSP plants worldwide because of its superior ambient conditions.
Concentrated solar power (CSP) renewable energy can be exploited through systems employing solar tower (ST) or parabolic trough (PT). A review of the latest design and operating data of concentrated solar power (CSP) plants, both solar power tower (ST) and parabolic troughs (PT) can be found in [14]. More detailed works can be found in [15,16,17,18], as these references reviewed the capacity factors of the latest CSP and provided the latest outlook of the technologies. For example, the design and operating data of current concentrated solar power (CSP) solar tower (ST) plants is available in [15]. Boretti et al. [16] specifically reported the costs and electricity production of CSP in the US. The opportunity to integrate CSP with a combined cycle gas turbine (CCGT), where the solar resource is affected by clouds was investigated in [17]. Boretti [18] discussed what to expect in the near future from the CSP solar tower (ST) with TES technology, which as so far overrated at the expense of the much better performing CSP parabolic trough (PT) without or with TES. Other research efforts [19,20] focused on the variability of electricity production by solar, dramatic even at the grid level, and the requirement of energy storage.
PT, despite theoretically displaying lower performances in several computer simulations, has much better performance in the real world [21]. Specifically, the capacity factors, which are the ratio of the average power generated during a given period to the nominal power, are better in PT systems in comparison to ST ones [14,15,16,17,18]. Moreover, their construction is simpler, more reliable, less expensive with less maintenance. Coupling CSP with molten salt thermal energy storage (TES) enhances its energy dispatchablity to meet various demands. While the technology readiness level (TRL) of CSP is high, as plants such as solar energy generating systems (SEGS) are successfully operated since the 1980s, the TRL of TES is less.
Unfortunately, the renewable energy sector is plagued by over-optimistic claims that do not match the results in the real world. For example, the Crescent Dunes plant is delivering annual capacity factors of 0.15 in comparison to the designed one of 0.52. Nonetheless, it should be noted that the ill-fated CSP ST integrated with TES implementation should not by any chance negatively impact the prospect of CSP PT coupled with TES, especially as the latter has already delivered good performances in Solana, Gila Bend, AZ, US [14,15,16,17,18].
Moreover, on the scale of renewable energy-based power systems, CSP (integrated with TES) has been shown to have the upper hand in terms of dispatchability vs. intermittency and variability when compared against wind and solar (photovoltaic (PV)) [19,20]. That is wind and solar photovoltaic without external energy storage are unable to address different demands at different times. Moreover, the annual average capacity factors of solar PV are around 0.29, with high-frequency standard deviations with a coefficient of variability above unity [19]. CSP PT with TES can, at least in computer simulations, achieve more stable and consistently uniform capacity factors addressing the variability from solar PV occurring at night and/or cloudy conditions.
As concluded in [14,15,16,17,18], CSP PT has the potentials, once a satisfactory design will be industrialized, of delivering the same or better than PV costs of electricity. The cost-effectiveness can be improved by the incorporation of intermittency and unpredictability factors, with a satisfactory industrialized design of TES. PV and wind need significant external energy storage. CSP with TES may have in principle this requirement dramatically reduced.
The latest CSP PT performance data allow room to identify the best design options. These actual performance data of CSP ST and PT plants with and without TES can be obtained by studying the largest CSP plants currently operational in the US. Electricity production data of CSP energy facilities in the US are available as public domain information from the US Energy Information Administration (EIA) [22]. Annual, quarterly, and monthly net generation data in MWh are available, as well as natural gas use in MMBtu. Natural gas is sometimes used to boost the production of CSP plants. The time series of the monthly capacity factors are used to supplement the synthetic information provided by the annual capacity factors to indicate the advantages and possible improvements of technology.
According to the up-to-date (2019) list of CSP projects available in [23], only four have net capacities of more than 150 MW. These four are all located in the US:
- Ivanpah Solar Electric Generating System (ISEGS) (377 MW)
- Solana Generating Stations (250 MW)
- Genesis Solar Energy Project (250 MW)
- Mojave Solar Project (250 MW)
Additional information on the concentrating solar power with and without energy storage can be found in [24,25,26].
It is also of interest to note that the seventh-largest CSP plant worldwide, the Crescent Dunes Solar Energy Project with a net capacity of 110 MW, is located in the US as well. Of the five projects mentioned above, the oldest one (Solana) only started production in October 2013, whereas the newest one (Crescent Dunes) started production in November 2015. Therefore, all of them are very recent. Also, we note that the historical solar energy generating systems (SEGS) plants, that started operation in the 1980s, with 4 of 9 units still operational, are not considered.
The CSP technology employed in ISEGS is ST, without TES, and with natural gas (NG) boost. Whereas the technology of Solana is PT, with TES of 6 h and no NG boost. The Genesis and Mojave Solar Projects technology is PT without TES and no NG boost. And finally, the technology Crescent Dunes operates with is ST, with a TES of 10 h and no NG boost. It is worth mentioning here that all the presented capacity factors discussed in [27] are calculated based on the year 2018. Upon investigation of the latest electricity production data of ISEGS, capacity factors are found to be in the low 20% [27]. These undesired numbers are even not accounting the burning of significant NG amounts, which represents additional generating costs and pollution. As a matter of fact, the actual capacity factors are drastically reduced by one-third to less than 15%, once the consumption of NG is accounted for at the fuel energy conversion efficiency of a reference combined cycle gas turbine plant [27]. The low capacity factors are significantly alarming in light of the fact that the designed capacity factor for such a plant was 32.68%, with a much-limited boost by the burning of NG. Moreover, the Crescent Dunes plant, which is now operating with capacity factors of around 10%, had a designed capacity factor of 51.89% [27]. Not to mention it is continuously subjected to periods of shutdowns.
In the much simpler and more reliable PT technology, CSP is certainly performing much better and the reduction in the capacity factors of existing plants in comparison to the design ones is significantly less. For example, Solana is operating on capacity factors of 36.4% in comparison to the design value of 43.11% [27].
Surprisingly, Genesis and Mojave Solar Project, which are based on the more established PT technology but without any TES, are not lagging the design values at all. Actually, the performance in some instances is actually better. It is needless to say that with TES, the capacity factors as with Solana are still higher in absolute. In numbers, Genesis’ actual capacity factors are 28.11% in comparison to the design value of 26.48% [27]. Whereas, Mojave was similarly performing outstanding above the planned value but recently has suffered from a drop in production, where the capacity factor was reduced to 24.6% in comparison to the design value of 27.40% [27]. The latest 12-month moving averages of the capacity factors are Ivanpah* 22.87%, Ivanpah 23.67%, Solana 36.40%, Genesis 28.11%, Mojave 24.45%, and Crescent Dunes 12.46% [27]. The asterisk indicates the SUN only result of ISEGS. Nonetheless, and as discussed in [14,15,16,17,18], this is an overselling of the SUN result, as it only accounts for the burner NG energy to the SUN solar field energy ratio. NG may be better used for almost double fuel conversion efficiency in a high efficiency combined cycle gas turbine plant than a low thermal efficiency solar plant.
The aforementioned introduction discussed some important information with regard to country Jordan that is related to the electricity generation as well as the potential of utilizing renewable energies. Moreover, the introduction summarized the ST versus PT in CSP in terms of their developments and recent technologies along with few existing plant available in the world. The remainder of the paper is divided as follows: Section 2 describes SAM modeling and validation. Section 3 presents SAM computations for a plant like Solana in Amman and Ma’an. Finally, a summary of major findings and conclusions about the importance of this research is reported in Section 4.
2. SAM Modeling and Validation
Here, the goal is to first develop validated models of existing facilities, then to use one validated model to compute the performances that a similar plant could potentially have in Amman, or Ma’an, Jordan. The design simulations are conducted on the system advisor model (SAM) simulations. SAM, which is widely used within fields of policy-making, engineering, and other techno-economic fields is free software [28]. SAM can simulate several renewable energy systems, including concentrating solar power (CSP) systems for electric power generation. Additionally, the software is capable of simulating industrial process heat from the parabolic trough (PT) and linear Fresnel. A more detailed description of SAM can be found in [29,30,31]. CSP modeling details can be also found in [31,32,33,34]. A schematic sketch of a SAM model for CSP parabolic trough is shown in Figure 1.
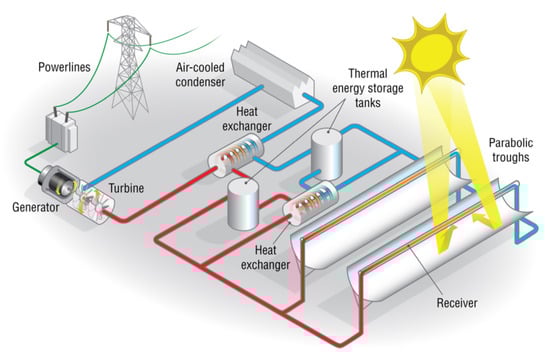
Figure 1.
SAM sketch of a parabolic trough plant. Credit NREL/SAM.
Sample CSP PT models are readily available in SAM [28]. To establish a baseline for the proposal of new plant design, modeling existing plants, and leveraging their experimental data for validation can certainly enhance the trust in the proposed design simulated results. In general, there is a huge reliability issue and thus confidence in the results of the created models. For example, the results of the simulations for Ivanpah and Crescent Dunes plants are far off from the actual production results [14,15,16]. Crescent Dunes’ annual capacity factor was found to be 0.15, which is certainly far from the computed capacity factor of 0.52. Understandably, the real-world components work differently from what is simplistically assumed in the model that are everything but accurate and reliable. Nonetheless, the huge deviation is not accurate and reliable.
The relative simplicity of the setup of the parabolic trough gives it an advantage over the solar tower. The operation of a smaller number of single-axis reflectors focusing the sunlight on a central receiver is certainly easier than focusing a multitude of two-axis reflectors on a single small receiver at the top of a tall tower relatively far from the reflectors. Additionally, the environmental effects—such as clouds—cannot be simulated well and the simple models employing average cloudiness factor or a simple average direct normal irradiation (DNI) are not capable of effectively capturing the reality [17].
Benchmarking a high frequency sampled simulation with the data available from real-world experiments is the key to the success of the model. The high frequency requires sampling every 1 min or less for grid management, which unfortunately is unattainable to be found from published experimental data. Even the weather data needed to describe the environmental conditions for the simulations are not readily available at that high frequency. More details on the validation are explained in [27].
First, authors target the validation of the physical parabolic trough model in SAM Version 2018.11.11, updated to Revision 4, SSC 209, by comparing monthly average experimental data with simulations for the average year [27]. The target plants are the 250 MW Mojave and Genesis plants without TES, and the Solana plant with MS TES. They are selected as they represent the three latest largest CSP PT facilities in the US and the world.
Within SAM, the physical trough model can calculate the net electricity delivered to the grid by a simulating a parabolic trough solar field transferring energy to an electricity generation power block. The model offers the option of having a thermal energy storage system. The physical trough model handles several of its components from the understanding of the principles of heat transfer and laws of thermodynamics. Somewhat flexibility exists within the model; However, the support of experimental data is crucial to have larger accuracies in the prediction of performances.
The main components of a parabolic trough system are the solar field, power block, with optional thermal energy storage and fossil-fuel backup systems. The solar field is responsible for the collection of heat from the sun. The parabolic, trough-shaped solar collectors focus the solar radiation onto tubular receivers. The structure of the collector supports the mirrors and receivers and allows for sun tracking on one axis. The structure is also intended to provide support against wind-induced forces. The receivers are comprised of a metal tube, coated with a solar radiation absorbing surface, in a vacuumed coated glass tube. A heat transfer fluid (HTF) transports the absorbed energy from the focused solar radiation in the form of heat to the power block and other components of the system. The power block is based on conventional power cycle technology, employing a turbine to convert thermal energy from the solar field to electric energy. The role of the optional fossil-fuel backup system is supplementing the power cycle with extra heat when the absorbed solar energy is not capable of driving the power block at its rated capacity on its own.
The physical trough system model analyzes the performance of the system components from the standard models of heat transfer and the laws of thermodynamics. The corresponding mathematical models incorporate the different components geometry and energy transfer properties such as the absorber emissivity, thermal conductivity, and the envelope of glass thickness. As these mathematical models include uncertainties in the geometry and the property assumptions for each system component, an aggregated uncertainty at the system level is then computed. Tuning against real data of already established and run plants becomes evidently important to succeed in designing and computing performances for new plants. It could as well assist in analyzing the prospect of the relocation of an existing plant and its potential merits.
Incorporated with the physical model are the transient effects related to the thermal capacity of the HTF in the solar field piping, headers, and balance of the plant. The model allows the selection of the solar field components, including several receivers and collector types within a single loop. Inherently, the physical trough model relies on several physical sub-models to make necessary calculations. Examples of these models are the collector model, the receiver heat loss model, the field piping pressure drop model, and the power cycle performance model.
It is worth mentioning here that extensive work has been done in order to enhance the efficiency of solar systems in general by dispersing nano solid particles in the base fluid [35,36].
More comprehensive validation of the SAM code for the simulation of CSP plants, plus the basics of the CSP modeling, is provided in [37], with a comparison of experiments and simulations for four major CSP plants, both ST and PT with and without TES.
The validation of the latest system advisor model (SAM) vs. the experimental data for concentrated solar power energy facilities is conducted. Both parabolic trough and solar tower are considered, with and without thermal energy storage [27]. Despite SAM computes the operation every hour during a year, the availability of only monthly average data for the electricity production, plus not very detailed weather and solar irradiance data for a typical rather than a specific year, only permits a limited validation. The experimental results for one specific year, and the computation by SAM for the typical year, are reproduced below for the three recent parabolic trough power stations considered in [27]. The reader is referred to [27] for the more specific inputs used in the SAM model for Solana.
2.1. Genesis (Blythe)
By referring to [37] with the published data for the year 2018, Genesis Solar Energy Project, shown in Figure 2, is a concentrating solar power (CSP) project which comprises of two 125-MW units operating on parabolic trough solar thermal technology. It has 500,000 parabolic mirrors aligned in rows over a space of 1800 acres in the Sonoran Desert between Center and Blythe. Table 1 lists the remaining information.
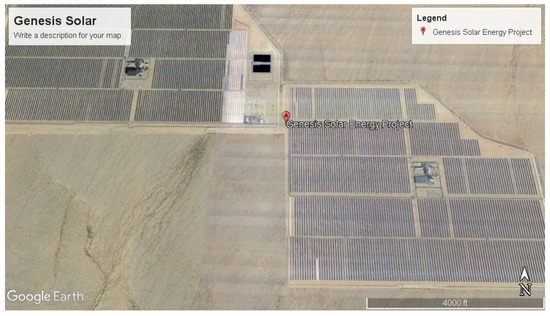
Figure 2.
Google Earth view of Genesis solar energy project. Map data ©2020 Google.

Table 1.
Genesis Project specifications [37].
With a maximum error of 10%, Figure 3 shows the monthly capacity factor results of Genesis simulated by SAM and the results obtained from on-site measurements. Worth to mention, the experimental result is for the year 2018, and the weather conditions are for a typical year. It should be noted that there is an inter annual variability in the solar resource and the weather conditions that may account for a difference up to 5–6 % in the electricity production of the same month in different years [14,15,16]. A proper and more accurate validation requires the missing information with regards to weather conditions and solar energy facility production, as well as components operation and data measured simultaneously with high frequency. As this validation activity has not been done yet for any plant, it is impossible to pursue better accuracy of the estimations.
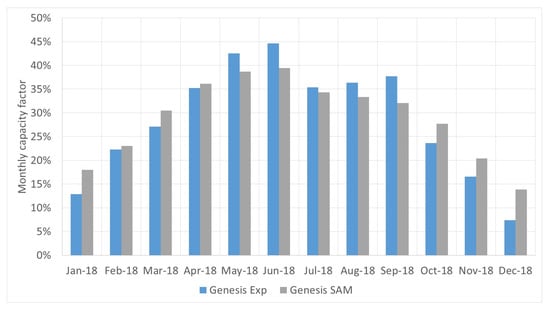
Figure 3.
Comparison of monthly capacity factors of Genesis from SAM and measurements.
2.2. Mojave (Daggett)
Mojave Solar Project, shown in Figure 4, is a concentrating solar power (CSP) project located in an unincorporated area of San Bernardino County, between Barstow and Kramer Junction, about nine miles northwest of Hinkley and 100 miles northeast of Los Angeles. The project is spread over a land of 1765 acres enabling it to generate (planned capacity) 600,000 MWh annually. The remaining technical specification is available in Table 2.
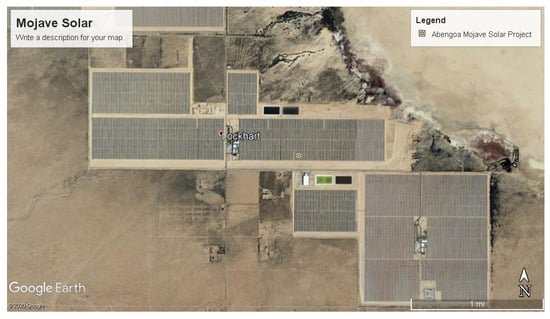
Figure 4.
Google Earth view of Mojave solar energy project. Map data ©2020 Google.
Table 2.
Mojave Project specifications [38].
A comparison, with a maximum error of ~20%, between the monthly capacity factors for Mojave power plant computed by SAM and those obtained by measurements is shown in Figure 5. Annual electricity production is however computed with about same accuracy of the prior case.
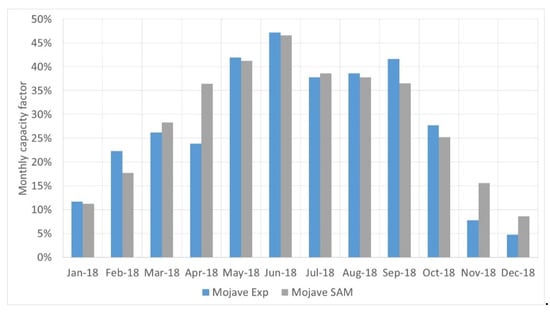
Figure 5.
Comparison of monthly capacity factors of Mojave from SAM and measurements.
2.3. Solana (Gila Bend)
Solana Generating Station, shown in Figure 6, is 70 miles southwest of Phoenix, Arizona. Equipped with a thermal energy storage system, electricity can be provided post-sunset for up to 6 h. Spread over a land area of 780 hectares, the solar-field aperture area reaches 2,200,000 m². The remaining technical specification is found in Table 3.
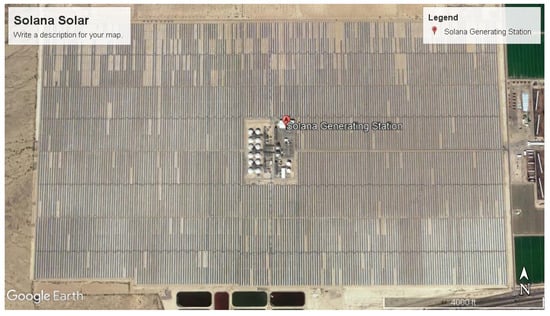
Figure 6.
Google Earth view of Solana solar energy project. Map data ©2020 Google.
Table 3.
Solana Project specifications [39].
A comparison of the monthly capacity factors of Solana results obtained from SAM simulation with those measured on-site is illustrated in Figure 7. Again, there is a maximum error of 20%, but relatively close annual production of electricity, as the two curves are intersecting.
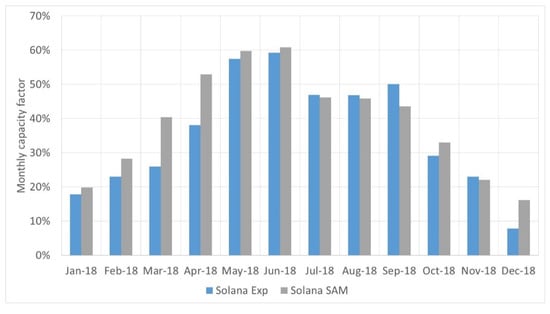
Figure 7.
Comparison of monthly capacity factors of Solana from SAM and measurements.
2.4. Discussion of SAM Modeling and Validation for the US Plants
To be able to discuss the previous results, Figure 8 demonstrates the results of the three locations side by side. The experimental data for different years (between 2015 and 2019 based on availability) were used to generate an average of average for the monthly capacity factors among these years, with showing the spread of the data using standard deviation. That means assuming a random distribution, the spread indicates how 68.2% of the capacity factors closest to the average for a given month has varied. The corresponding SAM simulation for 2018 has been also plotted along for the three sites.
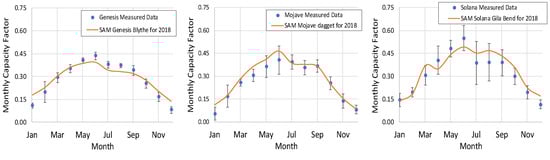
Figure 8.
Statistical comparison of monthly capacity factors of measured and those extracted from SAM simulations for three different sites.
First, it is quite clear how the Solana site has been able to outperform the two other sites. Nonetheless, it should be noted that this outperformance is accompanied by variance in performance for some months. On the one hand, the latter raises the flag about the assurance of delivery. On the other hand, the smaller spread of the Genesis can be an indication of consistent underperformance. It is of interest to see how the SAM model is capable of not only mapping the general trend of the monthly capacity factor but also generating a result that is within the spread representing the closest 68.2% to the average.
3. SAM Computations for a Plant like Solana in Amman and Ma’an
As discussed in [27], the above validations are by no way a certainty the models are producing accurate results. It is certainly not enough one annual average capacity factor, or 12 monthly average capacity factors, with mismatched weather and power plant data, to validate a model. Changing the environmental variables can help in exploring the potential of other locations, in addition to examining the opportunity of variating the design parameters of the facility. Experimental data are only monthly values. This is not enough for proper validation. The simulations only provide a rough, preliminary estimation of the monthly electricity production in Amman and Ma’an. If the annual output of Solana in Gila Bend is overrated by 10% in the model, it is likely that the annual output of a plant-like Solana in Amman or Ma’an is similarly overrated.
In the scope of attempting to visualize the potential of what is an identical copy of the Solana project to be established in Amman and Ma’an, Jordan, authors first investigate the environmental conditions. Regarding solar irradiance, the annual average direct normal irradiation (DNI) in Amman and Ma’an is 2533 kWh/m2 and 2798 kWh/m2 respectively [40,41].
The global horizontal irradiation GHI is 2156 kWh/m2 for Amman and 2327 kWh/m2 for Ma’an. The diffuse horizontal irradiation DIF is 555 kWh/m2 for the case of Amman and 524 kWh/m2 for the case of Ma’an. The global tilted irradiation at an optimum angle (GTI Opta) is 2412 kWh/m2 for Amman, while it is 2578 for Ma’an. The annual average air temperature is 19.3 °C for Amman and 18 °C for Ma’an. The terrain elevation is 804 m for the city of Amman and 1108 m for the city of Ma’an [40,41]. It is worth mentioning here that the choice of these two locations in Jordan is that most of the renewable energy projects are executed near Amman and Ma’an.
3.1. Discussion of SAM Modeling for Jordan Plants
Compared to Gila Bend, AZ, US, where Solana is located, the DNI is slightly less, 2533 vs. 2779 kWh/m2 for the case of Amman and almost the same for the case of Ma’an, and the GHI is 2156 vs. 2154 kWh/m2 for the case of Amman and 2327 kWh/m2 vs. 2154 kWh/m2 for the case of Ma’an. The DIF is 555 vs. 473 kWh/m2 for the case of Amman and 524 vs. 473 kWh/m2 for the case of Ma’an. The GTI Opta is 2412 vs. 2490 kWh/m2 for the city of Amman and 2578 vs. 2490 kWh/m2 for Ma’an. The air temperature is 19.3 °C vs. 24.9 °C for the case of Amman and is 18 °C vs. 24.9 °C for the case of Ma’an. The terrain elevation is 804 m vs. 222 m for the case of Amman and 1108 m vs. 222 m for the case of Ma’an [39,40]. Figure 8 below represents a back-to-back comparison of temperatures, clouds coverage, and humidity for the three locations. Temperatures, clouds coverage, and humidity are much better in Ma’an compared to Amman and Gila Bend. Therefore, it can be concluded that Ma’an can have a much higher potential in success then comes to Amman compared to Gila Bend. For the sake of simplicity and easiness for readers to follow, Table 4 summarizes the previously mentioned information with regards to the three locations.
Table 4.
Climate conditions for the considered locations.
SAM incorporates a model for a generic parabolic trough with thermal energy storage of molten salts [42], where the design information of Solana can be input. Later on, the model can be tuned using realistic monthly electricity production data to create a model with higher confidence results by changing the definition of the main performance parameters. The model is then equipped with the weather file of Gila Bend, AZ. More details on how to implement thermal energy storage systems can be found in [20,43,44].
In 2018, Solana solved the majority of the maturity issues it had before. Therefore, the SAM model largely assumes exaggerated electricity production between February and May. After that, it mostly underrates electricity production from July to November. While the most important differences are filtered out from the monthly averages, this does not fall in the category of strong validation.
The only way to advance the modeling exercises is to compare detailed and high-frequency sampled experimental results with the simulations. As mentioned earlier and for the sake of the grid stability, this cannot have a data sampling of more than one minute. Data including the output of the power plant, the necessary environmental variables, as well as all the other operating parameters included in the model. This certainly calls for attention as engineers definitively need much better tools; more than what policymakers require; to progress the current designs of CSP plants. This indeed requires an elaborate comprehensive R&D, including detailed measurement investigations. The progress can even be achieved better with crowdsourcing through making this measurement readily available online and downloadable by any intrigued scientist, engineer, etc. Figure 9 shows comparison of some of the weather parameters in Gila Bend, AZ, US, Amman, Jordan, and Ma’an, Jordan.
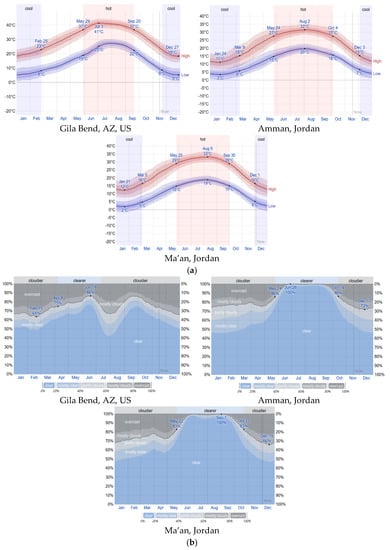
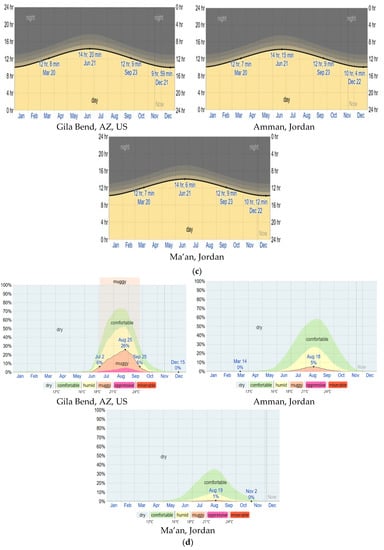
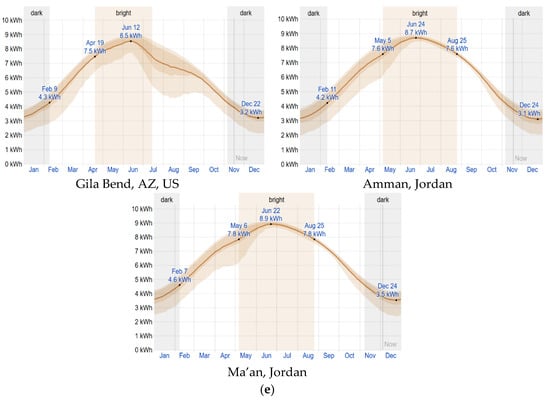
Figure 9.
Weather parameters in Gila Bend, AZ, US, Amman, Jordan, and Ma’an, Jordan. Images reproduced modified from [45]. (a) Monthly average high and low temperatures; (b) clouds coverage; (c) hours of daylight and twilight; (d) humidity; (e) average daily incident shortwave solar energy.
3.2. Solana (Amman) and Solana (Ma’an)
A sample ‘physical’ parabolic trough model of a solar facility for a 140 MW rated power and 6 h of thermal energy storage located in Ma’an, Jordan is shown in Appendix A. The model is clearly very basic, describing the most part of the components by using simple equations plus empirical data. It should be noted that the same model is used for Amman, Jordan except for the metrological data.
As shown in Figure 10, Figure 11 and Figure 12, in both Amman and Ma’an the solar energy collected from the solar field during winter is insufficient to run the facility at peak power. In the peak during summer, the solar energy collected from the solar field is enough to run the facility at peak power and to store energy in the storage for the provision of electricity up to almost midnight in July. Going back to the winter, the solar energy collected during the day reduces, and these limits peak energy production during the day as well as the opportunity to store energy for after sunset operation. Operation in Ma’an is better because of the larger solar irradiance, the reduced humidity, and the lower minimum temperature in Ma’an vs. Amman. As also shown in Figure 10, Figure 11 and Figure 12, in both Amman and Ma’an, the electricity production is close to the one in Gila Bend, which is considered one of the best places on earth for solar power. In reference to Amman, Ma’an provides further advantages, that translate into a larger electricity production over the year. Moreover, as shown in Figure 10, Figure 11 and Figure 12, results show as far as the monthly capacity factor is concerned, Amman, Ma’an, and Gila Bend are superior to Al Khobar, Saudi Arabia. This is due to the larger DNI, as well as the lower temperatures and the better humidity conditions, without mentioning the further issues with sand and dust and the marine environment in Al Khobar. The annual average capacity factors are about 36% in Amman, about 39% in Gila Bend, around 41% in Ma’an, and about 34% in Al Khobar. Figure 10 presents the likely dispatchability during the typical year, for one typical day of every month. The solar field collects a different amount of energy in different months. This energy is transferred to the energy storage as well as the power cycle. The thermal energy storage charged during the day when extra energy is available provides the energy to the power cycle when the supply from the solar field reduces. During the summertime, there is the opportunity to produce electricity almost up to midnight.
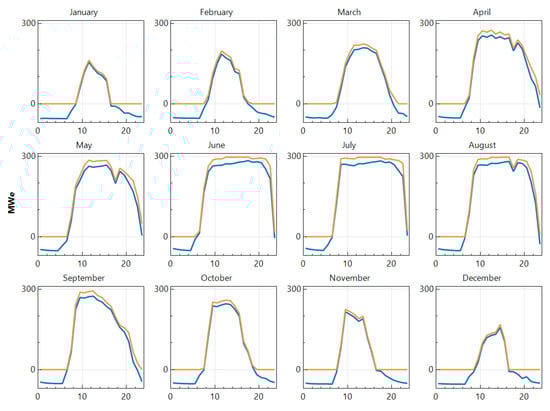
Figure 10.
Solana power plant in Amman with SAM monthly average daily operation over a year. X is the time of the day, Y the power gross and net at the turbines. Orange lines refer to gross while the blue ones refer to the net.
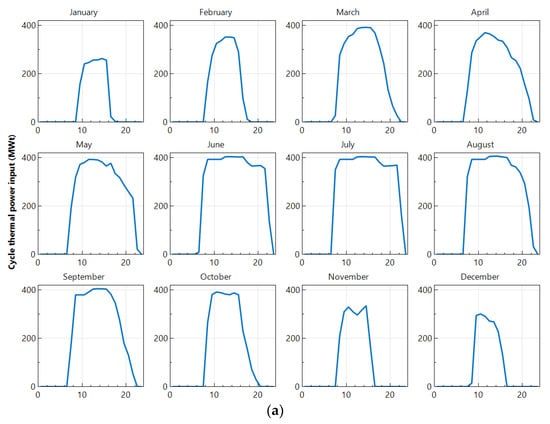
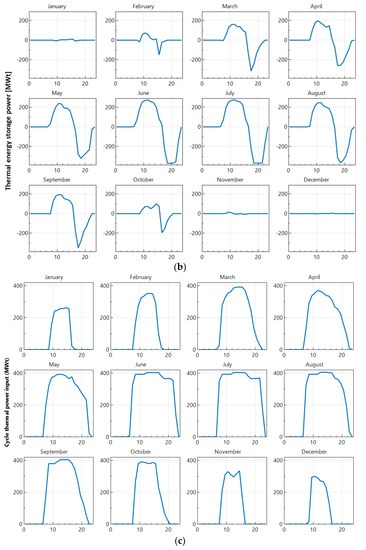
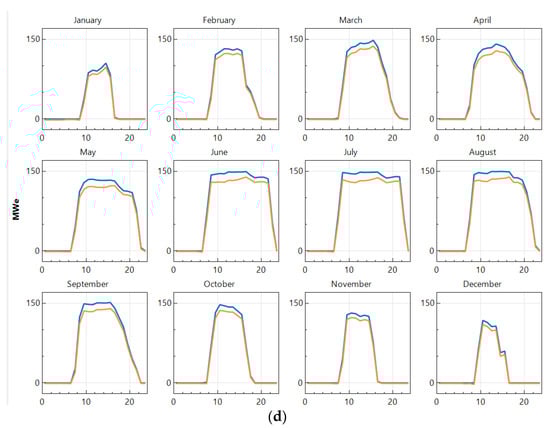
Figure 11.
Solana power plant in Ma’an with SAM monthly average daily operation over a year. X is the time of the day, in typical days for every month. Y is the field thermal power absorbed (a), the thermal energy into storage (negative is out of storage) (b), the cycle thermal power input (c), and the power gross and net at the turbines (d). Note: orange lines refer to gross while the blue ones refer to the net.
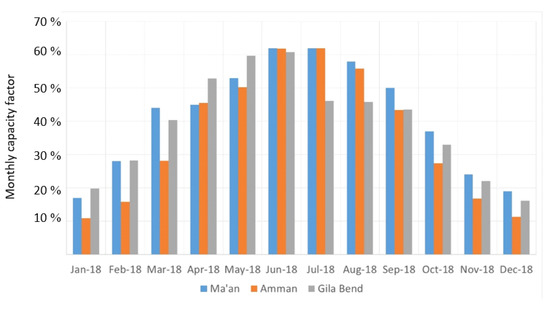
Figure 12.
Bar graph comparison of monthly capacity factors of Solana Gila Band, Solana Amman, and Solana Ma’an from SAM.
Economic wise, the actualized construction costs of CSP PT without TES are in the range of 5213–6672 $/kW, whereas for CSP ST it was 6084 $/kW. Incorporating a TES; despite being important for dispatchability; raises the actualized costs of PT and ST to 8258 $/kW and 9227 $/kW, respectively.
4. Conclusions
The shortcomings of relying on virtual results to economically support the set-up of CSP plants of certain types is targeted in this paper. That is, with scarce energy and economic resources in Jordan, an unsuccessful CSP plant could obliterate the future of energy security and energy independence. Therefore, relying on realistic data from built and run plants in the US, and modeling in SAM, it was concluded that CSP ST plants are considered too risky, economically wise, despite their virtual potential. The only plant in the world utility scale greater than 100 MW built and operational to support the claim of superiority of the CSP ST with TES technology vs. PT has been recently shut down after only 4 years of life producing every year less than one-quarter of the expected. This has been a total loss of almost 1 billion $US for the US taxpayers [21].
Evidenced by the underperformance of the CSP ST plants of ISEGS, without TES and with NG boost, and Crescent Dunes, incorporating a 10-hour TES, solar only, the latter conclusion was drawn. Moreover, data revealed CSP PT plants to be more appealing. Capacity factors of CSP PT plants, without TES, solar only, such as Genesis or Mojave Solar Project, are about 30%, close to their design values. Incorporating a six-hour TES, and using a larger solar field, the capacity factors of the CSP PT plant of Solana, solar only, are up to 36%. However, they still have significant differences vs. their design value of 43%. As CSP ST projects did not achieve the designed capacity factors in the US, there is no reason they can work better in Amman or Ma’an. From the US experience, selecting a CSP PT design has a better prospect for better performances and reduced costs.
The dispatchability in electricity generation points to an almost certain future direction of TES. The choice of technology is the Solana plant with possibly an increase in the capacity of energy storage to 10 h from 6 h to better match the demand after sunset and up to the first hours of the following days. While increasing the capacity of a TES does not affect too much the monthly electricity production, this is necessary for dispatchability. The TES increment is affected by the integration with other electricity sources and the pricing of the electricity.
The choice of Solana is inspired by the fact of being the only plant currently having an advantage on standard PV systems, delivering better annual average capacity factor, which is likely a smaller standard deviation attributed to the role of the TES. PV systems can deliver capacity factors in the range of 0.27–0.29 in solar energy facilities, whereas their urban implementation in rooftop installation has lower capacity factors in the range of 0.10–0.15 [27]. The results of SAM when Amman and Ma’an Solana copies were simulated using local environmental conditions demonstrated promising results. In particular, the annual average capacity factors are about 36% in Amman, around 41% in Ma’an in comparison to the one of the optimal places of a solar CSP; Gila Bend, that achieved about 39%. In the summer, the virtual plants were able to provide energy with TES up to midnight. Local conditions in Ma’an pertaining ability for future expansion to meet ever-increasing energy demands, in addition to the fact that its energy production performance exceeded Amman due to more adequate environmental conditions such as DNI and humidity, promotes it as the optimal place for a CSP in Jordan. Finally, as the reliability of the models is still minimal, a pilot plant is suggested first, before moving to a full-scale realization.
Author Contributions
W.A.-K., A.A., and A.B. analyzed the data and performed the simulations also writing the manuscript. N.A.-L. and J.N. contributed to the paper discussing the manuscript and revising the manuscript. All the authors agree on the content of the manuscript. All authors have read and agreed to the published version of the manuscript.
Funding
This research received no external funding.
Acknowledgments
The authors received no funding and they have no conflict of interest to declare.
Conflicts of Interest
The authors declare no conflict of interest.
Abbreviations
| CCGT | Combined cycle gas turbine |
| CSP | Concentrated solar power |
| DNI | Direct normal irradiance |
| EIA | Energy Information Administration |
| GHI | Global horizontal irradiation |
| HTF | Heat transfer fluid |
| HVAC | Heating, ventilation, and air conditioning |
| NG | Natural gas |
| PT | Parabolic trough |
| PV | Photovoltaic |
| SAM | System advisor model |
| SEGS | Solar energy generating systems |
| TES | Thermal energy storage |
Appendix A
Sample “Physical” Parabolic trough Model of a Solar Facility for 140 MW Rated Power and 6 h of Thermal Energy Storage Located in Ma’an, Jordan.


References
- NEPCO. Annual Report; NEPCO: Amman, Jordan, 2018. [Google Scholar]
- Al-Muhtady, A.; Alshawawra, A.; Al-Faouri, M.; Al-Kouz, W.; Al-Hinti, I. Investigation of the trends of electricity demands in Jordan and its susceptibility to the ambient air temperature towards sustainable electricity generation. Energy Sustain. Soc. 2019, 9, 1–18. [Google Scholar]
- Meteotest. METEONORM Global Meteorological Database for Engineers, Planners and Education; Meteotest AG: Bern, Switzerland, 2003. [Google Scholar]
- Mamlook, R.; Akash, B.A.; Nijmeh, S. Fuzzy sets programming to perform evaluation of solar systems in Jordan. Energy Convers. Manag. 2001, 42, 1717–1726. [Google Scholar] [CrossRef]
- Akash, O.B.; Abdo, A.M.A.; Mohsen, M.S.; Akash, B.A. A Note on Solar Energy Research in Jordan. Int. J. Appl. Eng. Res. 2016, 11, 7100–7105. [Google Scholar]
- Odeh, S.; Nijmeh, S.; Akash, B. Performance evaluation of solar-assisted double-tube evaporator heat pump system. Int. Commun. Heat Mass Transf. 2004, 31, 191–201. [Google Scholar] [CrossRef]
- Almuhtady, A.; Alfaouri, M. Synergy of intelligent design and operation for sustainable residential heating systems, case study: Jordanian residential sector. Sustain. Cities Soc. 2020, 55, 102034. [Google Scholar] [CrossRef]
- Al-Kouz, W.; Al-Dahidi, S.; Hammad, B.; Al-Abed, M. Modeling and Analysis Framework for Investigating the Impact of Dust and Temperature on PV Systems’ Performance and Optimum Cleaning Frequency. Appl. Sci. 2019, 9, 1397. [Google Scholar] [CrossRef]
- Al-Bashir, A.; Al-Dweri, M.; Al-Ghandoor, A.; Hammad, B.; Al-Kouz, W. Analysis of Effects of Solar Irradiance, Cell Temperature and Wind Speed On Photovoltaic Systems Performance. Int. J. Energy Econ. Policy 2020, 10, 353–359. [Google Scholar] [CrossRef]
- Akash, B.A.; Mamlook, R.; Mohsen, M.S. Multi-criteria selection of electric power plants using analytical hierarchy process. Electr. Power Syst. Res. 1999, 52, 29–35. [Google Scholar] [CrossRef]
- Jaber, J.O.; Elkarmi, F.; Alasis, E.; Kostas, A. Employment of renewable energy in Jordan: Current status, SWOT and problem analysis. Renew. Sustain. Energy Rev. 2015, 49, 490–499. [Google Scholar] [CrossRef]
- Hernández-Moro, J.; Martinez-Duart, J.M. Analytical model for solar PV and CSP electricity costs: Present LCOE values and their future evolution. Renew. Sustain. Energy Rev. 2013, 20, 119–132. [Google Scholar] [CrossRef]
- De Becker, K. How Sustainable is PV Solar Power. 2015. Available online: http://www.resilience.org (accessed on 15 May 2015).
- Boretti, A. Concentrated Solar Power Plants Capacity Factors: A Review, Nonlinear Approaches, in Engineering Applications Energy: Vibrations, and Modern Applications, Liming Dai; Jazar, R.N., Ed.; Springer: New York, NY, USA, 2018. [Google Scholar] [CrossRef]
- Boretti, A.; Castelletto, S.; Al-Zubaidy, S. Concentrating solar power tower technology: Present status and outlook. Nonlinear Eng. 2019, 8, 10–31. [Google Scholar] [CrossRef]
- Boretti, A. Cost and Production of Solar Thermal and Solar Photovoltaics Power Plants in the United States. Renew. Energy Focus. 2018, 26, 93–99. [Google Scholar] [CrossRef]
- Boretti, A.; Al-Zubaidy, S. A case study on combined cycle power plant integrated with solar energy in Trinidad and Tobago. Sustain. Energy Technol. Assess. 2019, 32, 100–110. [Google Scholar] [CrossRef]
- Boretti, A. Realistic expectation of electricity production from current design concentrated solar power solar tower with thermal energy storage. Energy Storage 2019, 1, e57. [Google Scholar] [CrossRef]
- Boretti, A. Energy storage needs for an Australian National Electricity Market grid without combustion fuels. Energy Storage 2019. [Google Scholar] [CrossRef]
- Boretti, A. High-frequency standard deviation of the capacity factor of renewable energy facilities—Part 1: Solar photovoltaic. Energy Storage 2020, 2, e101. [Google Scholar] [CrossRef]
- Deign, J. America’s Concentrated Solar Power Companies Have All but Disappeared. Available online: www.greentechmedia.com/articles/read/americas-concentrated-solar-power-companies-have-all-but-disappeared (accessed on 21 March 2020).
- Energy Information Administration. Electricity Data Browser—Plant Level Data. Available online: www.eia.gov/electricity/data/browser/ (accessed on 1 November 2019).
- National Renewable Energy Laboratory, Concentrating Solar Power Projects by Project Name. Available online: www.nrel.gov/csp/solarpaces/by_project.cfm (accessed on 1 November 2019).
- National Renewable Energy Laboratory, Concentrating Solar Power. Available online: solarpaces.nrel.gov/ (accessed on 1 November 2019).
- National Renewable Energy Laboratory, Andasol-1 Parabolic trough System in Aldeire, Spain. Available online: sam.nrel.gov/images/web_page_files/sam_case_csp_physical_trough_andasol-1_2013-1-15.zsam (accessed on 1 November 2019).
- National Renewable Energy Laboratory, Gemasolar Molten Salt Power Tower System in Fuentes de Andalucia, Spain. Available online: sam.nrel.gov/images/web_page_files/sam_case_csp_salt_tower_gemasolar_2013-1-15.zsam (accessed on 1 November 2019).
- Boretti, A.; Nayfeh, J.; Al-Kouz, W. Validation of SAM Modeling of Concentrated Solar Power Plants. Energies 2020, 13, 1949. [Google Scholar] [CrossRef]
- National Renewable Energy Laboratory, System Advisor Model (SAM)—NREL. Available online: sam.nrel.gov (accessed on 1 November 2019).
- Wagner, M. Modeling Parabolic Trough Systems, Jun 2014. Available online: sam.nrel.gov/images/webinar_files/sam-webinars-2014-parabolic-trough-systems.pdf (accessed on 1 November 2019).
- Blair, N.; DiOrio, N.; Freeman, J.; Gilman, P.; Janzou, S.; Neises, T.; Wagner, M. System Advisor Model (SAM) General Description (Version 2017.9.5), NREL/TP-6A20-70414. 2018. Available online: www.nrel.gov/docs/fy18osti/70414.pdf (accessed on 1 November 2019).
- Lopes, F.; Ricardo Conceição, R.; Silva, H.; Fasquelle, T.; Salgado, R.; Canhoto, P.; Collares-Pereira, M. Short-Term Forecasts of DNI from an Integrated Forecasting System (ECMWF) for Optimized Operational Strategies of a Central Receiver System. Energies 2019, 12, 1368. [Google Scholar] [CrossRef]
- Kesseli, D.; Wagner, M.; Guédez, R.; Turchi, C. CSP-Plant Modeling Guidelines and Compliance of the System Advisor Model (SAM). DRAFT SolarPACES Conference Paper. 2018. Available online: sam.nrel.gov/sites/default/files/content/documents/pdf/SolarPACES_2018_GuiSmo_DRAFT_v5.pdf (accessed on 1 November 2019).
- Wagner, M.J.; Gilman, P. Technical Manual for the SAM Physical Trough Model; NREL Report No. TP-5500-51825; OSTI.GOV: Golden, CO, USA, 2011; p. 124. Available online: www.nrel.gov/docs/fy11osti/51825.pdf (accessed on 1 November 2019).
- Turchi, C.; Neises, T. Parabolic Trough Solar-Thermal Output Model Decoupled from SAM Power Block Assumptions. Milestone Report Prepared for the U.S. Department of Energy. 2015. Available online: sam.nrel.gov/sites/default/files/content/user-support/DOE%20Milestone%20Report%20-%20Stand-alone%20Parabolic%20Trough%20code%202015-03-30.pdf (accessed on 1 November 2019).
- Hussien, A.A.; Abdullah, M.Z.; Yusop, N.M.; Al-Kouz, W.; Mahmoudi, E.; Mehrali, M. Heat Transfer and Entropy Generation Abilities of MWCNTs/GNPs Hybrid Nanofluids in Microtubes. Entropy 2019, 21, 480. [Google Scholar] [CrossRef]
- Hader, M.; Al-Kouz, W. Performance of a hybrid photovoltaic/thermal system utilizing water-Al 2O3 nanofluid and fins. Int. J. Energy Res. 2018, 43, 219–230. [Google Scholar] [CrossRef]
- Genesis solar energy project. Available online: solarpaces.nrel.gov/genesis-solar-energy-project (accessed on 1 November 2019).
- Mojave Solar Project. Available online: solarpaces.nrel.gov/mojave-solar-project (accessed on 1 November 2019).
- Solana Generating Station. Available online: solarpaces.nrel.gov/solana-generating-station (accessed on 1 November 2019).
- Globalsolaratlas, Info. Available online: globalsolaratlas.info (accessed on 1 November 2019).
- EU. Photovoltaic Geographical Information System. Available online: re.jrc.ec.europa.eu/pvg_tools/en/tools.html#TMY (accessed on 1 November 2019).
- National Renewable Energy Laboratory, Parabolic Trough System with Molten Salt HTF. Available online: sam.nrel.gov/images/webinar_files/sam-webinars-2014-parabolic-trough-2015-1-30.sam (accessed on 1 November 2019).
- Boretti, A.; Nayfeh, J.; Al-Kouz, W. Computation of storage power and energy to stabilize a wind-and-solar-only Australian National Electricity Market grid. Energy Storage 2020. [Google Scholar] [CrossRef]
- Boretti, A. High-frequency standard deviation of the capacity factor of renewable energy facilities—Part 2: Wind. Energy Storage 2020, 2, e100. [Google Scholar] [CrossRef]
- Weatherspark, World Weather. Available online: weatherspark.com (accessed on 1 November 2019).


© 2020 by the authors. Licensee MDPI, Basel, Switzerland. This article is an open access article distributed under the terms and conditions of the Creative Commons Attribution (CC BY) license (http://creativecommons.org/licenses/by/4.0/).