Article

Research on the Pressure Dropin Horizontal Pneumatic Conveying for Large Coal Particles

1
School of Mechatronic Engineering, Jiangsu Normal University, Xuzhou 221116, China
2
Research and Development Centre, Jiangsu Kampf Machinery Technology Co. LTD, Xuzhou 221116, China
*
Author to whom correspondence should be addressed.
Processes 2020, 8(6), 650; https://doi.org/10.3390/pr8060650
Submission received: 17 April 2020 / Revised: 26 May 2020 / Accepted: 28 May 2020 / Published: 30 May 2020

Abstract

:
As a type of airtight conveying mode, pneumatic conveying has the advantages of environmental friendliness and conveying without dust overflow. The application of the pneumatic conveying system in the field of coal particle conveying can avoid direct contact between coal particles and the atmosphere, which helps to reduce the concentration of air dust and improve environmental quality in coal production and coal consumption enterprises. In order to predict pressure drop in the pipe during the horizontal pneumatic conveying of large coal particles, the Lagrangian coupling method and DPM (discrete particle model) simulation model was used in this paper. Based on the comparison of the experimental results, the feasibility of the simulation was verified and the pressure drop in the pipe was simulated. The simulation results show that when the flow velocity is small, the simulation results of the DPM model are quite different from that of the experiment. When the flow velocity is large, the large particle horizontal pneumatic conveying behavior predicted by the model is feasible, which can provide a simulation reference for the design of the coal pneumatic conveying system.

1. Introduction

Coal is an important fossil energy and many countries have strong dependence on coal resources [1]. The open-conveying way is the most common conveying way for coal particles. The main conveying equipment is a belt conveyor. In the process of mining, unloading, separation and conveying, the pulverized coal and dust escape into the air, causing environmental pollution and serious dust explosion accidents [2]. The coal particles come in direct contact with the atmosphere, which leads to coal dust diffusion, pollution of the surrounding environment, waste of resources and coal dust explosion accidents [3].
How to convey coal cleanly, efficiently and safely has become an urgent environmental problem, one that needs to be solved. It also puts forward higher requirements for environmental protection, economy and reliability of coal conveying equipment. As a kind of airtight conveying mode, pneumatic conveying has the advantages of environmental friendliness and no-dust overflow [4]. Applying the pneumatic conveying system to the field of coal particle conveying can avoid the direct contact between coal particles and the atmosphere [5]. It is of great significance to improve the surrounding environment of coal enterprises, avoid safety production accidents and realize the green use of coal resources.
Many scholars have made contributions in the field of particle pneumatic conveying. Rabinovich [6] proposed the generalized flow pattern of vertical pneumatic conveying and a fluidized bed system that considers the effects of particle and gas properties, pipe diameter and particle concentration. Pahk [7] studied the friction between the plug and the pipe wall in the dense phase pneumatic conveying system. The results showed that the friction between the plug and the pipe wall increased with the contact area, and the friction between the spherical particles was greater than that of the cylindrical particles. Njobuenwu [8] used the particle trajectory model and wear model to predict the wear of elbows with different square sections in dilute particle flow. The results show that the maximum wear position is in the range of 20°–35° of elbows. Watson [9] carried out the vertical pneumatic conveying test of alumina particles with a particle size of 2.7 mm, measured the solid-phase mass flow rate, gas-phase mass flow rate and inlet and outlet pressure, as well as the pressure distribution and other parameters, and proved that the dense plug flow pneumatic conveying system has advantages in conveying coarse particles. Ebrahimi [10] established a horizontal pneumatic conveying test-bed based on a laser Doppler velocimeter, and carried out the conveying experiments of spherical glass powder with particle size of 0.81 mm, 1.50 mm and 2.00 mm. Ogata [11] studied the influence of different glass particle properties on the fluidization dense-phase pneumatic conveying system in a horizontal rectangular pipeline. Makwana [12] studied the causes of the fluctuation of the pneumatic conveying in the horizontal pipeline and showed that the pressure loss in the pipeline increased sharply with the formation of sand dunes, and the pressure drop value was related to the axial position of sand dunes. Anantharaman [13] studied the relationship between particle size, density, sphericity and minimum pickup speed of particles in the pneumatic conveying system and showed that the influence of particle size on pickup speed is greater than that of particle density. Akira [14,15] compared the pneumatic conveying system with a soft wing and sand dune model with the traditional pneumatic conveying system and showed that the pressure loss of the pneumatic conveying system with a soft wing and sand dune model was less than that of the traditional pneumatic conveying system at low air speed. Yang [16] carried out simulation and experimental research on the pneumatic suspension behavior of large irregular coal particles and obtained the suspension speed of coal particles under different particle sizes. Yang [17,18] studied the influence of structural parameters of a coal particle gas–solid injection feeder on the pure flow field injection performance and particle injection performance through multi- factor orthogonal experiments.
Previous work in the field has looked at fine particle [19,20], powder [21,22] and seed [23,24], all of which are less than 5 mm in size and are within the range of Geldart A to Geldart C. However, there are a few studies on large sizes (larger than Geldart D) [25,26]. When using the common computational fluid dynamics and discrete element method (CFD-DEM) simulation, due to the coupling method between the discrete element method and the finite element method, the simulation time is long and there is a lot to calculate, so it is difficult to get the results quickly. In order to quickly predict the pressure drop in horizontal pneumatic conveying for large (5–25 mm) coal particles, this paper uses the coupling method based on the Euler–Lagrange approach, DPM (discrete particle model) and the particle trajectory equations. The experiment and the simulation of horizontal pneumatic conveying for large coal particles was carried out to verify the feasibility of the simulation method. The multi-factor simulations were carried out to analyze the effects of particle size, flow field velocity, solid-gas rate and pipe diameter on pressure drop.

2. Theory

The flow field provides the energy required by the particles’ motion, and the exchange of momentum and energy between the flow field and particles occurs in the pneumatic conveying flow field. In the Euler–Lagrange approach, the fluid phase is treated as a continuum by solving the Navier–Stokes equations, while the dispersed phase is solved by tracking a large number of particles through the calculated flow field. The dispersed phase can exchange momentum, mass and energy with the fluid phase.

2.1. Gas Phase Equations

The gas phase is a continuous medium, considering the influence of solid phase to flow field, and the continuity equation adds the volume fraction term ξ to exclude the gas volume occupied by the solid phase. It is assumed that the temperature of both gas and solid phases in pneumatic conveying is the same as that of the atmosphere, and no exothermic reaction occurs between the two phases. Therefore, the energy equation of gas and solid phases can be ignored.
(1)
Gas phase continuity equation
According to the law of mass conservation, the gas phase continuity equation can be obtained and is shown in Equations (1) and (2).
ξ ρ t + ρ ε v = 0 ;
x i + y j + z k ,
where ρ is the density of gas phase, v is the velocity of gas phase and ξ is the volume fraction term.
(2)
Gas phase momentum equation
The momentum equation of the gas phase can be obtained from the law of momentum conservation, which is similar to the continuity equation.
ξ ρ v t + ρ ξ μ v = ρ + ( ξ μ v ) + ρ ξ g S m .
The momentum transfer Sm refers to the sum of the fluid drag in the fluid unit.
S m = F d V .
(3)
Turbulence transmission equations
The Realizable k-ε model [27] has the advantage of a more accurate prediction for the divergence ratio of flat and cylindrical jets, and its transmission equations are shown in Equations (5)–(7).
t ( ρ k ) + x j ( ρ k v j ) = x j [ ( μ + μ t σ k ) k x j ] + G k + G b ρ ε Y M + S k ;
t ( ρ ε ) + x j ( ρ ε v j ) = x j [ ( μ + μ t σ ε ) ε x j ] + ρ C 1 S ε ρ C 2 ε 2 k + v ε + C 1 ε C 3 ε G b ε k + S ε ;
where
{ C 1 = max [ 0.43 , η η + 5 ] η = 2 S i j S i j k ε .

2.2. Motion Equations of Solid Phase

The solid phase is a discrete phase as the motion law of solid particles obeys Newton’s second law.
(1)
Particle Force Balance
The trajectory of the solid phase is predicted by integrating the force balance on the particle which is written in a Lagrangian reference frame. This force balance equates the particle inertia with the forces acting on the particle and can be written as
d u p d t = u u p τ r + g ( ρ p ρ ) ρ p + F ,
where F is an additional acceleration term, g is the force of gravity on the particle, u u p τ r is the drag force per unit particle mass and τ r is the particle relaxation time [28], which is defined as
τ r = ρ p d p 2 18 μ 24 C d Re ,
where u is the fluid phase velocity, u p is the particle velocity, μ is the molecular viscosity of the fluid, ρ is the fluid density, ρ p is the density of the particle and d p is the particle diameter. Re is the relative Reynolds number, which is defined as
Re ρ p d p | u u p | μ .
For non-spherical particles, Haider and Levenspiel [29] developed the correlation
C D = 24 Re s p h ( 1 + b 1 Re s p h b 2 ) + b 3 Re s p h b 4 + Re s p h ,
where
b 1 = exp ( 2.3288 6.4581 ϕ + 2.4486 ϕ 2 ) ; b 2 = 0.0964 + 0.5565 ϕ ; b 3 = exp ( 4.9050 13.8944 ϕ + 18.4222 ϕ 2 10.2599 ϕ 3 ) ; b 4 = exp ( 1.4681 + 12.2584 ϕ 20.7322 ϕ 2 + 15.8855 ϕ 3 ) .
The shape factor ϕ is defined as
ϕ = s S ,
where s is the surface area of a sphere having the same volume as the particle and S is the actual surface area of the particle.
The additional forces F in the particle force are virtual mass and pressure gradient forces which are not important when the density of the fluid is much lower than the density of the particles. For this study, the virtual mass and pressure gradient forces are ignored.
(2)
Particle Torque Balance
Particle rotation is a natural part of particle motion and can have a significant influence on the trajectory of a particle moving in a fluid. The impact is even more pronounced for large particles with high moments of inertia. In this case, if particle rotation is disregarded in simulation studies, the resulting particle trajectories can significantly differ from the actual particle paths. The torque T results from equilibrium between the particle inertia and the drag.
T = I p d ω p d t = ρ f 2 ( d p 2 ) 5 C ω Ω ,
where I p is the moment of inertia, ω p is the particle angular velocity, ρ f is the fluid density, d p is the particle diameter, C ω is the rotational drag coefficient, T is the torque applied to a particle in a fluid domain and Ω is the relative particle–fluid angular velocity calculated by:
Ω = 1 2 × u f ω p .
The particles will have impact with the wall and other particles in the pipe. The collision recovery factor is obtained by Forder’s recovery factor equations [30].
e n = 0.988 0.78 θ + 0.19 θ 2 0.024 θ 3 + 0.027 θ 4 ; e r = 1 0.78 θ + 0.84 θ 2 0.21 θ 3 + 0.028 θ 4 0.022 θ 5 ,
where en is the normal recovery factor, er is the tangential recovery factor and θ is the impact angle.

3. Simulations

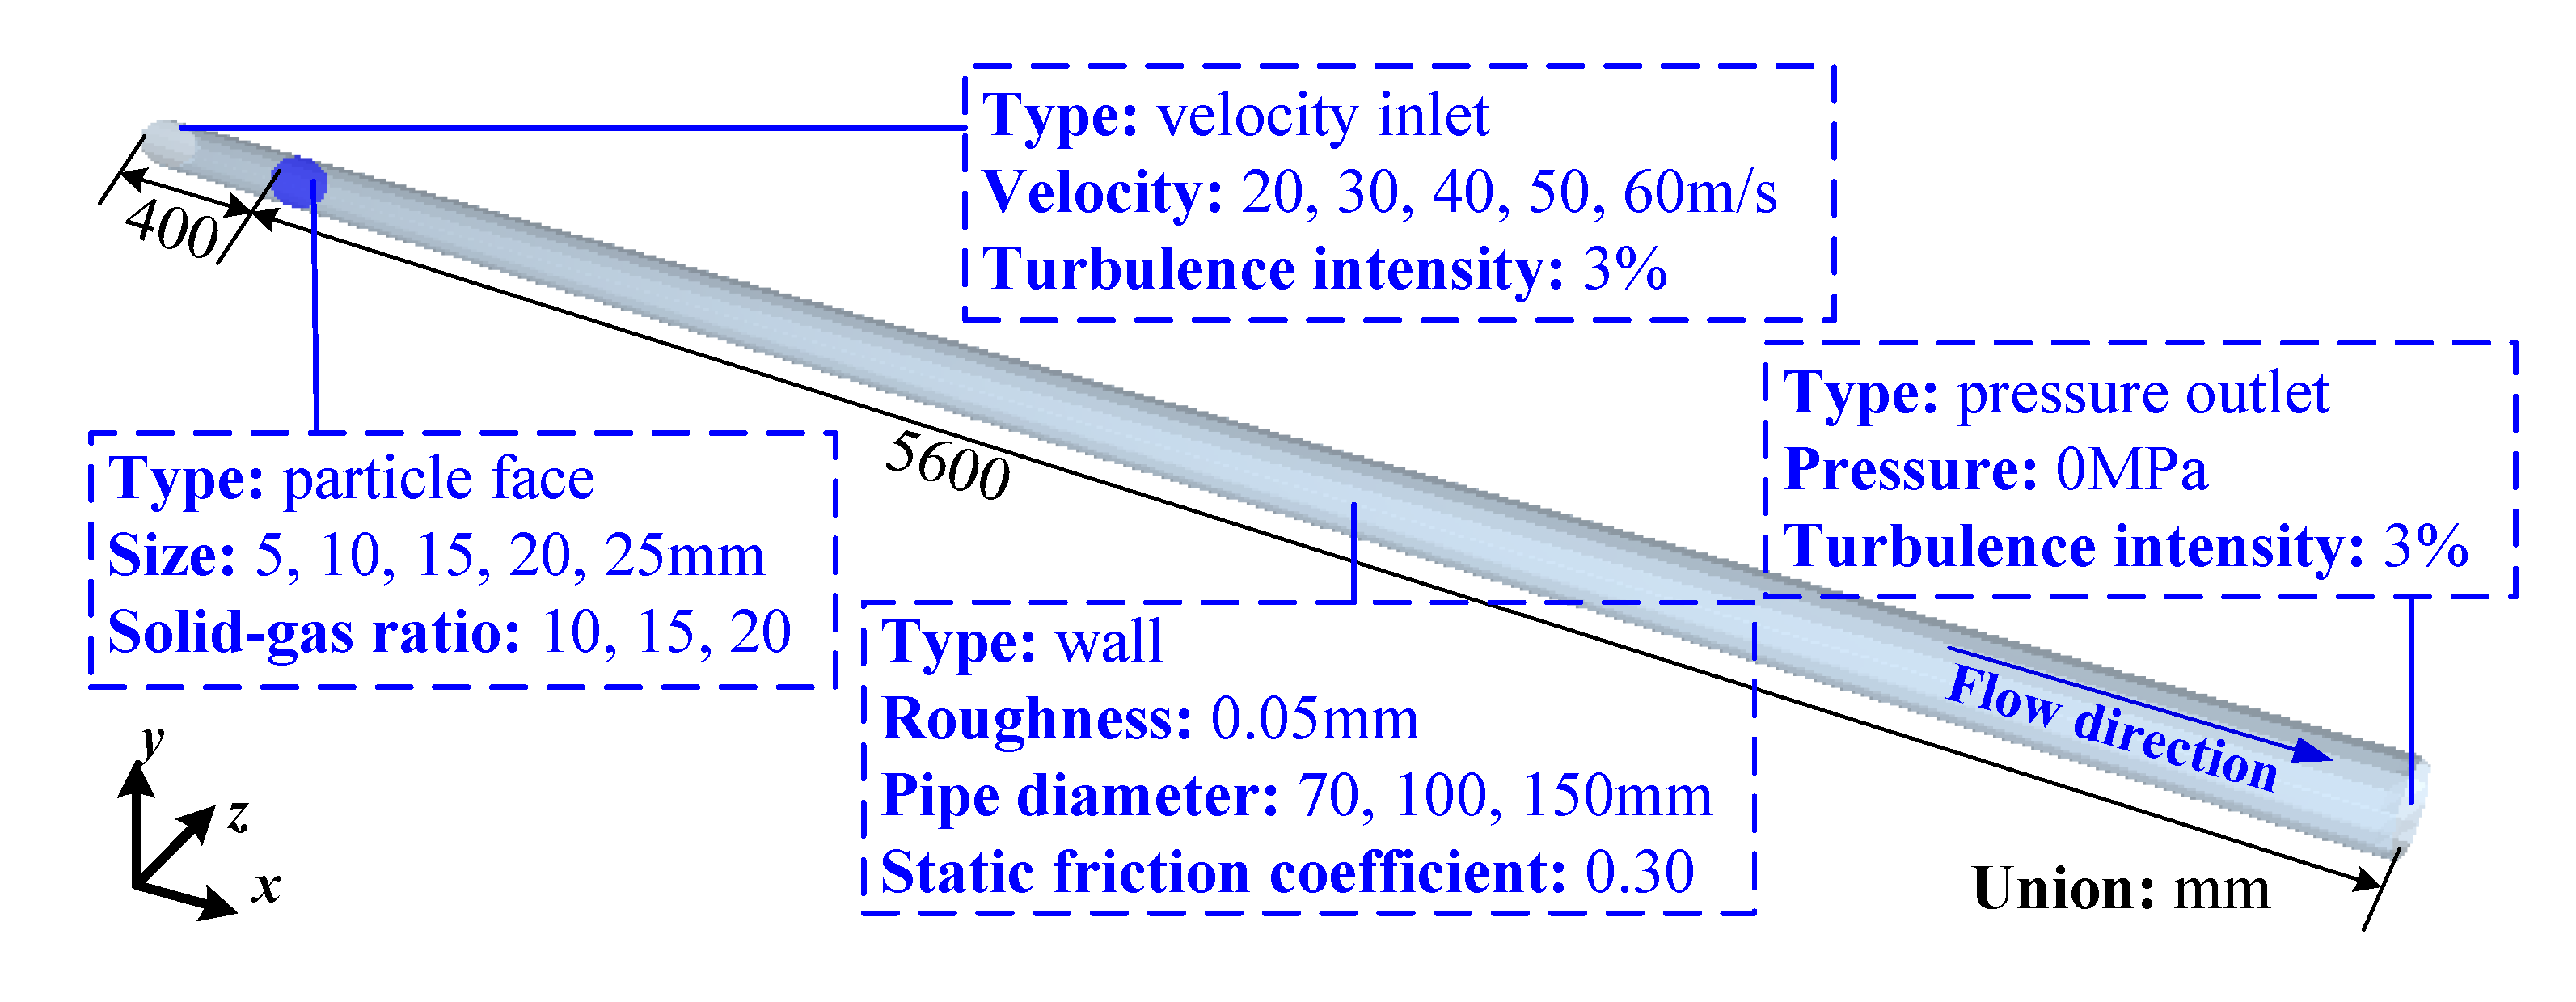
3.1. Simulation Model

The Euler–Lagrange approach, DPM and the two-way coupling method were used in the simulations. The boundary conditions and injection parameters are shown in Figure 1. The simulation pipe diameters were 70, 100 and 150 mm, and the length was 6 m. The wall roughness of seamless steel pipes used in the experiments was 0.05 mm. The particle density was 2100 kg/m3.The solid-gas rate was the ratio of the particle’s mass flow ratio between the air mass flow ratio during pneumatic conveying. The particles were injected into the pipe inlet uniformly. The transmission medium was air, which was considered an incompressible gas. The gas density was 1.225 kg/m3 and the dynamic viscosity was 1.8 × 10⁻⁵ kg/m3 (20 °C, 1 atm).
The DPM model is based on ANSYS FLUENT and the meshes of the simulation models are the hexahedral orthogonal meshes. The simulation considered the interaction between the gas and particle phase; however, the shape characteristics of particles was ignored.

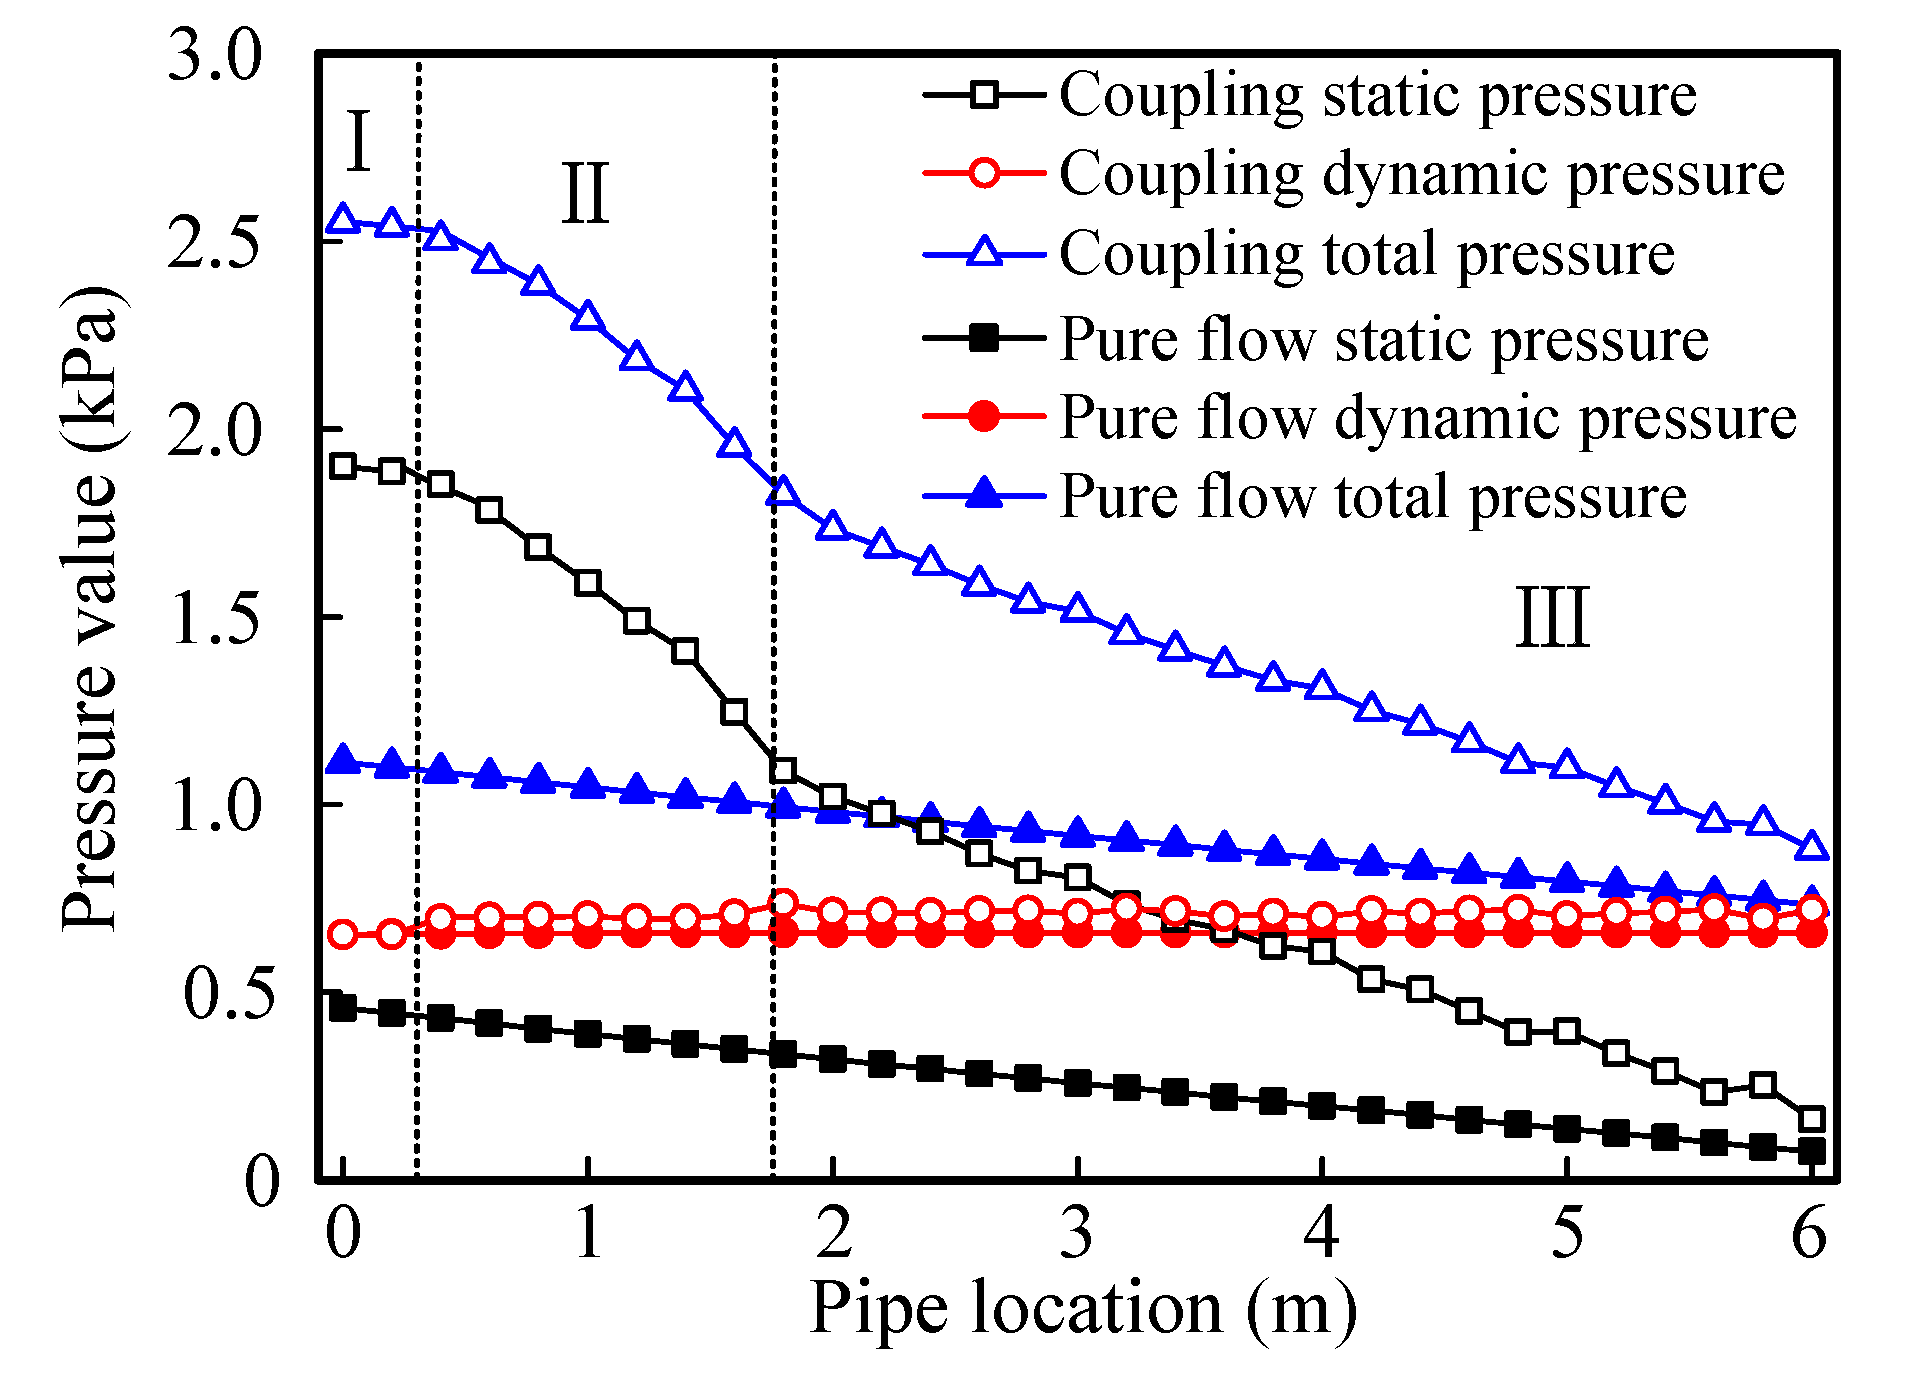
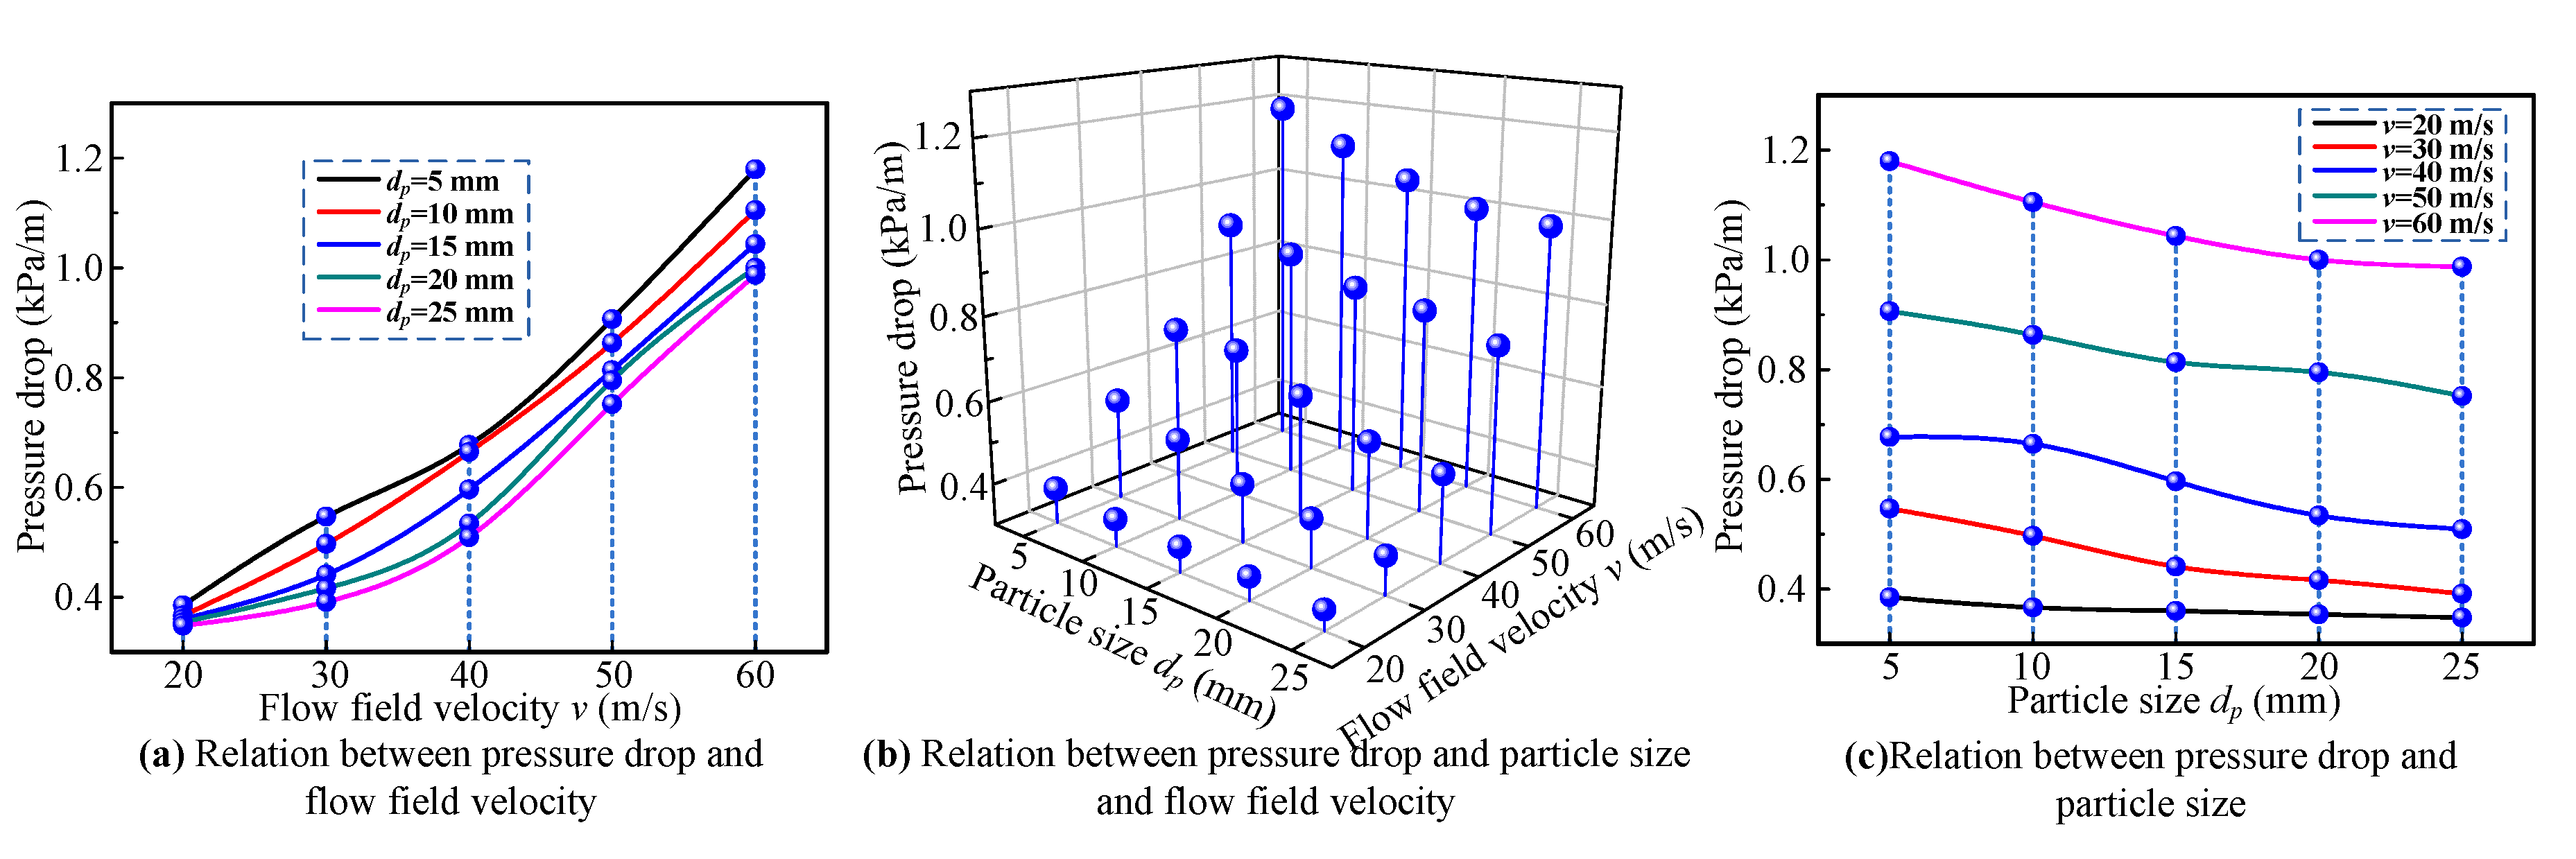
3.2. Effects of Particle Size and Flow Field Velocity on Pressure Drop

The different particle sizes and flow field velocities were used in the simulations to obtain the effects of particle size and flow field velocity on pressure drop. The simulation parameters are shown in Table 1.
As an example, the variation trend of pressure drop was analyzed by taking the simulation results under the condition of 10 mm particle size and 50 m/s flow field velocity. The variation trend in the stable conveying part in the horizontal conveying pipe is shown in Figure 2. The coupled static pressure, the coupled dynamic pressure and the coupled total pressure refer to the coupling simulation process of the coal particles and the flow field, while the pure flow static pressure, the pure flow dynamic pressure and the pure flow total pressure refer to the simulation process of pure flow fluid conveying.
Both in coupling and pure flow simulation results, the changes of dynamic pressure were small, which means there was a small change of flow field velocity. The change of the flow field total pressure was mainly due to the change of static pressure. The coupling static pressure and coupling total pressure curves can be divided into three regions. Region I is the pure flow region, region II is the particle dropping and rebounding region and region III is the stable conveying region. Region I is behind the particle factory. Since there is no particle formation, it is still the pure fluid field, meaning the slope of static pressure drop is the same as that of pure flow static pressure. At region II, the particles start to form and exchange momentum and energy with the flow field. Since particles are randomly generated in the particle factory, the interaction between the particles and the flow field is sufficient when the particles enter the flow field. There is an initial collision between particles and wall, so the static pressure of this region declines faster than other regions and the energy conversion efficiency between the flow fluid and the particles is also the highest. Region III is in a stable conveying stage-the particles have sufficient velocity and the particle–particle collisions and the particle–wall collisions are basically in a stable and eased off state. This means the static pressure drop trend of the flow field is to slow down. The unit distance static pressure drop (hereinafter referred to as the pressure drop) of region III under different particle size and flow field velocity is shown in Figure 3.
The pressure drop increases with the flow field velocity and decreases with the particle size. At a lower flow field velocity (v = 20 m/s), the difference in pressure drop under different sizes is small. This is because the flow field is stratified due to the small flow field velocity. Only some particles participate in the interaction with flow field, so the particle size has a small effect on the pressure drop. The stratification state of flow field disappears gradually with the flow velocity, and more particles participate in the interaction with the flow field. However, under the same feeding rate, the smaller the particle size, the higher the number of particles and the easier the interaction with the flow field. More particle collisions probability result in more energy consumption of particles. Therefore, the pressure drop is also higher. However, when the particle size is larger, the number of particles is smaller and the probability of particle collisions is less. This means the energy consumption of particles is also less, which leads the pressure to continue dropping. When the flow velocity increases further, the particle collision probability is more severe. The more energy consumption that is needed leads to a greater pressure drop.

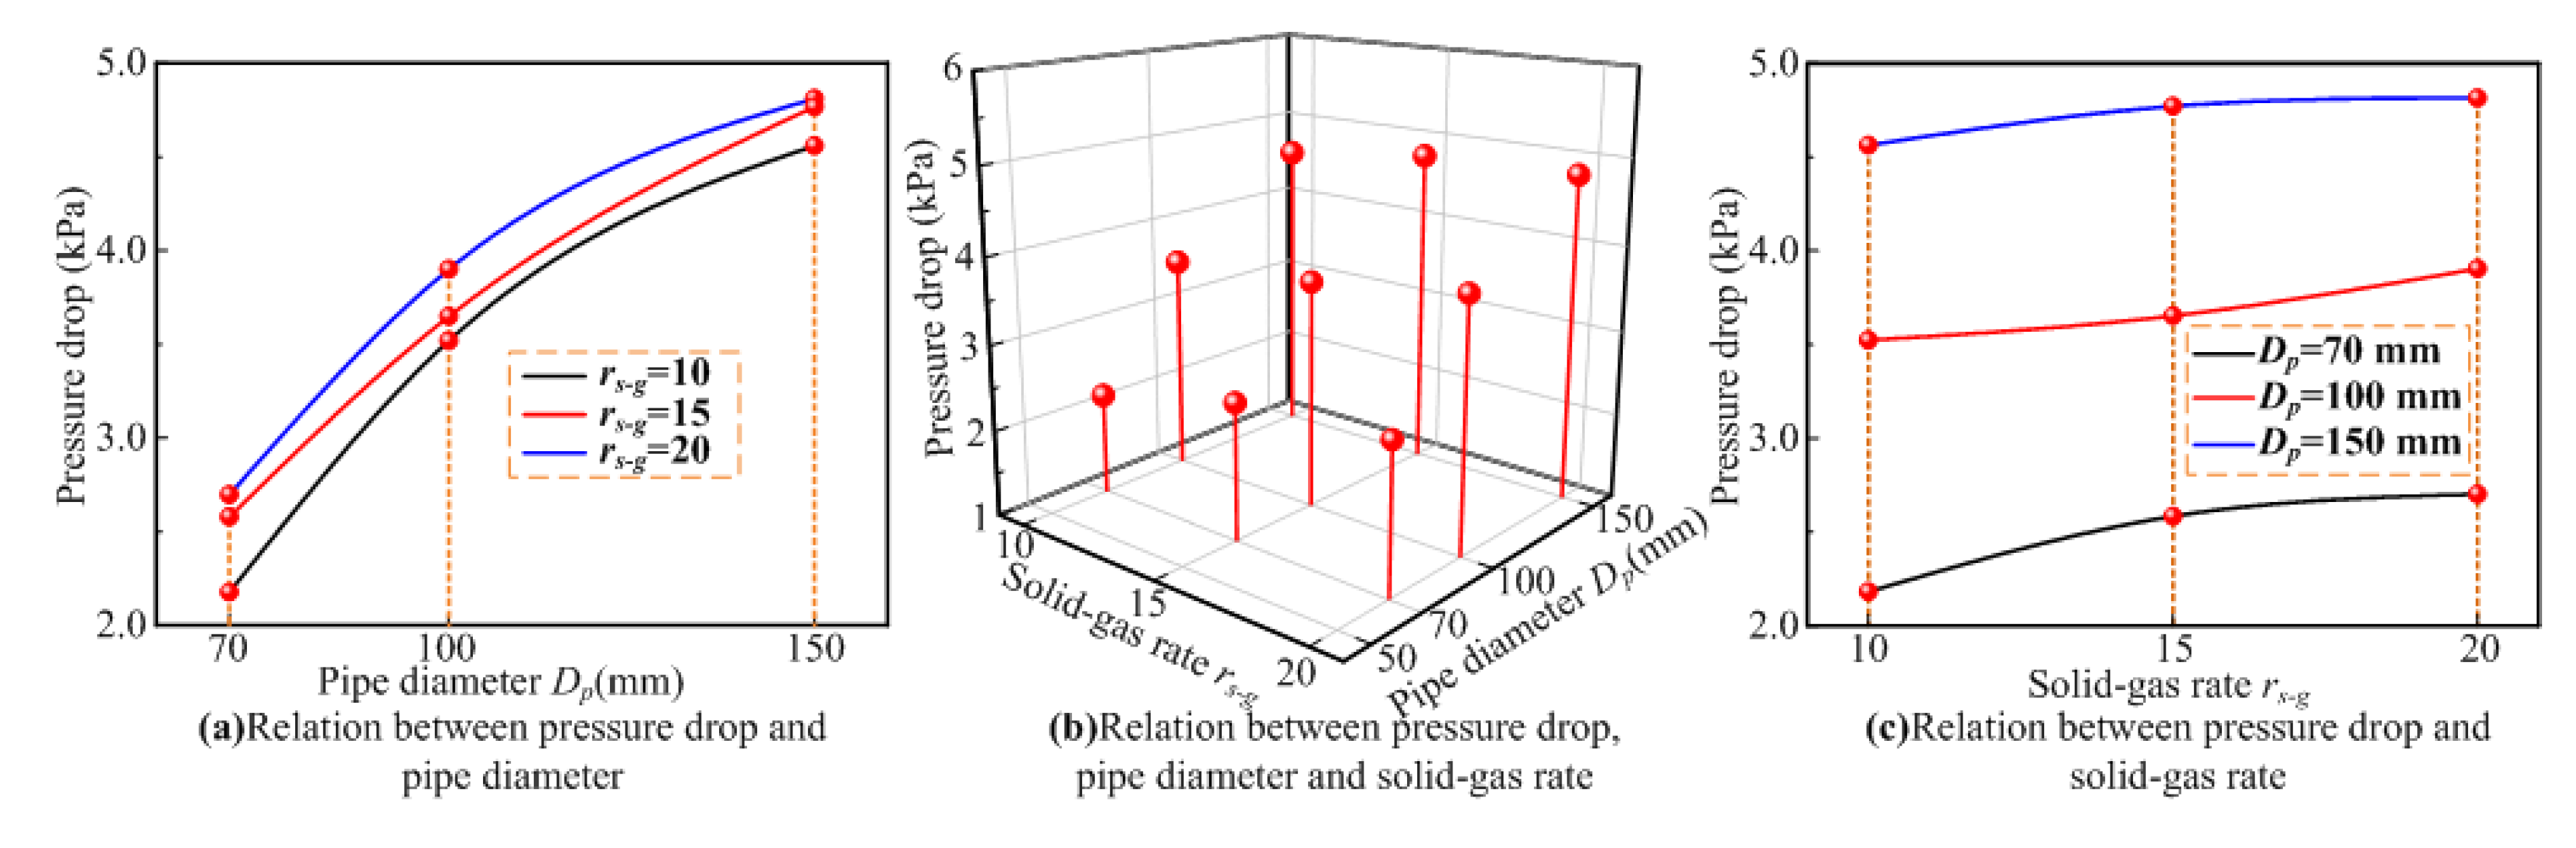
3.3. Effects of Pipe Diameter and Solid-Gas Ratio on Pressure Drop

The different solid-gas rates and pipe diameters were used in the simulations to obtain the effects of pipe diameter and solid-gas ratio on pressure drop. The simulation parameters are shown in Table 2. The relationship between pressure drop, pipe diameter and solid-gas rate is shown in Figure 4.
The pressure drop increases with the pipe diameter and the solid-gas rate. Under the same solid-gas ratio, the pressure drop increases greatly with the pipe diameter. This is because the mass flow rate of the flow field increases with the pipe diameter under the fixed flow field velocity. The mass flow rate of particles increases with the flow field due to the fixed solid-gas rate, which leads to a significant increase in pressure drop. The influence of the solid-gas rate on pressure drop is less than that of pipe diameter, but the increase of the solid-gas rate makes the mass flow rate of particles and the pressure drop of the flow field increase. The pressure drop increases slightly with the solid-gas rate under the same pipe diameter Dp = 100 and 150 mm. It is because there is enough space for the particles (size = 15 mm) to move in the large diameter pipe when the solid-gas rate increases, so the increment of collision probability is less. The pressure drop increases greatly with the solid-gas rate under the pipe diameter Dp = 70 mm. This is because the small pipe diameter and the increase of solid-gas rate both cause an increase in collision probability. The increase of the solid-gas rate leads to an increase in collision probability and also leads to high energy consumption and a drop in pressure.

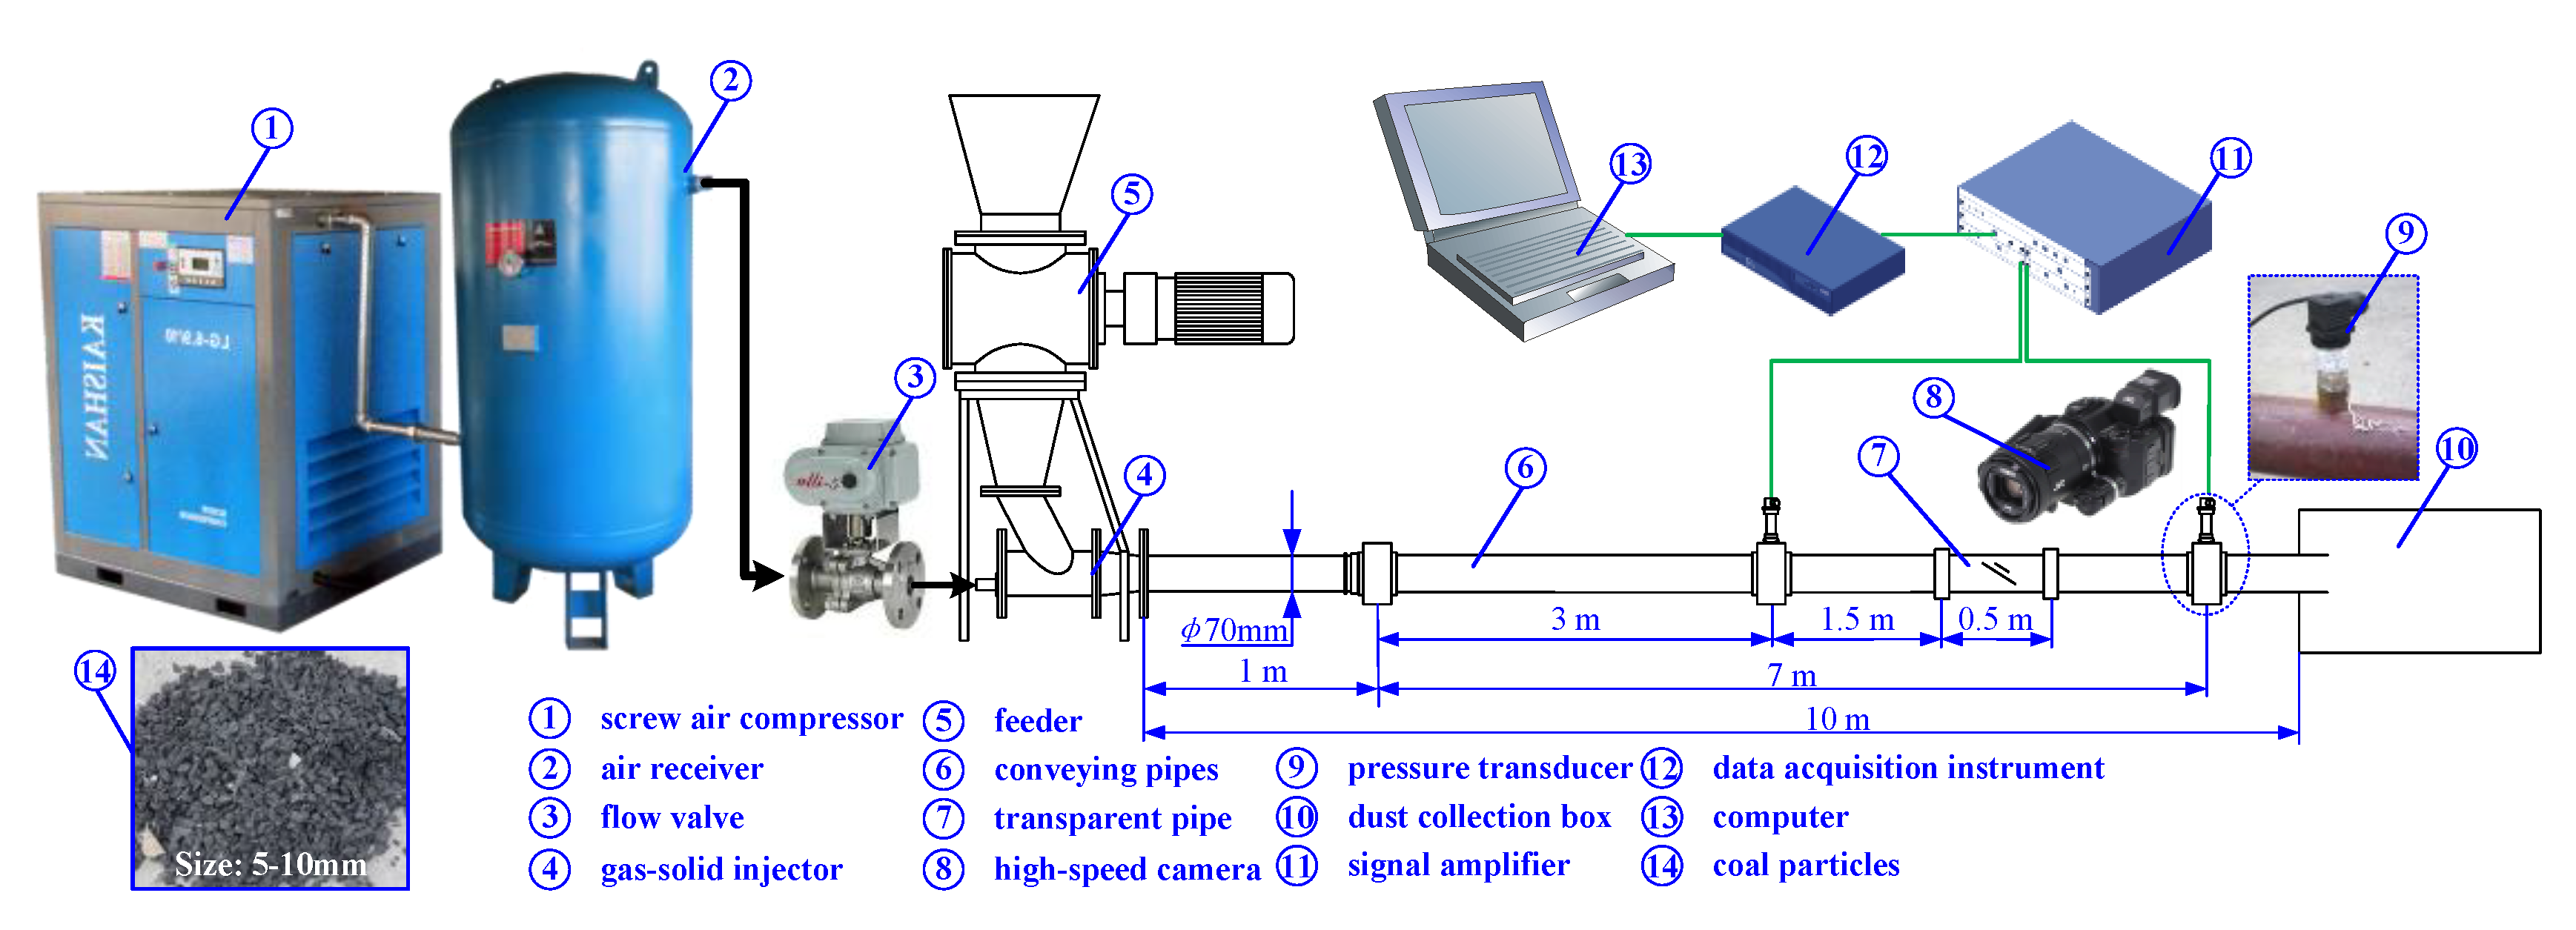
4. Experimental Verification

The experimental system of horizontal pneumatic conveying is shown in Figure 1. The total length of the conveying pipelines was 10 m and the diameter was 70 mm. The test system included two pressure transducers, a signal amplifier, a data acquisition instrument and a computer. The position of two pressure transducers and one transparent pipe is shown in Figure 5.
The air flow is pressurized by the screw air compressor and stabilized by the air receiver which enters into the gas-solid injector through the flow valve. The coal particles gain kinetic energy from air flow and are conveyed into the dust collection box through conveying pipes. There is some back pressure in the dust collection box, but far less than the pressure of air flow. Therefore, the dust collector can be considered as atmospheric pressure. The first pressure transducer is installed 3 m from the outlet of the gas-solid injector and the second is 4 m downstream of the first pressure transducer. The transparent pipe is installed 1.5 m downstream of the first pressure transducer to monitor the particle motion state.
When the output pressure of the air compressor is certain, the opening of the flow valve determines the air flow rate in the pipe. It is called a pure flow field when no particles enter. However, when the particles do enter the flow field, some of flow field dynamic pressure turns to static pressure to transfer momentum and energy to the particles. At this point, it amounts to add back pressure into the pipe. As result, the air flow rate will be reduced by this back pressure. Therefore, the air flow rate of the pure flow field is regarded as the reference standard in the experiments. When the particles enter into the flow field, the opening of the flow valve will be appropriately increased to complement the reduction.
The size of experimental coal particles was 5–10 mm and the feeding rate was controlled by the frequency converter. The mass density of the experimental coal particle was 2100 kg/m3. The experimental scheme is shown in Table 3.

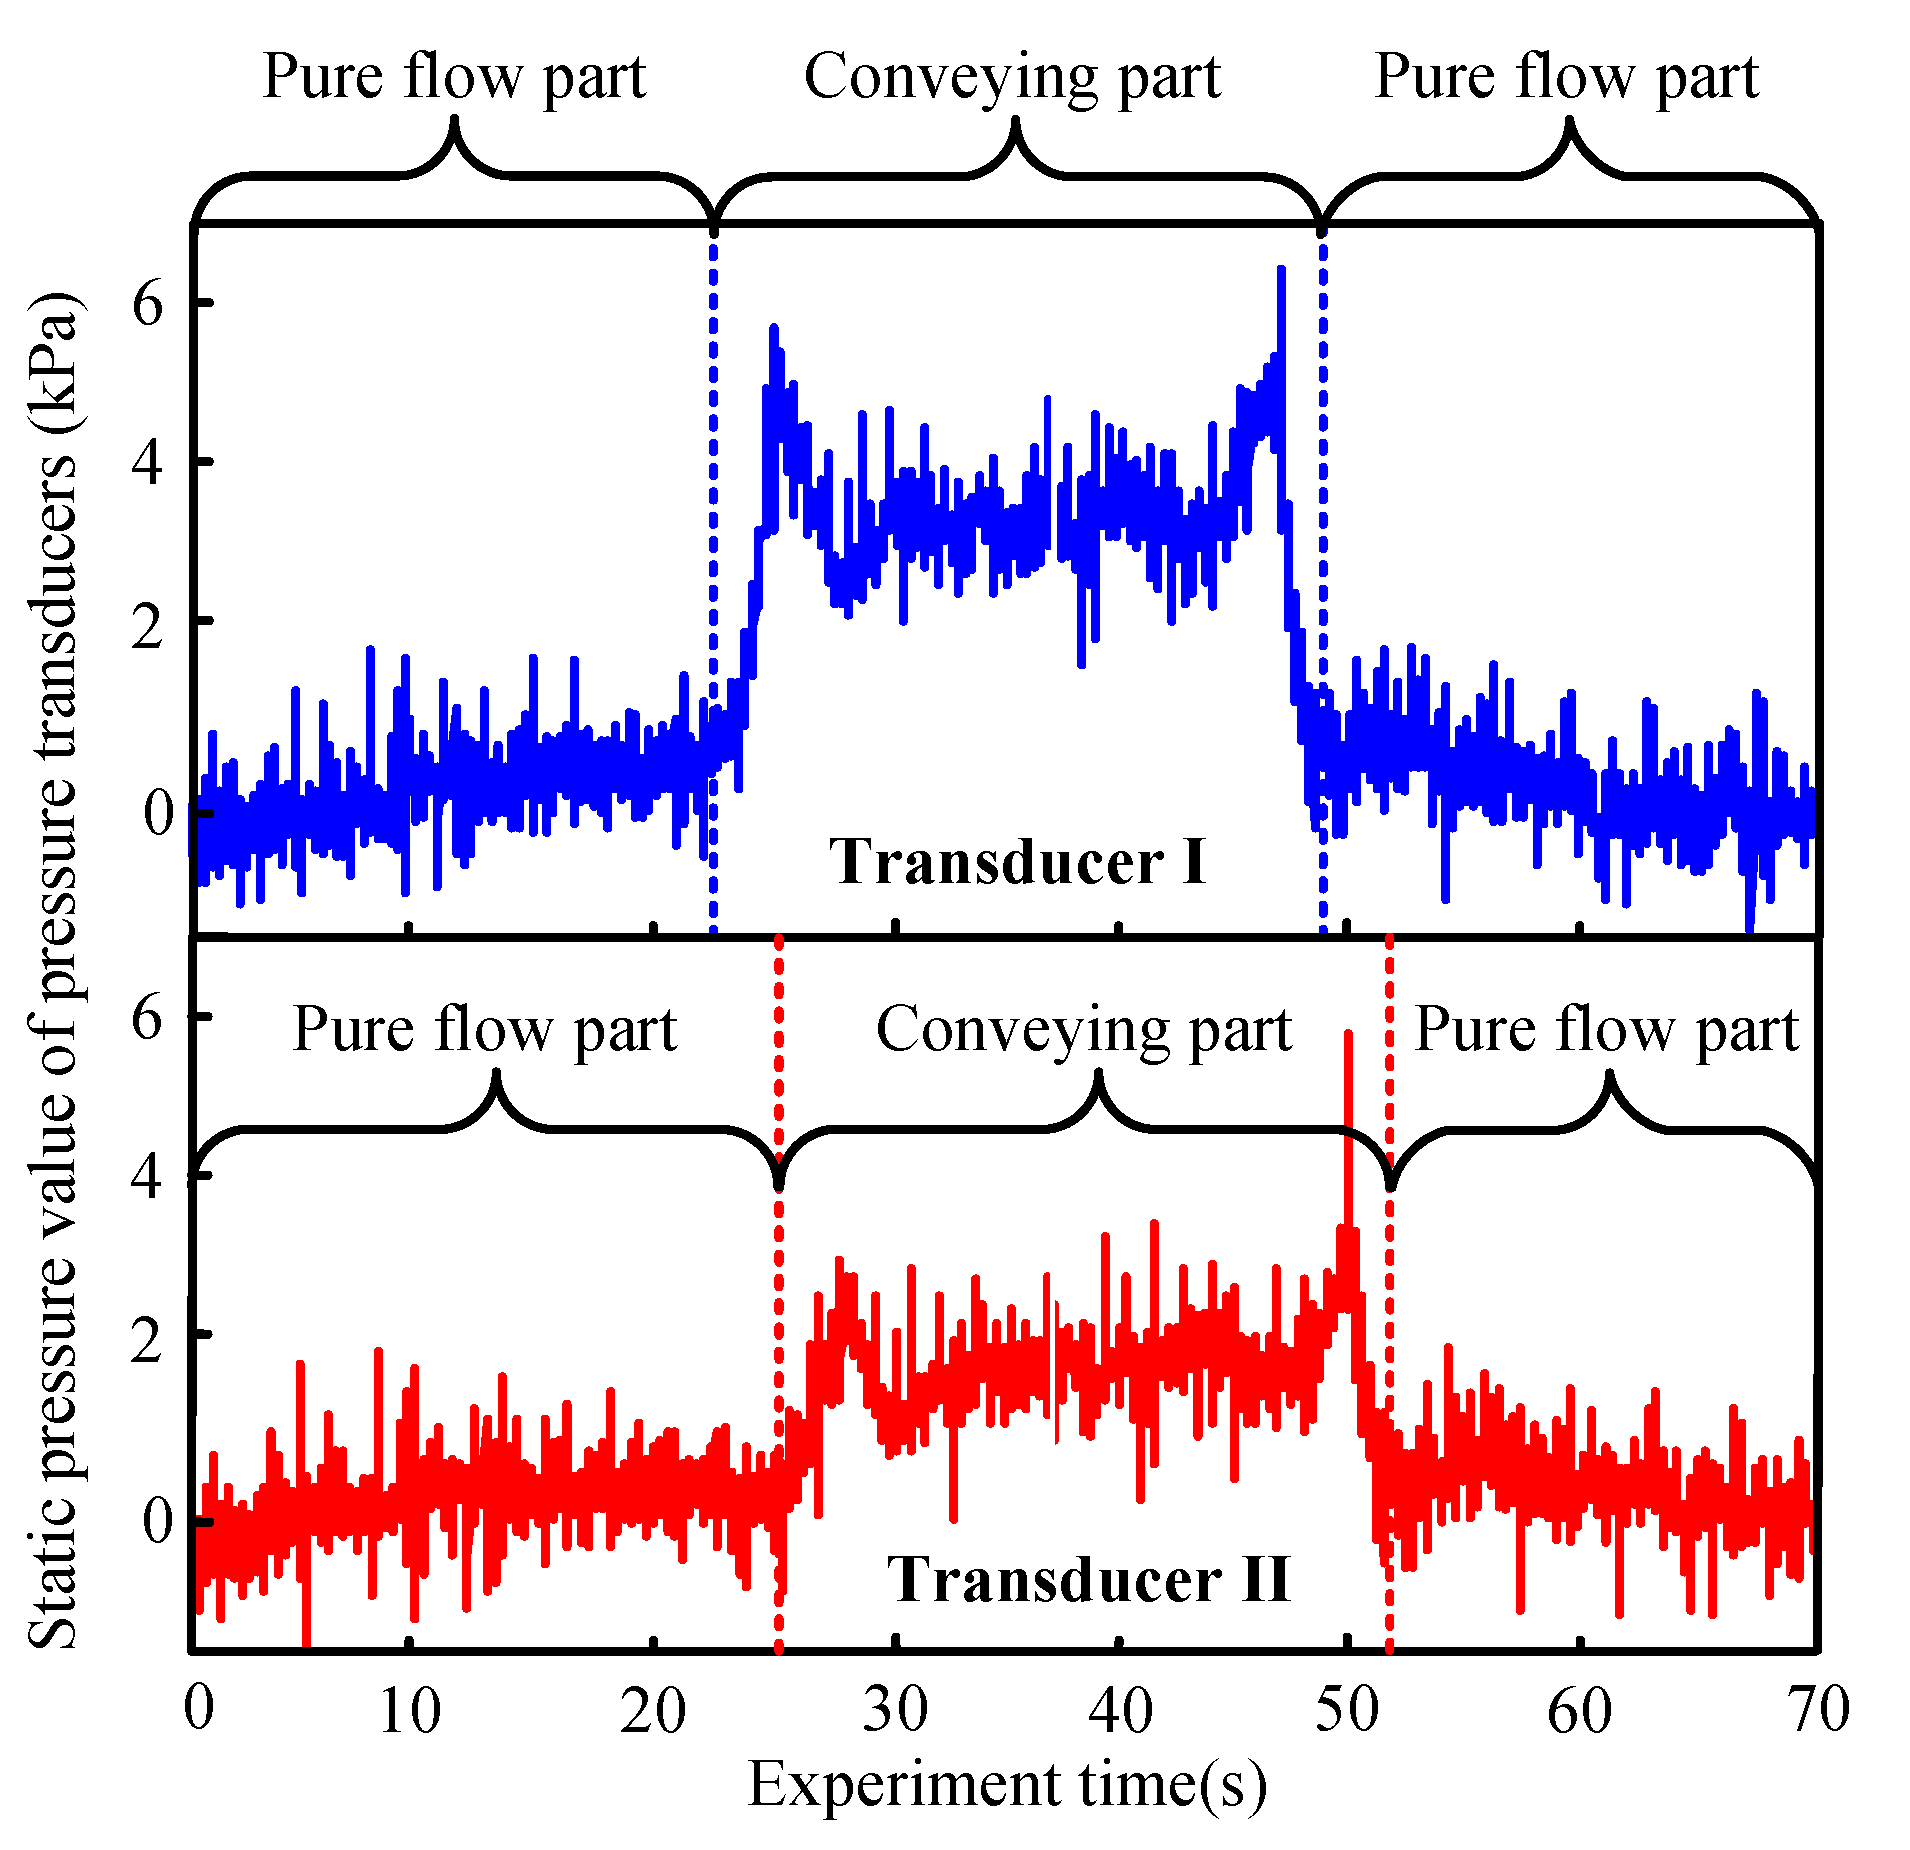
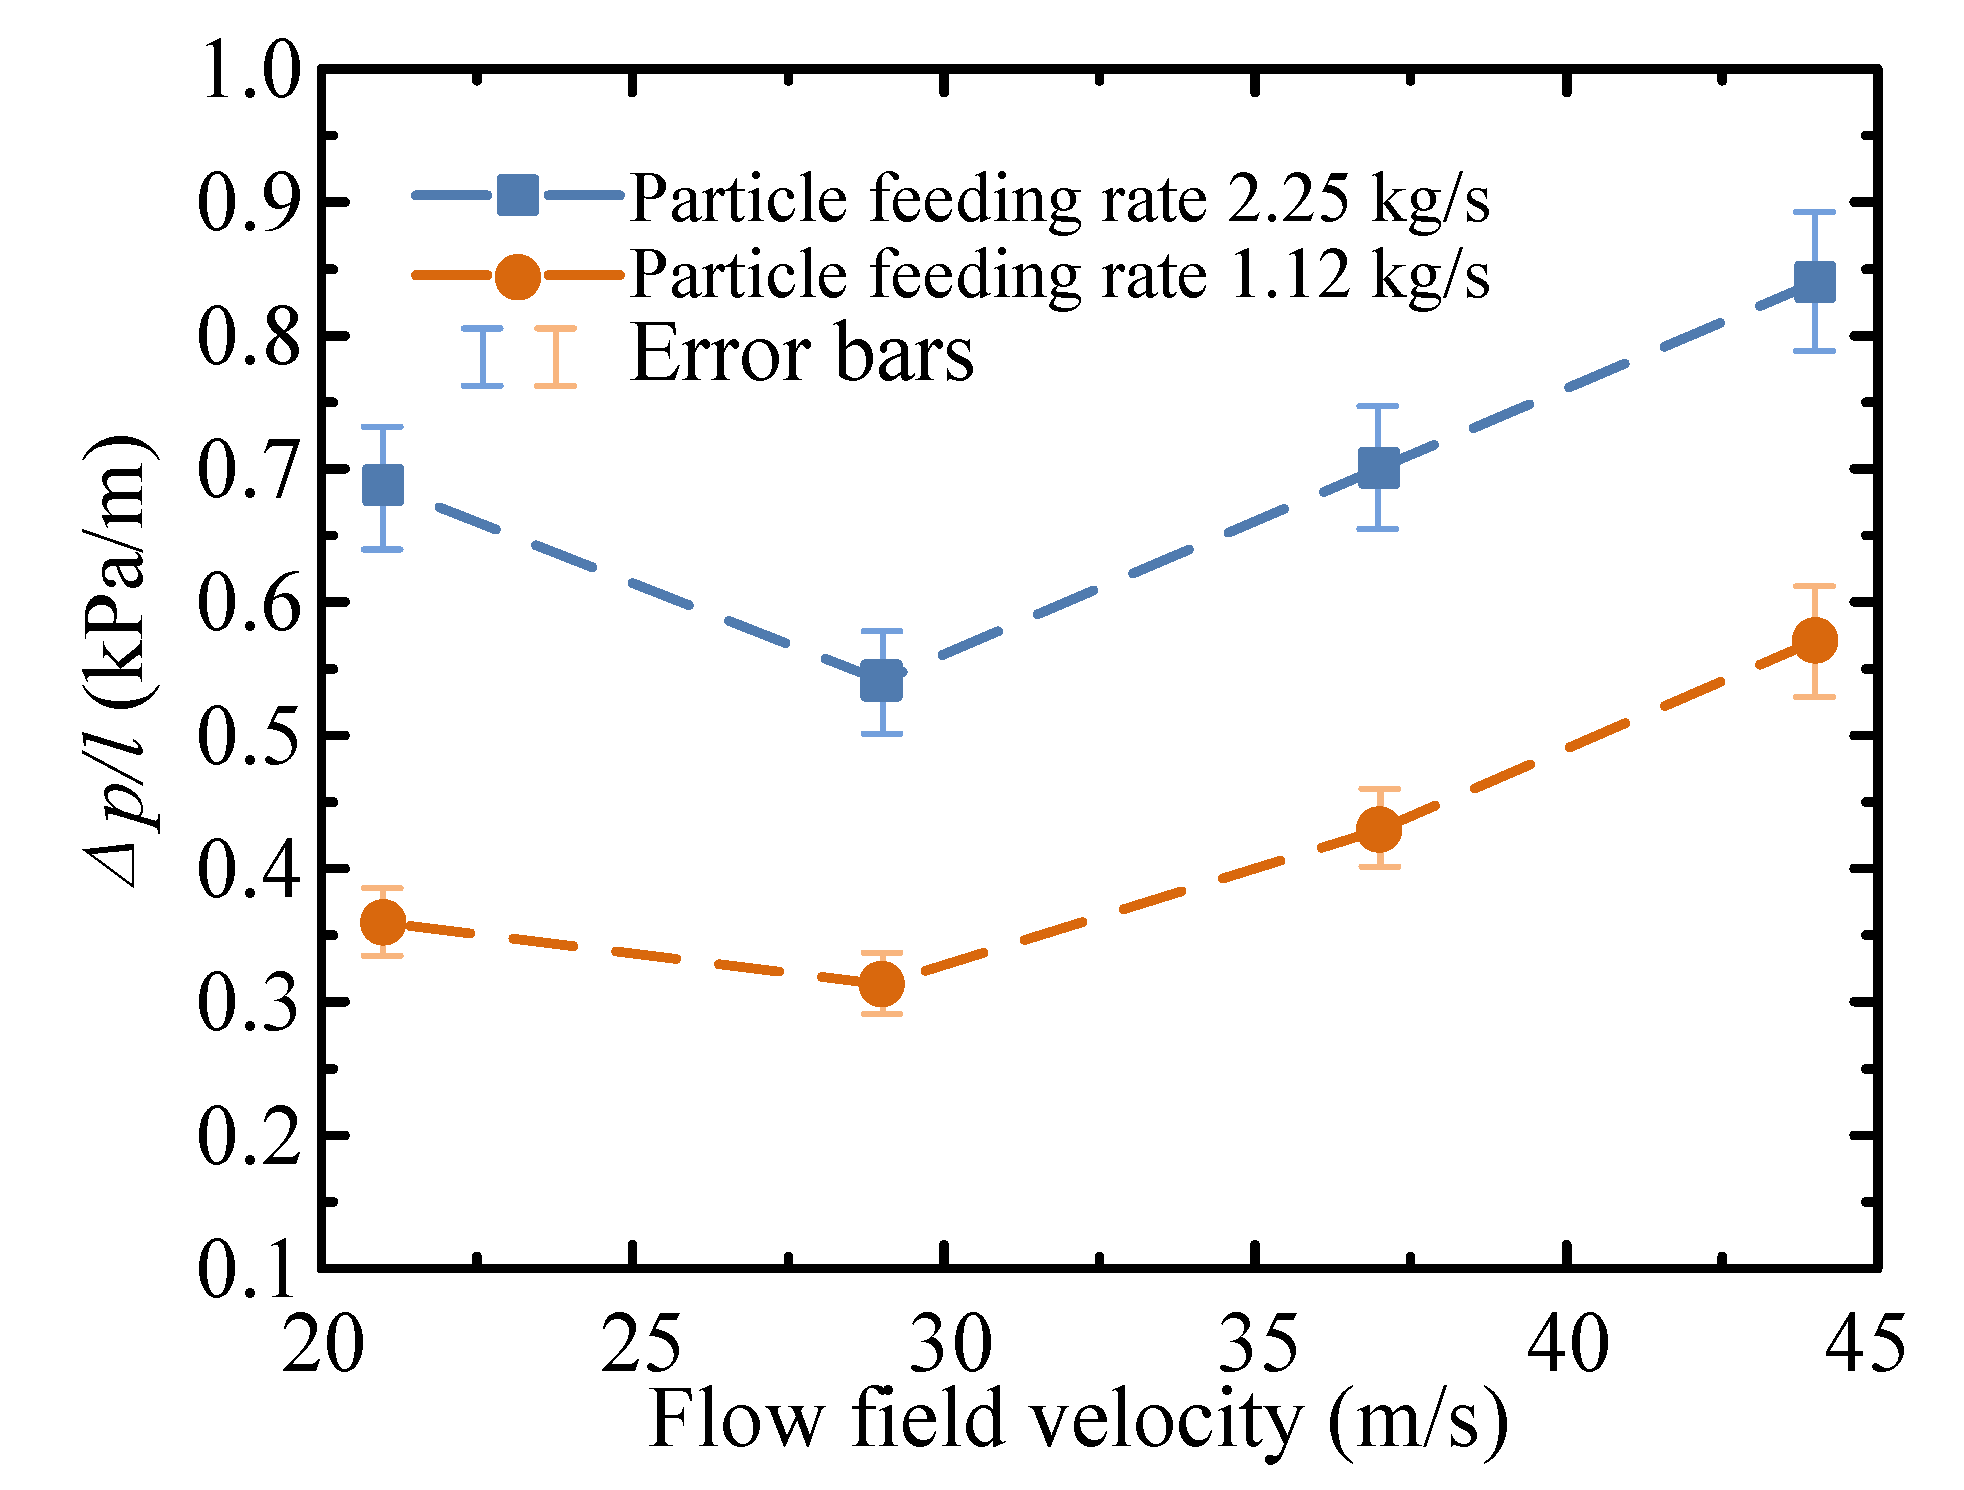
4.1. Experiment Results

In all the experimental results, the pressure signal curves obtained by the two pressure transducers were basically the same trend, but the output pressure of the air compressor and feeding rate had obvious influence on the pressure signal curves. Due to the highest output pressure of the air compressor and the largest feeding rate in the No.8 experiment, the pressure signal curves obtained by the two pressure sensors are best visualized. Therefore, the No.8 experiment is taken as an example to analyze the trend of pressure drop in the pipe during the pneumatic conveying experiment. The static pressure signals of first and second pressure transducers are shown in Figure 6.
The pressure signal curves were clearly divided into pure flow part and conveying part. At 0–5 s, the pressure value gradually increased, which was the initial stage of single-phase gas flow in the pipe. After that, the pressure value was relatively stable, although there was noise fluctuation. Basically, the pressure value floated up and down at zero, which indicates that the air flow was fully developed and the stable flow field was formed, which is called the pure flow part. The pressure value rose rapidly and maintained its high value when the particles entered the flow field. The pressure curve has a large fluctuation with the particle conveying which eliminates the noise fluctuation. It is because the coal particles in the pipeline hinder the flow field that the pressure value of this part increased. This is called the conveying part. Next, the pressure value gradually decreased with the decline of coal particles in the pipe, and then the pure flow part was restored.
The unit-distance pressure drop (Δp/l) of the horizontal pneumatic conveying experiment was the ratio of the pressure difference obtained by the two pressure transducers of the distance between the two measuring points, which is shown in Figure 7. According to the zero temperature drift of pressure transducers (±0.15%FS/°C), sensitivity temperature drift of pressure transducers (±0.15%FS/°C) and signal fluctuation (±1.0%) in the measurement process, the pressure error measured in the experiment (20 °C) was estimated to be ±7%. Pressure drop curves have the same trend, where the pressure drop is first reduced and then increased. The pressure drop increased with the feeding rate under the same flow field velocity.

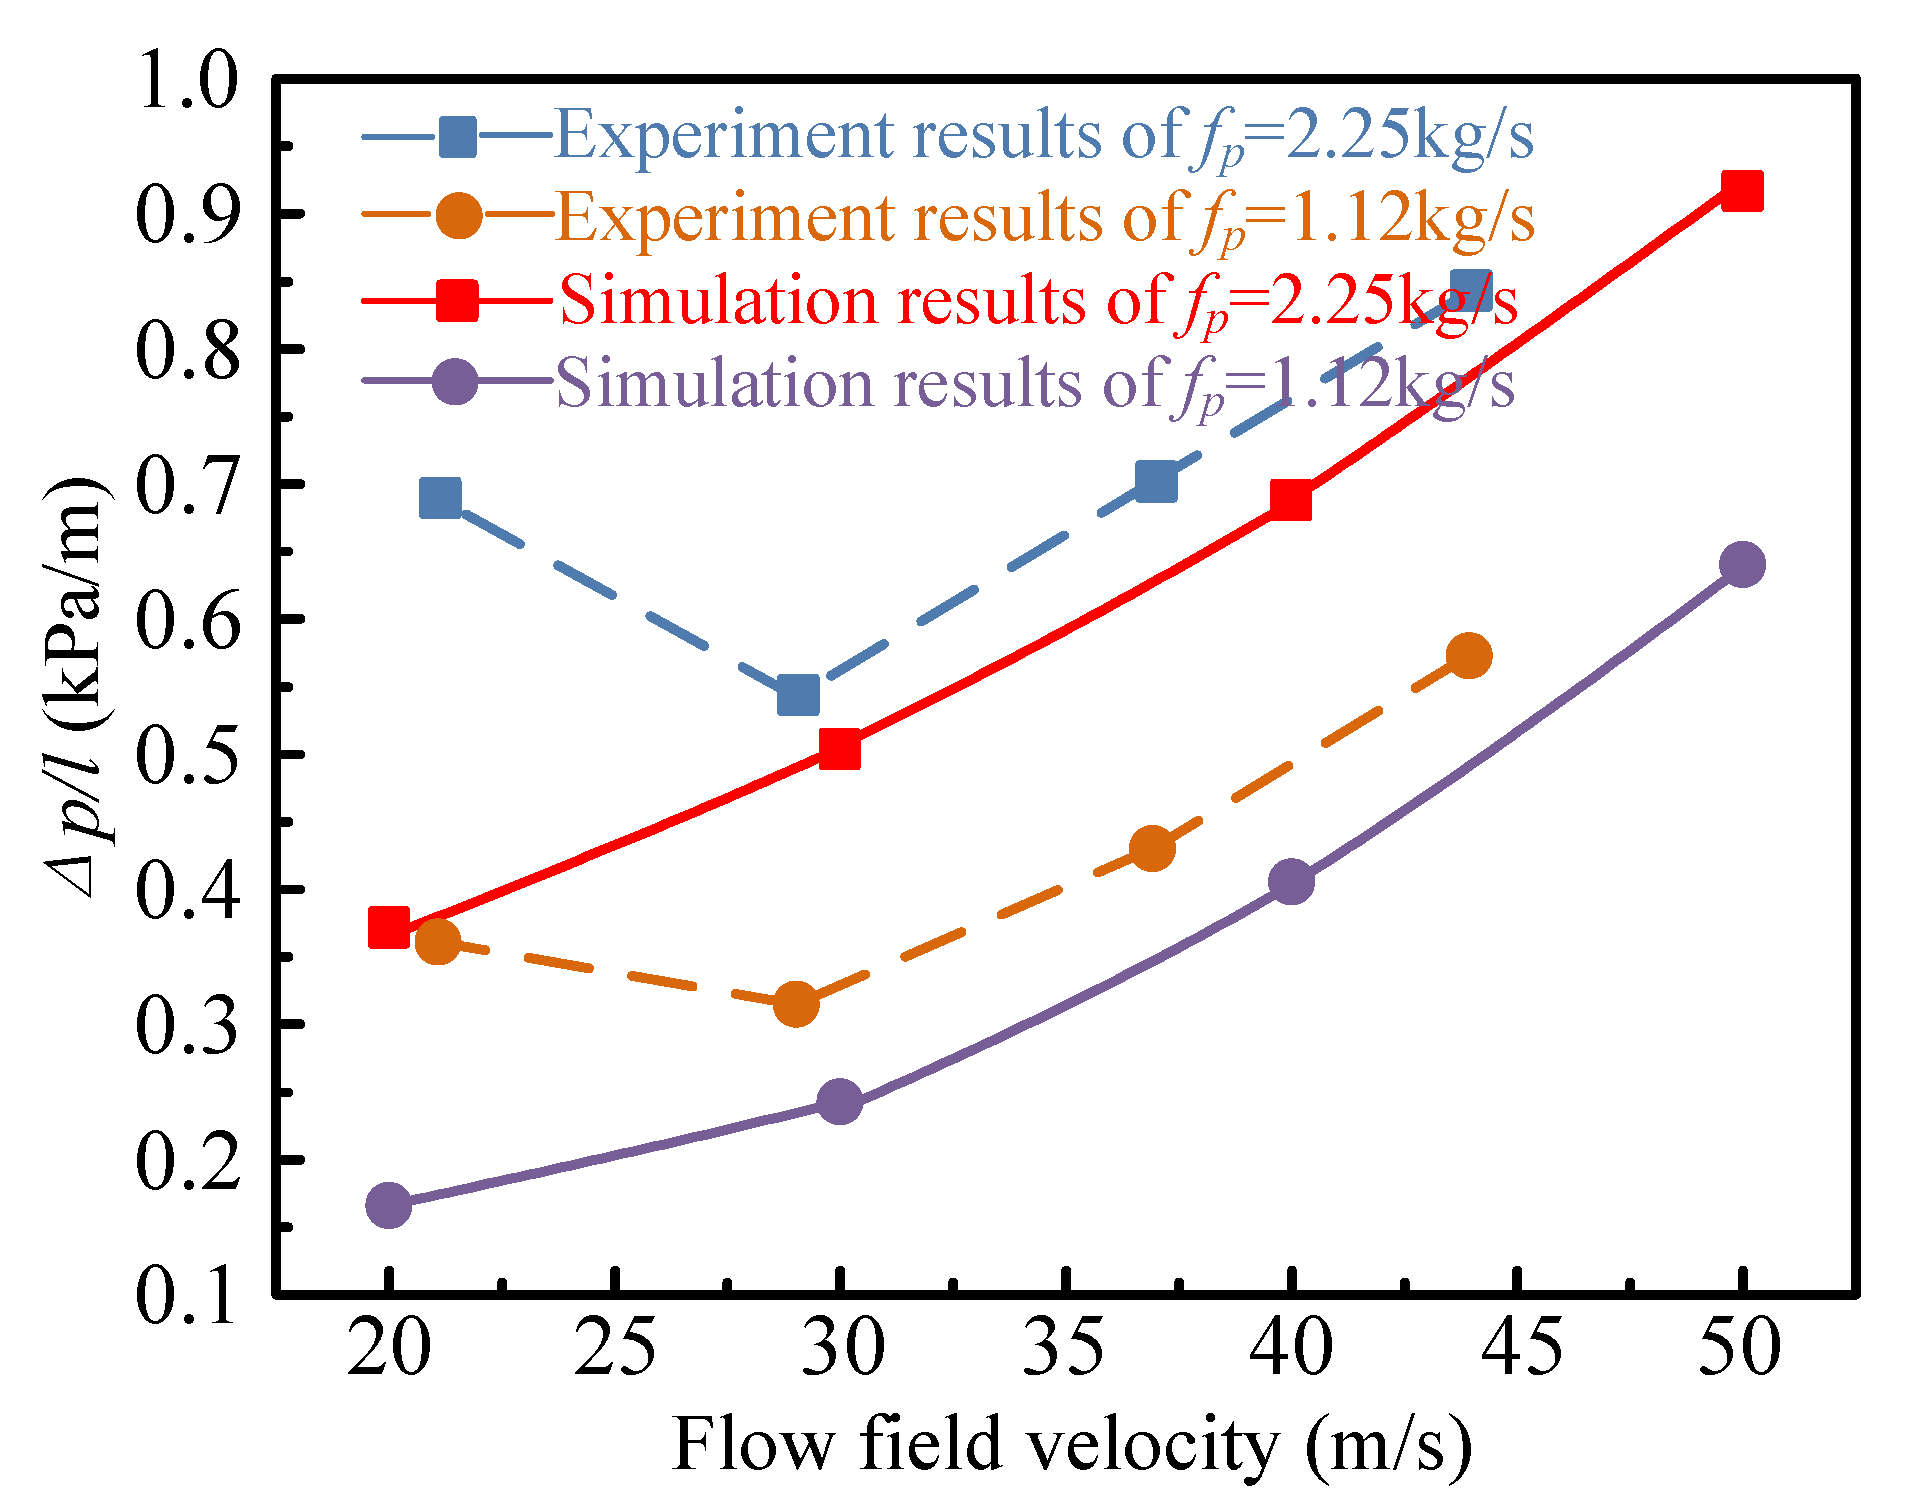
4.2. Comparison Pressure Drop

The comparative simulations were carried out using the simulation particles with the diameter of 5–10 mm and the R-R particle size distribution [31]. The simulation scheme is the same as Table 3. The pressure drop comparison between the simulation and the experiment results is shown in Figure 8. The experiment variation trend of the pressure drop shows the parabola shape with the flow field velocity, and the simulation variation trend shows a linear growth pattern. From the numerical analysis, the pressure drop of simulation results were very different from the experimental results when the flow velocity was small. However, the simulation and experimental results changed gradually when the flow velocity increased. This indicates that the simulation results of DPM are similar to experiment results when flow velocity is large. Therefore, larger flow field velocities are used in the subsequent simulation to ensure the accuracy of the simulation results.

5. Discussion and Limitation

5.1. Discussion of Simulation Results Accuracy

The pressure drop obtained by simulation and experiments varied greatly with respect to flow field velocity. This is because the DPM used in this paper does not consider particle shape characteristics. Particle shape characteristics play a key role in particle–particle and particle–wall collisions. When the flow velocity is low, the stratification of flow field leads to more frequent particle–particle and particle–wall interactions, and some of the particles even accumulate at the pipe bottom. Therefore, the accuracy of DPM simulation results is very low at low flow field velocity. However, when the flow velocity increases, the particles get more energy from the flow field and some particles are suspended in the flow field, which leads to a decrease in collision probability. Therefore, the DPM simulation results are similar to the experimental results at the high flow field velocity.

5.2. Limitation of Experiments

Coal is an inflammable and explosive material. Coal dust will inevitably be produced in the pneumatic conveying process and there is a chance of sparks when large sized particles make an impact with the pipe wall at high speed. This in turn could cause accidents such as pipeline explosions. Therefore, under the premise of ensuring a safe experiment, the pneumatic conveying experiment of large sized particles cannot be carried out, only simulation research can be carried out.

5.3. Future Research

The goal of this paper is to find a simple and effective numerical simulation method to predict the pneumatic conveying of large coal particles. According to the results of the experimental and simulation comparison, this is only the first step in finding a suitable model. The simulation model used in this paper is only suitable for high-speed flow field, and we will continue to study and modify the simulation model to obtain an effective and fast prediction model for all conditions in the pneumatic conveying of large particles.

6. Conclusions

This paper uses the coupling method based on the Euler–Lagrange approach, DPM and particle trajectory equations to quickly predict the pressure drop in horizontal pneumatic conveying for large coal particles. The multi-factor simulations are carried out to analyze the effects of particle size, flow field velocity, solid-gas rate and pipe diameter on pressure drop. In the simulation results, the change of the flow field total pressure was mainly due to the change of static pressure. The pressure curves can be divided into three regions: the pure flow region, the particle dropping and rebounding region and the stable conveying region.
In the stable conveying region, the pressure drop increases with the flow field velocity and decreases with the particle size. At lower flow field velocity, the difference of pressure drop under different particle sizes is small. In the stable conveying region, the pressure drop increases with the pipe diameter and the solid-gas rate. The influence of the solid-gas rate on the pressure drop is less than that of the pipe diameter, but the increase of solid-gas rate makes the mass flow rate of particles and the pressure drop of flow field increase.
Comparing simulation results with verified experimental results of pressure drop, the pressure drop of simulation results greatly differs from experimental results when the flow velocity is small. However, the simulation and experimental results gradually become more similar when the flow velocity increases. This indicates that the DPM model is feasible in predicting horizontal pneumatic conveying for large coal particles at large flow field velocity.

Author Contributions

Methodology, D.Y.; software, D.Y.; validation, Y.W.; writing—original draft preparation, D.Y.; writing—review and editing, Y.W. and Z.H. All authors have read and agreed to the published version of the manuscript.

Funding

This research was funded by the National Natural Science Foundation of China (51705222), the National Natural Science Foundation of Jiangsu Province (BK20170241) and the National Natural Science Foundation of the Jiangsu Normal University (17XLR028).

Conflicts of Interest

The authors declare no conflict of interest.

References

  1. Yang, D.L.; Li, J.P.; Zheng, K.H.; Jiang, H.X.; Xu, H.D.; Liu, S.Y. High-hardness alloy substituted by low hardness during drilling and cutting experiments of conical pick. Int. J. Rock Mech. Min. Sci. 2017, 95, 73–78. [Google Scholar] [CrossRef]
  2. Yang, D.L.; Wang, Y.X.; Xing, B.S.; Yu, Y.T.; Wang, Y.T.; Xia, Y.T. Recent patents on roll crushing mills for selective crushing of coal and gangue. Recent Patents Mech. Eng. 2020, 13, 2–12. [Google Scholar] [CrossRef]
  3. Yang, D.L.; Li, J.P.; Zheng, K.H.; Du, C.L.; Liu, S.Y. Impact-crush separation characteristics of coal and gangue. Int. J. Coal Prep. Util. 2018, 38, 127–134. [Google Scholar] [CrossRef]
  4. Yang, D.L.; Xing, B.S.; Li, J.P.; Wang, Y.X. Recent patents on pressurization and dedusting for pneumatic conveying. Recent Patents Mech. Eng. 2018, 11, 180–189. [Google Scholar] [CrossRef]
  5. Yang, D.L.; Li, J.P.; Xing, B.S.; Wang, Y.X. Recent patents on gangue pneumatic filling for coal auger mining method. Recent Patents Mech. Eng. 2018, 11, 31–40. [Google Scholar] [CrossRef]
  6. Rabinovich, E.; Kalman, H. Flow regime diagram for vertical pneumatic conveying and fluidized bed systems. Powder Technol. 2011, 207, 119–133. [Google Scholar] [CrossRef]
  7. Pahk, J.B.; Klinzing, G.E. Frictional force measurement between a single plug and the pipe wall in dense phase pneumatic conveying. Powder Technol. 2012, 222, 58–64. [Google Scholar] [CrossRef]
  8. Njobuenwu, D.O.; Fairweather, M. Modelling of pipe bend erosion by dilute particle suspensions. Comput. Chem. Eng. 2012, 42, 235–247. [Google Scholar] [CrossRef]
  9. Watson, R.J.; Thorpe, R.B.; Davidson, J.F. Vertical plug-flow pneumatic conveying from a fluidised bed. Powder Technol. 2012, 224, 155–161. [Google Scholar] [CrossRef]
  10. Ebrahimi, M.; Crapper, M.; Ooi, J.Y. Experimental and simulation studies of dilute horizontal pneumatic conveying. Part. Sci. Technol. 2014, 32, 206–213. [Google Scholar] [CrossRef]
  11. Ogata, K.; Hirose, T.; Yamashita, S. Effect of particle properties on fluidized powder conveying in a horizontal channel. Procedia Eng. 2015, 102, 968–975. [Google Scholar] [CrossRef] [Green Version]
  12. Makwana, A.B.; Patankar, A.; Bose, M. Effect of dune formation on pressure drop in horizontal pneumatic conveying system. Part. Sci. Technol. 2015, 33, 59–66. [Google Scholar] [CrossRef]
  13. Anantharaman, A.; Cahyadi, A.; Hadinoto, K.; Chew, J.W. Impact of particle diameter, density and sphericity on minimum pickup velocity of binary mixtures in gas-solid pneumatic conveying. Powder Technol. 2016, 297, 311–319. [Google Scholar] [CrossRef]
  14. Rinoshika, A. Effect of oscillating soft fins on particle motion in a horizontal pneumatic conveying. Int. J. Multiph. Flow 2013, 52, 13–21. [Google Scholar] [CrossRef]
  15. Rinoshika, A. Dilute pneumatic conveying of a horizontal curved 90° bend with soft fins or dune model. Powder Technol. 2014, 254, 291–298. [Google Scholar] [CrossRef]
  16. Yang, D.L.; Xing, B.S.; Li, J.P.; Wang, Y.X.; Hu, N.N.; Jiang, S.B. Experiment and simulation analysis of the suspension behavior of large (5–30 mm) nonspherical particles in vertical pneumatic conveying. Powder Technol. 2019, 354, 442–455. [Google Scholar] [CrossRef]
  17. Yang, D.L.; Li, J.P.; Du, C.L.; Jiang, H.; Zheng, K. Injection performance of a gas-solid injector based on the particle trajectory model. Adv. Mater. Sci. Eng. 2015, 2015, 871067. [Google Scholar] [CrossRef] [Green Version]
  18. Yang, D.L.; Xing, B.S.; Li, J.P.; Wang, Y.X.; Gao, K.D.; Zhou, F.; Xia, Y.T.; Wang, C. Experimental study on the injection performance of the gas-solid injector for large coal particles. Powder Technol. 2020, 364, 879–888. [Google Scholar] [CrossRef]
  19. Sanchez, L.; Vasquez, N.; Klinzing, G.E.; Dhodapkar, S. Characterization of bulk solids to assess dense phase pneumatic conveying. Powder Technol. 2003, 138, 93–117. [Google Scholar] [CrossRef]
  20. Zhou, F.B.; Hu, S.Y.; Liu, Y.K.; Liu, C.; Xia, T.Q. CFD-DEM simulation of the pneumatic conveying of fine particles through a horizontal slit. Particuology 2014, 16, 196–205. [Google Scholar] [CrossRef]
  21. Watano, S. Mechanism and control of electrification in pneumatic conveying of powders. Chem. Eng. Sci. 2006, 61, 2271–2278. [Google Scholar] [CrossRef]
  22. Choi, K.; Endo, Y.; Suzuki, T. Experimental study on electrostatic charges and discharges inside storage silo during loading of polypropylene powders. Powder Technol. 2018, 331, 68–73. [Google Scholar] [CrossRef]
  23. Güner, M. Pneumatic conveying characteristics of some agricultural seeds. J. Food Eng. 2007, 80, 904–913. [Google Scholar] [CrossRef]
  24. Ghafori, H.; Sharifi, M. Numerical and experimental study of an innovative design of elbow in the pipe line of a pneumatic conveying system. Powder Technol. 2018, 331, 171–178. [Google Scholar] [CrossRef]
  25. Zhou, J.W.; Liu, Y.; Du, C.L.; Liu, S.Y.; Li, J.P. Numerical study of coarse coal particle breakage in pneumatic conveying. Particuology 2018, 38, 204–214. [Google Scholar] [CrossRef]
  26. Zhou, J.W.; Liu, Y.; Du, C.L.; Liu, S.Y. Effect of the particle shape and swirling intensity on the breakage of lump coal particle in pneumatic conveying. Powder Technol. 2017, 317, 438–448. [Google Scholar] [CrossRef]
  27. Shih, T.H.; Liou, W.W.; Shabbir, A.; Yang, Z.G.; Zhu, J. A new k-ϵeddy-viscosity model for high reynolds number turbulent flows. Comput. Fluids 1995, 24, 227–238. [Google Scholar] [CrossRef]
  28. Gosman, A.D.; Ioannides, E. Aspects of computer simulation of liquid-fuelled combustors. J. Energy 1983, 7, 482–490. [Google Scholar] [CrossRef]
  29. Haider, A.; Levenspiel, O. Drag coefficient and terminal velocity of spherical and nonspherical particles. Powder Technol. 1989, 58, 63–70. [Google Scholar] [CrossRef]
  30. Dritselis, C.D.; Vlachos, N.S. Large eddy simulation of gas-particle turbulent channel flow with momentum exchange between the phases. Int. J. Multiph. Flow 2011, 37, 706–721. [Google Scholar] [CrossRef]
  31. Yang, D.L.; Li, J.P.; Du, C.L.; Zheng, K.H.; Liu, S.Y. Particle size distribution of coal and gangue after impact-crush separation. J. Cent. South Univ. 2017, 24, 1252–1262. [Google Scholar] [CrossRef]
Figure 1. Simulation model.
Processes 08 00650 g001
Figure 2. Pressure variation in a horizontal pipe.
Processes 08 00650 g002
Figure 3. Relationship between pressure drop, particle size and flow field velocity.
Processes 08 00650 g003
Figure 4. Relationship between pressure drop, pipe diameter and solid-gas rate.
Processes 08 00650 g004
Figure 5. Experimental system of horizontal pneumatic conveying.
Processes 08 00650 g005
Figure 6. Pressure signal in horizontal pneumatic conveying pipe.
Processes 08 00650 g006
Figure 7. Relationship between pressure drop and flow field velocity.
Processes 08 00650 g007
Figure 8. Comparison of pressure drop between experiment and simulation.
Processes 08 00650 g008
Table 1. Simulations parameters.
Feeding RatePipe DiameterRoughnessParticle DensityParticle SizeFlow Field Velocity
0.5 kg/s70 mm0.05 mm2100 kg/m35, 10, 15, 20, 25 mm20, 30, 40, 50, 60 m/s
Table 2. Simulation parameters.
Particle SizeFlow Field VelocityRoughnessSolid-Gas RatePipe Diameter
15 mm60 m/s0.05 mm10, 15, 2070, 100, 150 mm
Table 3. The experimental scheme of horizontal pneumatic conveying.
No.Output Pressure of Air CompressorFlow Field VelocityFeeding RateSolid-Gas Rate
10.3 MPa21 m/s1.12 kg/s11.37
20.4 MPa29 m/s1.12 kg/s8.23
30.5 MPa37 m/s1.12 kg/s6.45
40.6 MPa44 m/s1.12 kg/s5.43
50.3 MPa21 m/s2.25 kg/s22.74
60.4 MPa29 m/s2.25 kg/s16.49
70.5 MPa37 m/s2.25 kg/s12.91
80.6 MPa44 m/s2.25 kg/s10.85

