1. Introduction
Following the evolution of optimization techniques, many industries have updated the way they operate, to capitalize on these innovations through achieving better management of their operations [
1,
2,
3,
4,
5]. In this regard, railway operations consist of a large number of complex related policies, i.e., train arrival/departure schedules, maneuvers and leadings, management of rail fleet, assignment of the locomotives, distribution of available assets, and employee management [
6,
7,
8]. These are the main reasons why railway transport has always faced difficulties and many of their management tools do not take into account the reality of day-to-day operations. The freight railroad industry offers more efficiency as compared to trucks; this is why International Business Machines Corporation (IBM) has proposed a wireless sensor network dedicated to monitoring the train parameters, under the name of Sensor Enabled Ambient Intelligent Telemetry (SEAIT) [
9].
A wireless sensor network dedicated to monitoring the parameters of the train has two elementary components: the sensor and the communication module. The sensors investigate the physical parameters, such as vibrations [
9], temperature [
10,
11,
12], position, velocity, etc. These parameters are transferred to a data concentrator by various communication protocols, part of these protocols being conceived as dedicated to a specific application [
9]. In other situations, standard technologies such as ZigBee or WiFi are recommended [
10]. The wireless sensors network is applied also in urban train transportation [
12,
13,
14] to perform an interchange V2V (vehicle-to-vehicle) or I2V (infrastructure-to-vehicle) [
15].
Furthermore, in network hubs, railway transport is more flexible in terms of usage capacity and speed, by comparison with other means of transport [
16,
17,
18]. Finally, most of the companies are in the process of switching the way they operate from a weight-based approach to an operation-scheduled approach.
RTM (railway transport management) is a planning and monitoring solution for freight railway transport and includes the following main functions:
Assignment of resources;
Cart Tracking and Monitoring Module;
Surveillance of Trains and Carts Optimization Module;
Extended logging for all users and network actions;
Complete data history: hour, date, author, IP;
Complete commercial history for trains and carts.
The RTM main characteristics include (1) platform accessed via the Intranet for inside users and via Internet for selected users; (2) browser access not related to the user operating system and with minimal hardware requirements; (3) mandatory authentication for all users of the application, divided in user groups; (4) tagging of all system interaction information (i.e., system access, transfer of responsibilities among users from one phase to the next one, etc.) and generation of output data in the form of reports/decisions containing the following: system access data, performed action, and responsible person; (5) saving logs for all the activities which interact with the application. Logs will be defined for the actions of introduction, deletion, and modification of data (for modification, monitoring parameters will be set), with a focus on data transfer; (6) dynamic user groups and area for the organization of responsibilities—users will have at least three distinctive roles: user administrator of the application; standard user; user with extended rights (with a role in the data export and report generating).
2. Reliable Automated Test Solutions for V2X, V2V, V2I Communications and IoT
In Europe alone, between 15 and 25 billion euros are spent annually on maintenance and repair work on train and railway infrastructure. Under these conditions, saving only 1% of these costs—the equivalent of 150–250 million euros—could have a significant impact on the business of railway operators [
15,
16,
17]. Maintenance costs can be reduced by halving the duration of roadside inspections and by reducing the period of incapacitation of the respective route. This would result in a fivefold return on investment as well as a reduction in the risk to maintenance teams. It is clear that the digitization of train transport is in full swing, since it provides a better analysis of the information collected by traditional methods and by connecting more and more sensors on railway equipment to the Digital Platform. Additionally, the effects are huge, the focus being transport safety. How does digitization work if an accident occurs on a section of railway or subway? “One situation could be the detection of a variation in the power consumption of the equipment. When IoT and Big Data recognize a model of performance criteria that has generated problems in the past, analytical information based on this experience will trigger a predictive alert, allowing operators to act as such,” explained by Alain Le Marchand from Thales. Thales already monitors more than 40,000 assets of the UK train network and is working on capabilities similar to Open Lab Initiative (French Railways). More sophisticated equipment means more valuable information and more efficient and secure services. It is a fiber optic axle counter capable of analyzing the weight of trains and calculating the number of passengers in each train [
18].
For several years, automobile manufacturers and government agencies have sought ways to improve safety and effectively manage traffic flow. Wireless communication systems are advancing, and the vision of automobiles talking to each other (V2V) and to roadside units (V2I) is becoming a reality [
19,
20,
21].
These planned automotive wireless communication systems for vehicle-to-everything (V2X) communications are collectively known as intelligent transportation systems (ITS). The first wave of solutions was based on IEEE 802.11p technology, but now C-V2X solutions based on LTE are appearing, and discussions about how 5G will play a role are already happening [
22,
23,
24,
25]. Well-established vehicle sensors, e.g., radar sensors, cameras, and tachometers, already provide information about distances to nearby obstacles and about velocities, but sharing information from the vehicle to everything also allows knowledge of critical traffic situations and collisions so that the driver or the car can initiate countermeasures to avoid accidents or create a better traffic flow [
26,
27,
28,
29].
Vehicle-to-vehicle (V2V) communications systems require a stable wireless link to maximize the throughput of information, which increases driver safety. To ensure a good wireless link, receivers must be able to detect signals even under the worst conditions, e.g., low signal-to-noise ratio (SNR), poor error vector magnitude (EVM), and heavy fading. Replicating these conditions in the lab requires high-performance test equipment capable of generating/analyzing the V2X signals, the required fading conditions, and satellite signals for highly accurate positioning [
30,
31,
32].
V2V technology is used to perform communication between neighboring devices [
33] and it could be useful in railway transport as a backup or redundant solution for GPRS communication. If the GPRS communication fails, the risk of collision is high and in some situations V2V could provide information on train positions, velocities, and trajectories but the distance between the trains must be larger than EBD (emergency braking distance) [
33]. Another application of V2V technologies is in the subway where the GPRS is not functional. The energy needed for data acquisition and communication is locally generated by a harvesting circuit that converts the mechanical energy into electrical energy. Unlike other technical solutions found in the literature [
34,
35,
36,
37,
38,
39,
40], this paper presents an efficient convertor of the rotating movement of the wheel into electrical energy [
31]. The information concerning the wagon parameters was sent in a linear mesh routing from the nodes to the data concentrator.
3. Functional Structure of the Wagon Monitoring Web Server Application
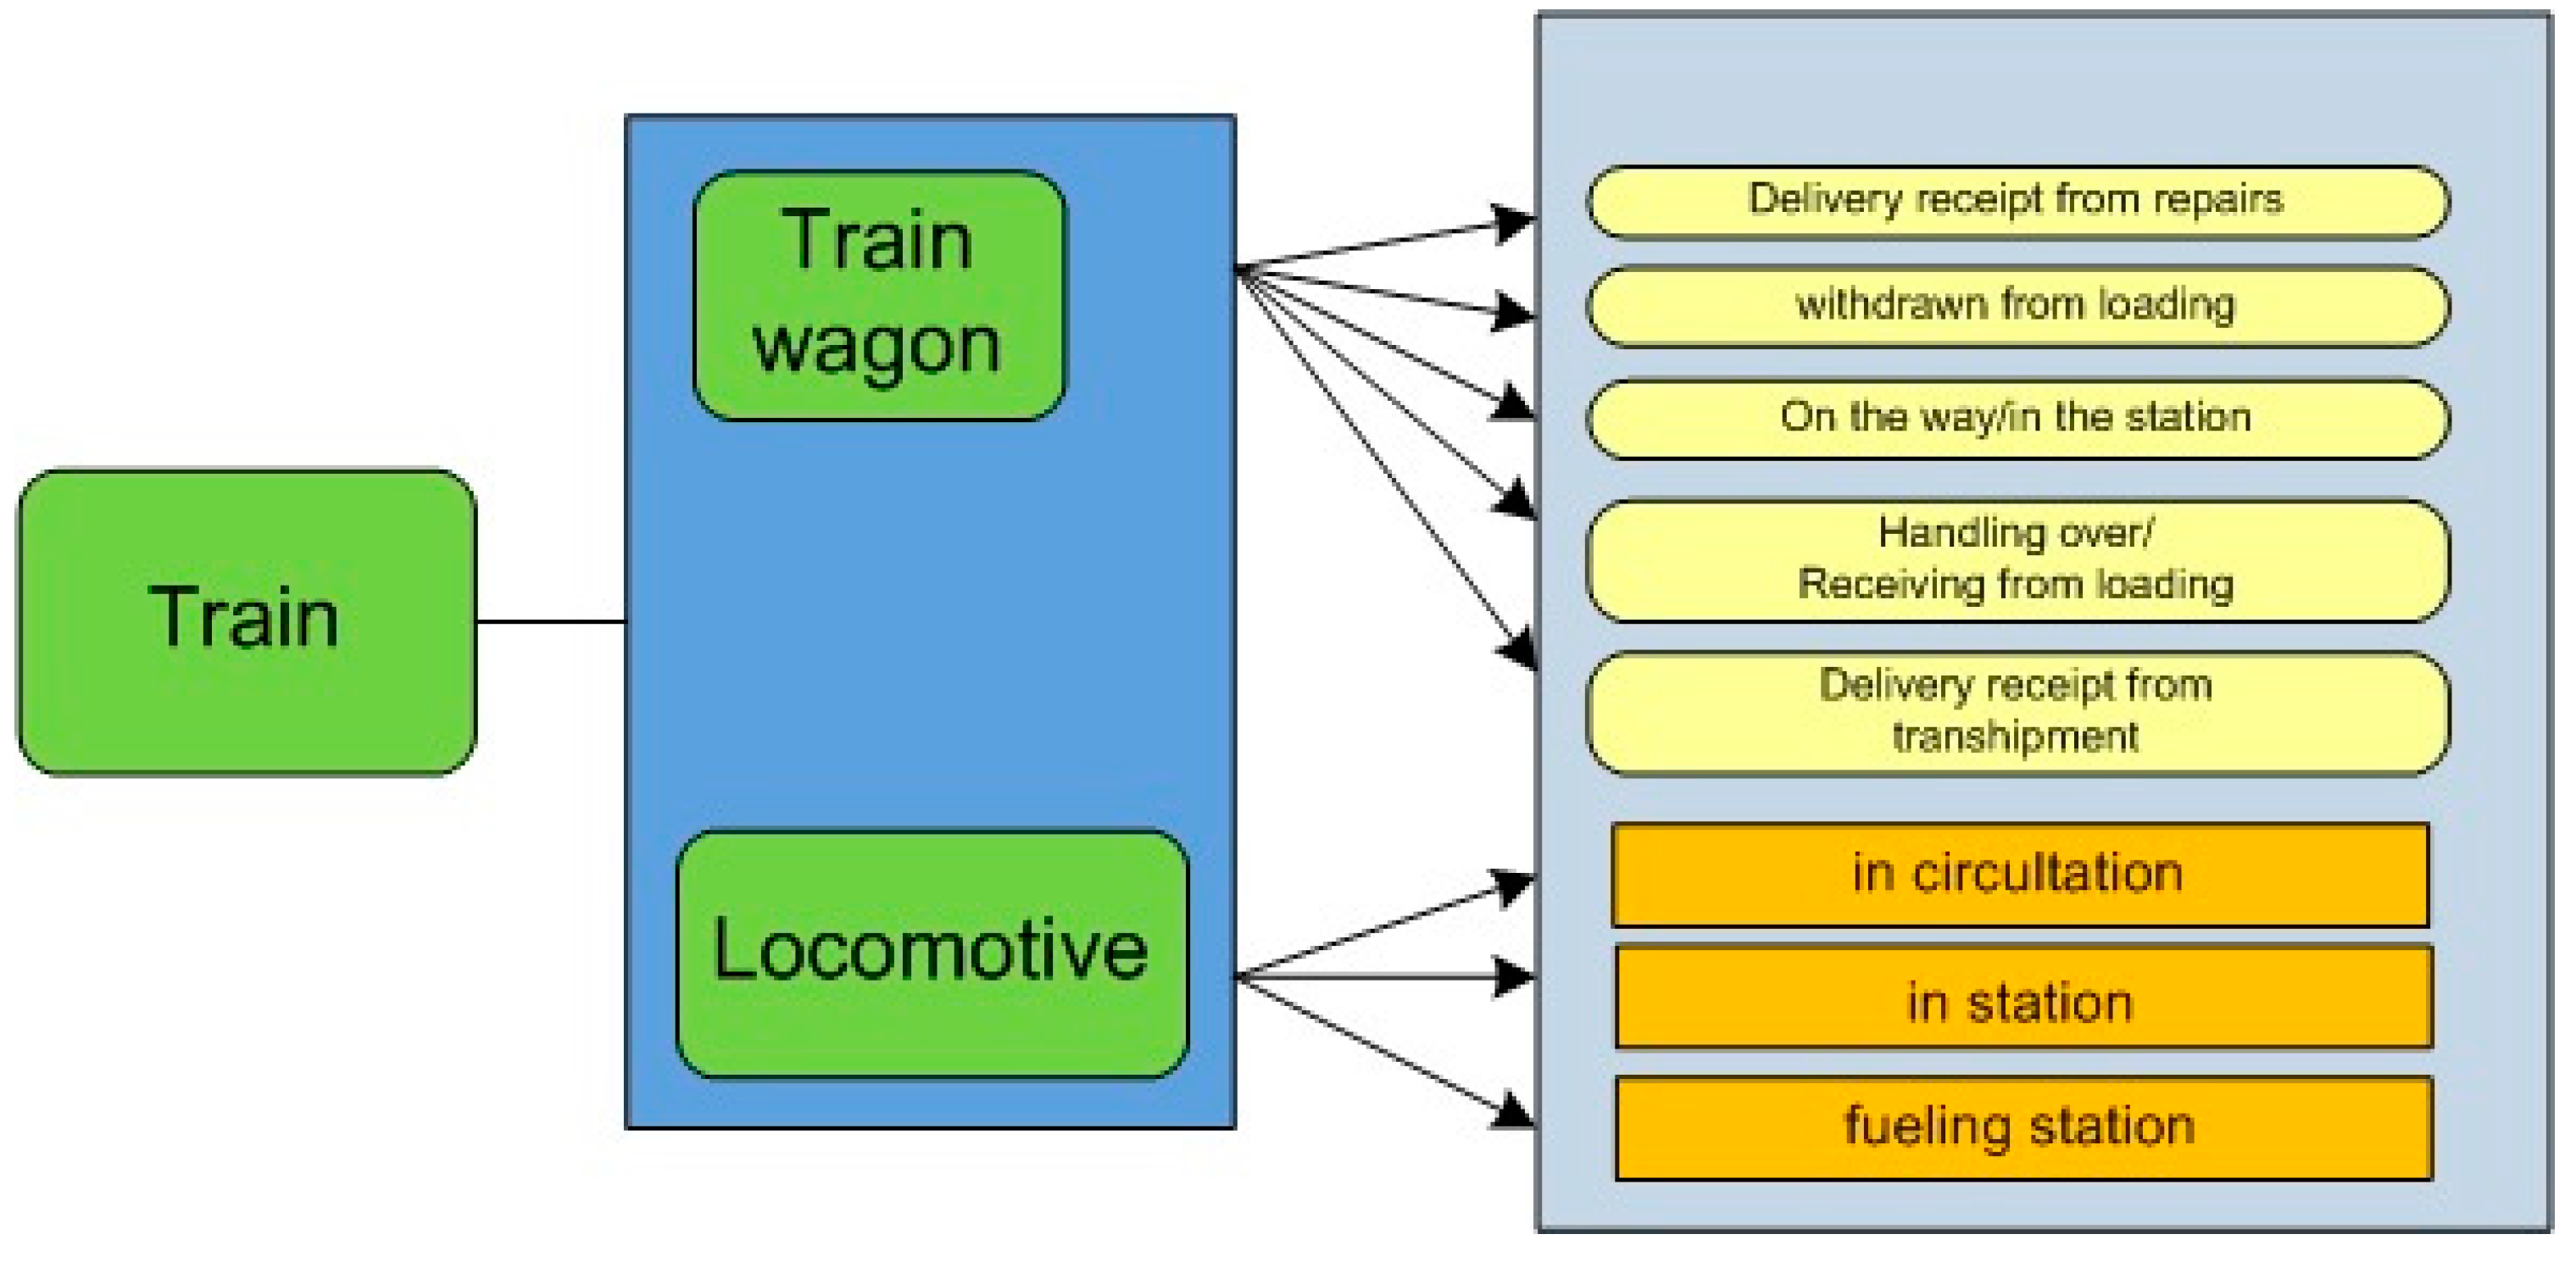
The wagon monitoring web server application presented in this paper includes the functional modules presented in
Figure 1. Regarding the communication technologies for V2V, it will apply LoRa (long range radio) or NB (narrowband).
The train wagon management web server application has the following components: locomotive fleet monitoring, in terms of location (current station) and current status (in transit, in a station, refueling, at a draw, unloading, etc.); commercial history monitoring for each wagon; statistics regarding the status of all wagons; status regarding wagons from each station; operations for individual wagons and wagon groups; status regarding manifests (transport documents); maintenance of the selected databases (wagon malfunctions, commercial issues, components, wagon-manufacturing company, etc.); activities specific to international traffic; special activities: re-sending, re-receiving.
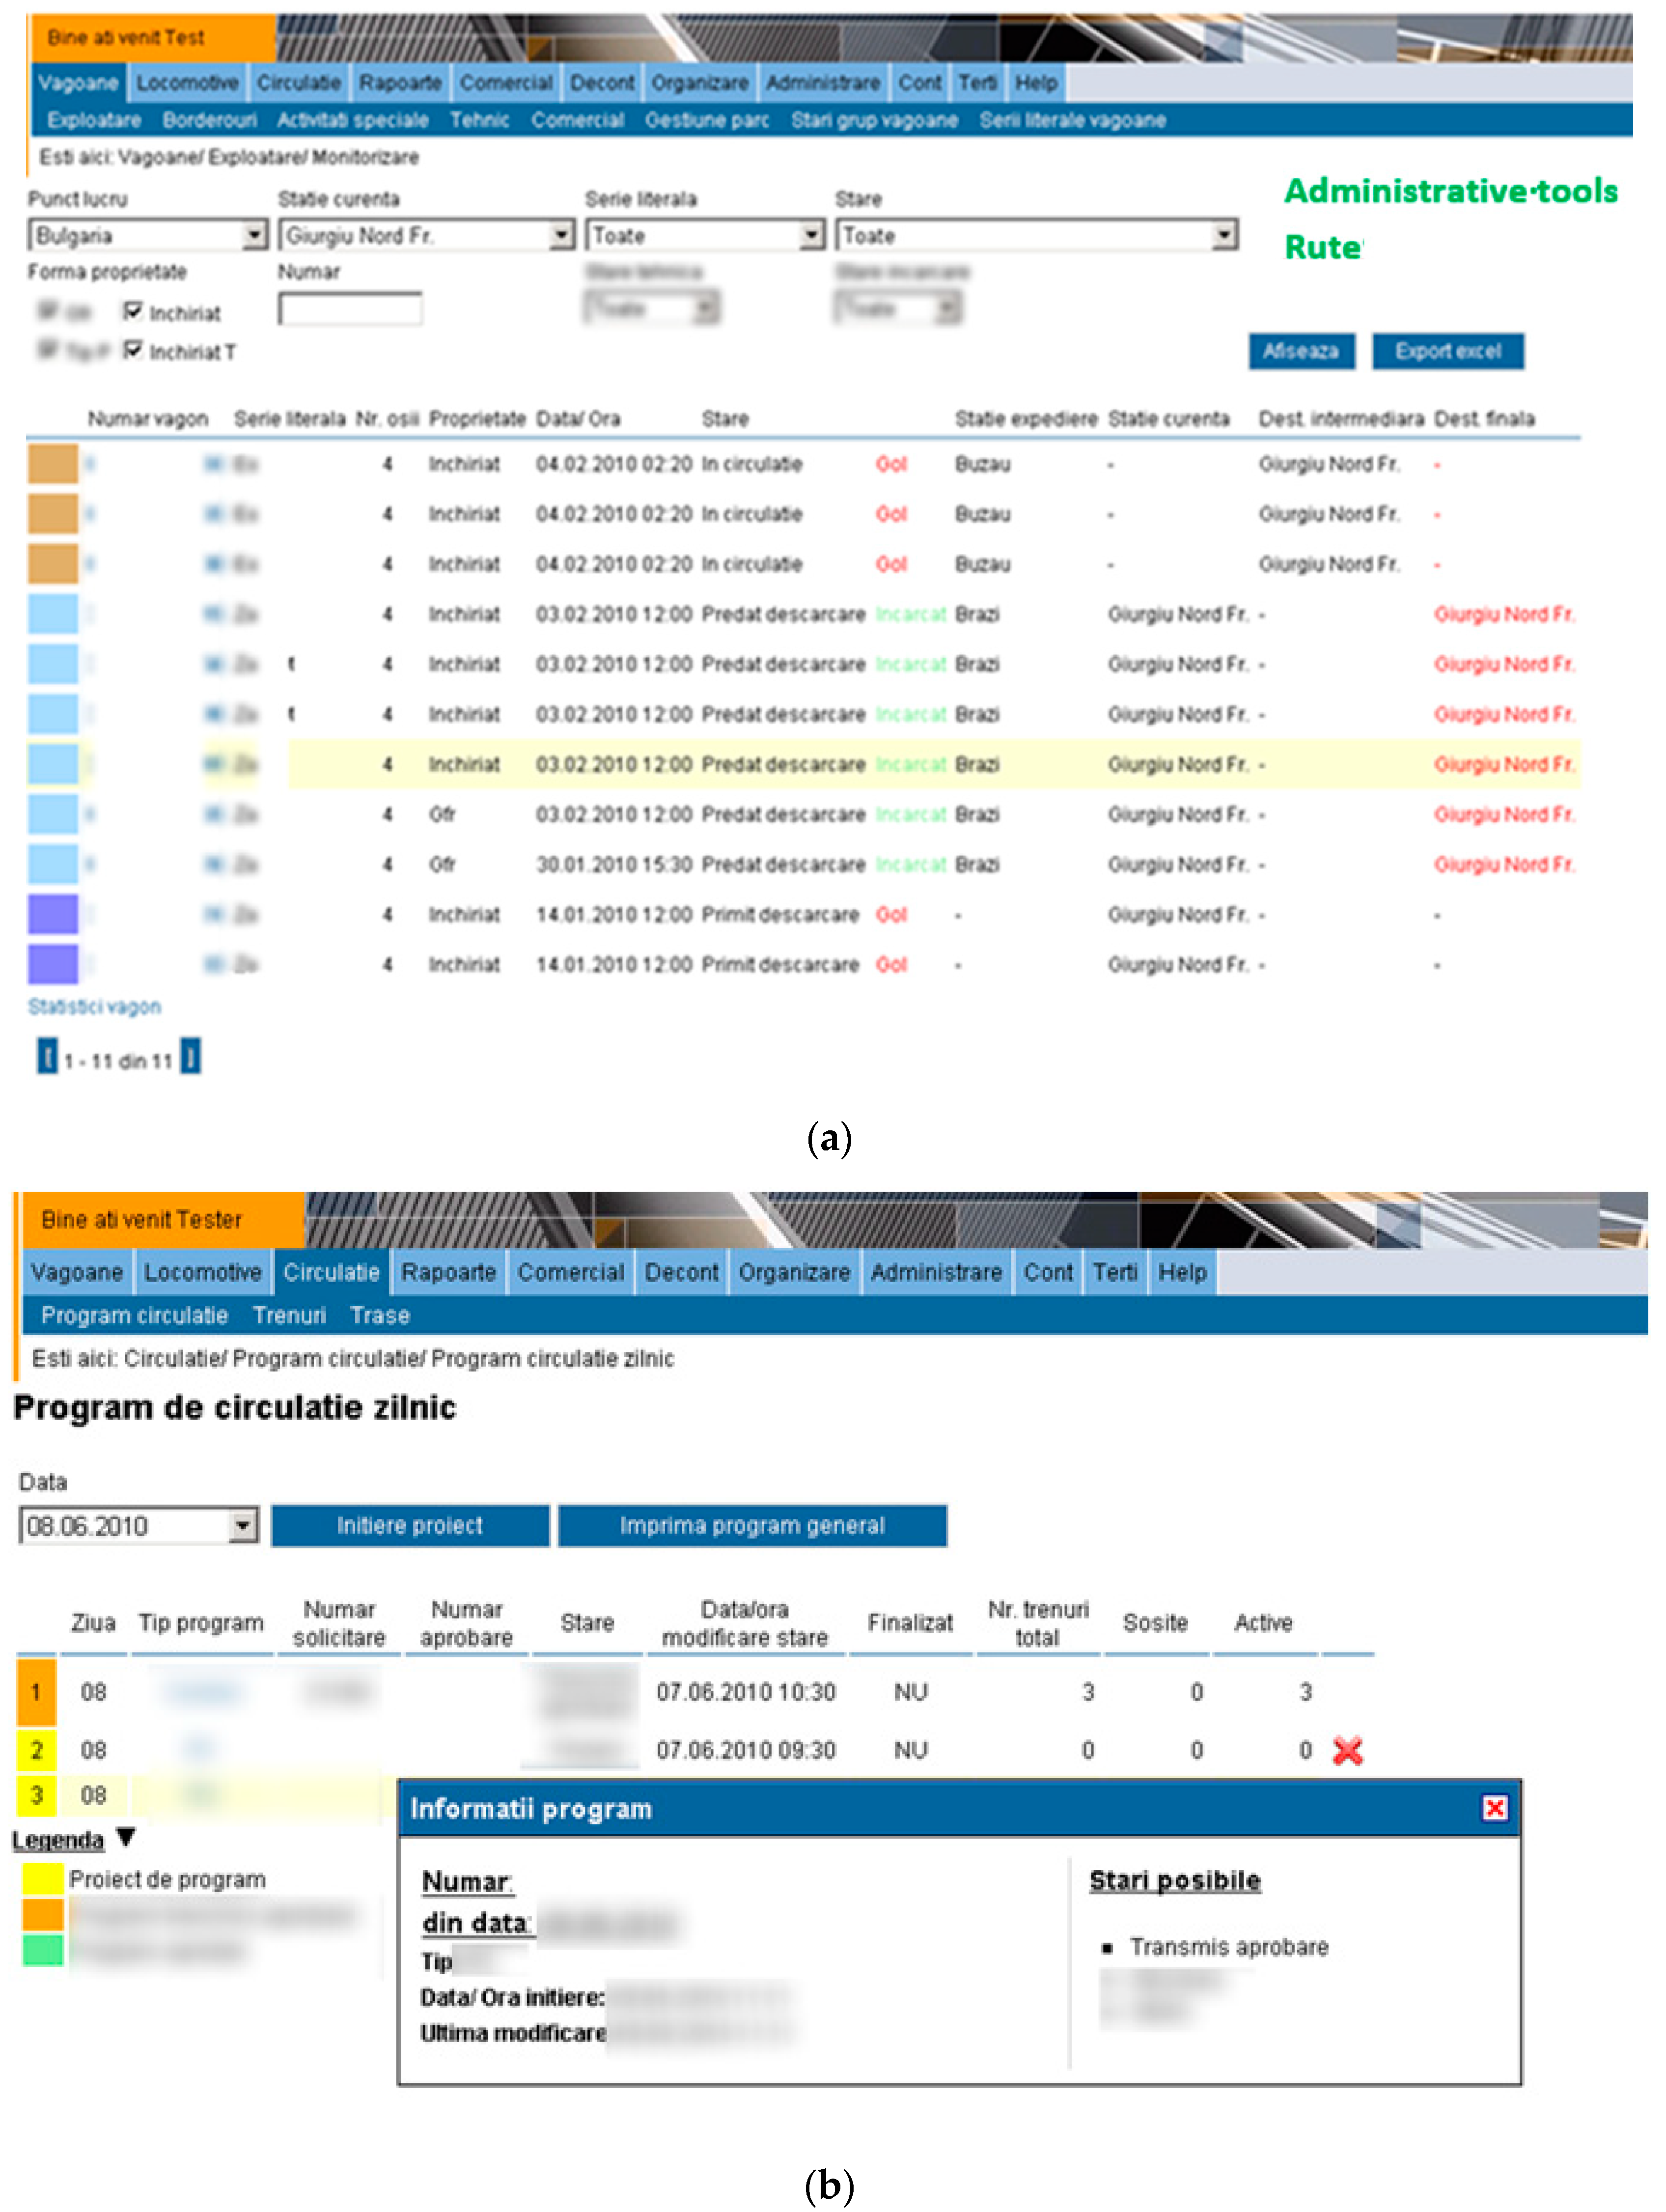
The wagon monitoring web server application (screen captures) is presented in
Figure 2a,b.
Figure 2a illustrates the train wagon list, with administrative tools such as the ID of wagons, route, reports, cost, help, and one example of train wagon route.
Figure 2b presents possible action and general information about the changing status of the train wagon. The user interface of the application is Romanian but we aim to improve this aspect in the future development stage of the application (for data confidentiality the figures are blurred).
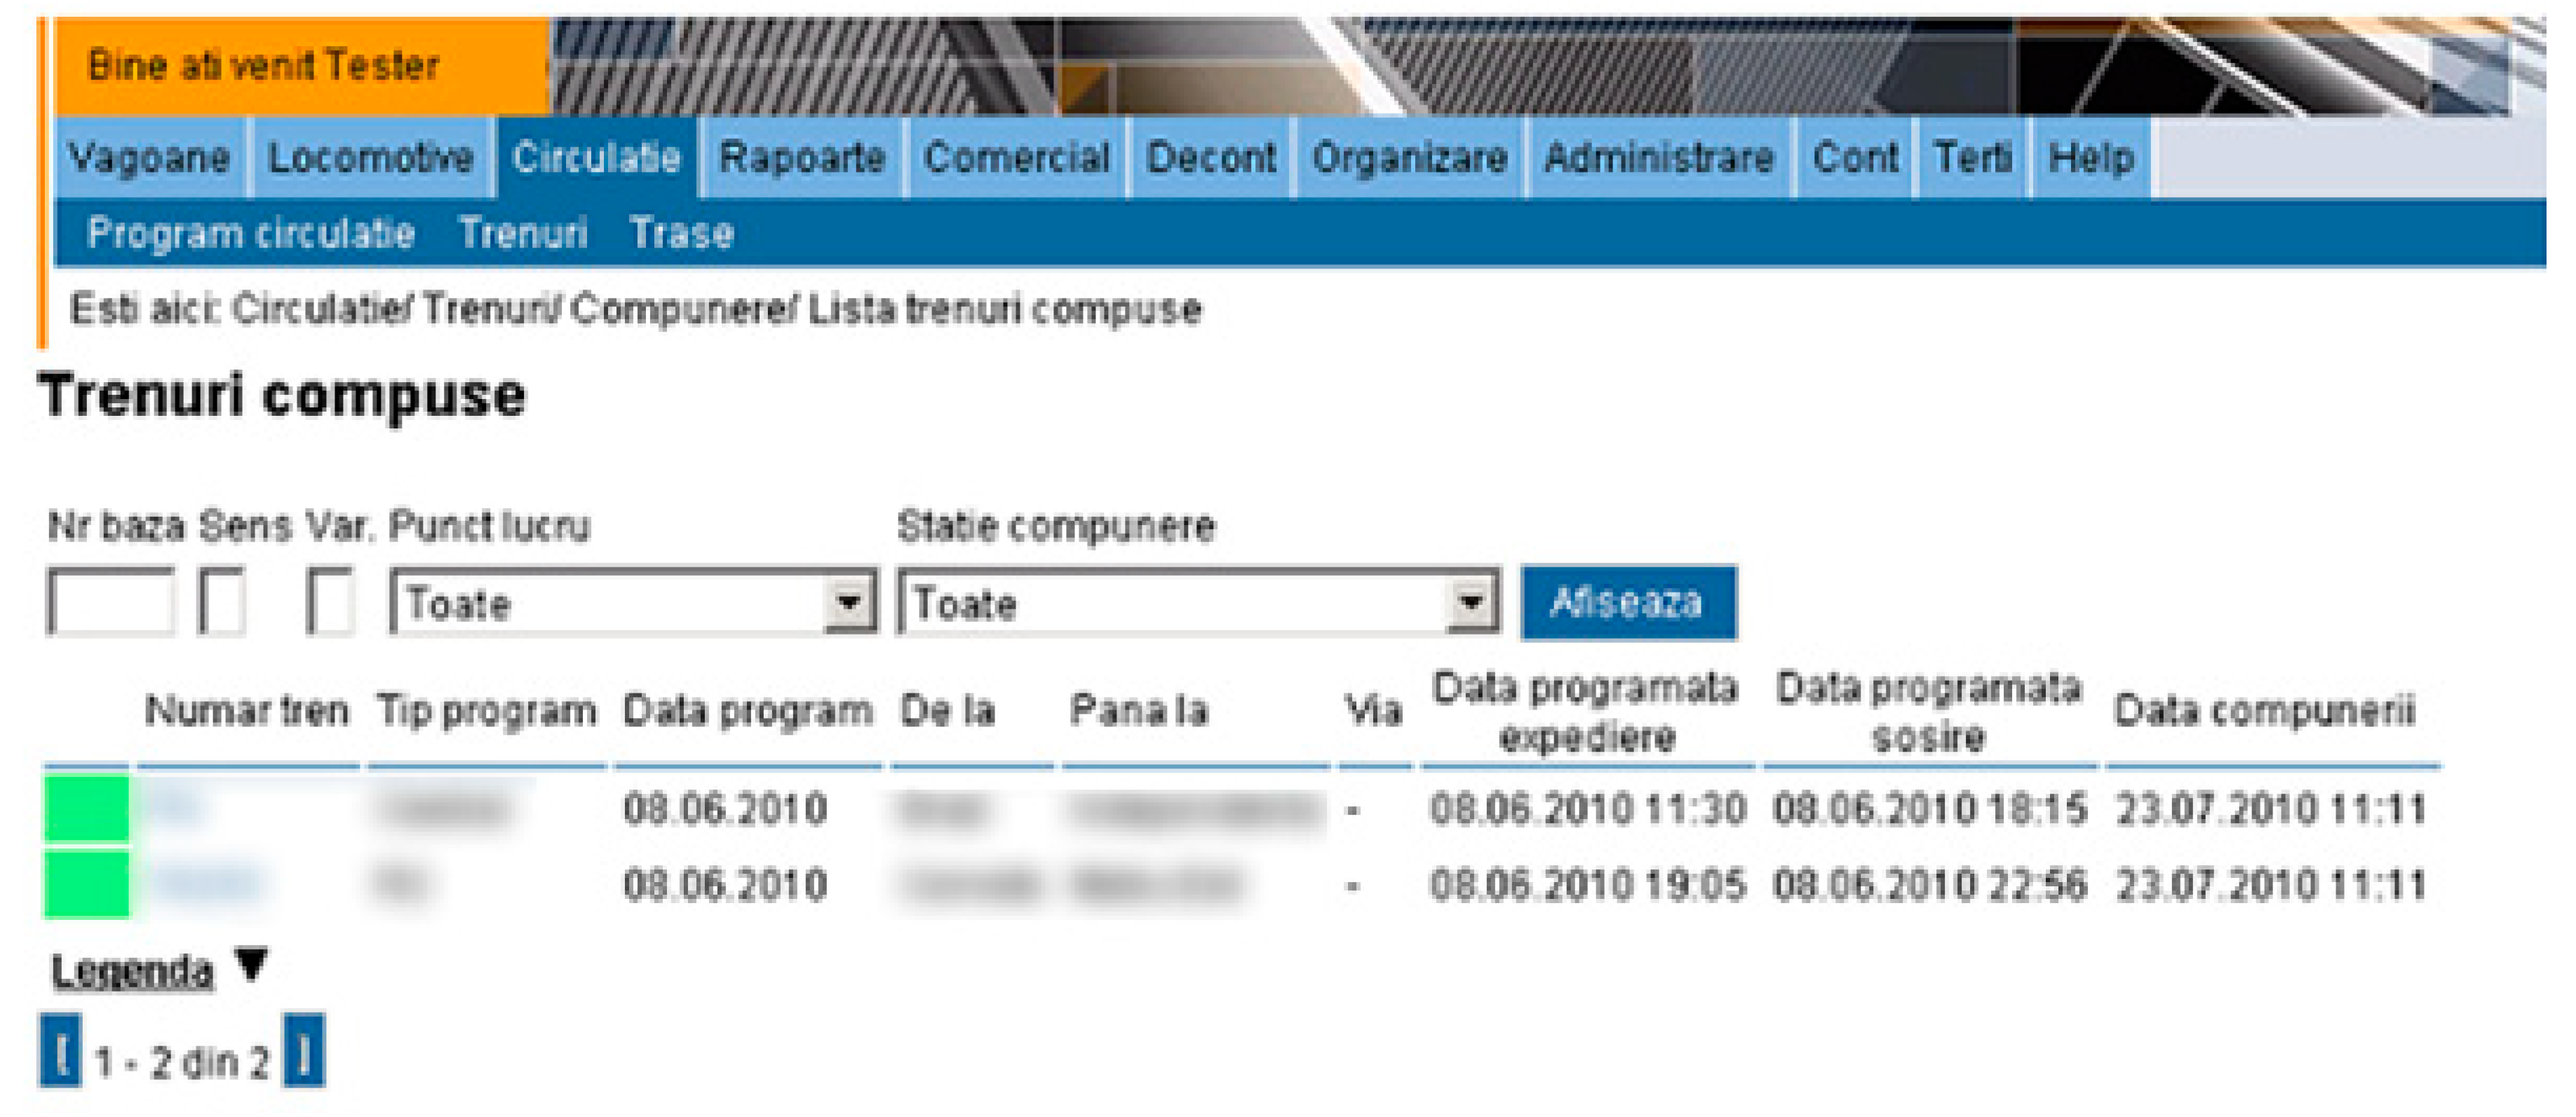
The locomotive management web server application, illustrated in
Figure 3 includes the monitoring of the locomotive fleet in terms of location (current station), current status (in motion, in the station, halted, refueling, etc.); the locomotive operations history; deleting/adding new locomotives to the locomotive fleet; the maintenance of locomotive-specific databases: failures, manufacturers, spare parts, roles, attributes, traffic conditions); classification of locomotive series (for data confidentiality the figures are blurred).
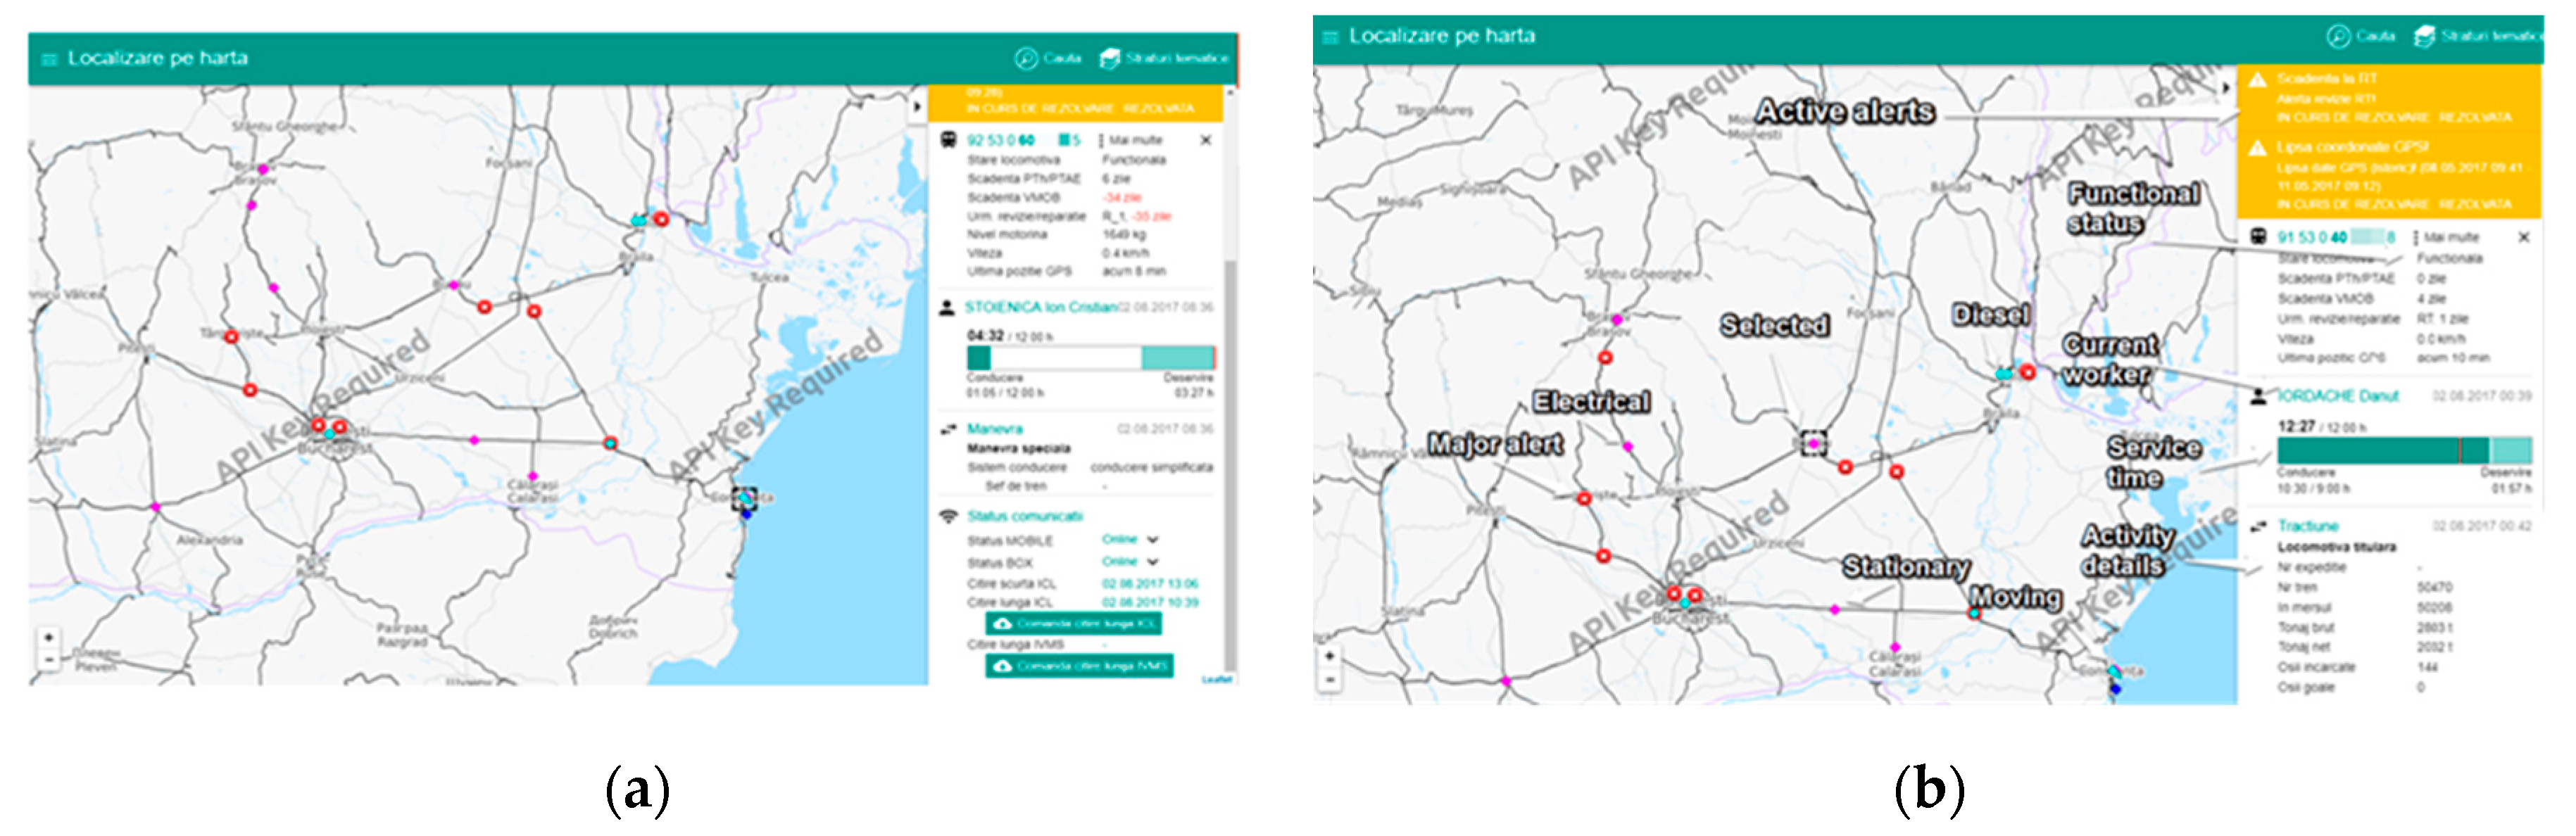
The web-server application regarding map positioning of train circulation, illustrated in
Figure 4a,b, includes the possibility of checking specific booklets that are annually loaded in the application and allow the subsequent devising of the circulation programs by selecting the trains from the booklet; assistance with train programming by providing details regarding the possible transport relations (searches in booklet after “n” points of the itinerary); recording the circulation restrictions in the booklet; devising daily circulation programs; exporting the print version for the daily program; monitoring the status of daily programs.
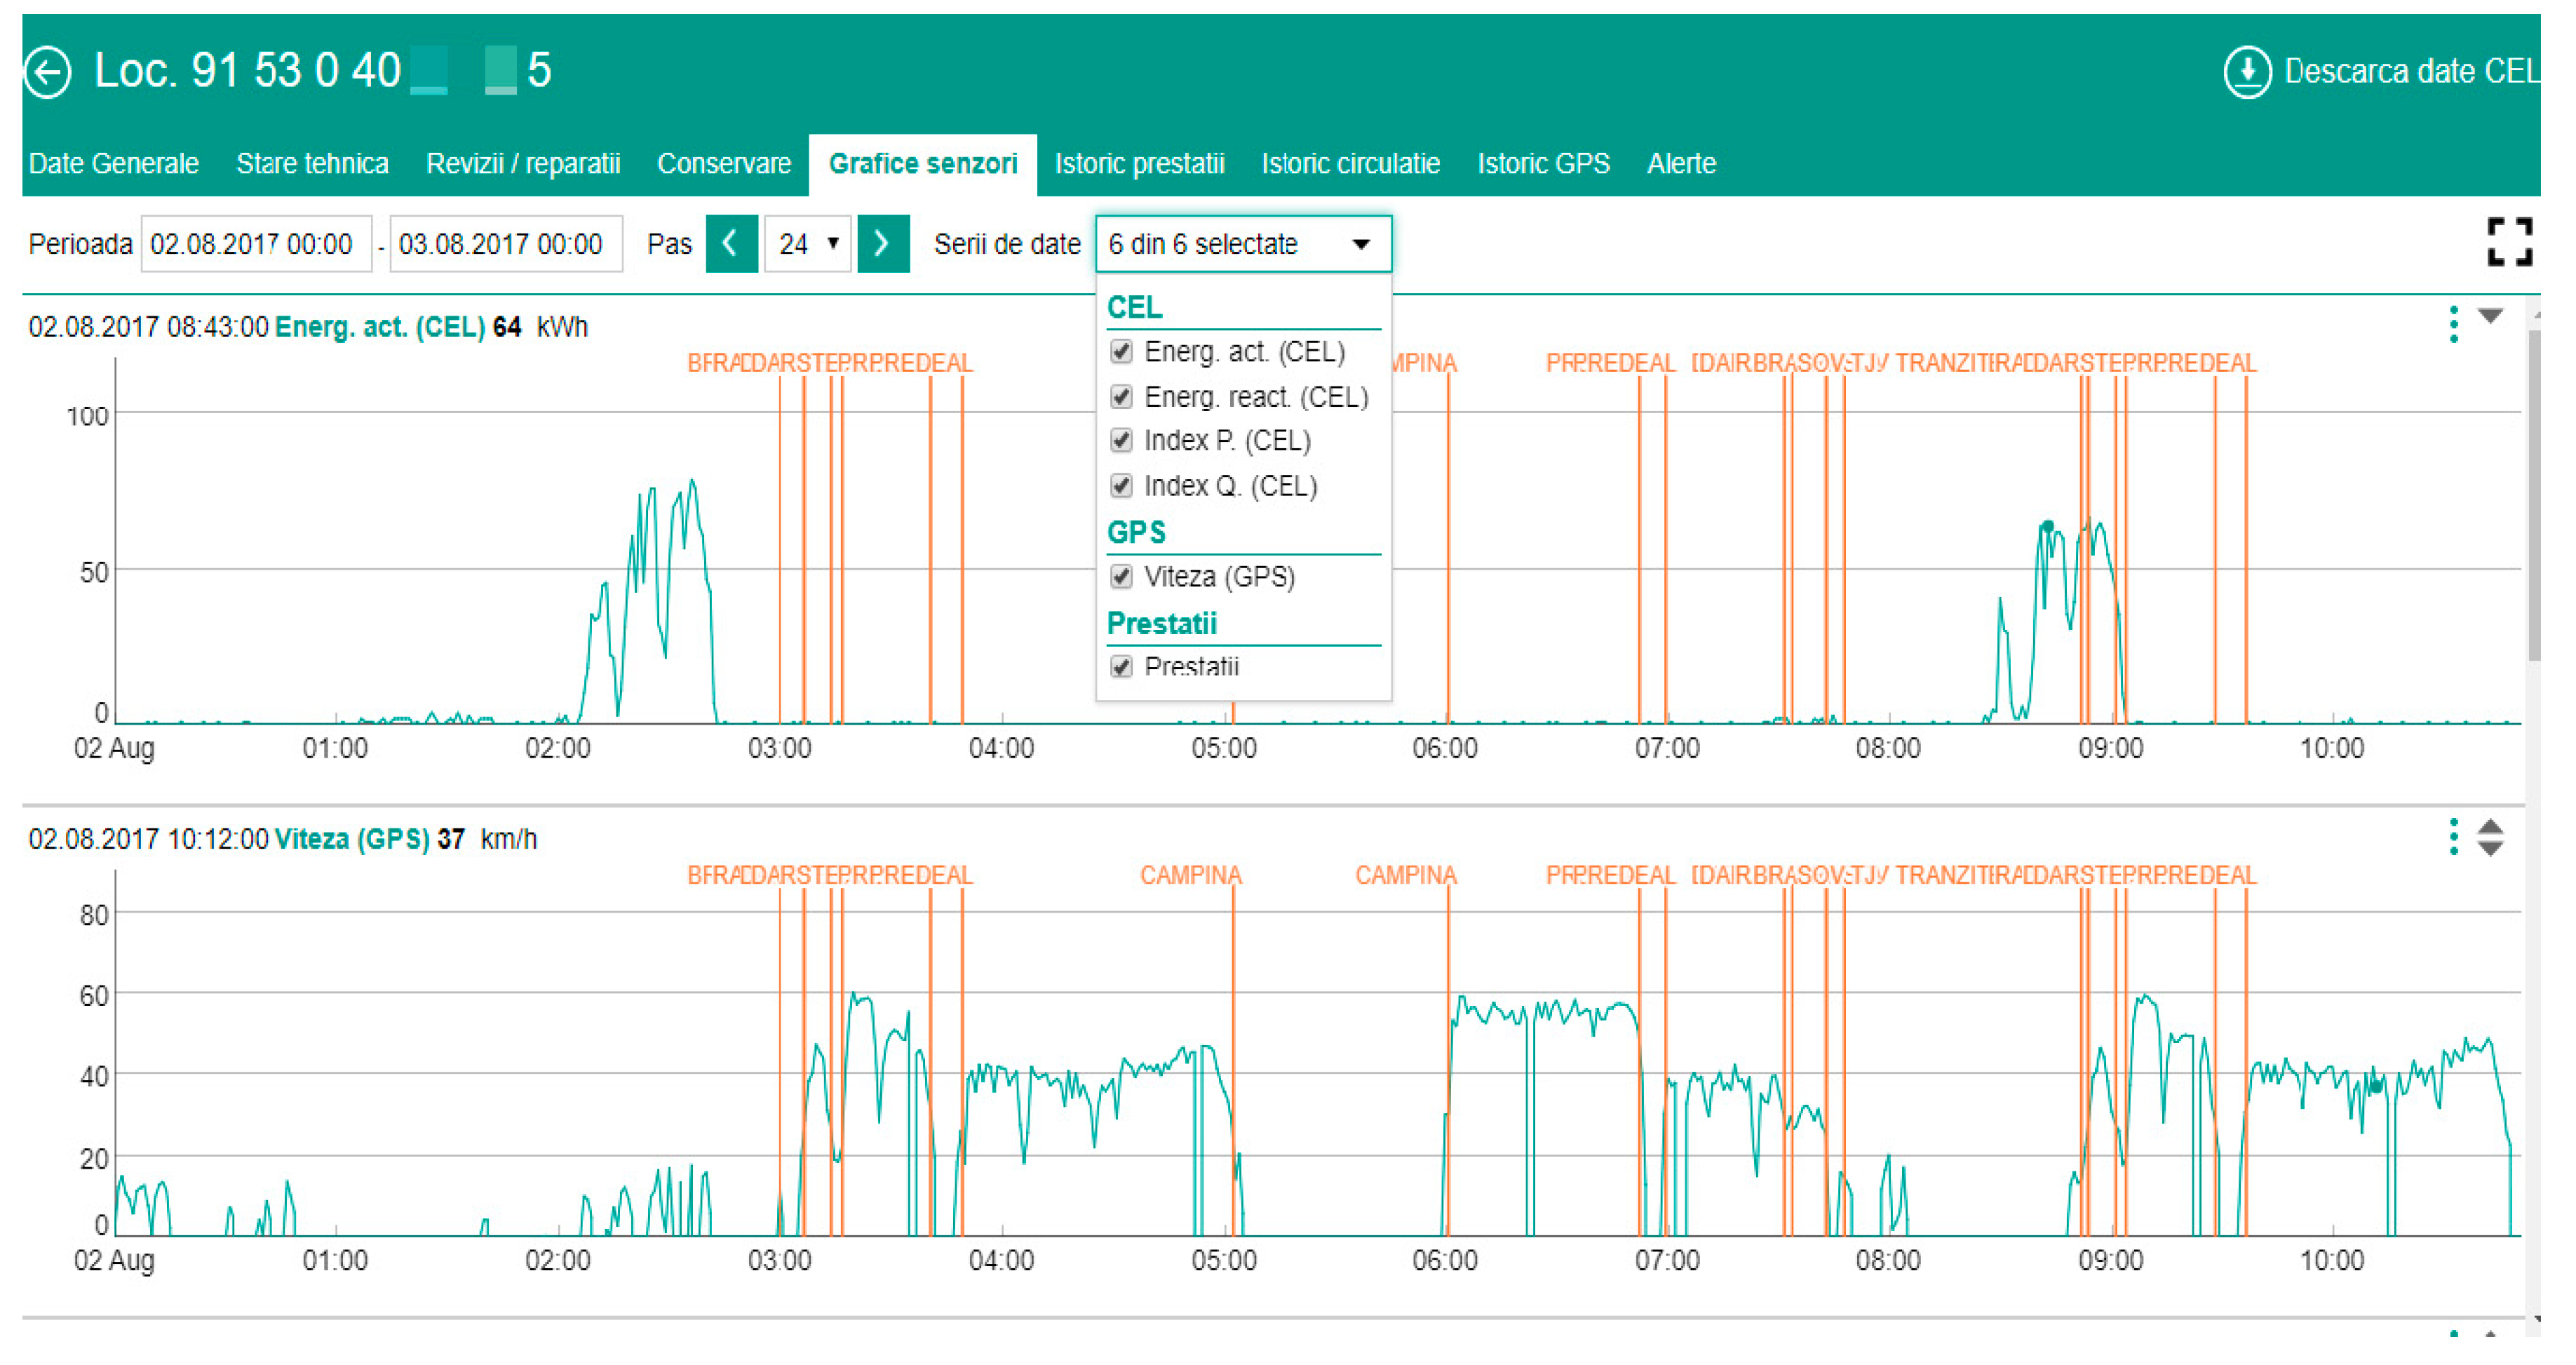
The correlated information for train speed, fuel or electricity consumption, and geographical identification is illustrated in
Figure 5.
4. FERODATA System Architecture
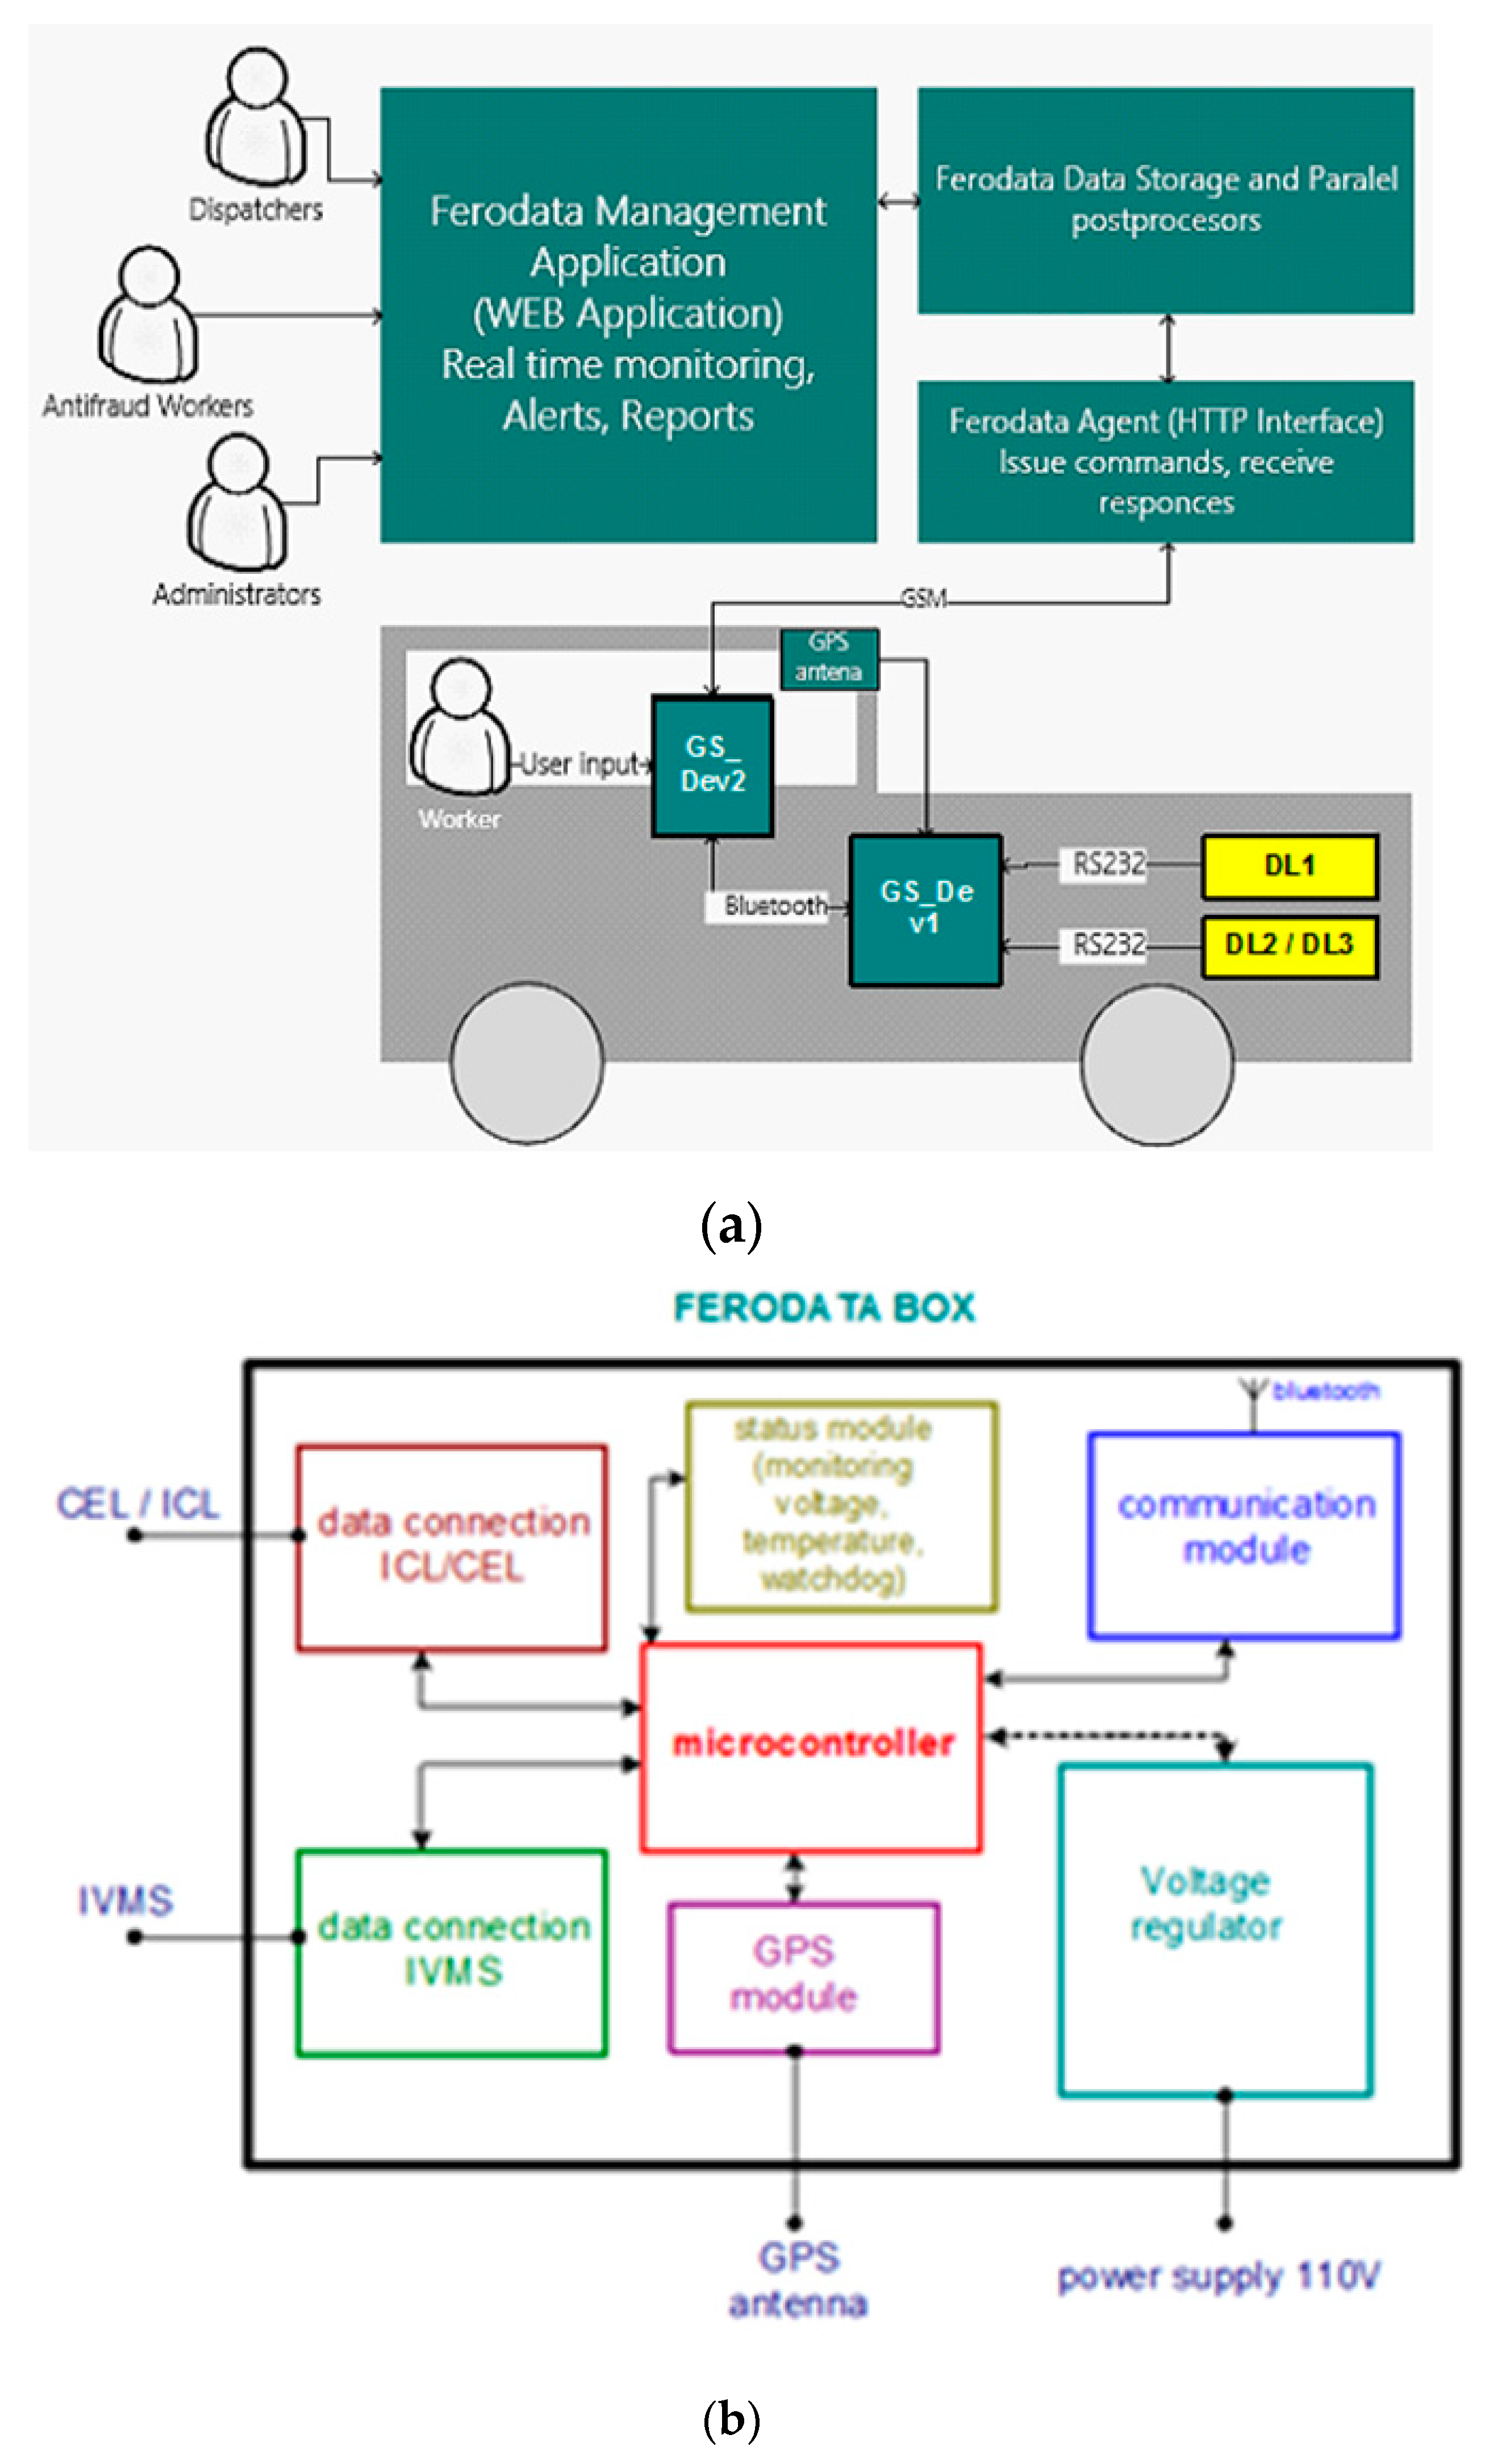
The FERODATA system architecture consists of Ferodata SYS, Ferodata BOX, and Ferodata Mobile, presented in
Figure 6a,b. Ferodata SYS is the web-based module accessible at the headquarter and has all the information collected from the locomotive and their operators such as:
(1) Locomotive list: shows the information about the actual position for all locomotives, functional status, the revisions, diesel level, current worker, current activity, current train number, communication status (online/offline);
(2) Map monitoring: illustrates all the locomotives on a map view, showing information about its type, circulation status, direction, speed, alerts, etc.;
(3) Circulation chart with a graphics-based presentation of train circulation on a selected transport relation and period;
(4) Sensor data export allows exporting original data collected from the locomotive sensors (DL1, DL2, DL3) for a selected period and group of locomotives;
(5) Comprehensive view of all alerts issued by the system (consumption alerts, data unavailability, connection unavailability, etc.).
The Ferodata BOX (GS_Dev1) acquires information of interest (GPS location, fuel/electricity consumption, train speed, alarm situations) and sends them via wireless to a mobile device or tablet using Ferodata Mobile (GS_Dev2).The Ferodata BOX, presented in
Figure 6 is a piece of hardware equipment mounted in the locomotive connected to the locomotive sensors IVMS (DL1), ICL (DL2), and CEL (DL3) to collect real-time technical information.
The GPS module collects position information at every 5 s, communicates with Ferodata Mobile; registers GPS coordinates at every 5 s; communicates with Ferodata to send data received from locomotive devices; self-monitoring functions (internal temperature, voltage); reliable in hard conditions (temperature, vibration, humidity).
The Ferodata MOBILE is an Android-based mobile application installed on a tablet that collects data from Ferodata BOX and delivers it to the headquarter via mobile data connection channel. It also collects the activity data reported by locomotive operators. This application is a mobile application, compatible with Android 5 that allows the locomotive mechanic to report its current activity. The application communicates with Ferodata SYS; it receives commands that are sent to Ferodata BOX for execution and sends back responses for previous commands from SYS; communicates by Bluetooth with Ferodata BOX in order to send commands and receive responses; stores data, using storage until the reliable data connection is available.
A locomotive is equipped with the SSAMR devices (a device for measuring and recording speed, safety, and awareness) (DL1) and ECR (electric consumption recording) (DL2) or ICL (fuel consumption recording) (DL3). These devices answer to the commands initiated by Ferodata BOX (GS_Dev1) using RS232 protocol. GS_Dev1 interrogates, at certain time intervals, the devices DL1/DL2/DL3 and stores data in a buffer memory. Consequently, the GS_Dev1 device communicates with GS_Dev2 using Bluetooth. GS_Dev2 can initiate the reading of the DL1/DL2/DL3 commands by sending instructions to GS_Dev1, which in turn sends the commands to DL1/DL2/DL3.
The data received from DL1/DL2/DL3 are stored locally in GS_Dev1 and then are sent to GS_Dev2. After the data is received by GS_Dev2 and checked in terms of integrality, a new command is generated to GS_Dev1 to clear the memory buffer.
Data communication between GS_Dev2 and GS_Dev1 is carried out in text mode, using ASCII code, except for the commands used to download certain buffers which will be transmitted in binary mode. In the case of commands/answers with multiple parameters, these parameters will be separated as follows P1 = V1#P2 = V2, where:
P1 represents the name of parameter 1;
V1 represents the value of parameter 1;
P2 represents parameter 2;
V2 represents the value of parameter 2;
# represents pair separator of parameter-value type;
= represents a connecting relationship between parameter name and parameter value;
a maximum of 100 configuration commands in the interval CMD_000–CMD_099.
Some examples of commands are presented in
Table 1.
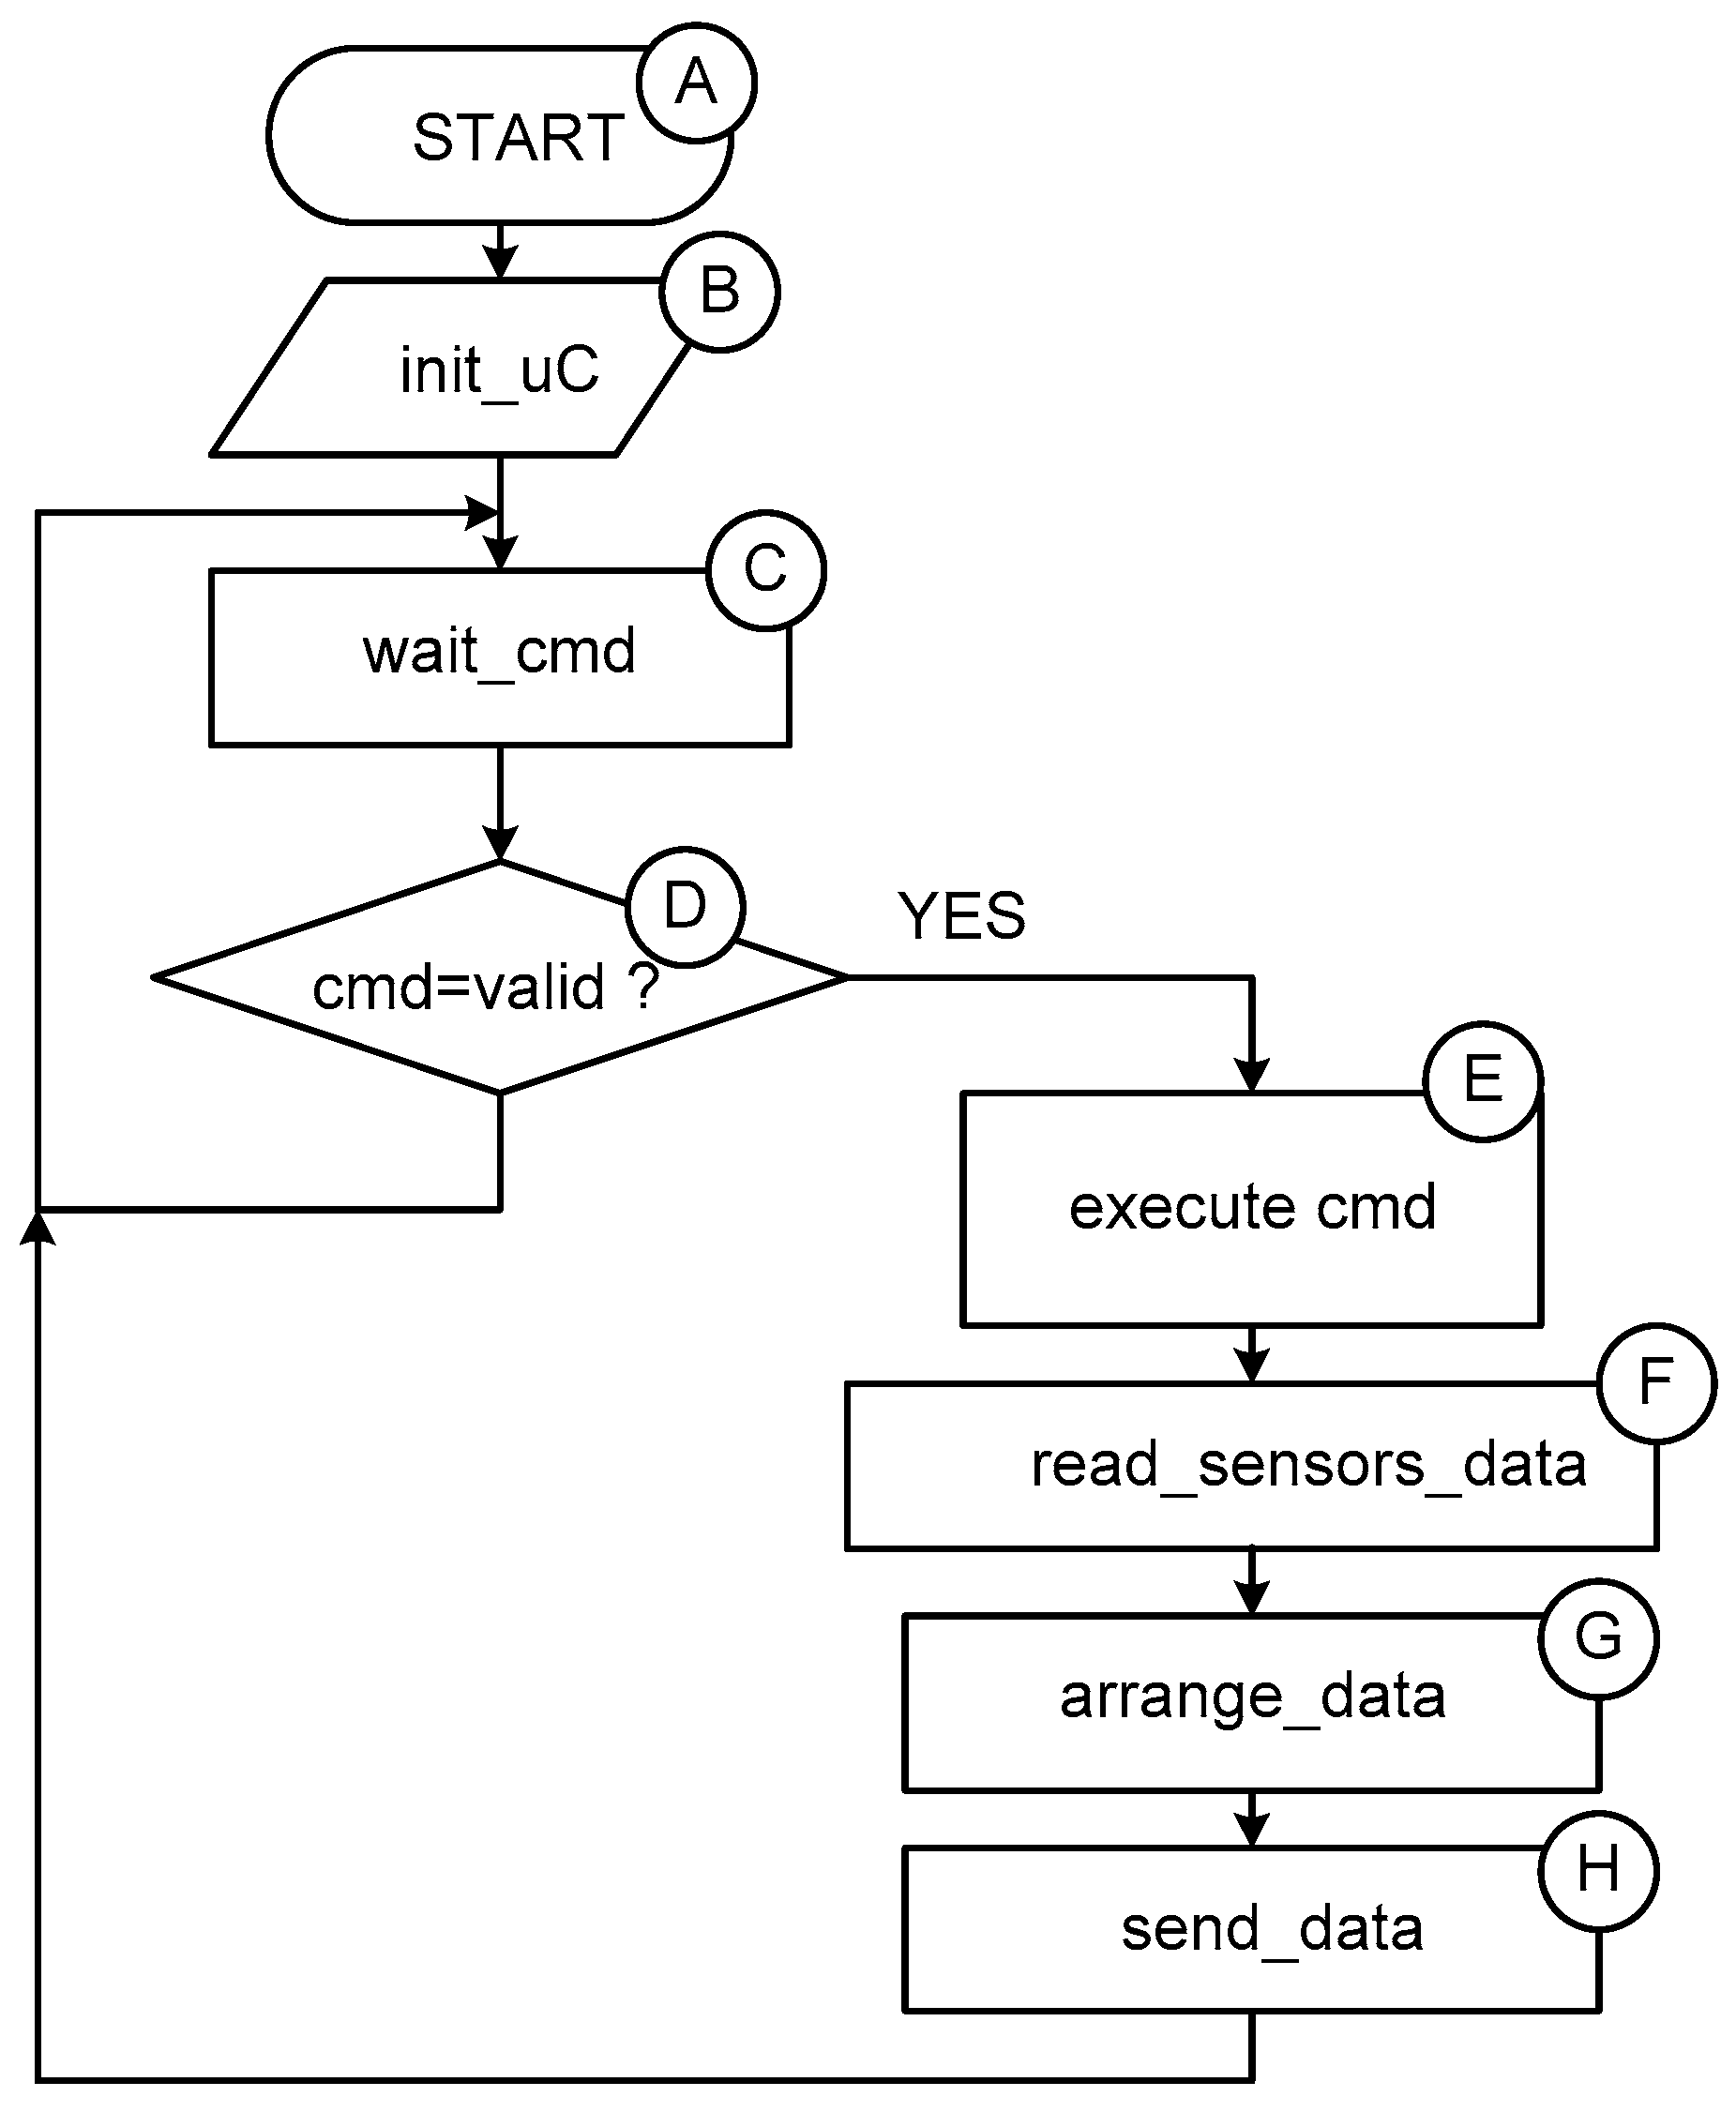
The program flow chart implemented in GS_Dev1 is presented in
Figure 7. After the start of the circuit and initializing the device parameters (represented by A and B labels) the program is waiting for a command (the list of the commands is presented in
Table 1 of this paper), this operation is represented by C label. According with the command message (conditioned through D label), if the command is valid a dedicated block code will be executed (label E), the sensors data will be read, the data will be arranged in data packages (label G), and they will be sent to the GS_Dev2 device (label H).
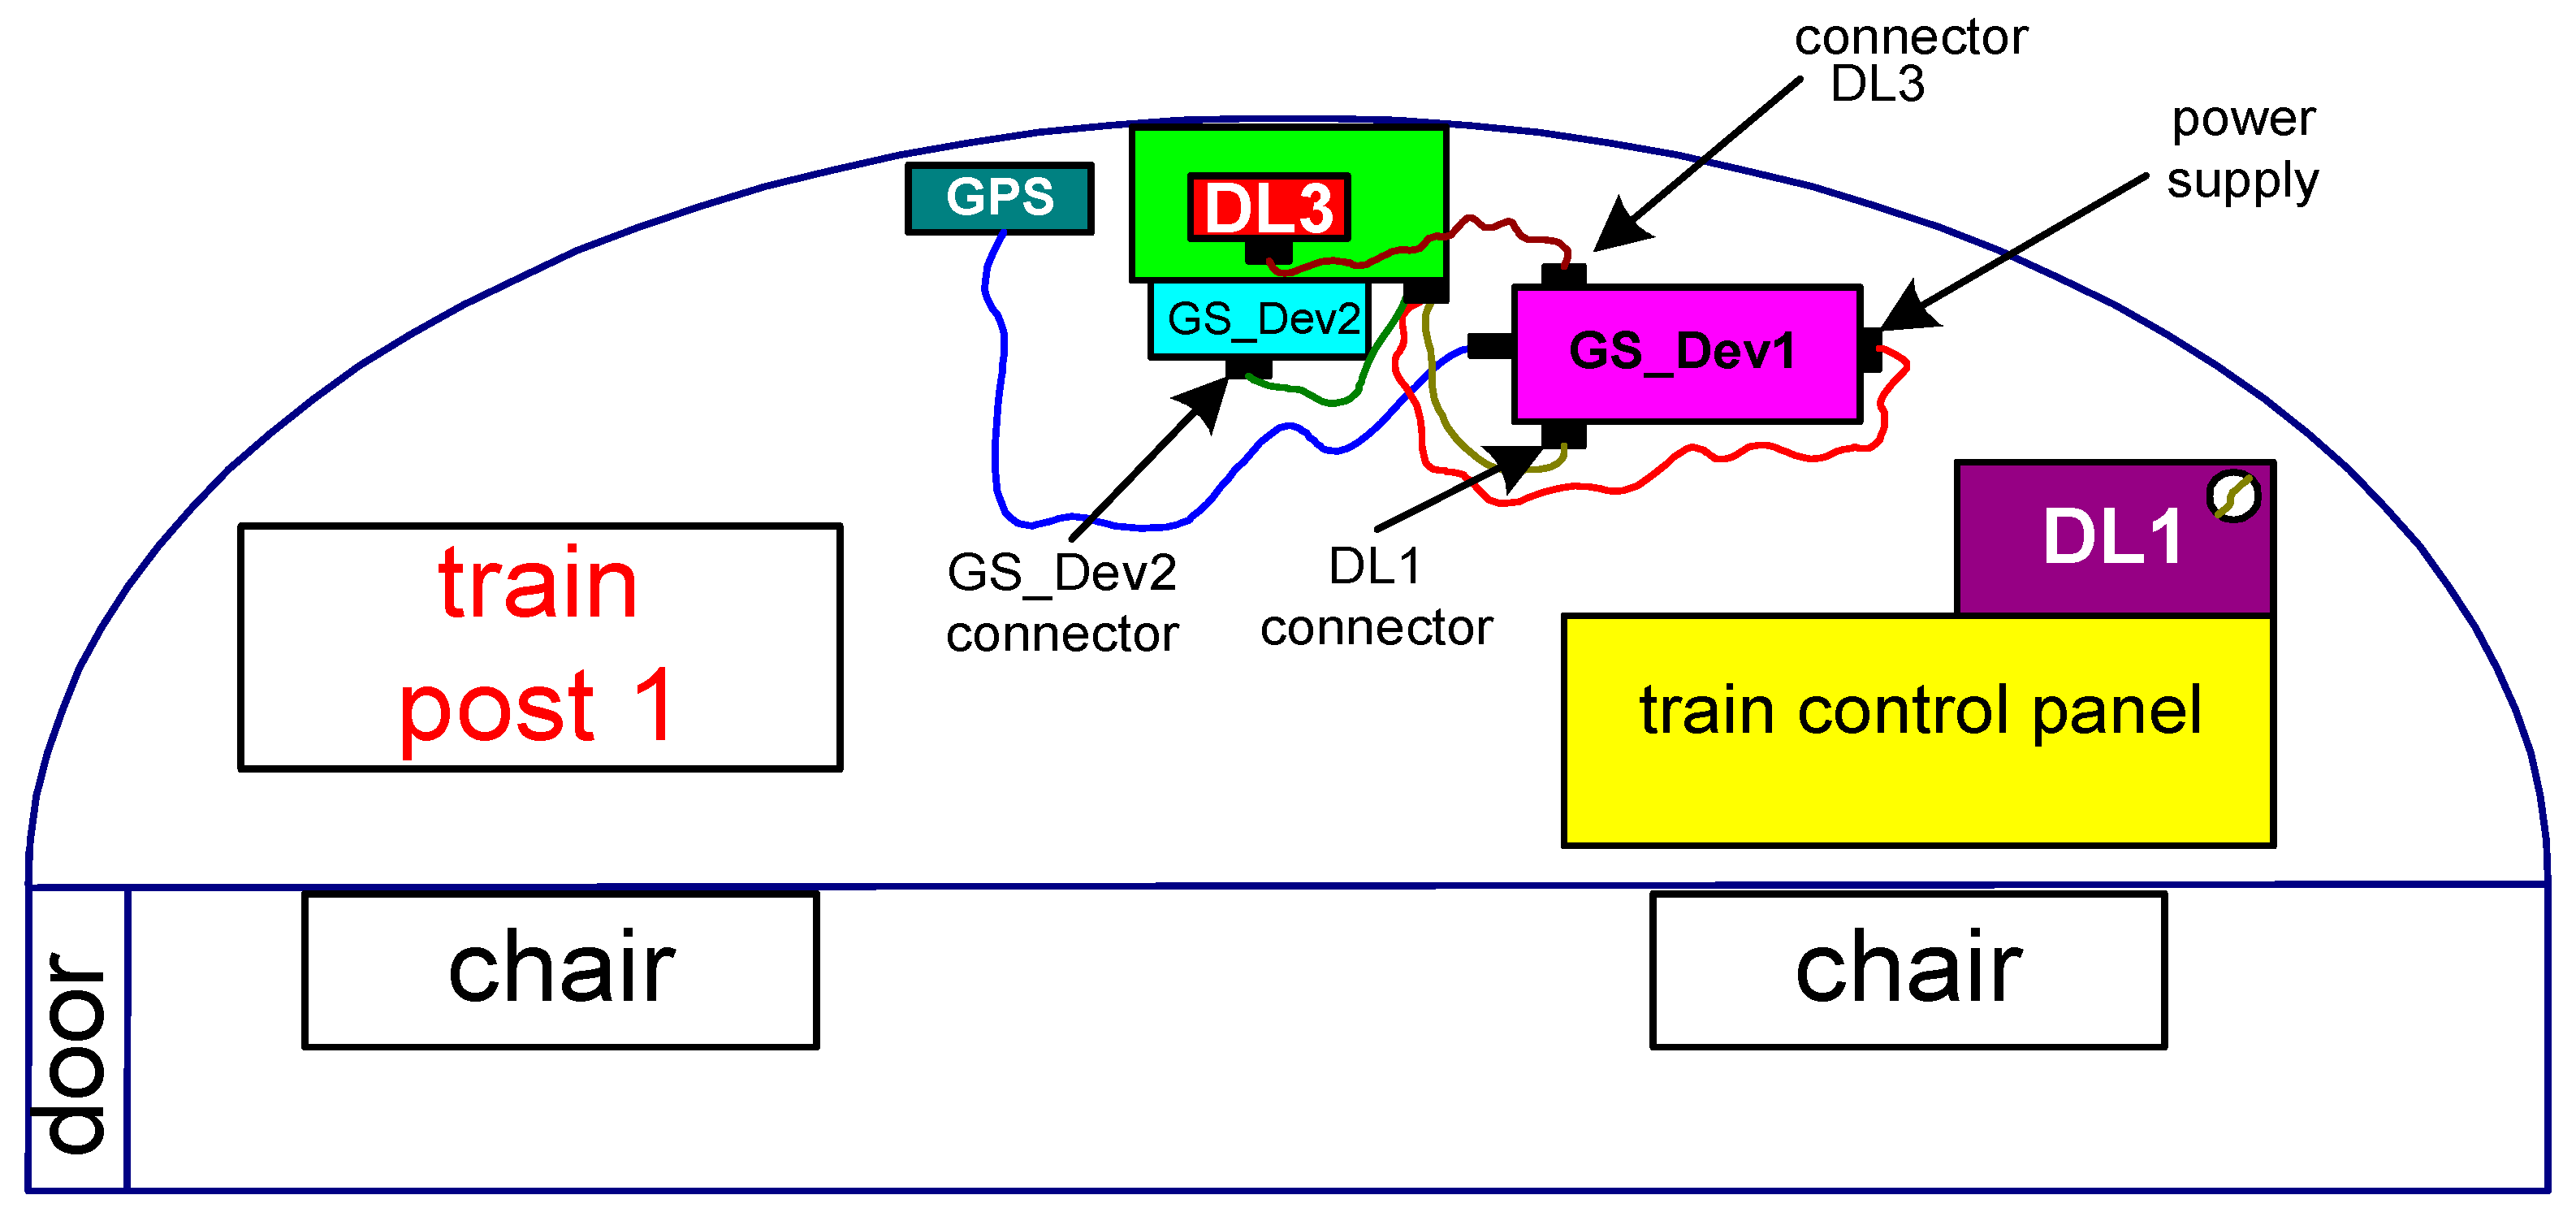
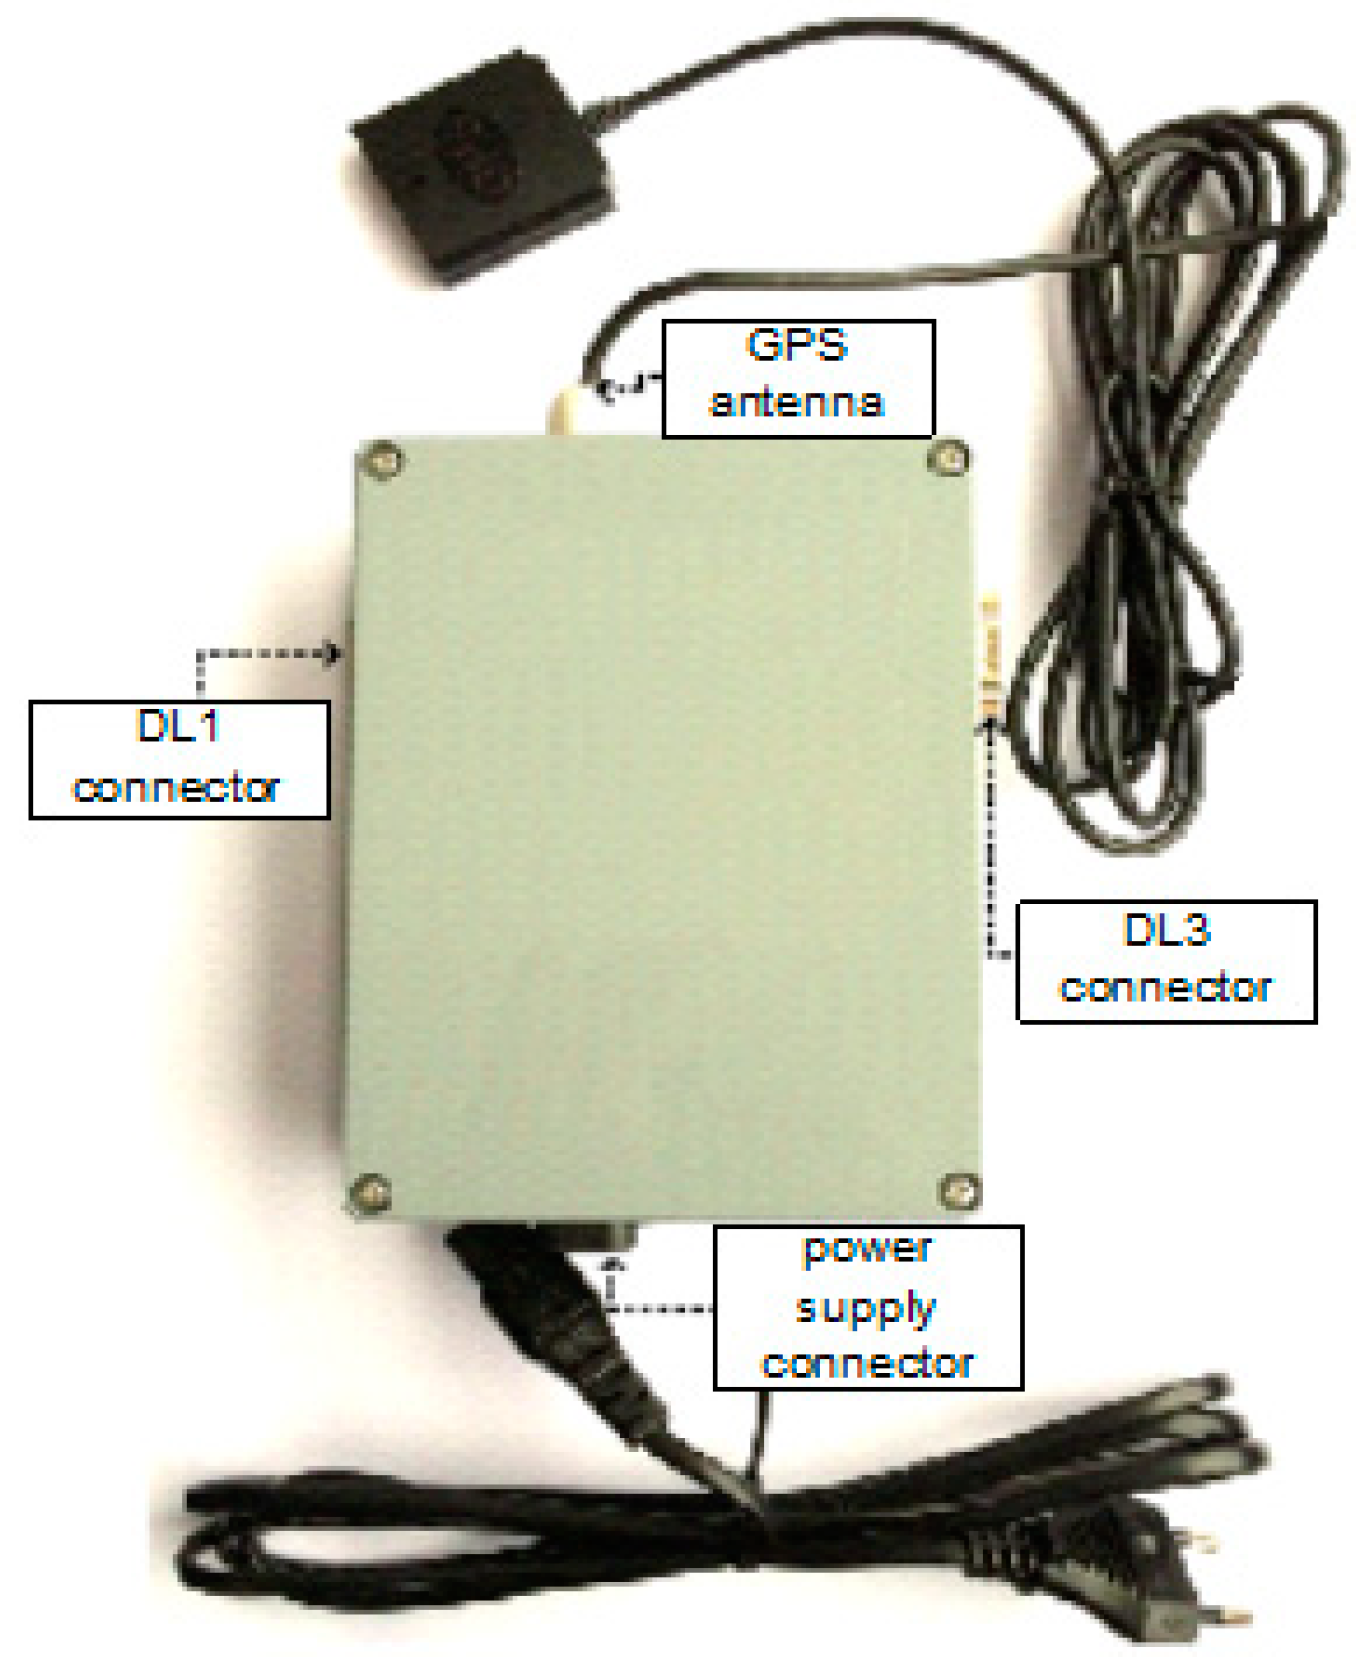
The command post no. 1 of locomotive LDE and the components of the electronic assembly of the device GS_Dev1 are illustrated in
Figure 8, as a block scheme. The GS_Dev1 device has four connectors for the connection with GPS antenna, DL1, DL3, and power supply.
Figure 9 illustrates an upper view of the GS_Dev1 device and the connecting elements with the DL1, DL2, and DL3 devices. The power supply of the GS_Dev1 device can be made from continuous current (CC): min. 110 V, max. 350 V. (directly from the batteries mounted on the locomotive) or alternative current (AC): min. 80 V RMS, max. 250 V RMS.
5. Results
Data monitored in the railway transport system refer to train parameters and railroad parameters [
16,
17,
18,
19]. This paper presents a system and a method of train wagon parameter monitoring using a wireless sensor network [
20,
21,
22]. The data generated by the sensors are transmitted to the device GS_Dev1. Parameters monitored by the sensors mounted on the train wagons are speed of the wagon, temperature, geographical location, vibrations, etc. [
23,
24]. It is also possible to establish the order of the wagon in the lining train [
25]. An advantage of this method is the use of an energy harvesting device based on the wagon movement.
We implemented a method and a device dedicated to monitoring the parameters of the wagons by remote data transfer. The wagon’s position, speed, and other parameters should be known by the train driver and by the logistics department also [
26]. Usually, the connections between the wagons in a trainset are mechanical and pneumatical. The information from the individual wagons could be collected using wireless connectivity.
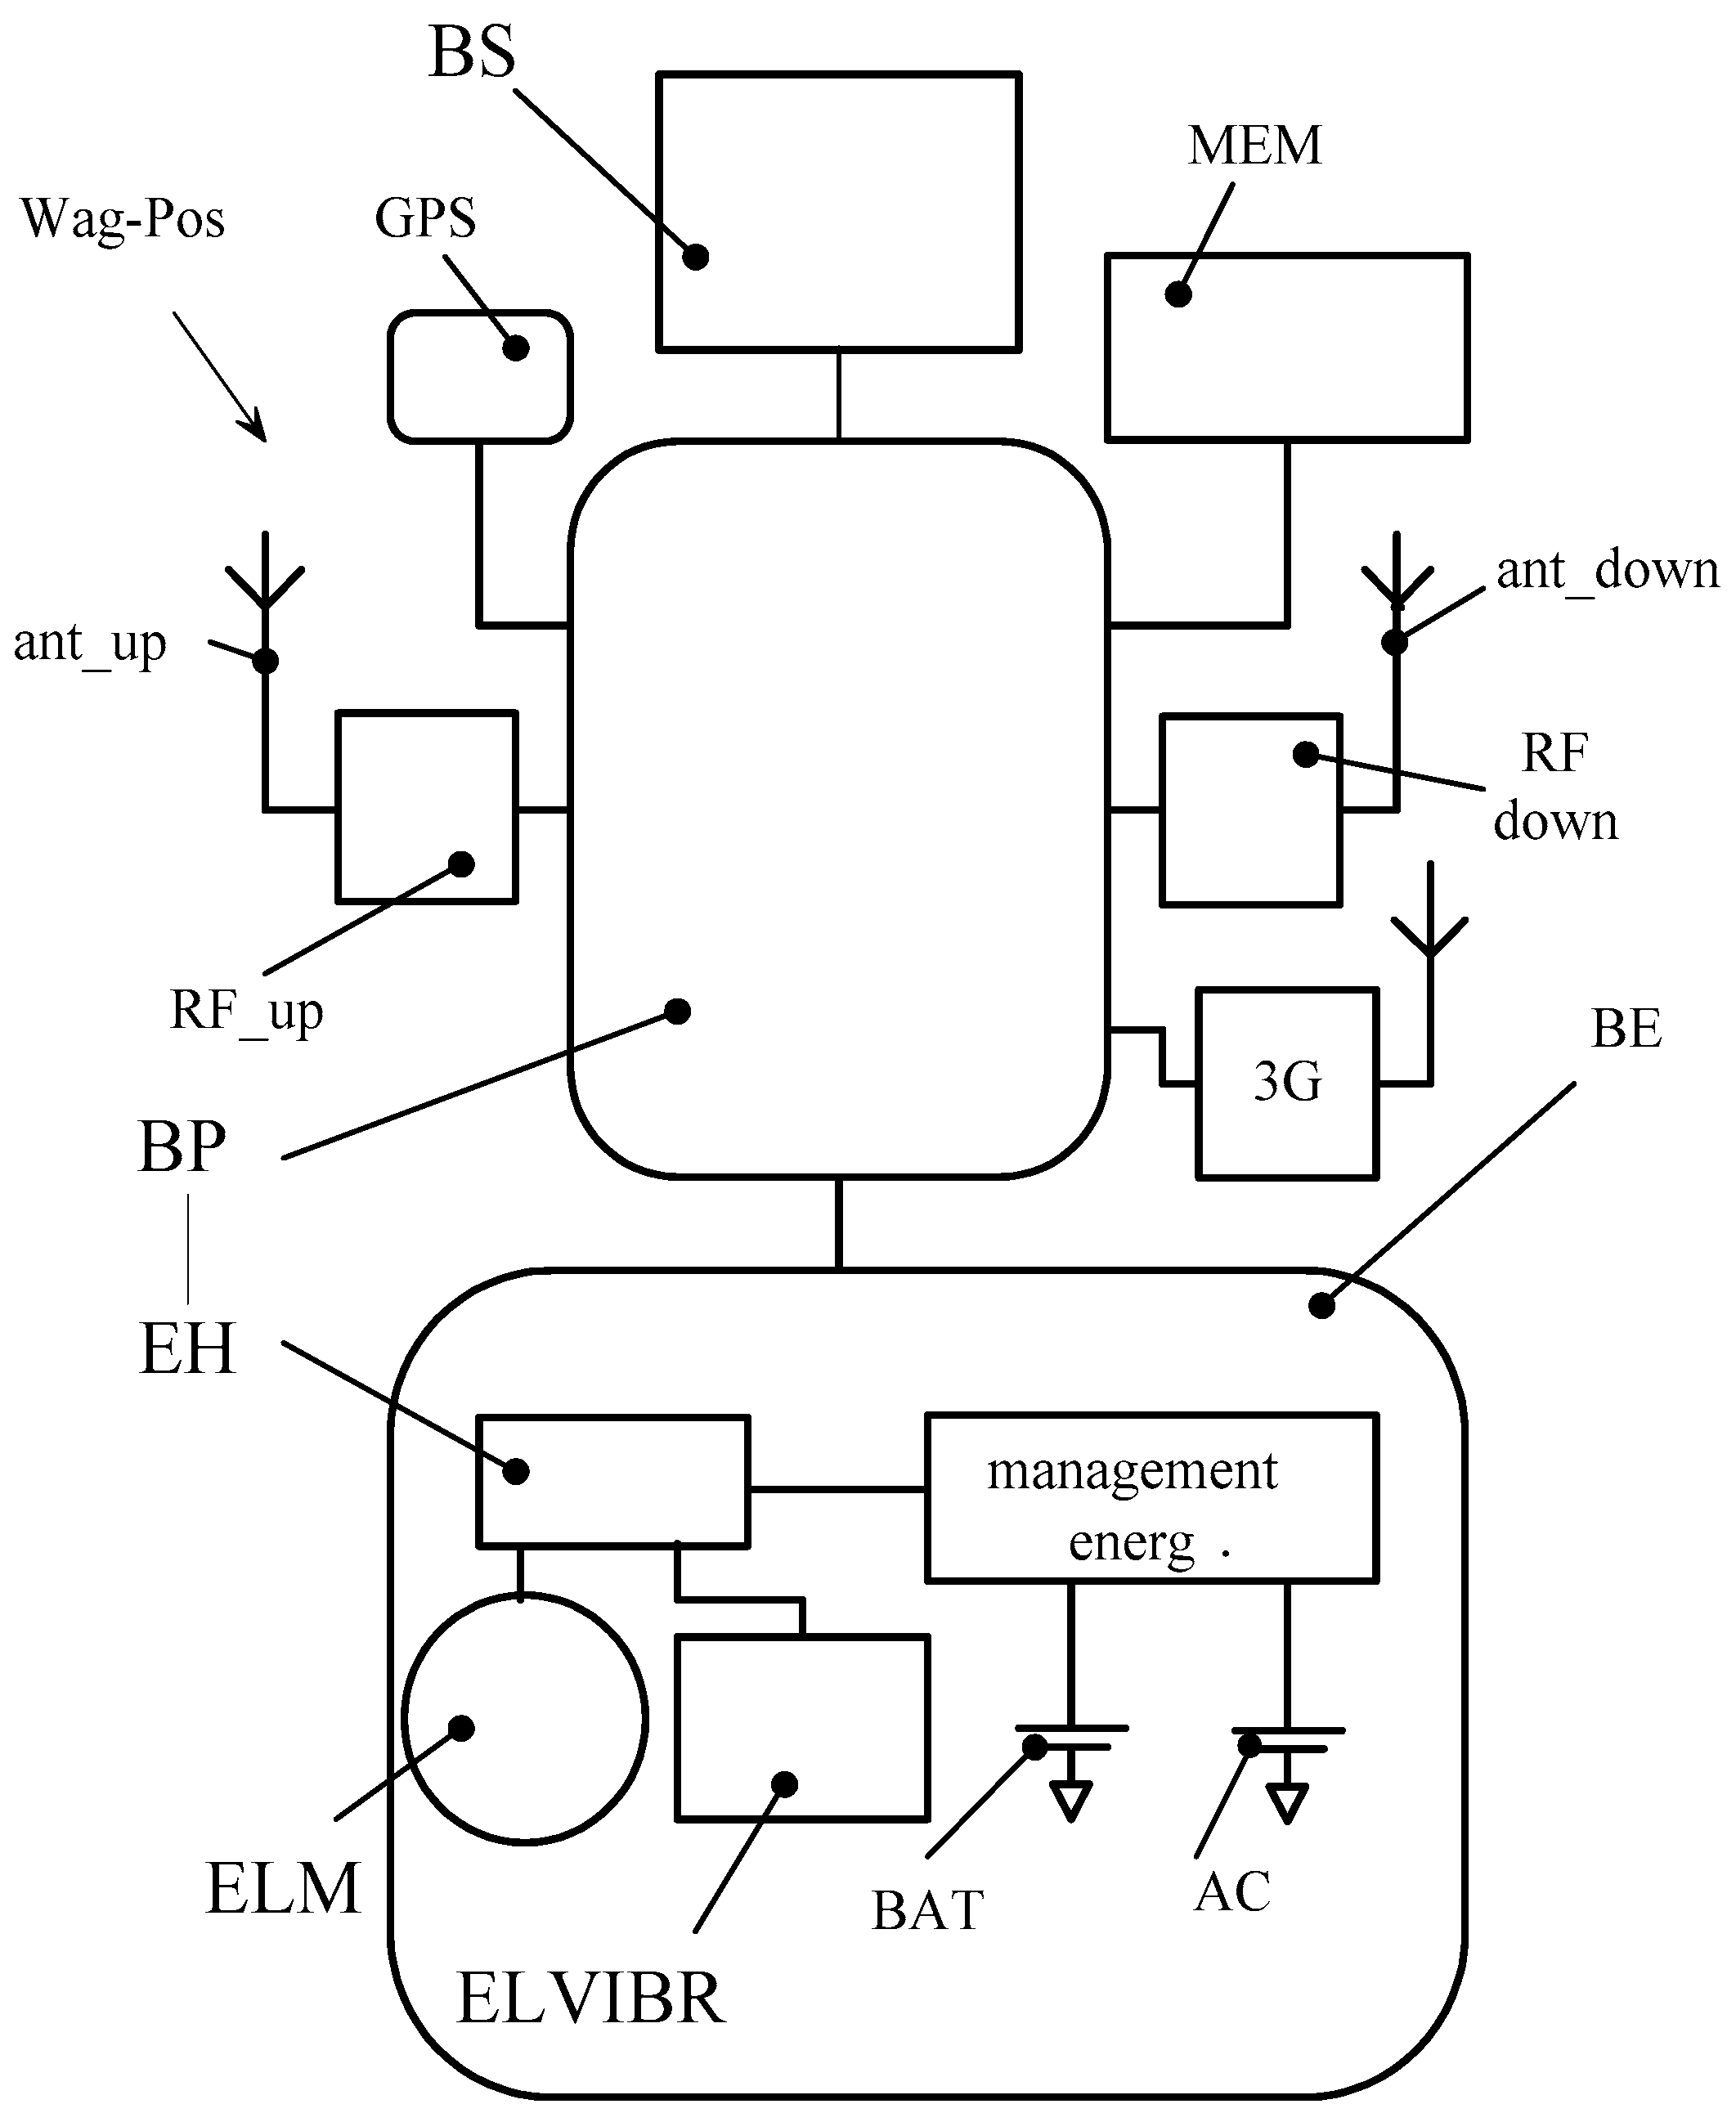
The issues that arise in such technical challenges are related to the sensors, to the connectivity, and the power supply [
31]. The electronic device dedicated to monitoring the wagon parameters (Wag-Pos) consists of an acquisition and processing block AP that gathers the data from a sensor block SB. These data are locally processed, and the information is transferred by several RF communication modules such as RF_up, RF_down, GPRS.
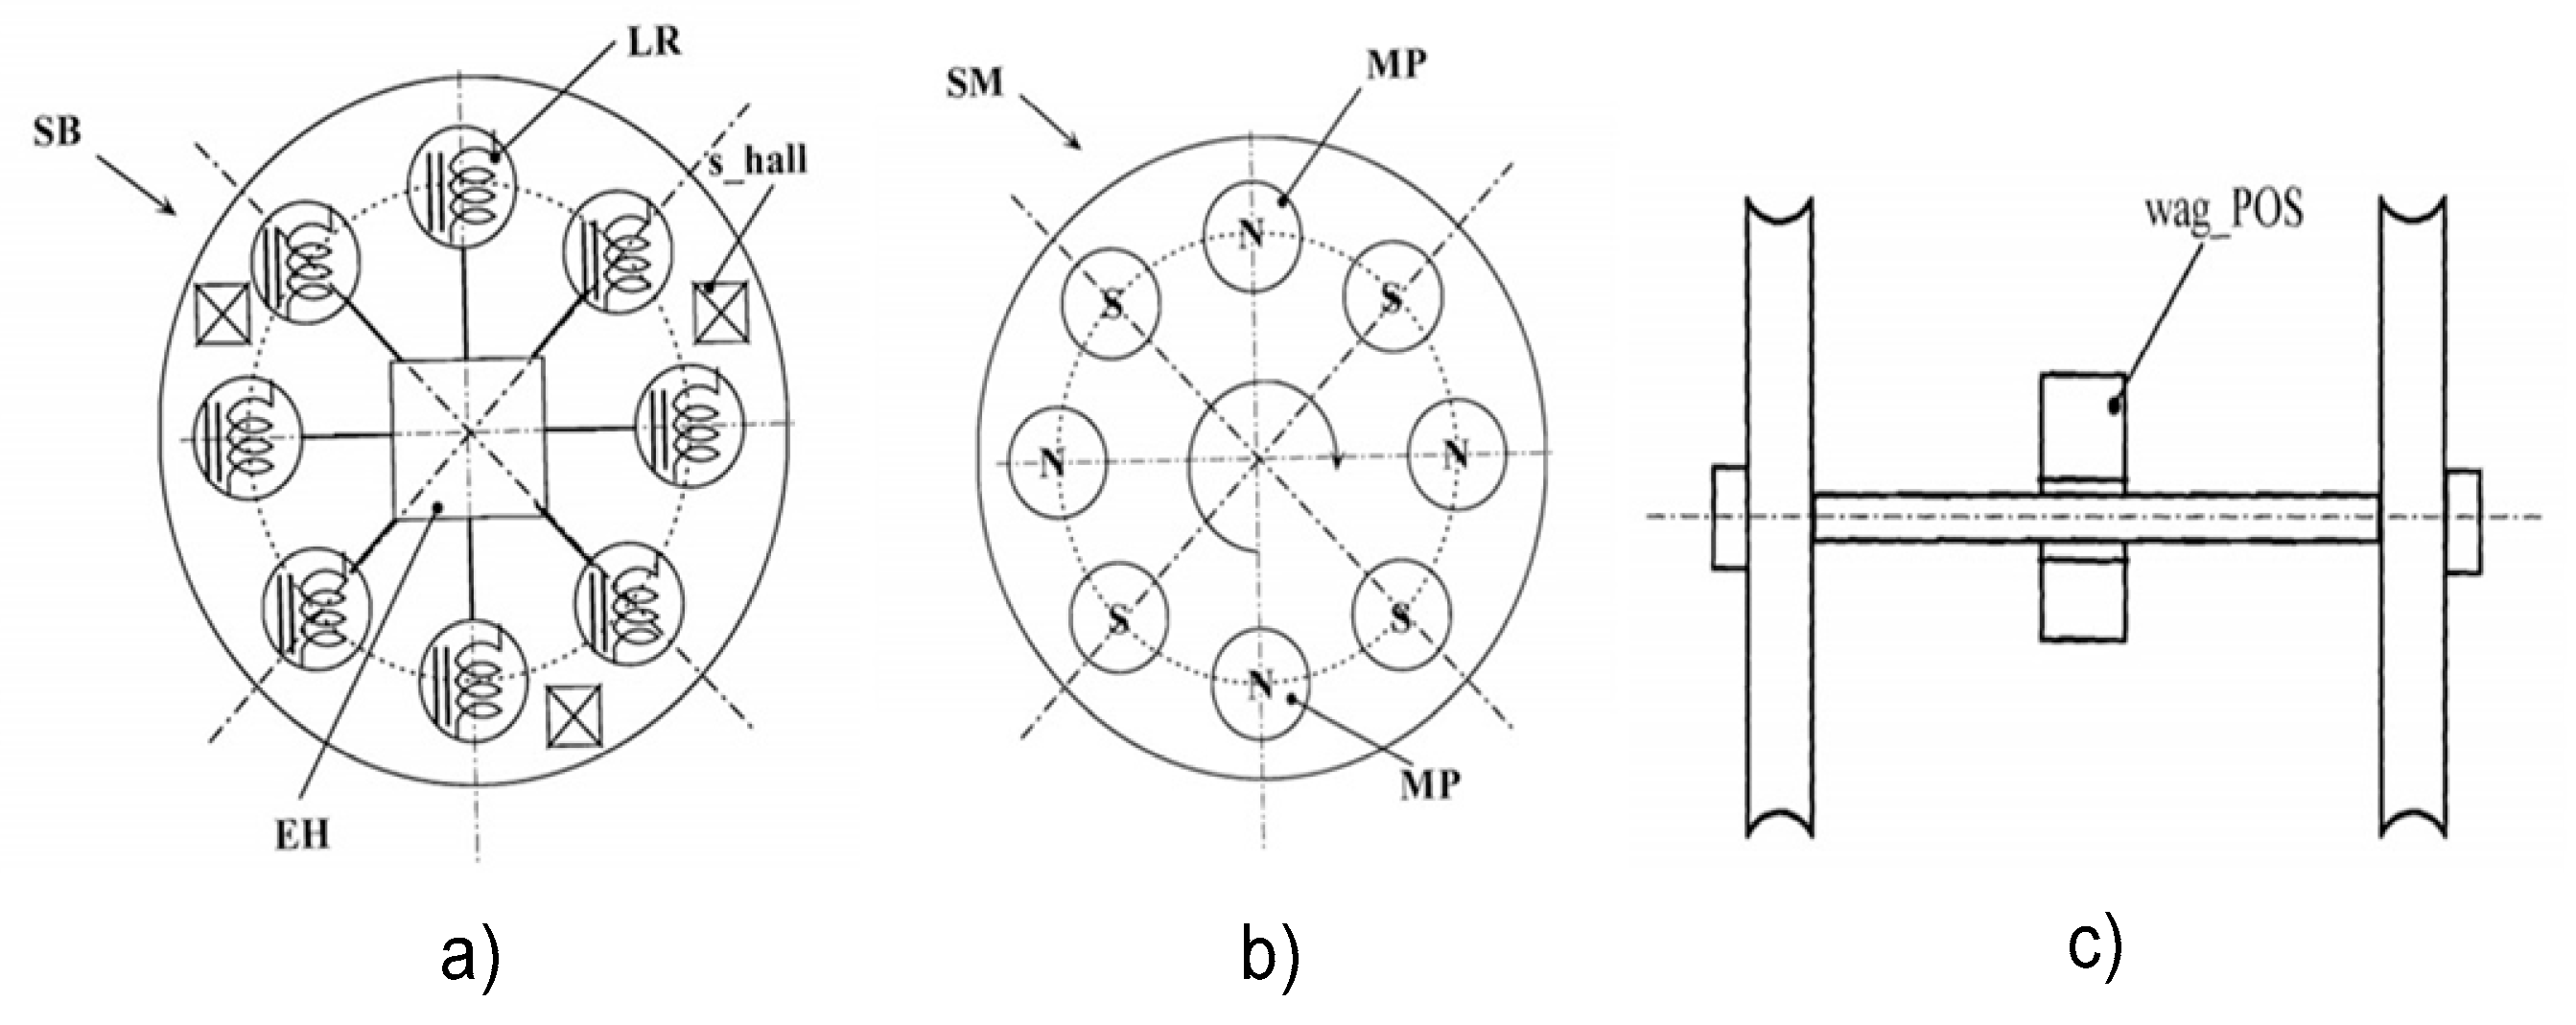
The electronic circuits of the wag_POS module are supplied via an energy block BE which has the role of converting some of the energy resulting from the wagon wheels and vibrations into electrical energy, in order to bring this energy into the optimal parameters of the electronic circuits supply. This role is assumed by an EH harvesting circuit, which stores the energy in a DC storage unit that may be an accumulator or a super-capacitor. The energy resulting from the rotation of the wheels is converted into electricity using an ELM electromagnetic generator (
Figure 10).
Another form of energy that is converted to electrical energy is that resulting from vibrations, the conversion of this energy into electrical energy is done through a piezoelectric or electromagnetic device itself known as ELVIBR. The conversion of the rotation energy in electrical energy is performed according with the technical solution presented in the patent application RO132982A2 [
31].
A set of coils are mounted on a radial support (
Figure 11), these coils gather the variable magnetic field that is generated by a set of magnets which are mounted on a rotating support that is attached on the wheel-axle of the wagon.
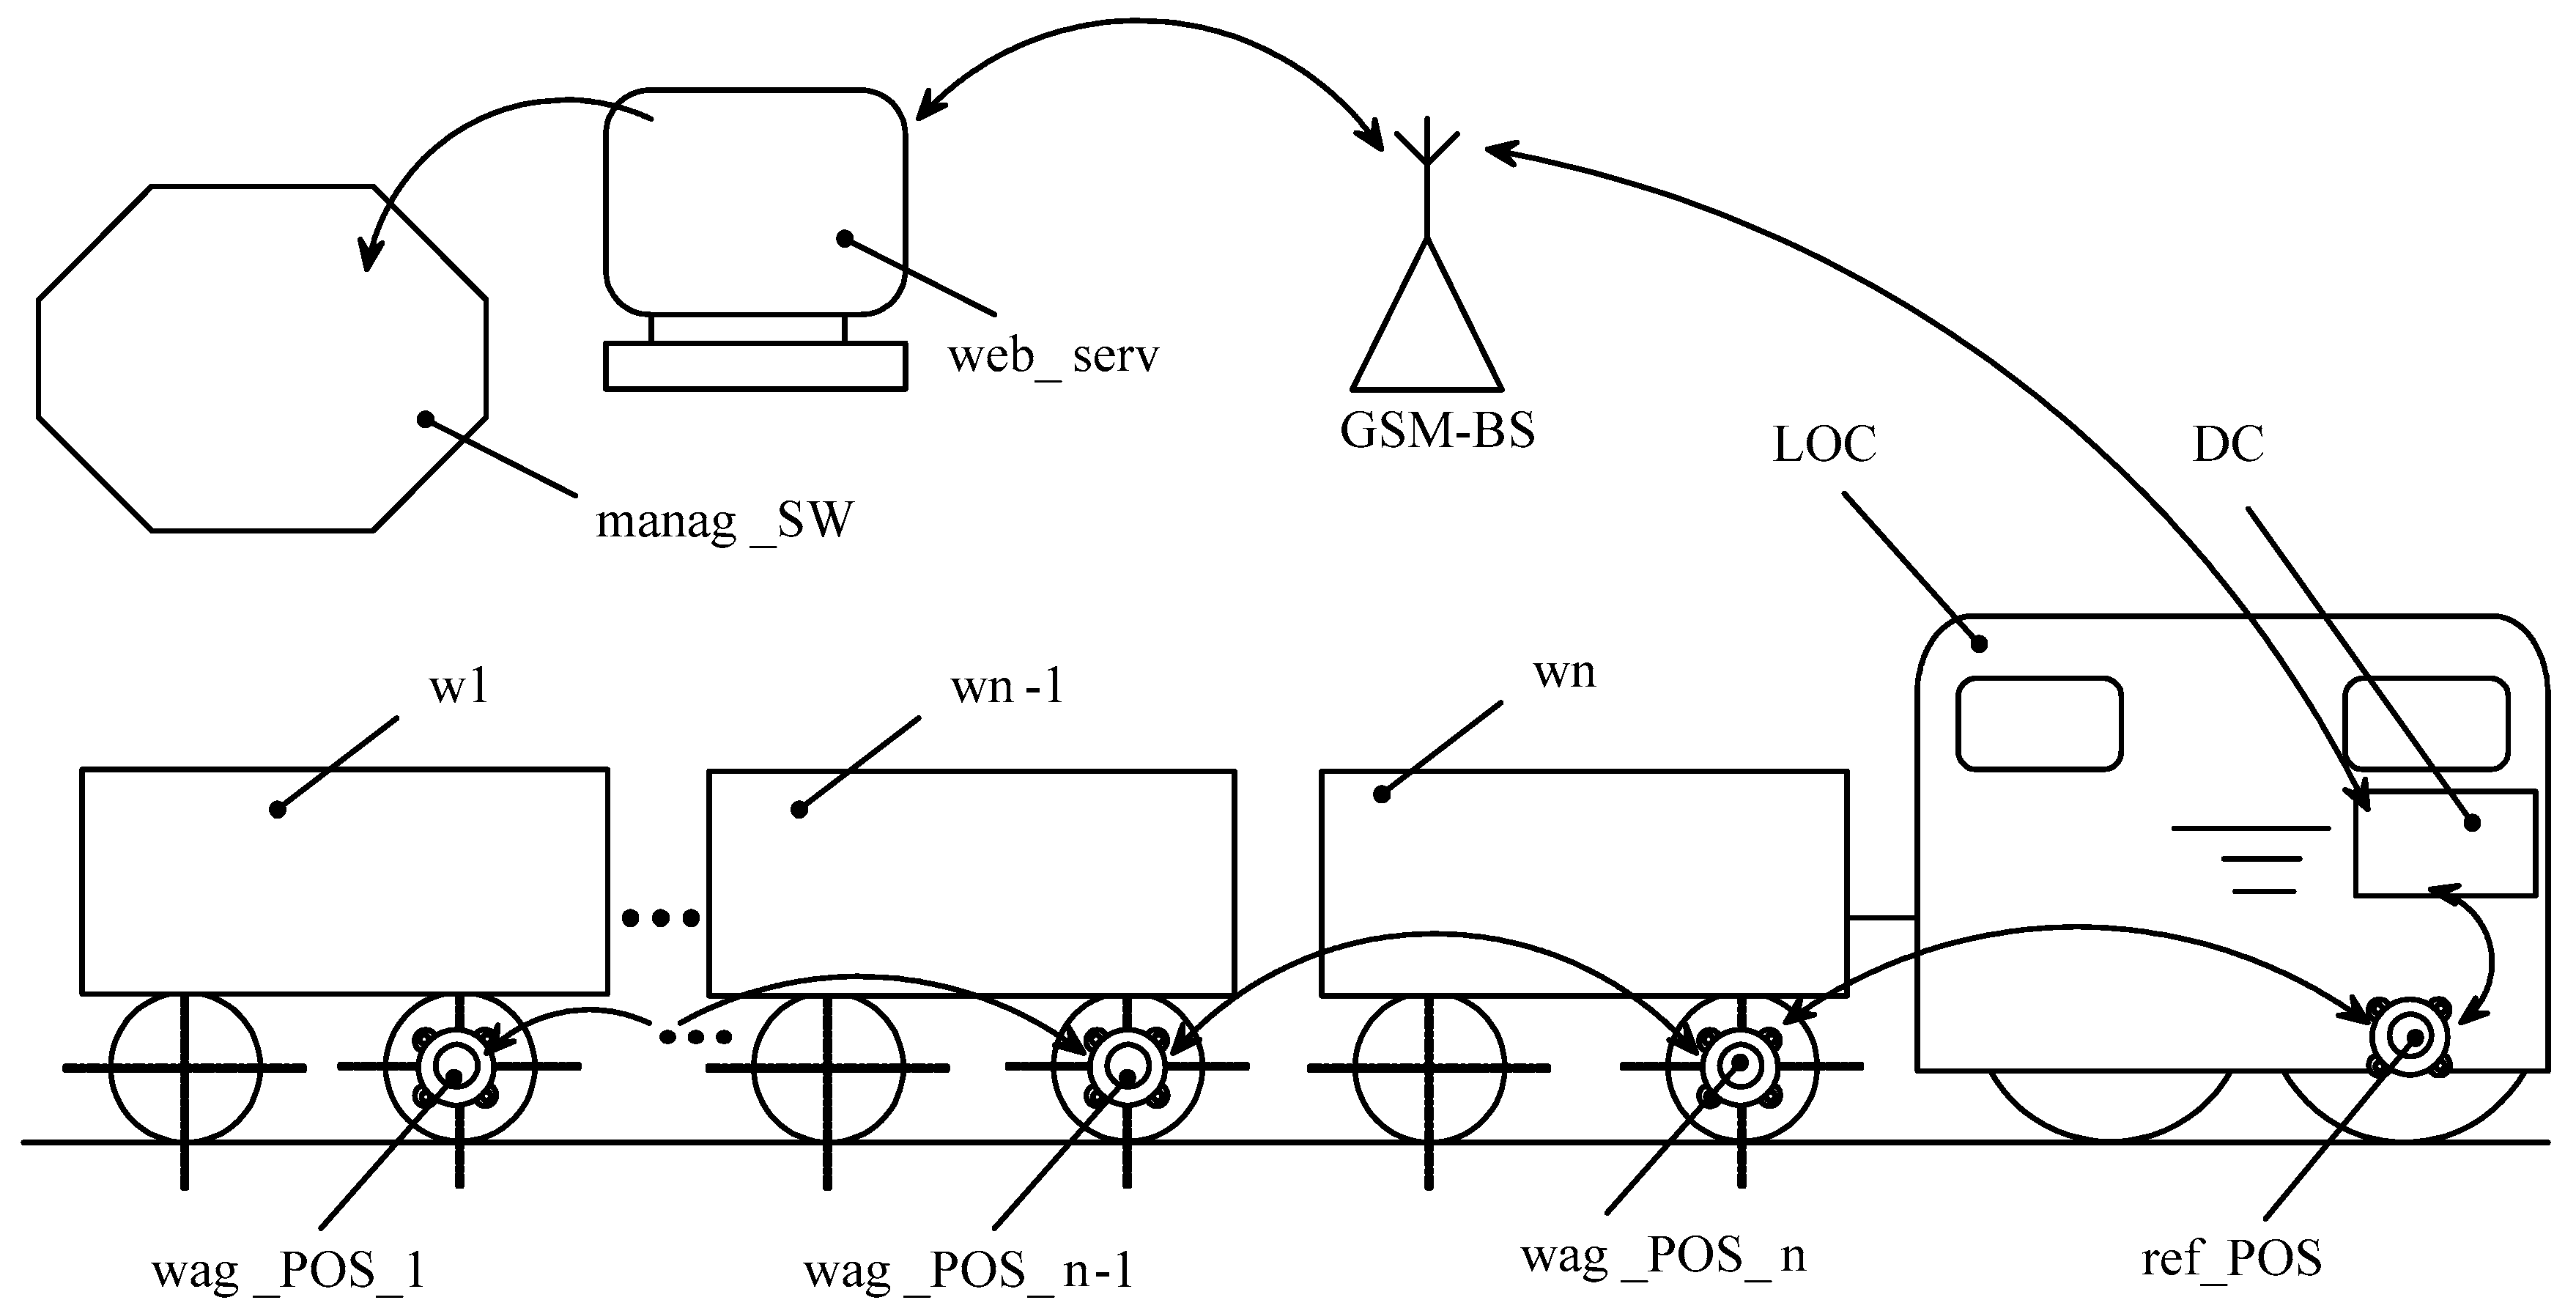
The wagon monitoring system is made up of several electronic devices for monitoring the wag_POS_1, wag_POS_2,…, wag_POS_n (wagon_POS_n) wagon parameters (
Figure 12), which are mounted on a single wagon w
1, w
n−1,…, w
n and communicate in a mesh type network in which each device in an
n position receives data from a device in an
n − 1 position and sends these data to a device in an
n + 1 position (“up data transmission”) or a device in position
n receives data from a device in position
n + 1 and transmits these data to a device in position
n − 1 (“down data transmission”). These communication modes are provided with “acknowledge” messages.
The data are centralized in the memory of a known CD data hub itself which is mounted on a LOC locomotive from where they are transmitted through a GSM-BS relay to a web_serv web-server to be processed by a manag_SW management program. The method and system for monitoring the wagons are intended for railway transport companies that need to organize their transport activities. It is necessary to know in real-time what is the configuration of a train lining, to find out the identity of the wagons to be attached to a gasket, to identify the situations in which a wagon or a group of wagons comes off the configuration of the gasket.
The configuration of a moving train gasket is determined by establishing a database of all the wagon IDs that are inscribed in the pos_WAG devices. The scenario is as follows: (a) the data center receives a command to verify the gasket configuration; (b) the data concentrator sends the command to verify the configuration of the gasket to the device in the immediate vicinity, whose index considering it as n, the value of n indicating and the number of wagons of the gasket; (c) the command propagates in the mesh network through each device pos_WAG; (d) each pos_WAG device sends the response through the mesh network to the hub; (e) a comparison is made between the reference database and the database of received IDs. The data routing is performed in a “linear mash routing” [
9], one advantage of this method is low power consumption as compared to “probabilistic routing”.
The integration of the one-wagon ID into the train kit database is done automatically during the wagon connection. The device of the last gasket wagon sends via the RF_down module a query message that will be received by the RF_up module of the pos_WAG device that is mounted on the wagon to be integrated. Following the query message, this module responds with a message indicating the wagon ID, the last coordinates recorded at the station as well as other parametric records.
When parking a wagon, which is the last wagon of the gasket with the index “1” (pos_WAG_1), the last recorded geographical coordinates that are generated by the GPS module of the pos_WAG_1 device will be stored in the memory of the device or sent to the network by the data hub, which takes over the geographical coordinates from its GPS module. The condition of parking the wagon is given by the zero speed of the parked wagon while the locomotive speed is different from zero. The monitoring of train parameters using a wireless sensors network (WSN) is supposed to approach at least two aspects of the practical applications. In SEAIT wireless sensors network three routing models are allowed: probabilistic routing, ad-hoc routing, and linear mesh routing. In our application, we adopted linear mesh routing because for the first two models the communication between the gateway and the nodes is performed individually which means that the gateway (data concentrator) should allocate successive resources to interrogate each node individually. In the case of linear mesh routing the data pass step by step from a node to others and finally are collected in a unique memory location that is situated in ref_pos module.
6. Conclusions
This technical solution is dedicated to monitoring the train parameters based on an innovative system that could be adapted to a locomotive as an aftermarket device. The application concept presented in this paper has started from a commercial requirement and all the R&D and production stages are covered. The paper is structured in two sections: the first one approaches the challenges concerning the locomotive parameters (velocity, fuel level, engine rotation, etc.) that are monitored by sensors implemented during the vehicle manufacturing, named FERODATA system. The second section describes a method and a system dedicated to monitoring the wagon parameters: velocity, geographical position, vibration, temperature, etc.). The FERODATA system is implemented in a pilot application consisting of 50 sets of devices that are working on the locomotives in real-time for more than two years, which proves the robustness of this product. It is the first Romanian platform dedicated to monitoring the locomotive parameters in real-time using an aftermarket device.
The Romanian National Railway Safety Authority (ASFR) decided that each locomotive should be equipped with sensors that detect the railways that are occupied, free, or interrupted, the speed limitations imposed on certain sections, the press of the alarm pedal or button. Beside these sensors, a locomotive is also equipped with other sensors that provide information on the average or instantaneous fuel consumption, the tank fuel level, the pressure in the braking system, the thermal engine, and the auxiliary heating system Webasto. All this information is available and can be accessed through a serial communication protocol by the device Ferodata BOX (GS_Dev1). The electronic device we designed, Ferodata BOX, allows the creation of interfaces with other sensors we placed in locomotives: GPS position sensor and radio frequency communication blocks. The latter communicate through a mesh network and collect information from each wagon (wag_POS_n). All the information collected by Ferodata BOX is transmitted by Bluetooth to a mobile intelligent device named Ferodata Mobile—which is a tablet in our case. The train mechanic can also access an application on Android in order to introduce, if necessary, additional information on the train (the name of the train mechanic, the destination, the load, etc.). The information is then forwarded by Ferodata Mobile to Ferodata SYS which manages the database and displays the status of each train. The FERODATA system included Ferodata BOX, Ferodata MOBILE, and Ferodata SYS used to transmit to a web-server the status and operating information of an electric or diesel train. The wagon monitoring method and system describe an innovative technical solution that covers the requirement of gathering parameter data from the freight wagons using a wireless sensors network. The energy needed for data acquisition and communication is locally generated by a harvesting circuit that converts the mechanical energy of the wagon in electrical energy. Unlike other technical solutions found in the literature [
30,
31,
32,
33,
34,
35,
36,
37,
38,
39,
40], this paper presents an efficient convertor of the rotating movement of the wheel in electrical energy [
31]. The information concerning the wagon parameters was sent in a linear mesh routing from the nodes to the data concentrator.
The Romanian train fleet is outdated, and major improvements are unlikely in the short term. This paper presents a solution for managing the information collected from current locomotives and for adding new information necessary for the modern management of a train fleet. The element that has not yet been validated in practice is the information collected from each wagon. The communication between wagons has been emulated in the lab, but it has not been implemented physically on a commercial wagon. This is a valuable element and we intend to validate it practically as soon as possible, since it collects information from each wagon: speed, pressure in the braking system, the wear and tear of the bogie, the wear and tear of the braking drums, etc.
Future work will include the implementation of an experimental model for the technical solution proposed in the patent application RO132982A2 [
31]. We shall also improve the new features of the monitoring system with an updated user interface (English) and extend the applicability for passenger transport. Another research direction is to conceive a communication protocol that will be used in V2V, I2V, I2I, and IoT technologies and that will bring an extra degree of safety in the rail transport.
7. Patents
Brezulianu A., Wagon Monitoring Method and System, Patent Application RO132982A2, Publication Date: 28th December 2018.
Author Contributions
A.B., C.A., M.H., O.G., writing, original draft preparation, designing, analysis, editing. I.C., A.-L.B., and D.-G.B., review, editing, data analysis and investigation. V.E.B., help in methodology investigation, and content verification. A.B. and O.G., supervision, review, content verification, editing, resources and funding acquisition. M.H. and C.A. review and editing the content. All authors contributed to writing, original draft preparation, designing, and analysis, editing. All authors have read and agreed to the published version of the manuscript.
Funding
This research received no grant funding and the APC was funded by “Ștefan cel Mare” University of Suceava, Romania.
Acknowledgments
The authors gracefully thank “Ștefan cel Mare” University of Suceava for providing material and financial support.
Conflicts of Interest
The authors declare no conflict of interest.
References
- Sussman, J.M.; Bronzini, M.S. A Review of: “Perspectives on Intelligent Transportation Systems”. J. Intell. Transp. Syst. 2006, 10, 101–102. [Google Scholar] [CrossRef]
- Ghosh, S.; Lee, T.S. Intelligent Transportation Systems; Informa UK Limited: Colchester, UK, 2010. [Google Scholar]
- Zhou, J.; Chen, C.P.; Chen, L.; Zhao, W. A User-Customizable Urban Traffic Information Collection Method Based on Wireless Sensor Networks. IEEE Trans. Intell. Transp. Syst. 2013, 14, 1119–1128. [Google Scholar] [CrossRef]
- Ishida, K.; Kitabayashi, H.; Nagasu, M.; Bekki, K. New train control and information services utilizing broadband networks. Hitachi Rev. 2004, 53, 21–24. [Google Scholar]
- Ai, B.; Briso-Rodriguez, C.; Cheng, X.; Kürner, T.; Zhong, Z.; Guan, K.; He, R.; Xiong, L.; Matolak, D.W.; Michelson, D.G. Challenges Toward Wireless Communications for High-Speed Railway. IEEE Trans. Intell. Transp. Syst. 2014, 15, 2143–2158. [Google Scholar] [CrossRef]
- Sammouri, W.; Come, E.; Oukhellou, L.; Aknin, P.; Fonlladosa, C.E. Floating train data systems for preventive maintenance: A data mining approach. In Proceedings of the International Conference on Industrial Engineering and Systems Management, Rabat, Morocco, 28–30 October 2013; IEEE: Piscataway, NJ, USA, 2013. [Google Scholar]
- Budai-Balke, G. Operations Research Models for Scheduling Railway Infrastructure Maintenance; Rozenberg Publishers: Amsterdam, The Netherlands, 2009. [Google Scholar]
- Reason, J.M.; Crepaldi, R. Ambient intelligence for freight railroads. IBM J. Res. Dev. 2009, 53, 6:1–6:14. [Google Scholar] [CrossRef]
- Shrestha, P.L.; Hempel, M.; Rakshit, S.; Sharif, H.; Punwani, J.; Stewart, M. Performance Evaluation of Hybrid Technology Networking for Real-Time Monitoring in Freight Railroad Operations. In Proceedings of the 2013 Joint Rail Conference, Knoxville, TN, USA, 15–18 April 2013. [Google Scholar] [CrossRef]
- Grudén, M.; Andersson, L.; Zherdev, F.; Dancila, D.; Brunberg, K.; Byström, R.; Hinnemo, M.; Rydberg, A.; Edvinsson, N. Field operational testing for safety improvement of freight trains using wireless monitoring by sensor network. IET Wirel. Sens. Syst. 2014, 4, 54–60. [Google Scholar] [CrossRef]
- Arif, M.; Wang, G.; Geman, O.; Balas, V.; Tao, P.; Brezulianu, A.; Chen, J. SDN-based VANETs, Security Attacks, Applications, and Challenges. Appl. Sci. 2020, 10, 3217. [Google Scholar] [CrossRef]
- Aguirre, E.; López-Iturri, P.; Azpilicueta, L.; Redondo, A.; Astrain, J.J.; Villadangos, J.; Bahillo, A.; Perallos, A.; Falcone, F. Design and Implementation of Context Aware Applications with Wireless Sensor Network Support in Urban Train Transportation Environments. IEEE Sens. J. 2016, 17, 169–178. [Google Scholar] [CrossRef]
- Diez, P.L.; Gabilondo, I.; Alarcon, E.; Moll, F. Mechanical Energy Harvesting Taxonomy for Industrial Environments: Application to the Railway Industry. IEEE Trans. Intell. Transp. Syst. 2019, 1–11. [Google Scholar] [CrossRef]
- Briso-Rodríguez, C.; Guan, K.; Xuefeng, Y.; Kürner, T. Wireless Communications in Smart Rail Transportation Systems. Wirel. Commun. Mob. Comput. 2017, 2017, 1–10. [Google Scholar] [CrossRef]
- Wu, J.; Fan, P. A Survey on High Mobility Wireless Communications: Challenges, Opportunities and Solutions. IEEE Access 2016, 4, 450–476. [Google Scholar] [CrossRef]
- Yan, D.; Wang, R.; Liu, E.; Hou, Q. ADMM-based robust beamforming desing for downlink cloud radio access networks. IEEE Access 2018, 6, 27912–27922. [Google Scholar] [CrossRef]
- Peng, M.; Zhang, K. Recent Advances in Fog Radio Access Networks: Performance Analysis and Radio Resource Allocation. IEEE Access 2016, 4, 5003–5009. [Google Scholar] [CrossRef]
- Li, T.; Xiong, K.; Fan, P.; Ben Letaief, K. Service-Oriented Power Allocation for High-Speed Railway Wireless Communications. IEEE Access 2017, 5, 8343–8356. [Google Scholar] [CrossRef]
- Liu, X.; Qiao, D. Location-Fair Beamforming for High Speed Railway Communication Systems. IEEE Access 2018, 6, 28632–28642. [Google Scholar] [CrossRef]
- Ai, B.; Guan, K.; Rupp, M.; Kürner, T.; Cheng, X.; Yin, X.; Wang, Q.; Ma, G.-Y.; Li, Y.; Xiong, L.; et al. Future railway services-oriented mobile communications network. IEEE Commun. Mag. 2015, 53, 78–85. [Google Scholar] [CrossRef]
- Sanguesa, J.A.; Barrachina, J.; Fogue, M.; Garrido, P.; Martinez, F.J.; Cano, J.-C.; Calafate, C.T.; Manzoni, P. Sensing Traffic Density Combining V2V and V2I Wireless Communications. Sensors 2015, 15, 31794–31810. [Google Scholar] [CrossRef]
- Lee, J.; Park, S. Time-Sensitive Network (TSN) Experiment in Sensor-Based Integrated Environment for Autonomous Driving. Sensors 2019, 19, 1111. [Google Scholar] [CrossRef]
- Hodge, V.J.; O’Keefe, S.; Weeks, M.; Moulds, A. Wireless Sensor Networks for Condition Monitoring in the Railway Industry: A Survey. IEEE Trans. Intell. Transp. Syst. 2014, 16, 1088–1106. [Google Scholar] [CrossRef]
- Li, H.; Liu, F.; Hou, Y. Railway Hazardous Articles Monitoring System Based on Wireless Sensor Network. In Proceedings of the 2010 2nd International Conference on Information Engineering and Computer Science, Wuhan, China, 25–26 December 2010; Institute of Electrical and Electronics Engineers (IEEE): Piscataway, NJ, USA, 2010; pp. 1–4. [Google Scholar]
- Saghir, H.; Heddebaut, M.; Elbahhar, F.; Rouvaen, J.-M.; Menhaj-Rivenq, A.; Ghys, J.-P. Train-to-wayside wireless communication in tunnel using ultra-wide-band and time reversal. Transp. Res. Part C 2009, 17, 81–97. [Google Scholar] [CrossRef]
- Zhang, C.; Fan, P.; Xiong, K. Optimal power allocation with deley constraint for signal transmission from a moving train to base station in high-speed railway scenarios. IEEE Trans. Veh. 2015, 64, 5775–5788. [Google Scholar] [CrossRef]
- Schoen, R.; Habetler, T.; Kamran, F.; Bartfield, R. Motor bearing damage detection using stator current monitoring. IEEE Trans. Ind. Appl. 1995, 31, 1274–1279. [Google Scholar] [CrossRef]
- Tubaishat, M.; Zhuang, P.; Qi, Q.; Shang, Y. Wireless sensor networks in intelligent transportation systems. Wirel. Commun. Mob. Comput. 2009, 9, 287–302. [Google Scholar] [CrossRef]
- Christidis, K.; Devetsikiotis, M. Blockchain and Smart Contacts for the Internet of Things. IEEE Access 2016, 4, 2292–2303. [Google Scholar] [CrossRef]
- Liu, P.; Ai, B.; Zhong, Z.; Zhou, X. A Novel Train-to-Train Communication Model Design Based on Multihop in High-Speed Railway. Int. J. Antennas Propag. 2012, 2012, 1–9. [Google Scholar] [CrossRef]
- Brezulianu, A. Wagon Monitoring Method and System. Patent Application RO132982A2, 28 December 2018. [Google Scholar]
- Wu, Y.; Qiu, B.; Wei, Z.; Weng, J. Secure Subway Train-to-Train Communications via GSM-R Communication Systems; Institute of Electrical and Electronics Engineers (IEEE): Piscataway, NJ, USA, 2016; pp. 1–5. [Google Scholar]
- Bin, S.; Sun, G. Optimal Energy Resources Allocation Method of Wireless Sensor Networks for Intelligent Railway Systems. Sensors 2020, 20, 482. [Google Scholar] [CrossRef]
- Jiang, C.; Xu, Y.; Wen, C.; Chen, D. Anti-Runaway Prevention System with Wireless Sensors for Intelligent Track Skates at Railway Stations. Sensors 2017, 17, 2955. [Google Scholar] [CrossRef]
- Cañete, E.; Chen, J.; Díaz, M.; Llopis, L.; Reyna, A.; Rubio, B. Using Wireless Sensor Networks and Trains as Data Mules to Monitor Slab Track Infrastructures. Sensors 2015, 15, 15101–15126. [Google Scholar] [CrossRef]
- Cañete, E.; Chen, J.; Díaz, M.; Llopis, L.; Rubio, B. Sensor4PRI: A Sensor Platform for the Protection of Railway Infrastructures. Sensors 2015, 15, 4996–5019. [Google Scholar] [CrossRef]
- Fraga-Lamas, P.; Fernández-Caramés, T.; Castedo, L. Towards the Internet of Smart Trains: A Review on Industrial IoT-Connected Railways. Sensors 2017, 17, 1457. [Google Scholar] [CrossRef]
- Kim, H.; Kim, T. Vehicle-to-Vehicle (V2V) Message Content Plausibility Check for Platoons through Low-Power Beaconing. Sensors 2019, 19, 5493. [Google Scholar] [CrossRef] [PubMed]
- Liu, L.; Song, D.; Geng, Z.; Zheng, Z. A Real-Time Fault Early Warning Method for a High-Speed EMU Axle Box Bearing. Sensors 2020, 20, 823. [Google Scholar] [CrossRef] [PubMed]
- Wang, H.; Chang, L.; Markine, V. Structural Health Monitoring of Railway Transition Zones Using Satellite Radar Data. Sensors 2018, 18, 413. [Google Scholar] [CrossRef]
© 2020 by the authors. Licensee MDPI, Basel, Switzerland. This article is an open access article distributed under the terms and conditions of the Creative Commons Attribution (CC BY) license (http://creativecommons.org/licenses/by/4.0/).


 ,
, 


