Abstract
Hydrocyclones are extensively known as important separation devices which are used in many industrial fields. However, the general method to estimate device performance is time-consuming and has a high cost. The aim of this paper was to investigate the blockage diagnosis for a lab-scale hydrocyclone using a vibration-based technique based on wavelet denoising and the discrete-time Fourier transform method. The results indicate that the farther away the installation location from feed inlet the more regular the frequency is, which reveals that the installation plane near to the spigot generated the regular frequency distribution. Furthermore, the acceleration amplitude under blockage degrees 0%, 50% and 100% fluctuates as a sine shape with increasing time, meanwhile the vibration frequency of the hydrocyclone rises with increasing throughput. Moreover, the distribution of four dimensional and five non-dimensional parameters for the time domain shows that the standard deviation, compared to the others, reduced gradually with increases in blockage degree. Thus, the standard deviation was used to evaluate the online diagnosis of the blockage. The frequency domain distribution under different throughput reveals that the characteristic peaks consisting of the faulty frequency and multiple frequency were produced by the faulty blockage and the feed pump, respectively. Hence, the faulty peak of 16–17 Hz was adopted to judge the real-time blockage of the hydrocyclone, i.e., the presence of the characteristic peak marks the blockage, and its value is proportional to the blockage degree. The application of the online monitoring system demonstrates that the combination of the time domain and the frequency domain could admirably detect the running state and rapidly recognize blockage faults.
1. Introduction
Hydrocyclones are extensively known as important devices for solid-fluid or solid-solid separation via centrifugal force [1,2]. The typical hydrocyclone is comprised of one tangential inlet and two axial outlets;(a) a large one at the top for discarding fines and (b) a small one at the bottom to discharge coarse particles [3,4]. Due to the distinct virtue of a simple design, convenient operation, high capacity and low cost, hydrocyclones have been widely used in mineral, chemical, environmental and some other industrial fields [5,6,7]. The typical method to estimate the classification performance of hydrocyclones employs the partition curve, which illustrates the mass fraction of particles of specific size in the inlet that reports to the underflow [8]. Generally, the evaluation procedure includes sampling, sample treatment, testing and data analysis [9,10]. Although this evaluation method can accurately reflect the device performance, it also possesses the disadvantages of being time-consuming and high cost. This is adverse for the timely and economic judgment of hydrocyclone status, which could improve the faulty operating conditions and reduce continued economical operation.
In the past few decades, due to abundant online information, vibration-based techniques have been rapidly adopted to monitor the lifecycle of both vibrational and static devices, such as electric motors, bridges, aero-crafts, etc. [11,12]. In this approach, the procedure can be generally designed step by step. Firstly, a group of high-performance sensors are installed in the proper locations in equipment. Then, the vibration information is collected by these sensors under certain conditions. Finally, a set of reasonable algorithms are employed to process the collected signal and to analyze the equipment state. Thus, this technology has been widely used in fault detection and diagnosis. Here, fault detection is defined as the indication at a specific time point that a faulty condition has started occurring, or is continuing to occur. Fault diagnosis is defined here as the indication of which measured process variables are most associated with the faulty condition, and the subsequent classification of process variables as either symptoms or causes of the faulty condition [13].
The above discussion of previous studies indicates that some general understanding of the working process evaluation of hydrocyclones is available. However, to the best of the authors’ knowledge, a real-time monitoring approach of hydrocyclone status is not yet reported and remains unexplored. In view of the aforesaid knowledge gap, the goal of this study was to explore online detection and diagnosis involving a typical fault, namely a blockage. To achieve the aforesaid purpose, a vibration-based technique was adopted considering a lab-scale hydrocyclone. Specifically, the objectives of the current work were to:
- (1)
- Explicitly describe the experimental approaches including the setup, procedure and data analysis.
- (2)
- Explore the appropriate installation location of vibration acceleration sensors for a lab-scale hydrocyclone.
- (3)
- Systematically research the blockage diagnosis using the time domain and the frequency domain based on the acceleration vibration information.
- (4)
- Critically analyze the online monitoring system for detecting and recognizing blockage faults of the lab-scale hydrocyclone.
2. Methodology
2.1. Experimental
Figure 1 shows the (a) diagram and (b) photograph of the experiment rig used for the fault diagnosis experiments. It includes two parts, i.e., the measured hydrocyclone subsystem and the measuring subsystem. The measured subsystem consisted of a 1 m3 feed tank, a 0–50 Hz frequency converter and a 0–50 m3/hrs variable speed pump. The pressure and mass flow of the inlet and the outlets were gauged by mechanical manometers and electromagnetic flow meters, respectively. A 150 mm hydrocyclone (see Table 1 for details) was incorporated into the work presented, wherein, the length of the column was 150 mm, and the diameter and extending length of the vortex finder were considered as 44 and 60 mm, respectively. Based on this, a spigot of diameter 12 mm and cone of angle 20° were used to generate the crowding and hindered settling conditions in the cone. In the measuring subsystem, four vibration acceleration sensors (CT1010L ICP/IP) of sensitivity 100 mV/g were evenly installed in the proper positions to gauge vibration information. Three planes, z = −100 mm, −200 mm and −300 mm in Figure 1, were considered as the potentially optimal positions (see Section 3.1 for details of sensor installation location). A data acquisition card (NI MCC1608G) of sampling rate 250 kilo-samples per second was employed to synchronously acquire the data from the aforementioned sensors. A workstation was used for real-time data analysis.
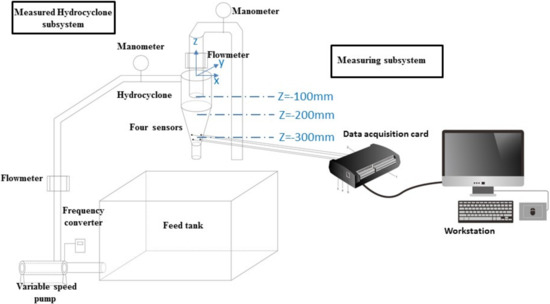
Figure 1.
Diagram of experiment rig.

Table 1.
Structures and operations of the hydrocyclone.
The experimental procedure was considered as the following implementation.
Step 1. Sand (density −1.6 g/cm3 and granularity < 1 mm) was used in the diagnostic test. Firstly, the slurry was sufficiently stirred to ensure homogeneity of the concentration, found as 75, 87.5, 100, 112.5 and 125 g/L, respectively, the slurry was then fed into the tank. Then, it was transported to the hydrocyclone at an inlet flow of 8–16 m3/h, with the typical hydrocyclone faults present (namely block and wear of spigot). The duration of the measured hydrocyclone subsystem run was approximately 30 min to achieve the steady-state conditions.
Step 2. The vibration signals were gauged by the above-mentioned sensors under different working conditions (see details in Table 2, wherein Items 1–3 and 4–18 were for sensor installation location and blockage testing, respectively). Wherein, the blockage degree is defined as the area percentage of the blocked part of the underflow outlet. Then, all the information was synchronously transported to the workstation by the data acquisition card. In order to improve the representativeness, each sampling time was up to 30 s, and the following results were based on the last 10 s of the time (i.e., 21–30 s). Finally, dynamic signal data were post processed in real time by the high-performance computer. Note that the average value of data from four sensors were used in the following analysis.

Table 2.
Experiment conditions.
2.2. Data Analysis
In this work, wavelet denoising function [14,15], given as Equations (1)–(4), was employed to denoise the original signals collected by the four sensors to generate the time domain information. Then, Equation (5) was used to acquire the average time domain information. Both dimensional and non-dimensional evaluation indicators were considered to evaluate the average time domain results to detect and diagnose the hydrocyclone faults of blockage and wear. Wherein, Equations (6)–(9) and Equations (10)–(14) are the dimensional and non-dimensional function, respectively. Afterward, Discrete-time Fourier Transform algorithm (DTFT) [16,17,18], shown as Equation (15), was conducted to transform the time domain to frequency domain information. Finally, Equation (16) was applied to estimate the average value of the frequency domain information. The details of the aforementioned models are shown in Table 3.

Table 3.
Models for hydrocyclone fault diagnosis.
Wherein, refers to a noisy time domain signal, refers to the threshold selection parameter, refers to frequency and is a continuously changing real number, represents the skewness of the signal data, represents the peak value of the signal, represents the kurtosis of the signal data, represents the square root amplitude of the signal data, n = 500 is the number of collected signals in a sampling period.
3. Results and Discussion
3.1. Sensor Installation Location
As mentioned, four vibration acceleration sensors were successively installed in three planes (see the blue dotted line in Figure 1) to determine the optimum position. The original vibration information was collected simultaneously under the same test conditions (see details of test 1–3 in Table 2). The average frequency domain information (calculated using Equations (15) and (16)) are shown in Figure 2a–c (z = −100, −200, and −300 mm, respectively). It is noted that the amplitude in this paper represents the acceleration amplitude, wherein the standard acceleration of gravity g (9.81 m/s2) is generally used as the unit in vibration measurement. In this figure, the time domain ranges from 0 to 150 Hz, which reveals that the shown values of hydrocyclone vibration are largely low frequency. It is clear that Figure 2a,b show similar trends, namely two different maximums lie in the frequency domain curve, while Figure 2c exhibits only one maximum. Specifically, the peaks of 15 and 50 Hz, the peaks of 30 and 50 Hz and the peak of 50 Hz can be observed in Figure 2a–c, respectively. It is noted that the frequency of the feed pump in each test was 50 Hz. This reveals that the sensor installed in plane z = −100 or −200 mm provided the signal, which was affected by not only the fundamental frequency 50 Hz of vibration produced by the feed pump, but also other promiscuous frequencies of 15 and 30 Hz (perhaps produced by device vibration). Furthermore, the farther away the installation location was from the feed inlet, the more regular the frequency. However, the absent promiscuous frequency can be seen with the installation plane of z = −300 mm (near to spigot). Meanwhile, the fundamental frequency can be filtered effectively using Equations (1)–(4) to improve the experimental precision. Thus, the vibration information was collected in plane z = −300 mm in the following study.
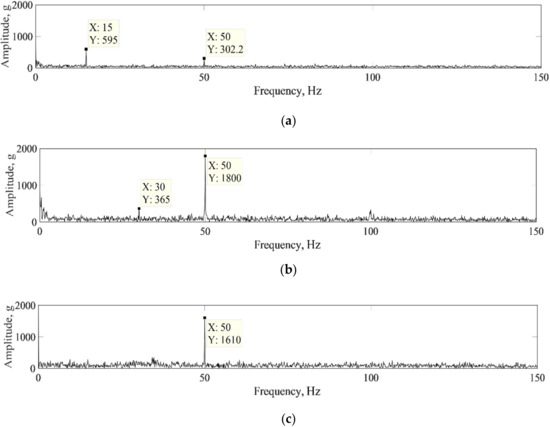
Figure 2.
Average frequency domain distribution of four sensors installed in different horizontal planes: (a) z = −100 mm (b) z = −200 mm and (c) z = −300 mm.
3.2. Diagnosis of Blockage
The average time domain distributions estimated by wavelet denoising method (Equations (1)–(4)) are shown in Figure 3 (a) 8 m3/h (b) 10 m3/h (c) 12 m3/h, (d) 14 m3/h and (e) 16 m3/h, wherein Roman numeral I, II and III correspond to the blockage degree of 0%, 50% and 100%, respectively. The test conditions are shown in test number of 4–18 in Table 2. The presented time span was the last second of the sampling process, i.e., 29–30 s, as a representative figure. It is evident that the acceleration amplitude changes rapidly with the increased sampling time. In detail, all time domain curves generally display a similar trend, viz. sine shape, and these distributions become conspicuous with increasing throughput. Furthermore, under the same throughput, the fluctuating curves with different blockage degree demonstrated a similar period. However, both 0% and 100% blockage degree exhibited less fluctuation, while 50% blockage degree showed a contrary phenomenon. Moreover, the period of time domain curves with higher peak value decreased from −0.05 s to 0.02 s with an increase in throughput (8–16 m3/h). This indicates that the vibration frequency of the hydrocyclone goes up with the increase of throughput.
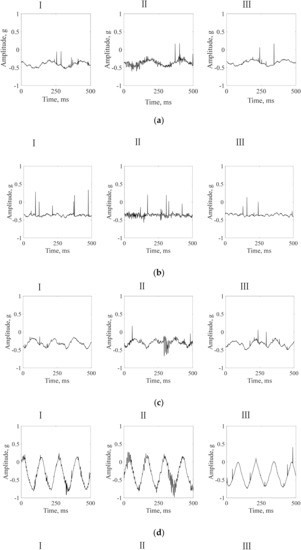
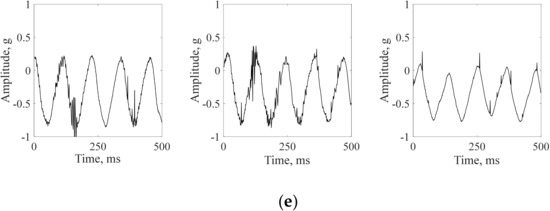
Figure 3.
Time domain distribution with blockage degree of I 0%, II 50% and III 100% under the throughput (a) 8, (b) 10, (c) 12, (d) 14 and (e) 16 m3/h.
Table 4 illustrates the analysis of the dimensional and non-dimensional index (gotten by Equations (6)–(9), (10)–(14), respectively) based on the above time domain information. From this table, it can be seen that with the increased blockage degree the standard deviation decreased gradually, while the kurtosis index firstly increased and then decreased, however, the other indicators changed irregularly. In addition, Figure 4 exhibits the distribution of (a) standard deviation and (b) kurtosis index with increasing throughput under different blockage degrees. In Figure 4a, under different blockage states, the standard deviation of acceleration amplitude fluctuated around −0.075 g and then rapidly grew to 0.25–0.35 g as the throughput increased from 8 m3/h to 16 m3/h. Generally, the larger the throughput the bigger the standard deviation, although the standard deviation curves overlap under lower throughput. In Figure 4b, the kurtosis index of −1.1 first increased and then quickly went up to 4.4–5.3 with the increased throughput. Similarly, the higher the throughput, the larger the kurtosis index. However, the kurtosis index curves always overlap at different blockage degrees. The comparison of Figure 4a,b demonstrates that the standard deviation parameter can be used to estimate the diagnosis of blockage online.

Table 4.
Dimensional and non-dimensional evaluation.
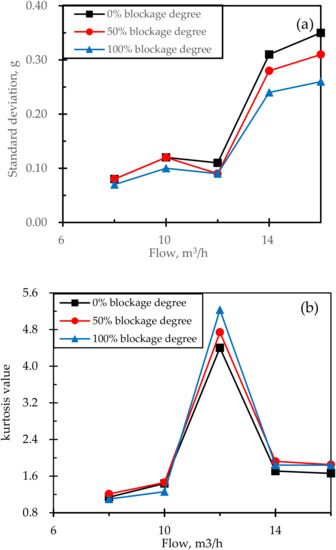
Figure 4.
Distribution of (a) standard deviation and (b) kurtosis index of acceleration amplitude with increasing throughput under different blockage degrees.
Figure 5 describes the distribution of the frequency domain under different throughputs: (a) 8 , (b) 10, (c) 12, (d) 14 and (e) 16 m3/h, wherein Roman numeral I, II and III correspond to the blockage degree of 0%, 50% and 100%, respectively. The present frequency domain curves were evaluated using Equations 6–8. The range of the time domain was 0–150 Hz according to the above results from sensor installation location (in Section 3.1). It is noted that with increasing feed flow, the frequency of feed pump constantly raised, where its values, corresponding to the above throughputs, were 22, 28, 33, 39 and 44 Hz, respectively (see test conditions in Table 2). These values are equal to the corresponding fundamental frequency caused by feed pump. From Figure 5a–e, it can be seen that the frequency domain distribution with different throughputs displays similar trends. Generally, the distinct characteristic peaks of acceleration amplitude (see the blue circle in Figure 5a-I) can be observed in the frequency domain curves under 0%, 50% and 100% blockage degree. However, the extra peak (see the red circle in Figure 5a-II and a-III) can be observed in both 50% and 100% blockage degree, compared to 0% blockage degree. Take the throughput of 8 m3/h (shown in Figure 5a) as an example to elaborate as follows. In Figure 5a-I–III, the acceleration amplitude peaks locate near 22, 44, 66, 110, and 132 Hz, which were multiples of the current fundamental frequency. However, when the blockage degree exceeded 0% in Figure 5a-II,III, a lower peak of acceleration amplitude appears in the frequency of 16–17 Hz. This tendency reveals that the blockage of the hydrocyclone caused weaker vibrations of low frequency and amplitude. The analogous distribution can be clearly detected in the other cases. Moreover, with increased capacity the corresponding fundamental and multiple frequency raised, while the additional peak with increasing acceleration amplitude always stands at 16–17 Hz. In addition, the bigger the blockage degree, the larger the additional peak of acceleration amplitude. This result exposes that the acceleration amplitude peak of the hydrocyclone in the frequency domain can be divided in to two parts, namely the faulty frequency and multiple frequency which were produced by the faulty blockage and the feed pump, respectively. Thus, the peak that lies in 16–17 Hz can be considered as the characteristic parameter to judge the real-time blockage phenomenon of the hydrocyclone, i.e., the presence of the characteristic peak marks the blockage and its value is proportional to the blockage degree.
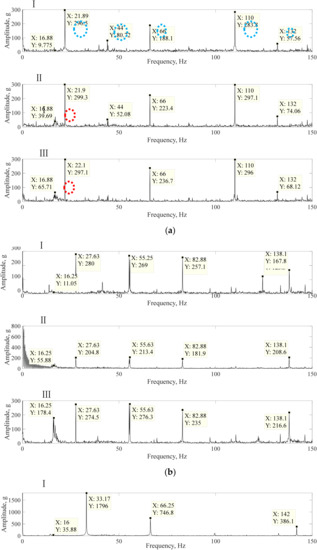
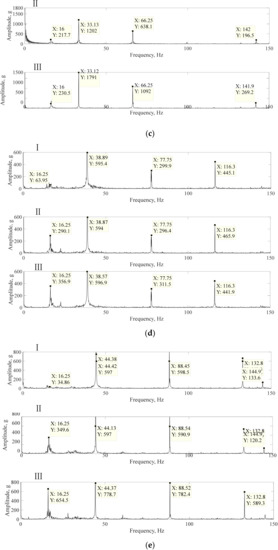
Figure 5.
Frequency domain distribution with blockage degree of I 0%, II 50% and III 100% under the throughput (a) 8 m3/h (b) 10 m3/h (c) 12 m3/h, (d) 14 m3/h and (e) 16 m3/h.
3.3. Online Monitoring System
Based on the above study, an online monitoring system was designed using Lab-view software based on the fault diagnosis rigs of the lab-scale hydrocyclone. In this system, the collected signals from acceleration vibration sensors were processed using the fore-mentioned procedure (see Section 2.1 for details). Each set of fault characteristic data was tested four times during the test. However, all of these processes were completed by the computer automatically. Figure 6 shows the key operation interface; (a) time domain, (b) statistical analysis and (c) frequency domain. During system running, the operation process of the hydrocyclone was monitored in real-time, and different artificial blocking faults were produced. This application shows that the rate of fault recognition reached more than 95%, and the fault response time was ~5 s. This result indicates that the combination of the time domain and the frequency domain could effectively detect the running state and rapidly recognize blockage faults with high precision.
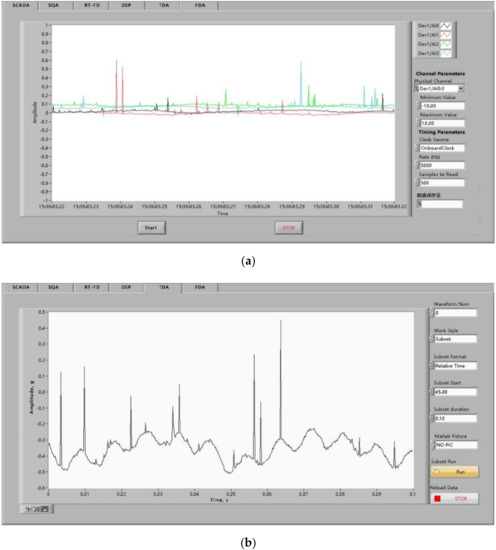
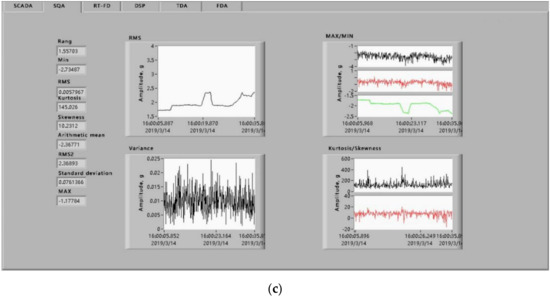
Figure 6.
Operation interface (a) time domain, (b) frequency domain and (c) statistical analysis.
4. Conclusions
In the present study, a vibration-based technique has been successfully developed for online blockage diagnosis of hydrocyclones. The combination of wavelet denoising and discrete-time Fourier transform techniques was utilized to determine the time domain and the frequency domain of the acceleration amplitude. Then, both blockage diagnosis law and characteristic parameters were comprehensively investigated. Based on this, the online monitoring system was carried out to detect the running state and recognize blockage faults for lab-scale hydrocyclones. According to the above results and discussion, the following conclusions were achieved:
- (1)
- Comparison of the frequency domain with different installation location displays that the farther away the installation location from the feed inlet the messier the frequency is. Therefore, the most regular frequency distribution can be seen with the installation plane near to spigot (i.e., z = −300 mm).
- (2)
- Time domain information displays that the acceleration amplitude under blockage degree 0%, 50% and 100% fluctuates as sine shape with increasing time, meanwhile the vibration frequency goes up with the increase of throughput. The distribution of four dimensional and five non-dimensional parameters for the time domain shows that with the increased blockage degree the standard deviation decreased gradually, while the kurtosis index firstly increased and then decreased. However, the other indicators changed irregularly. Thus, the standard deviation can be considered to estimate the diagnosis of blockage online.
- (3)
- Frequency domain distribution under different throughputs reveals similar trends, i.e., the characteristic peaks of acceleration amplitude can be divided in to two parts including the faulty frequency and multiple frequency, which were produced by the faulty blockage and the feed pump, respectively. Hence, the faulty peak located at 16–17 Hz can be used to judge the real-time blockage of hydrocyclones, i.e., the presence of the characteristic peak marks the blockage and its value is proportional to the blockage degree.
- (4)
- The application of the online monitoring system exhibits that the combination of the time domain and the frequency domain could effectively detect the running state and rapidly recognize blockage faults with high precision.
Based on the present work, future attempts to investigate the mechanism of feature parameters based on the frequency domain can be conducted for the blockage diagnosis of hydrocyclones.
Author Contributions
G.W. proposed the innovative idea; G.W., D.D. and C.W. wrote the first draft; D.D. performed the experiments; Q.L., L.D. and C.W. analyzed the results; C.W. drafted the manuscript; L.S. provided writing advice; G.W. read and approved the final manuscript. All authors have read and agreed to the published version of the manuscript.
Funding
This work was supported by National Natural Science Foundation of China (No. 51304194), the Fundamental Research Funds for the Central Universities (No.2014QNB14); Jiangsu Postdoctoral Science Foundation (2018K040C); Research Program of science and technology at Universities of Inner Mongolia Autonomous Region (NJZY20083); Doctor foundation of Anhui University of science and technology; University-level key projects of Anhui University of science and technology.
Conflicts of Interest
The authors declare no conflict of interest.
Nomenclature
| Wavelet function | |
| Wavelet transform of original signal | |
| Wavelet transform after denoising | |
| Time domain signal reconstruction, g (9.81 m/s2) | |
| Average time domain, g (9.81 m/s2) | |
| Standard deviation, g (9.81 m/s2) | |
| Root mean square value, g (9.81 m/s2) | |
| Mean value, g (9.81 m/s2) | |
| Rectified mean value, g (9.81 m/s2) | |
| Peak index | |
| Waveform index | |
| Kurtosis index | |
| Pulse index | |
| Margin Index | |
| Signal after Fourier transform, Hz | |
| |F| | Average frequency domain, Hz |
References
- Vieira, L.G.M.; Damasceno, J.J.R.; Barrozo, M.A.S. Improvement of hydrocyclone separation performance by incorporating a conical filtering wall. Chem. Eng. Process. 2010, 49, 460–467. [Google Scholar] [CrossRef]
- Wang, C.; Chen, J.; Shen, L.; Hoque, M.M.; Ge, L.; Evans, G.M. Inclusion of screening to remove fish-hook effect in the three products hydro-cyclone screen (TPHS). Miner. Eng. 2018, 122, 156–164. [Google Scholar] [CrossRef]
- Bradley, D. The Hydrocyclone: International Series of Monographs in Chemical Engineering; Elsevier: Amsterdam, The Netherlands, 2013.
- Wang, C.; Chen, J.; Shen, L.; Ge, L. Study of flow behaviour in a three products hydrocyclone screen: Numerical simulation and experimental validation. Physicochem. Probl. Miner. Process. 2019, 55, 879–895. [Google Scholar]
- Chen, L.; You, Z.; Xie, H.; Zhang, H.; Li, Y.; Wei, Z. Fluidized hydrocyclone for continuous centrifugal concentration. Sep. Sci. Technol. 2017, 52, 1283–1288. [Google Scholar] [CrossRef]
- Li, X.; Xu, H.; Liu, J.; Zhang, J.; Li, J.; Gui, Z. Cyclonic state micro-bubble flotation column in oil-in-water emulsion separation. Sep. Purif. Technol. 2016, 165, 101–106. [Google Scholar] [CrossRef]
- Wasilewski, M. Analysis of the effects of temperature and the share of solid and gas phases on the process of separation in a cyclone suspension preheater. Sep. Purif. Technol. 2016, 168, 114–123. [Google Scholar] [CrossRef]
- Dueck, J.; Farghaly, M.; Neesse, T. The theoretical partition curve of the hydrocyclone. Miner. Eng. 2014, 62, 25–30. [Google Scholar] [CrossRef]
- Antunes, M.; Medronho, R. Hydrocyclones. In Bradley Hydrocyclones: Design and Performance Analysis; Springer: Berlin, Germany, 1992; pp. 3–13. [Google Scholar]
- Wills, B.A.; Napier-Munn, T. Wills’ Mineral Processing Technology: An Introduction to the Practical Aspects of Ore Treatment and Mineral Recovery; Butterworth-Heinemann: Oxford, UK, 2015. [Google Scholar]
- Zhu, H.P.; Yu, J.; Zhang, J.B. A summary review and advantages of vibration-based damage identification methods in structural health monitoring. Eng. Mech. 2011, 28, 1–6. [Google Scholar]
- Goyal, D.; Pabla, B.S. The Vibration Monitoring Methods and Signal Processing Techniques for Structural Health Monitoring: A Review. Arch. Comput. Methods Eng. 2016, 23, 585–594. [Google Scholar] [CrossRef]
- Wakefield, B.J.; Lindner, B.S.; McCoy, J.T.; Auret, L. Monitoring of a simulated milling circuit: Fault diagnosis and economic impact. Miner. Eng. 2018, 120, 132–151. [Google Scholar] [CrossRef]
- Mei, S.; Liu, X.; Mei, S. Cell-filtering Based Multi-scale Shannon-Cosine Wavelet Denoising Method for Locust Slice Images. Int. J. Wavelets Multiresolut. Inf. Process. 2019, 17, 1950035. [Google Scholar] [CrossRef]
- Ong, P.M.; Galvez, M.C.; Vallar, E.; Shiina, T. Wavelet Denoising Applied to Light Emitting Diode Lidar Signal. Adv. Sci. Lett. 2017, 23, 1374–1378. [Google Scholar] [CrossRef]
- Smith, B.C. Fundamentals of Fourier Transform Infrared Spectroscopy; CRC Press: Boca Raton, FL, USA, 2011. [Google Scholar]
- Candan, C.; Kutay, M.A.; Ozaktas, H.M. The discrete fractional Fourier transform. IEEE Trans. Signal Process. 2000, 48, 1329–1337. [Google Scholar] [CrossRef]
- Bracewell, R. The Fourier Transform and Its Applications; McGraw-Hill: New York, NY, USA, 2005; Volume 34. [Google Scholar]
© 2020 by the authors. Licensee MDPI, Basel, Switzerland. This article is an open access article distributed under the terms and conditions of the Creative Commons Attribution (CC BY) license (http://creativecommons.org/licenses/by/4.0/).