1. Introduction
In the world’s annual food supply for human consumption, from production to consumption, about 1.3 billion tons of food were lost or wasted throughout the supply chain (FAO, 2011) [
1,
2], and this number may increase with population and economic growth over the next 25 years [
2,
3,
4]. Higher food waste (FW) has become a major global issue. FW is produced from various sources, including households, cafés, bistros and canteens [
5]. This FW not only caused a waste of resources, but also polluted land and water, and its decaying nature and smell also affects human health and safety [
6]. FW is a valuable and huge energy resource, due to its high biodegradability and organic content [
7,
8]. However, only 12.8% of FW was recycled as animal feed and compost every year, with the rest being incinerated in landfills, resulting in severe emissions of methane and carbon dioxide, which have a major impact on climate change [
9,
10]. Therefore, how to develop FW resources safely and efficiently, reduce the environmental burden, minimize the risk to human health, avoid the depletion of natural resources and maintain the overall balance of the ecosystem are research hotspots [
1,
8,
11].
Leftovers (SF) is the main component of FW and a potential source of environment-friendly biodegradable materials, which is rich in starch, cellulose, fat and other organic substances [
12]. Therefore, in recent years, SF has gradually been used to prepare hydrogels [
12], bioplastics [
13] and biogas [
10,
14,
15]. Controlled-release fertilizers (CRFs) had been widely applied in many plants over the past decades, as they increased fertilizer efficiency and crop yield, and minimized environmental pollution resulting from lost fertilizers [
16,
17,
18]. These CRFs were usually prepared by coating conventional fertilizer granules with polymer materials, and gradually releasing the nutrients according to the nutritional requirements of each stage of the plant [
19]. These coating materials mainly derived from fossil energy sources, such as polyethylene [
20], polystyrene [
21] and resins [
22]. These petroleum-based polymer coating materials have gradually hindered the large-scale use of CRFs, due to the high cost and consumption of petroleum resources [
23], as well as the residual coating material of CRFs after the release of nutrients [
24]. Therefore, in order for the sustainable development of fertilizers and agriculture, it is very important and urgent to find a kind of coating material which is biodegradable and has a low cost [
25]. Although some biodegradable waste materials have been used as the coating materials of CRFs [
17,
19,
26], there was no report on using SF as a coating material in the field of CRFs. The objective of the present work was therefore to explore the potential application of SF for the preparation of CRFs.
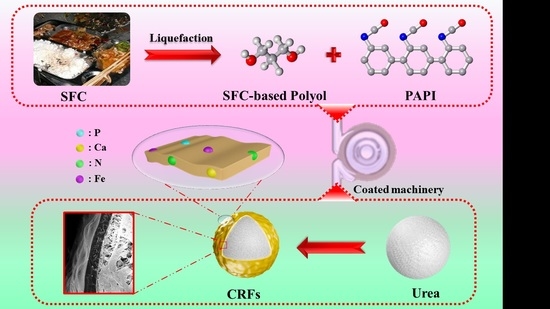
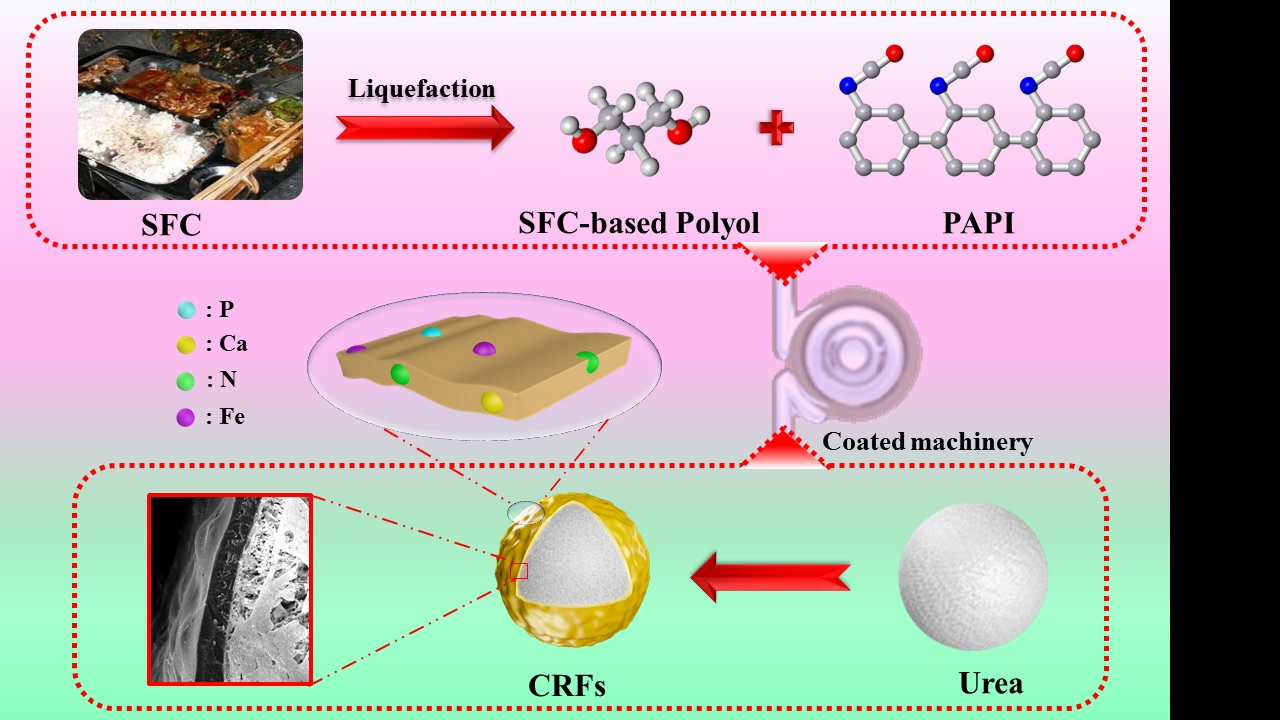
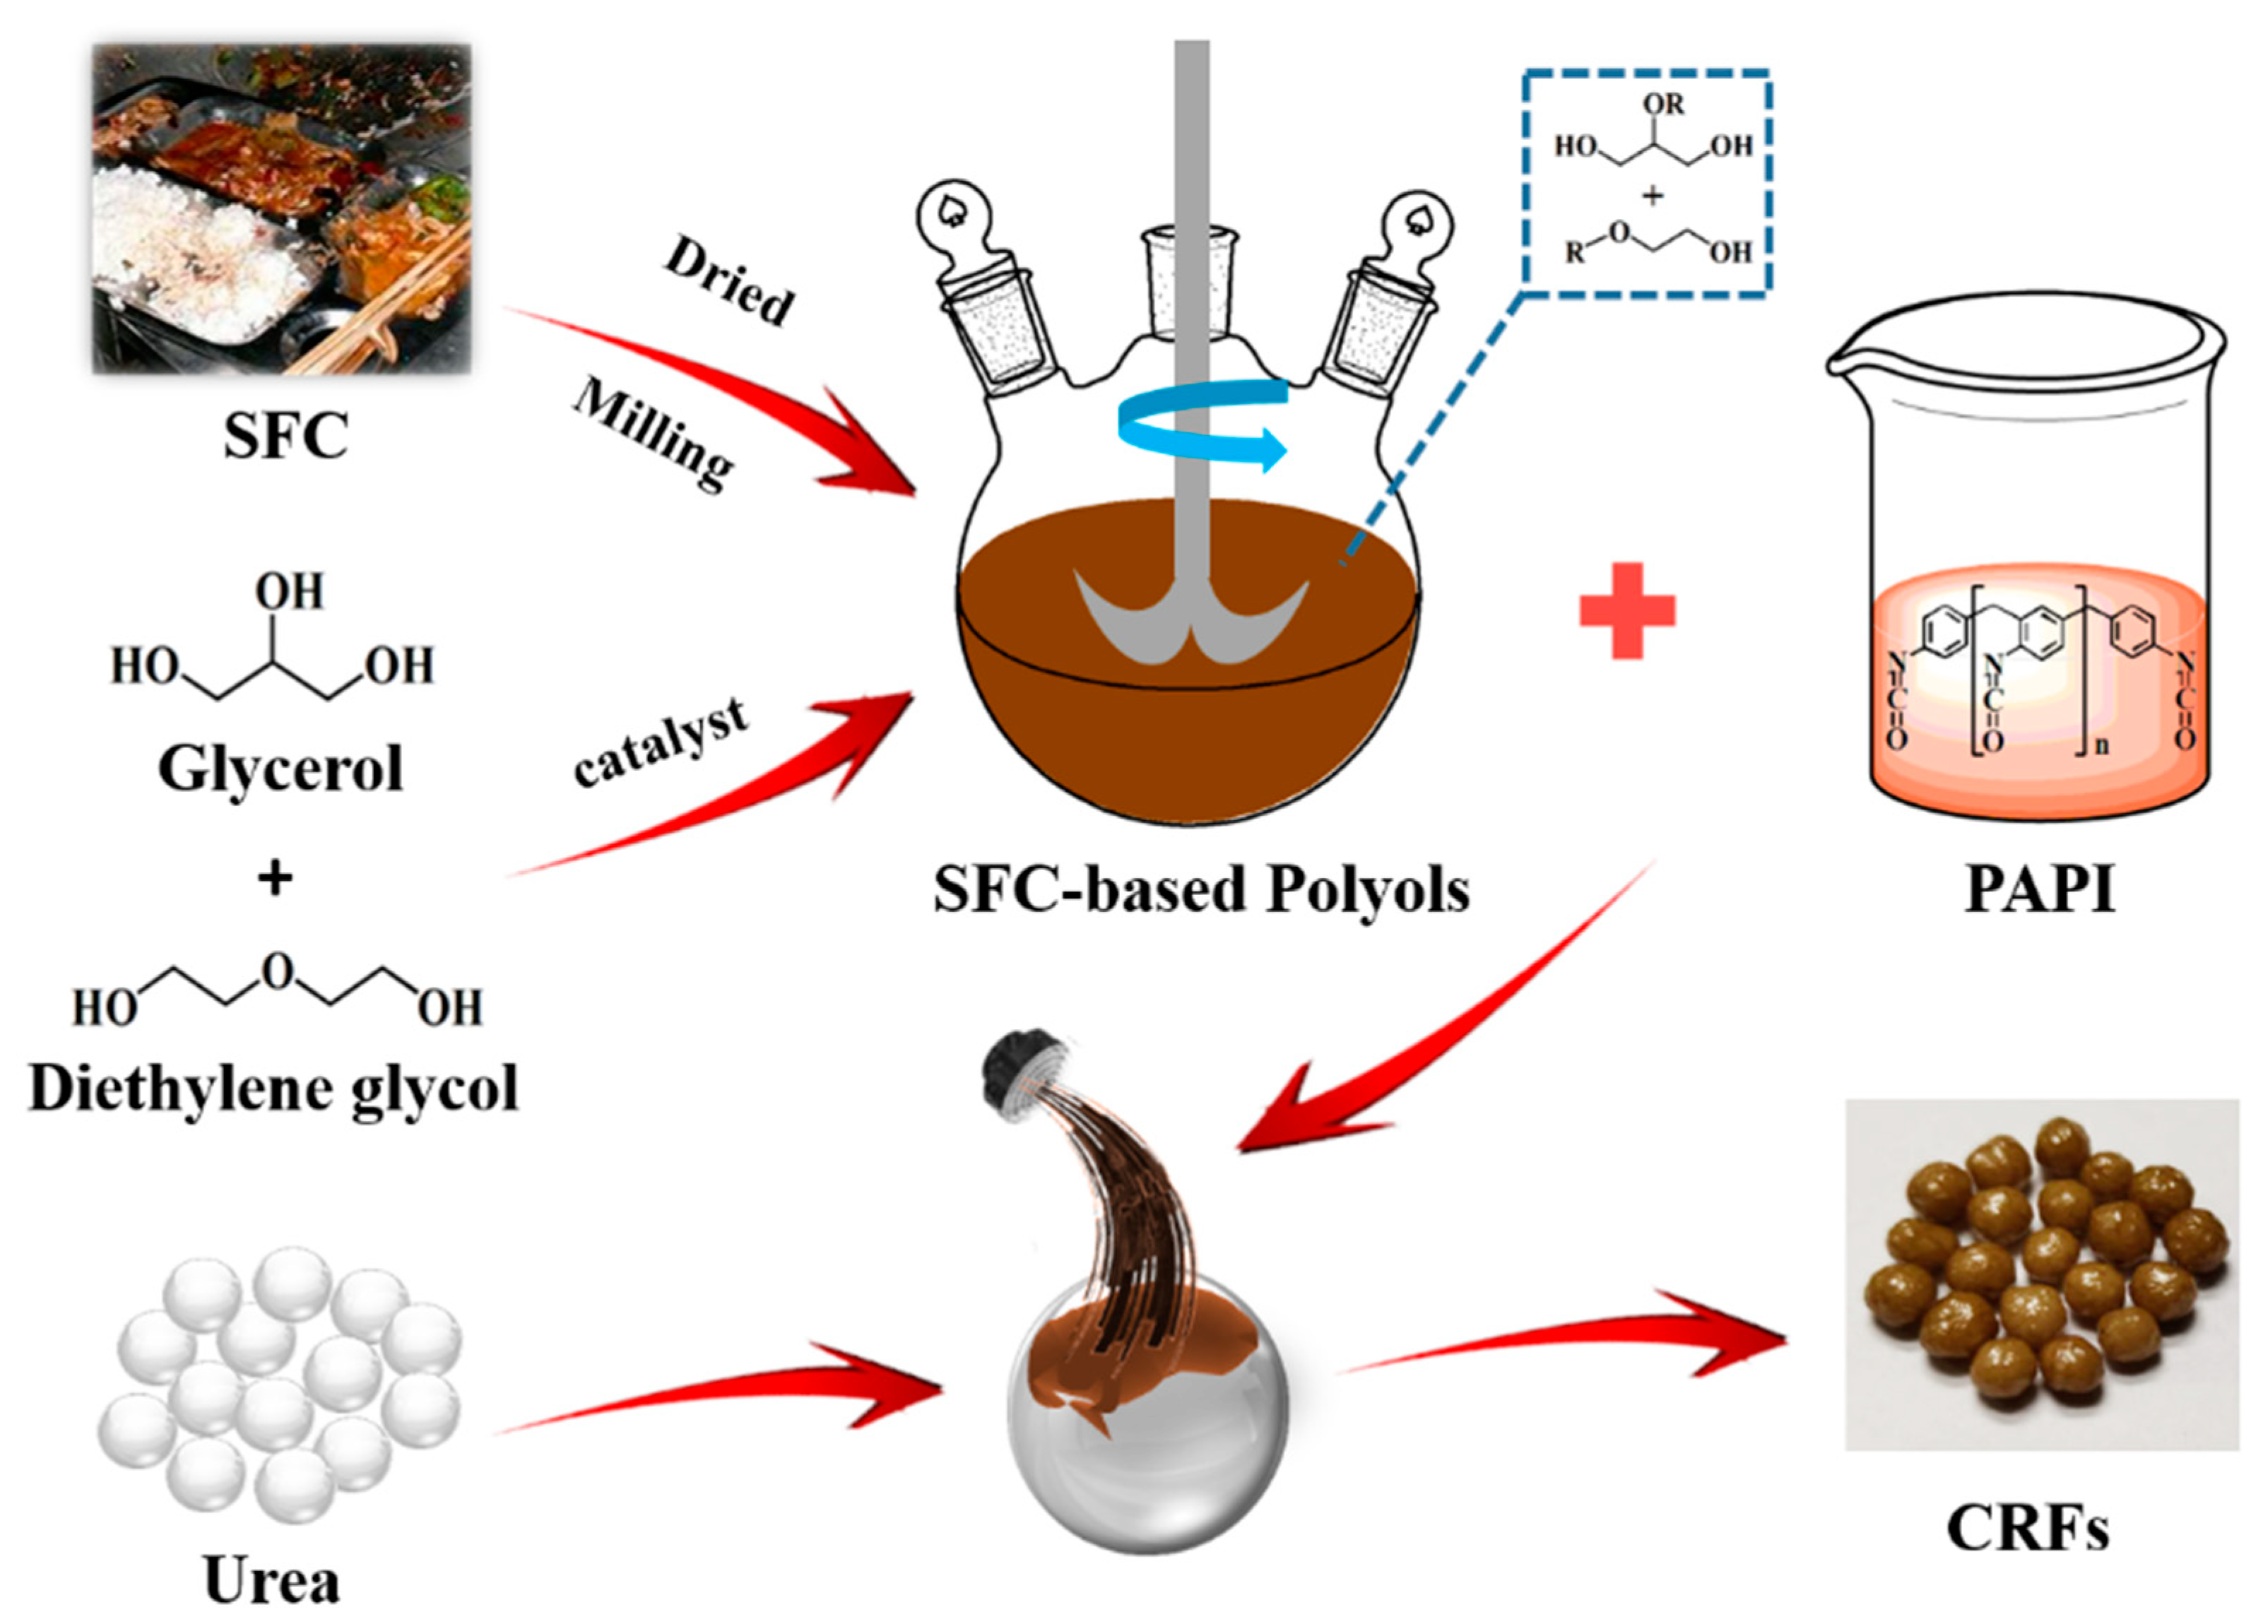
We prepared a series of environment-friendly SF-based polyurethane-coated urea in this study. Firstly, the SF was liquefied to obtain biomass polyols, and secondly, the polyurethane coating materials were synthesized by the reaction of biomass polyols with polyisocyanate (PAPI). The nutrient release behavior of samples was detected in water. Finally, our ultimate goal is to use the SF resources efficiently, and develop low-cost, efficient and environment-friendly CRFs. It also provides guidance on how to effectively develop FW resources.
2. Materials and Methods
2.1. Materials
Leftovers (SF), rechauffe (SC) and SFC (a mixture of SF and SC, 1:1, w/w) were obtained from the student canteen at Shandong Agricultural University, Taian, China. Raw materials were dried at 80 °C, and then ground to a powder (200 mesh). Glycerol (AR) was purchased from Sinopharm Chemical Reagent Co., Ltd (Shanghai, China), while diethylene glycol (98%) was provided by Shanghai Macklin Biochemical Co., Ltd (Shanghai China), sulfuric acid (98%) was purchased from Kaitong Chemical Reagent Co., Ltd (Tianjin, China), polyaryl polyphenylene isocyanate (PAPI) was purchased from Wanhua Chemical Group Co., Ltd (Shandong, China) and urea particles (46% of N and 2–5 mm in diameter) were obtained from Shanxi Lanhua Coal Mining Group Co., Ltd (Shanxi, China).
2.2. Preparation of Biomass Polyols
SF-based polyols (FH) were prepared by the modification of SF powders. Concentrated sulfuric acid (1.5 g) was the catalyst, while glycerol (10.0 g), diethylene glycol (40.0 g) and SF powders (5.0 g) were mixed and added to a 100 mL three-neck flask equipped with a stirring device. The mixture was then refluxed, and heated at 150 °C for 2 h. Then, the flask was immediately removed and cooled down to room temperature, and the resultant FH was collected. SC-based polyols (CH) and SFC-based polyols (FCH) were prepared by the same modification method.
2.3. Preparation of Bio-Based PU-Coated Urea
A series of SF-based PU-coated urea (FPUs) were obtained by coating urea particles with FPU. Firstly, the urea particles were preheated to 80–90 °C in a rotary drum. Then, 5.0 g the coating liquid (3.0 g of PAPI and 2.0 g of FH) was sprayed onto the surface of urea particles in the rotary drum and cured for approximately 5–10 min, and FPUs were obtained. The weight of FPU coating was approximately 4%, 6% and 8% of the coated urea, and the obtained FPUs were labeled FPU1, FPU2 and FPU3, respectively. SC-based PU-coated urea (CPUs) and SFC-based PU-coated urea (FCPUs) were prepared by the same method, and CPU1, CPU2, CPU3, FCPU1, FCPU2 and FCPU3 were then obtained, respectively. The preparation process of bio-based PU-coated urea was shown in
Scheme 1.
2.4. Chemical Composition of SF
The content of each component in SF was determined by Chinese National Standards. The fat content in SF was determined by Soxhlet extraction, according to Chinese National Standard GB 5009.6-2016. The protein content in SF was determined by the Kjeldahl method, according to Chinese National Standard GB 5009.5-2016. The content of starch in SF was obtained by the acid hydrolysis method, according to Chinese National Standard GB 5009.9-2016, and the ash content of SF was determined according to Chinese National Standard GB 5009.4-2016. The chemical composition in SF was detected by using an energy dispersive X-ray fluorescence spectrometer (XRF).
2.5. Characterization
The Fourier transform infrared (FTIR) spectra of SF, FH and FPU coating materials were determined by using a Nicolet 380 FTIR spectrometer with a resolution of 4 cm−1, and a scanning coverage ranging from 4000 to 500 cm−1. The samples and KBr were mixed uniformly at a ratio of 1:200, and placed in a mold to be pressed into a transparent sheet. The surface of the SF, PU (commercially PU-coated urea) and FPU were measured using a Thermo ESCALAB 250XI multifunctional imaging electron spectrometer (XPS, Thermo Fisher Scientific, Waltham, MA, USA), with a hemispherical electron energy analyzer. The incident radiation was monochromatic Al Ka X-rays. Narrow high-resolution scans were obtained with 0.05 eV steps. Survey (wide) spectra were carried out by 100 eV pass energy and multiplex (narrow) high-resolution scans focused on a particular atom at 30 eV pass energy. Survey scans were carried out over 1400-0 eV binding energy range with 1.0 eV steps. Their crystallinity was studied by a D8 Advance X-ray diffractometer (XRD). The surface elemental compositions and distribution of PU and FPU coatings were further tested with an energy dispersive spectroscopy (EDX) detector attached to the SEM. The morphology of FPU, CPU and FCPU were observed by a JSM-5800 scanning electron microscope (SEM). The thermal stability of the coating materials was determined by thermogravimetric analysis (TGA, Shimadzu, Tokyo, Japan). The samples were then put in alumina crucibles, and the flow rate of nitrogen was 50 mL/min. The temperature was increased from 50 °C to 700 °C, with a heating rate of 20 °C/min. The water contact angles were determined by using the contact angle instrument (JC2000C2, Zhongchen Digital Technology Instrument Co. Ltd., Shanghai, China).
2.6. Nitrogen Release Behavior and Kinetics
To determine the nitrogen release behavior of FPUs, CPUs and FCPUs, 10 g of the sample was placed into a glass bottle with 200 mL of distilled water, sealed and placed in 25 °C incubator, according to ISO 18644. After each incubation period (day 1, 3, 5, 7, 10, 14, 28, 42, 56, 84, 112...), the solution was decanted to measure the nitrogen content. The nitrogen contents were measured using the Kjeldahl method [
17]. All samples were carried out in triplicate, and the average value was taken as the nitrogen concentration of each sample.
The release of
N in controlled release fertilizer can be described by the first order kinetic equation.
where
t is the time (d);
N is the release rate at time (t, %);
N0 is the maximum release rate (%) and
k is the release rate constant (d
−1). In the formula, the value of
k can reflect the nitrogen release rate of CRFs.
3. Results and Discussion
3.1. General Properties of SF
The contents of each component in the leftovers (SF) were determined according to national standards (
Table 1). The contents of starch, protein, fat and cellulose in SF were 82.71%, 7.45%, 0.32% and 0.01%, respectively, indicating that SF was mainly composed of starch, which was possible to form biomass materials.
X-ray fluorescence spectrometer (XRF) analysis was applied in order to determine the oxide composition of SF powder (
Table 2). The SF mainly contains SO
3, P
2O
5, Fe
2O
3 and K
2O. At the same time, it contains various nutrient elements such as P, Si, Cl, K, Ca, Fe, Ni, Zn and Mo, which are the essential elements for crop growth. Thus, controlled release fertilizer (CRF) coating materials from SF were favorable for crop growth. The composition in rechauffe (SC) and SFC (a mixture of SF and SC) was not detected by XRF, owing to a too-high fat content in the powder.
3.2. General Properties of Biomass Polyols
The physical properties of SF-based polyols (FH), SC-based polyols (CH) and SFC-based polyols (FCH) are revealed in
Table 3. FH, CH and FCH had different liquefaction rates under the same conditions, due to the different types and contents of organic matter [
27]. It can be seen from
Table 3 that the liquefaction rates of FH, CH and FCH were all above 93%, and the highest of FH was 99.98%. This is due to the higher starch contents in the SF, and starch was easily liquefied under the same conditions. Hydroxyl value and acid value are important indexes to measure polyols, which can be used to evaluate the structure and properties of CRF coatings. The hydroxyl values of FH, CH and FCH were 333.35, 224.08 and 244.80 mgKOH/g, respectively. FH has the highest hydroxyl value, and a higher hydroxyl value can improve the cross-linking degree of the reaction system and obtain a denser coating.
From the data analysis of
Table 1,
Table 2 and
Table 3, it can be seen that SF is rich in nutrient elements and organic matter, which is a biomass material with great potential. It is very suitable for the coating material of CRFs.
3.3. Fourier Transform Infrared (FTIR) Analysis
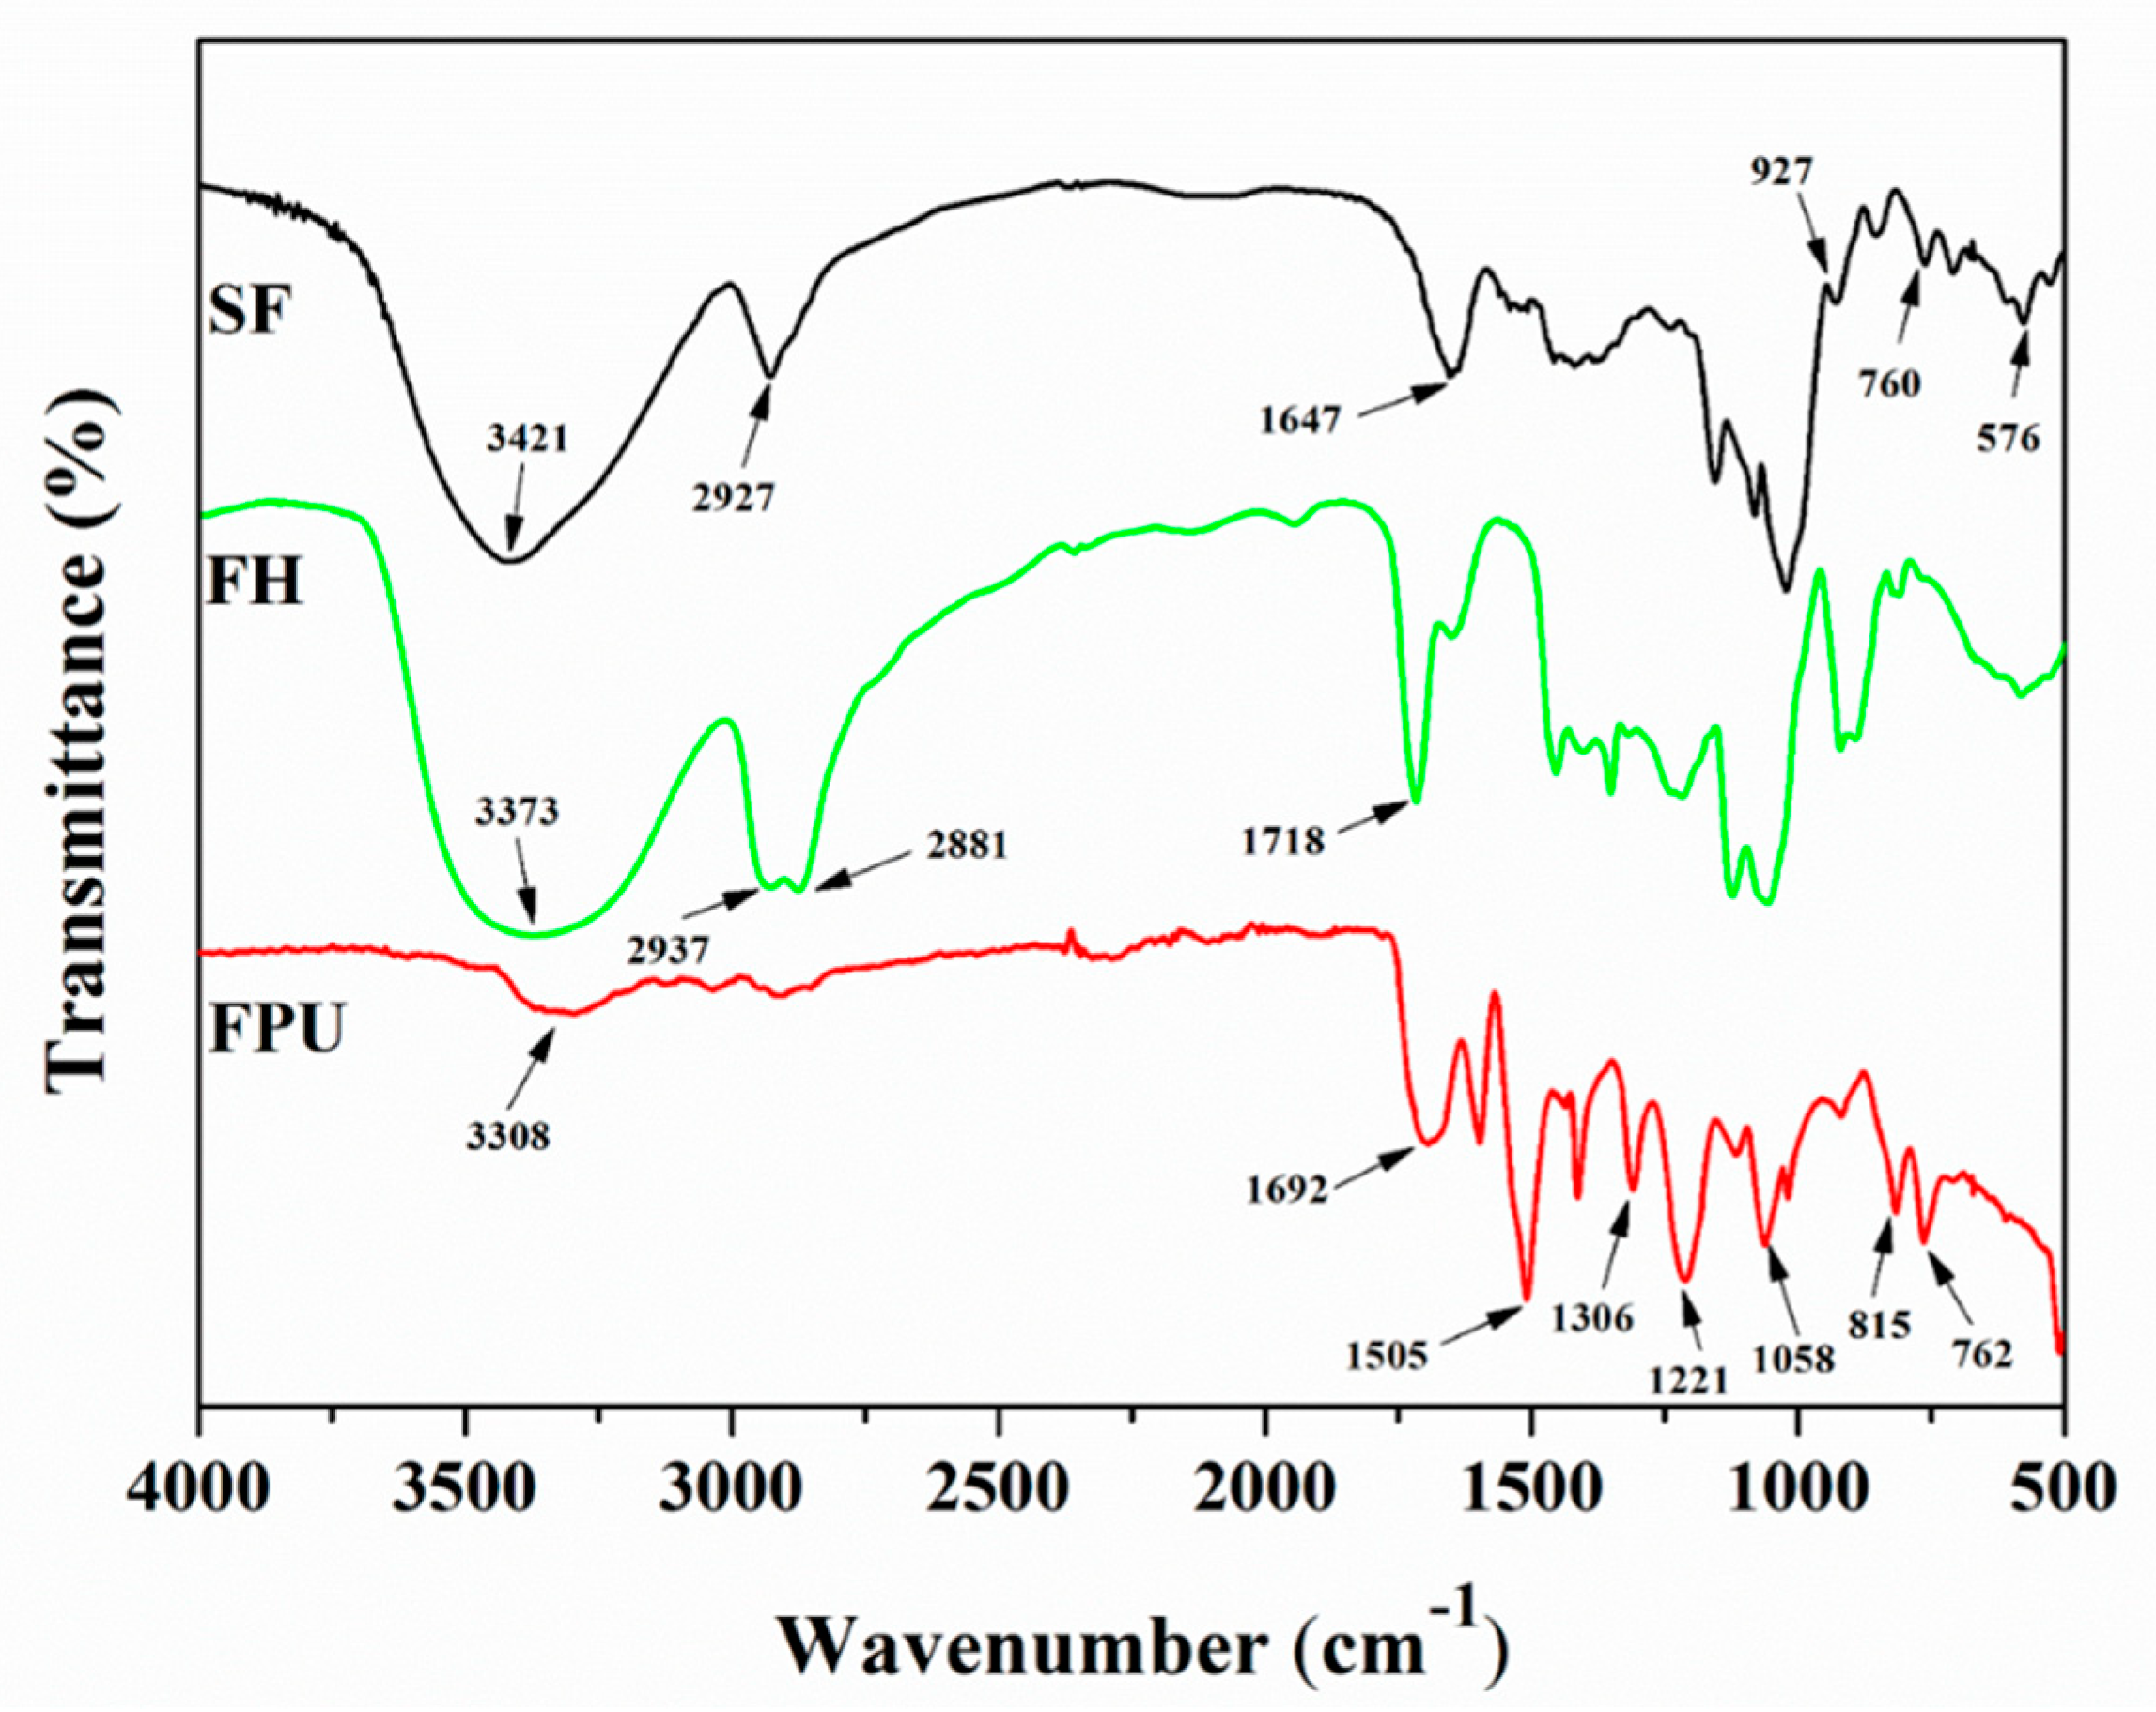
The FTIR spectra of SF, SF-based polyols (FH) and SF-based PU-coated urea (FPU) coatings are shown in
Figure 1. The FTIR spectrum of SF shows some obvious absorption peaks at 3421cm
−1, 2927 cm
−1 and 1647 cm
−1, ascribed to O-H stretching vibration, CH
2 asymmetric stretching vibration and amorphous regions in starch [
28], respectively. The C-O-C absorption peak appeared at 1080 cm
−1. The absorption peaks at 927 cm
−1 and 576 cm
−1 were ascribed to the starch skeleton pattern vibration. In the FTIR spectrum of FH, however, the more sharp or broad of peaks at 3373 cm
−1 were related with O-H, and the peaks at 2937–2881 cm
−1 arise from C-H stretching vibrations in methyl, methane and methylene, indicating that the intensity of these peaks were strengthened. Furthermore, the C=O absorption peak appeared at 1718 cm
−1, and the vibration absorption peak of the starch skeleton structure at 1647 cm
−1, 927 cm
−1 and 576 cm
−1 weakened. These results illustrate that SF was liquefied to biomass polyols.
For the FTIR spectrum of a FPU coating, the O-H vibration absorption peak at 3308 cm−1, the C-N vibration absorption peak at 1306 cm−1 and the symmetrical and asymmetrical stretching vibration absorption peaks of C-O at 1221 cm−1 and 1058 cm−1 all derived from the newly formed polyurethane. For the already-existing absorption peaks in FPU coating, the vibration absorption peaks at 1692 cm−1, 815 cm−1 and 762 cm−1 were caused by the vibration absorption peaks of C=O in FH and the β and ρ vibration absorption of C-H in SF, respectively. The absorption peak attributed to the -NCO asymmetric stretching vibration disappeared, indicating the successful fabrication of FPU coating. Furthermore, the vibration absorption peak of O-H at 3308 cm−1 became weaker, and the vibration absorption peak of C=O at 1692 cm−1 was enhanced. These results indicate that the chemical reactions between the OH groups of the FH and the NCO groups of PAPI appeared, and the bio-based polyurethane FPU coating was formed.
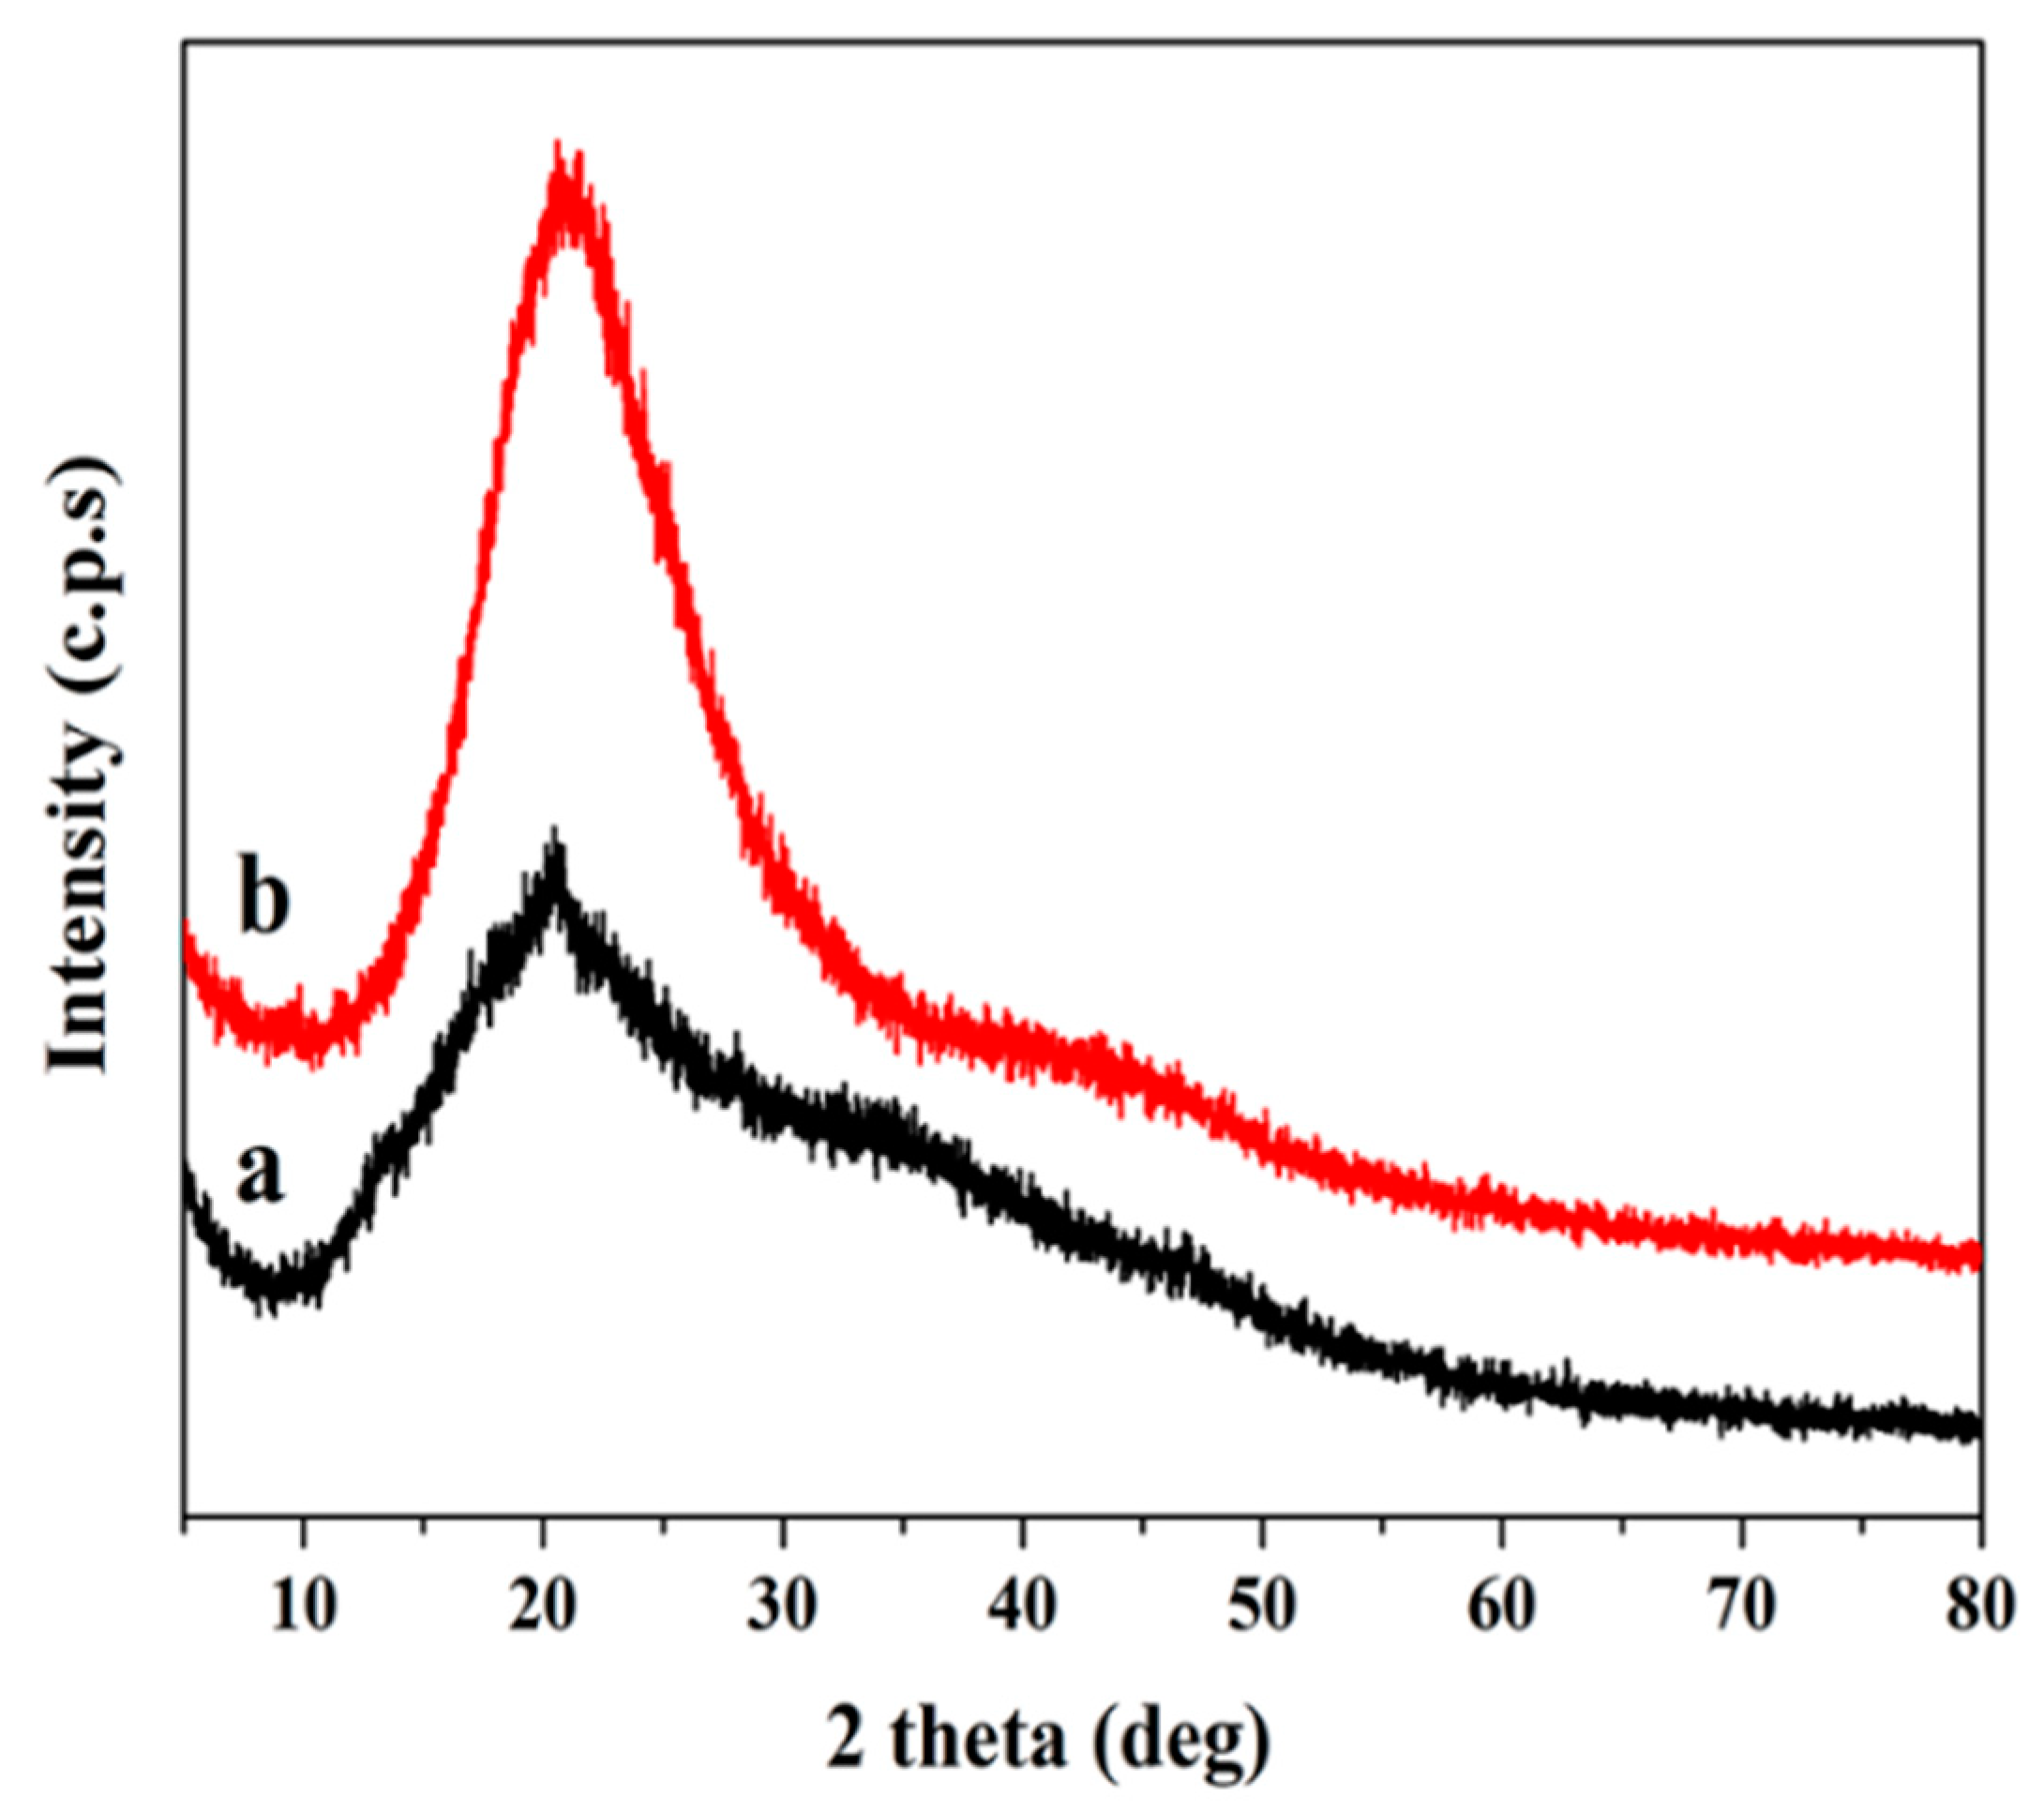
3.4. XRD Analysis
XRD analysis was used to investigate the crystallinity of the SF and FPU coating. In the XRD pattern (
Figure 2), a broad peak of between 2θ = 10–30° was observed, which suggested an amorphous structure in SF. In addition, a strong peak was found in SF at 20.4°, which was caused by intramolecular and intermolecular hydrogen bonds between OH groups in starch, suggesting that SF had a crystalline domain characteristic of a starch substrate [
29]. The XRD pattern of FPU coating in
Figure 2 exhibited an amorphous structure. There was an obvious reflection present in SF at 20.4°, which disappeared after the reaction, indicating that the crystalline region of SF was destroyed in the liquefaction process. Biomass polyols then reacted with PAPI to form an FPU coating.
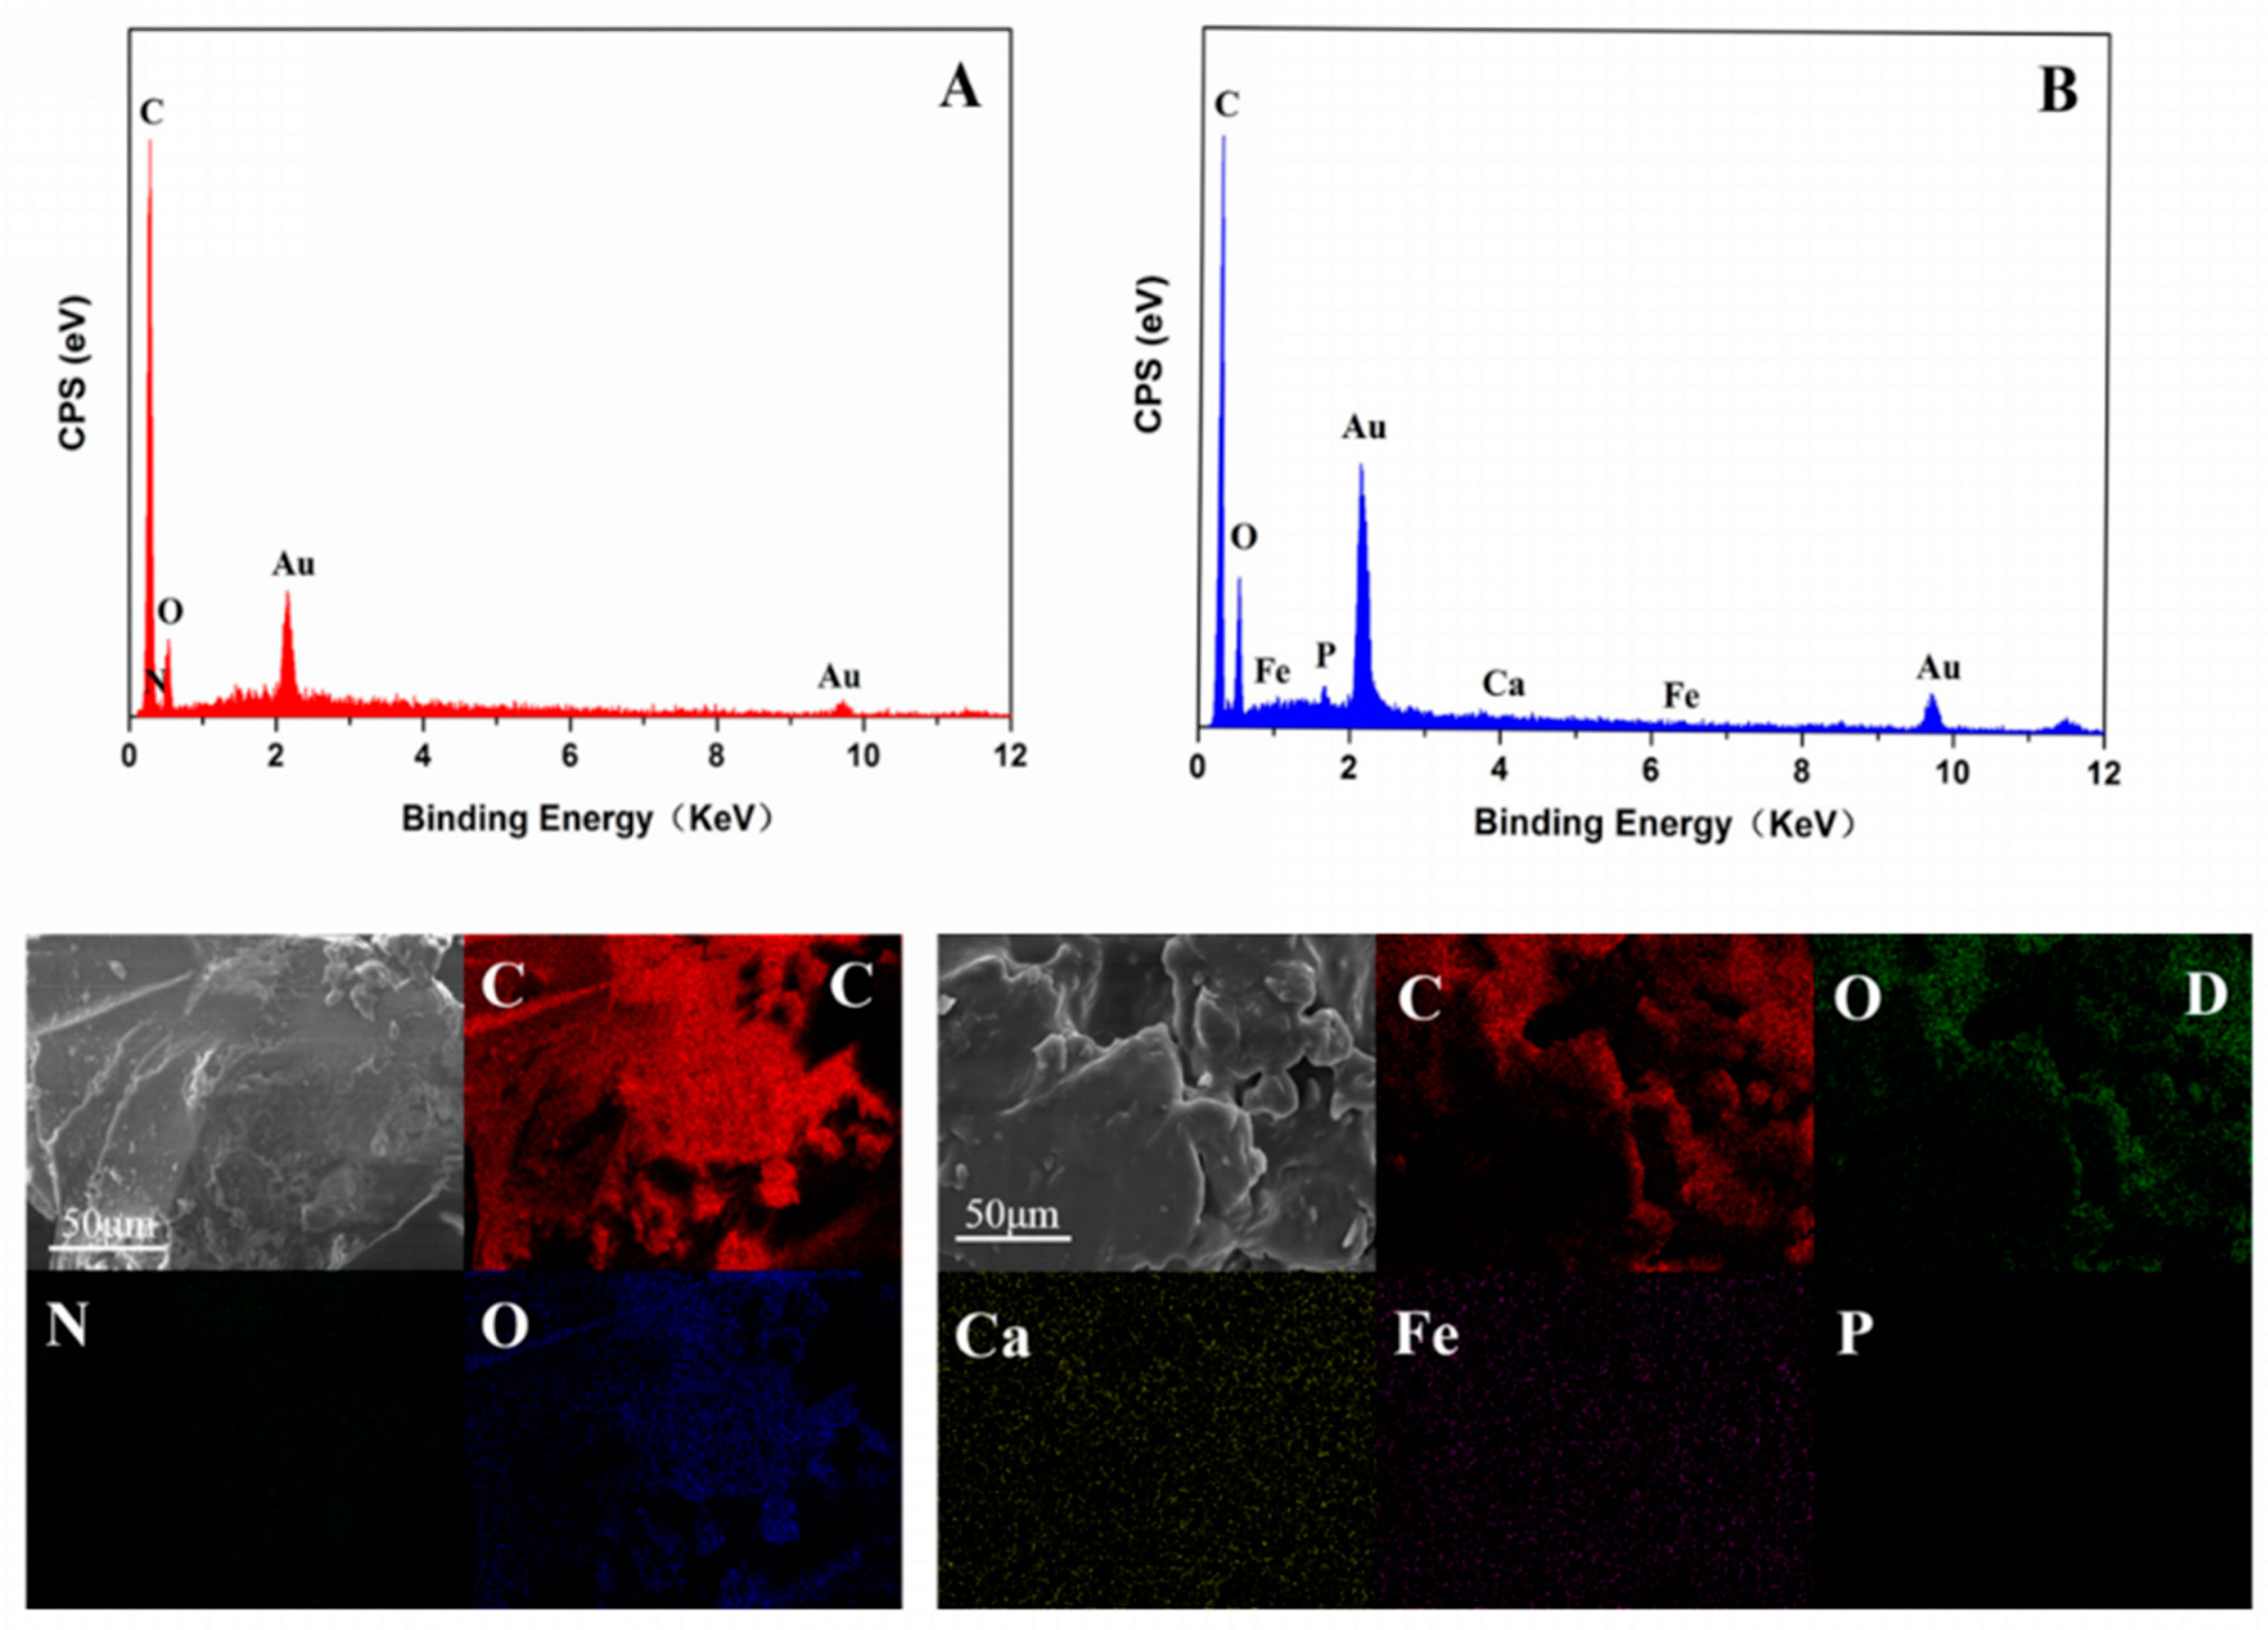
3.5. Energy Dispersive Spectroscopy (EDX) Analysis
The EDX spectra (
Figure 3A,B) and maps (
Figure 3C,D) were used to study the surface elemental compositions and distributions of PU and FPU coating. For the surface of PU coating (
Figure 3A,C), only equally distributed C, O and N elements were detected. For the surface of FPU coating (
Figure 3B,D), in addition to C, O and N (which is too little to be detected), the P, Ca and Fe elements derived from SF were also observed (
Table 4). At the same time, the O peak in FPU coating was stronger than that of PU coating, as there are more O elements in SF. These results indicated that the bio-based FPU coating prepared by SF contains more nutrient elements than the conventional PU, which is more suitable for the field of CRF.
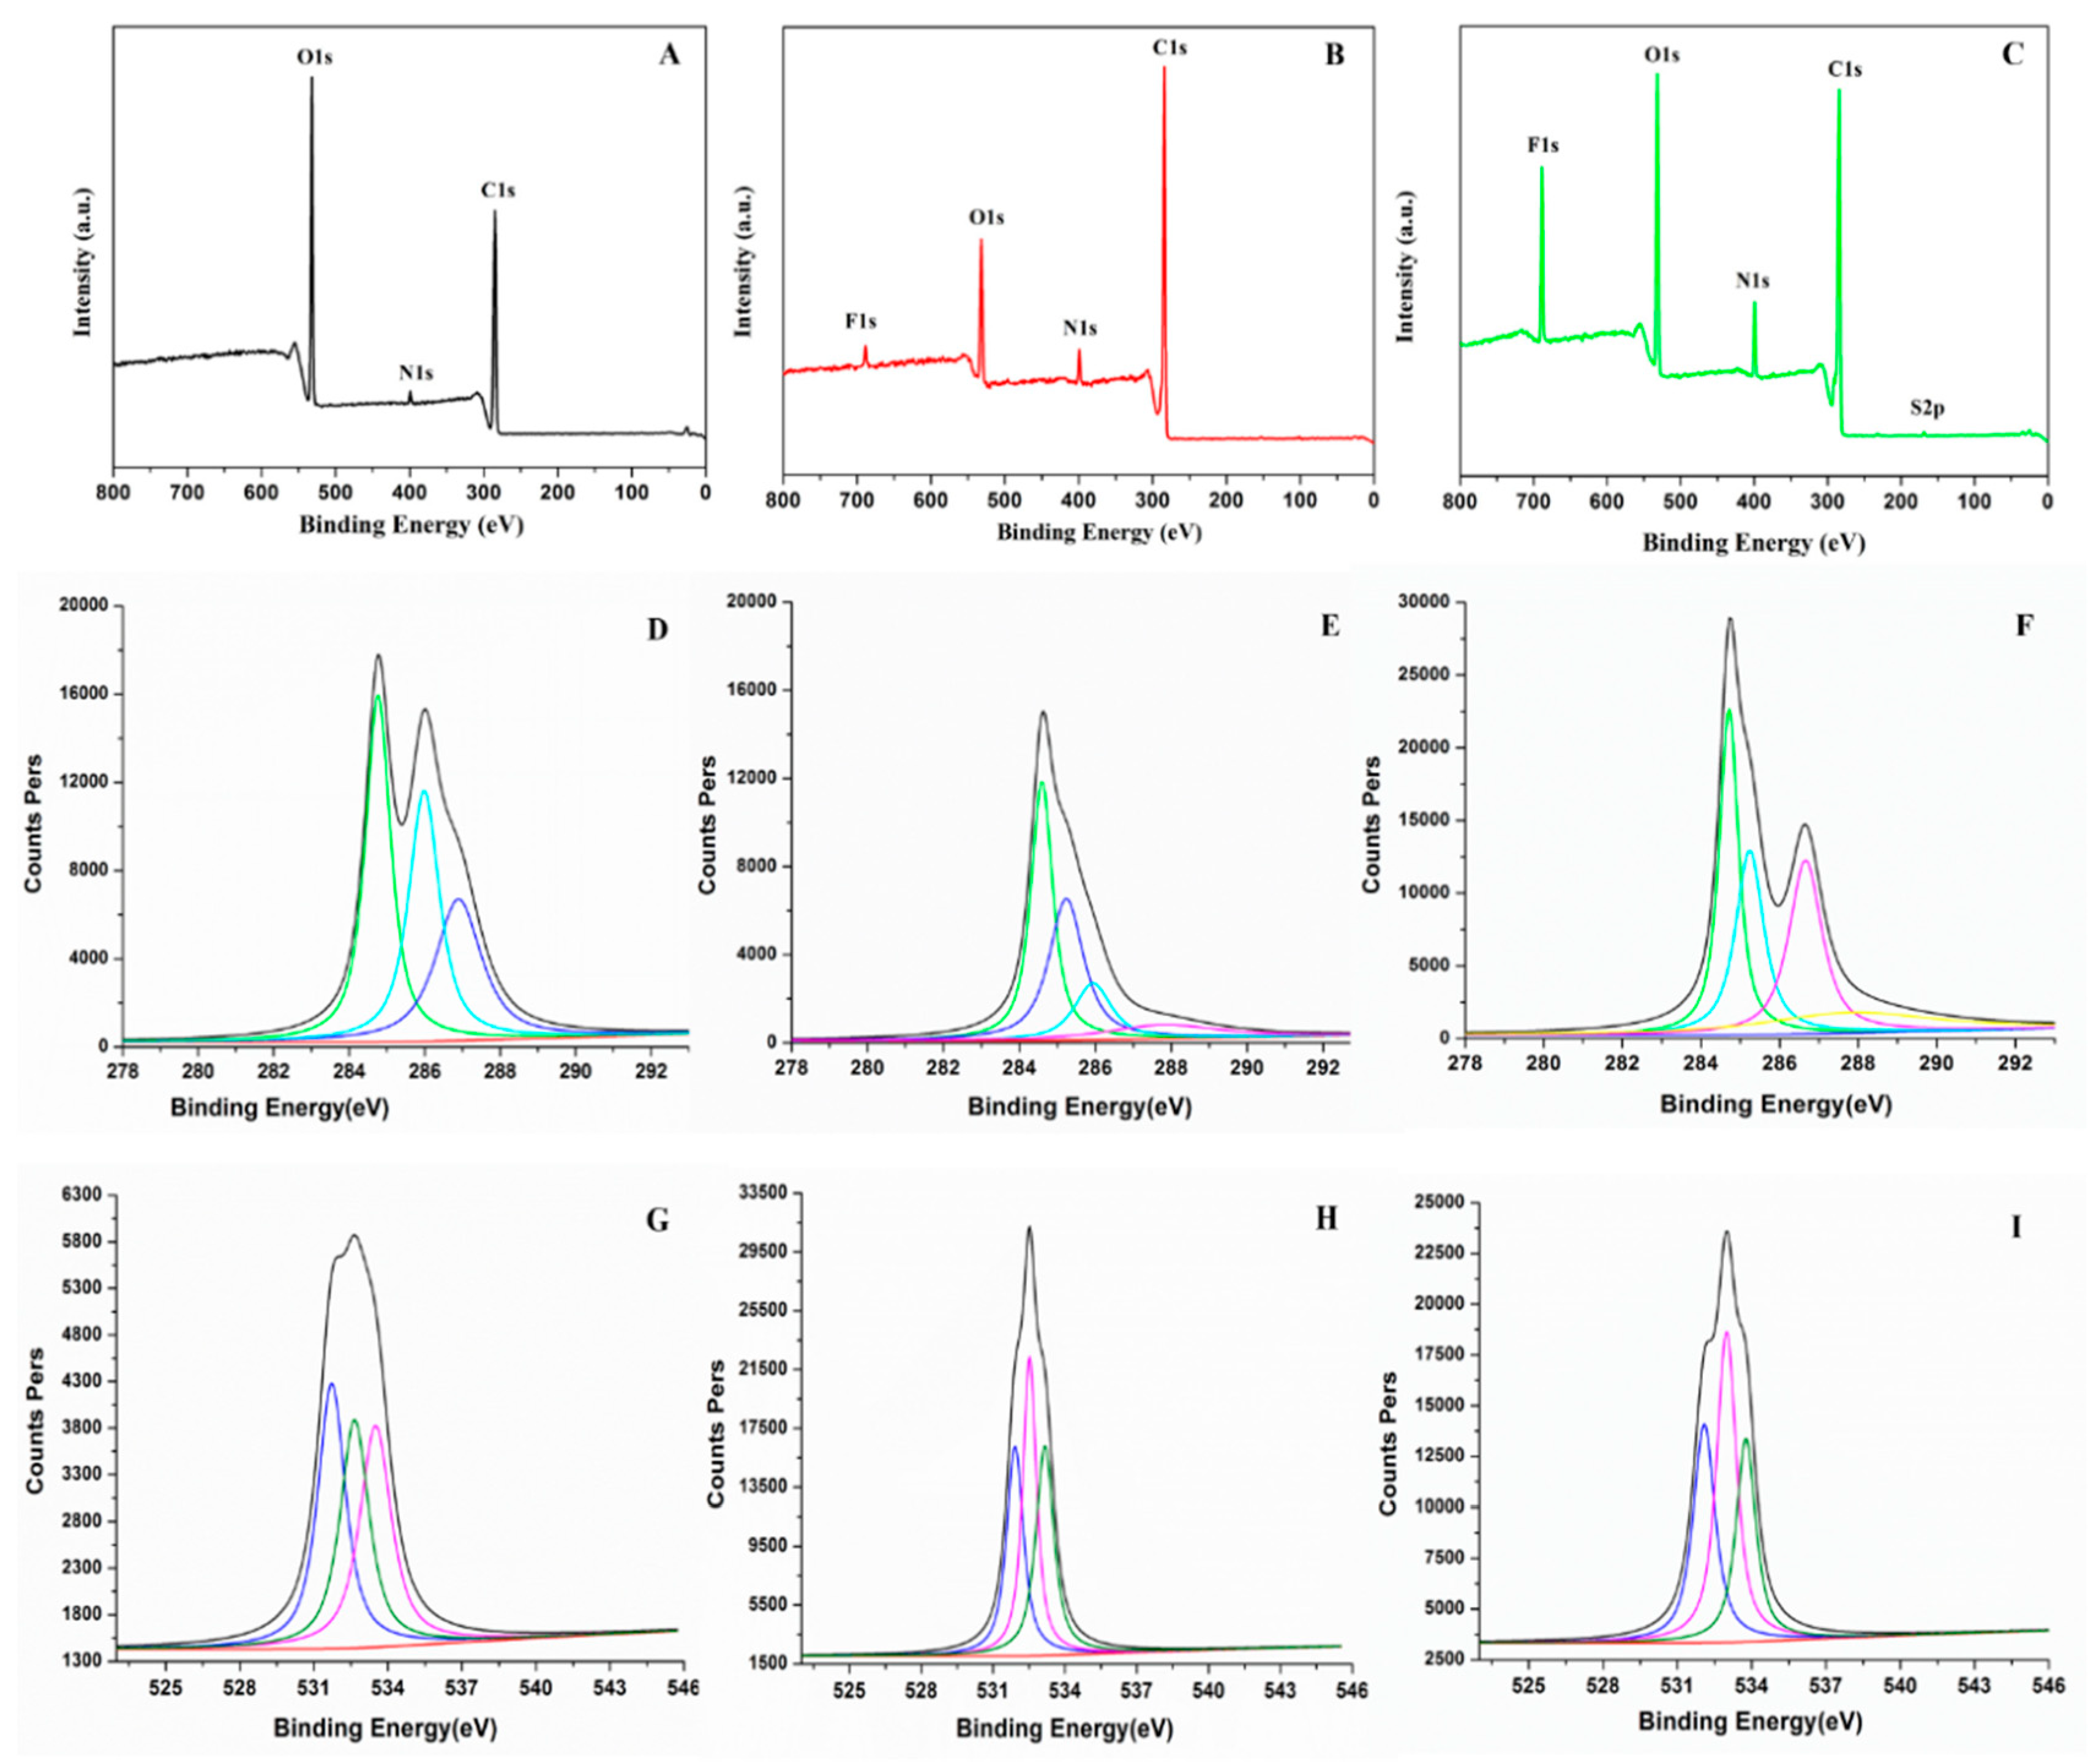
3.6. X-ray Photoelectron Spectroscopy (XPS) Analysis
The elemental compositions and states of SF, PU and FPU coatings were further studied by XPS. Survey analysis of SF, PU and FPU coatings are shown in
Figure 4A–C. The multiplex carbon 1s scan and oxygen 1s scan of SF, PU and FPU coatings are portrayed in
Figure 4D–I and
Table 5. As shown in
Figure 4A,C, 1s (285.19 eV), N 1s (399.74 eV) and O 1s (532.52 eV) on the XPS spectrum of SF can be observed. It can also be seen from
Table 5 that the elemental compositions in SF were mainly composed of C (68.261%) and O (29.425%), indicating that SF contains a large amount of organic matter, which is consistent with the previous results.
It was obviously noted that both oxygen and nitrogen’s atomic concentration are increased significantly in FPU coating compared with PU coating, as shown in
Figure 4B,C. The contents of C-O, C-N and O=C-O in the PU were 4.92%, 11.56% and 4.66%, respectively, while the contents in the FPU were 8.79%, 19.56% and 5.76%, respectively. An increase in the content of O and N atoms in FPU coating were due to the incorporation of SF. Moreover, the obvious increase of the binding energy of C 1s (284.82 eV) and O 1s (532.97 eV) on the surface of FPU coating (
Figure 4D–I,
Table 5), in comparison to the binding energy of C 1s (285.19 eV) and O 1s (532.52 eV) of SF (
Figure 4D–I,
Table 5), revealed the successful synthesis of FPU coating.
3.7. SEM Analysis
The microstructure morphology of the surface and cross-section of FPU, SC-based PU-coated urea (CPU) and SFC-based PU-coated urea (FCPU) was observed from the SEM images in
Figure 5.
Figure 5(A1) displayed that the surface of FPU was smooth, uniform and compact. Meanwhile, the cross-section morphology of FPU was shown in
Figure 5(A2); the coating material was very uniform, even though no micro-pores or gaps were observed on the cross section at 10,000× magnification (
Figure 5(A3)). This indicates that FPU coating material has an excellent film-forming property and controlled release ability [
30]. The uniform and dense coating shell can effectively reduce the diffusion of water molecules into the core of CRFs, and the diffusion of nutrients outside the core of CRFs.
Compared with the FPU, the surface of the CPU was relatively rough (
Figure 5(B1)). In the cross-section of the CPU (
Figure 5(B2)), some holes and gaps were observed. When the cross-section was enlarged 10,000 times, more small holes (white arrows direction) were shown in
Figure 5(B3); this implies that the CPU has poor controlled release ability. When the CPU was dipped in water, the water molecules adsorbed on the coating material quickly passed through the micro-pores in the coating shell, leading to the rapid release of nutrients in the CPU.
For FCPU, the surface morphology (
Figure 5(C1)) was similar to that of FPU, but the cross-section (
Figure 5(C2)) was not as regular and uniform as that of FPU. When the cross-section was magnified 10,000 times, some pin holes (white arrow direction) were observed in
Figure 5(C3). Compared with the CPU, the cross section of the FCPU is denser and more regular.
The reason for the microscopic morphology of FPU, CPU and FCPU was that the hydroxyl value of the biomass polyols obtained by SF modification was sequentially larger than that of SFC and SC (
Table 3), resulting in the higher reaction activity in the synthesis process. Furthermore, the liquefaction rate of SF (99.98%) was higher than that of SFC and SC, resulting in much less residue in the liquefaction of SF, and then indicating excellent film-forming property. Therefore, the FPU coating material obtained by the cross-linking reaction of more hydroxyl with isocyanate groups in PAPI has the highest crossing density and compact structure.
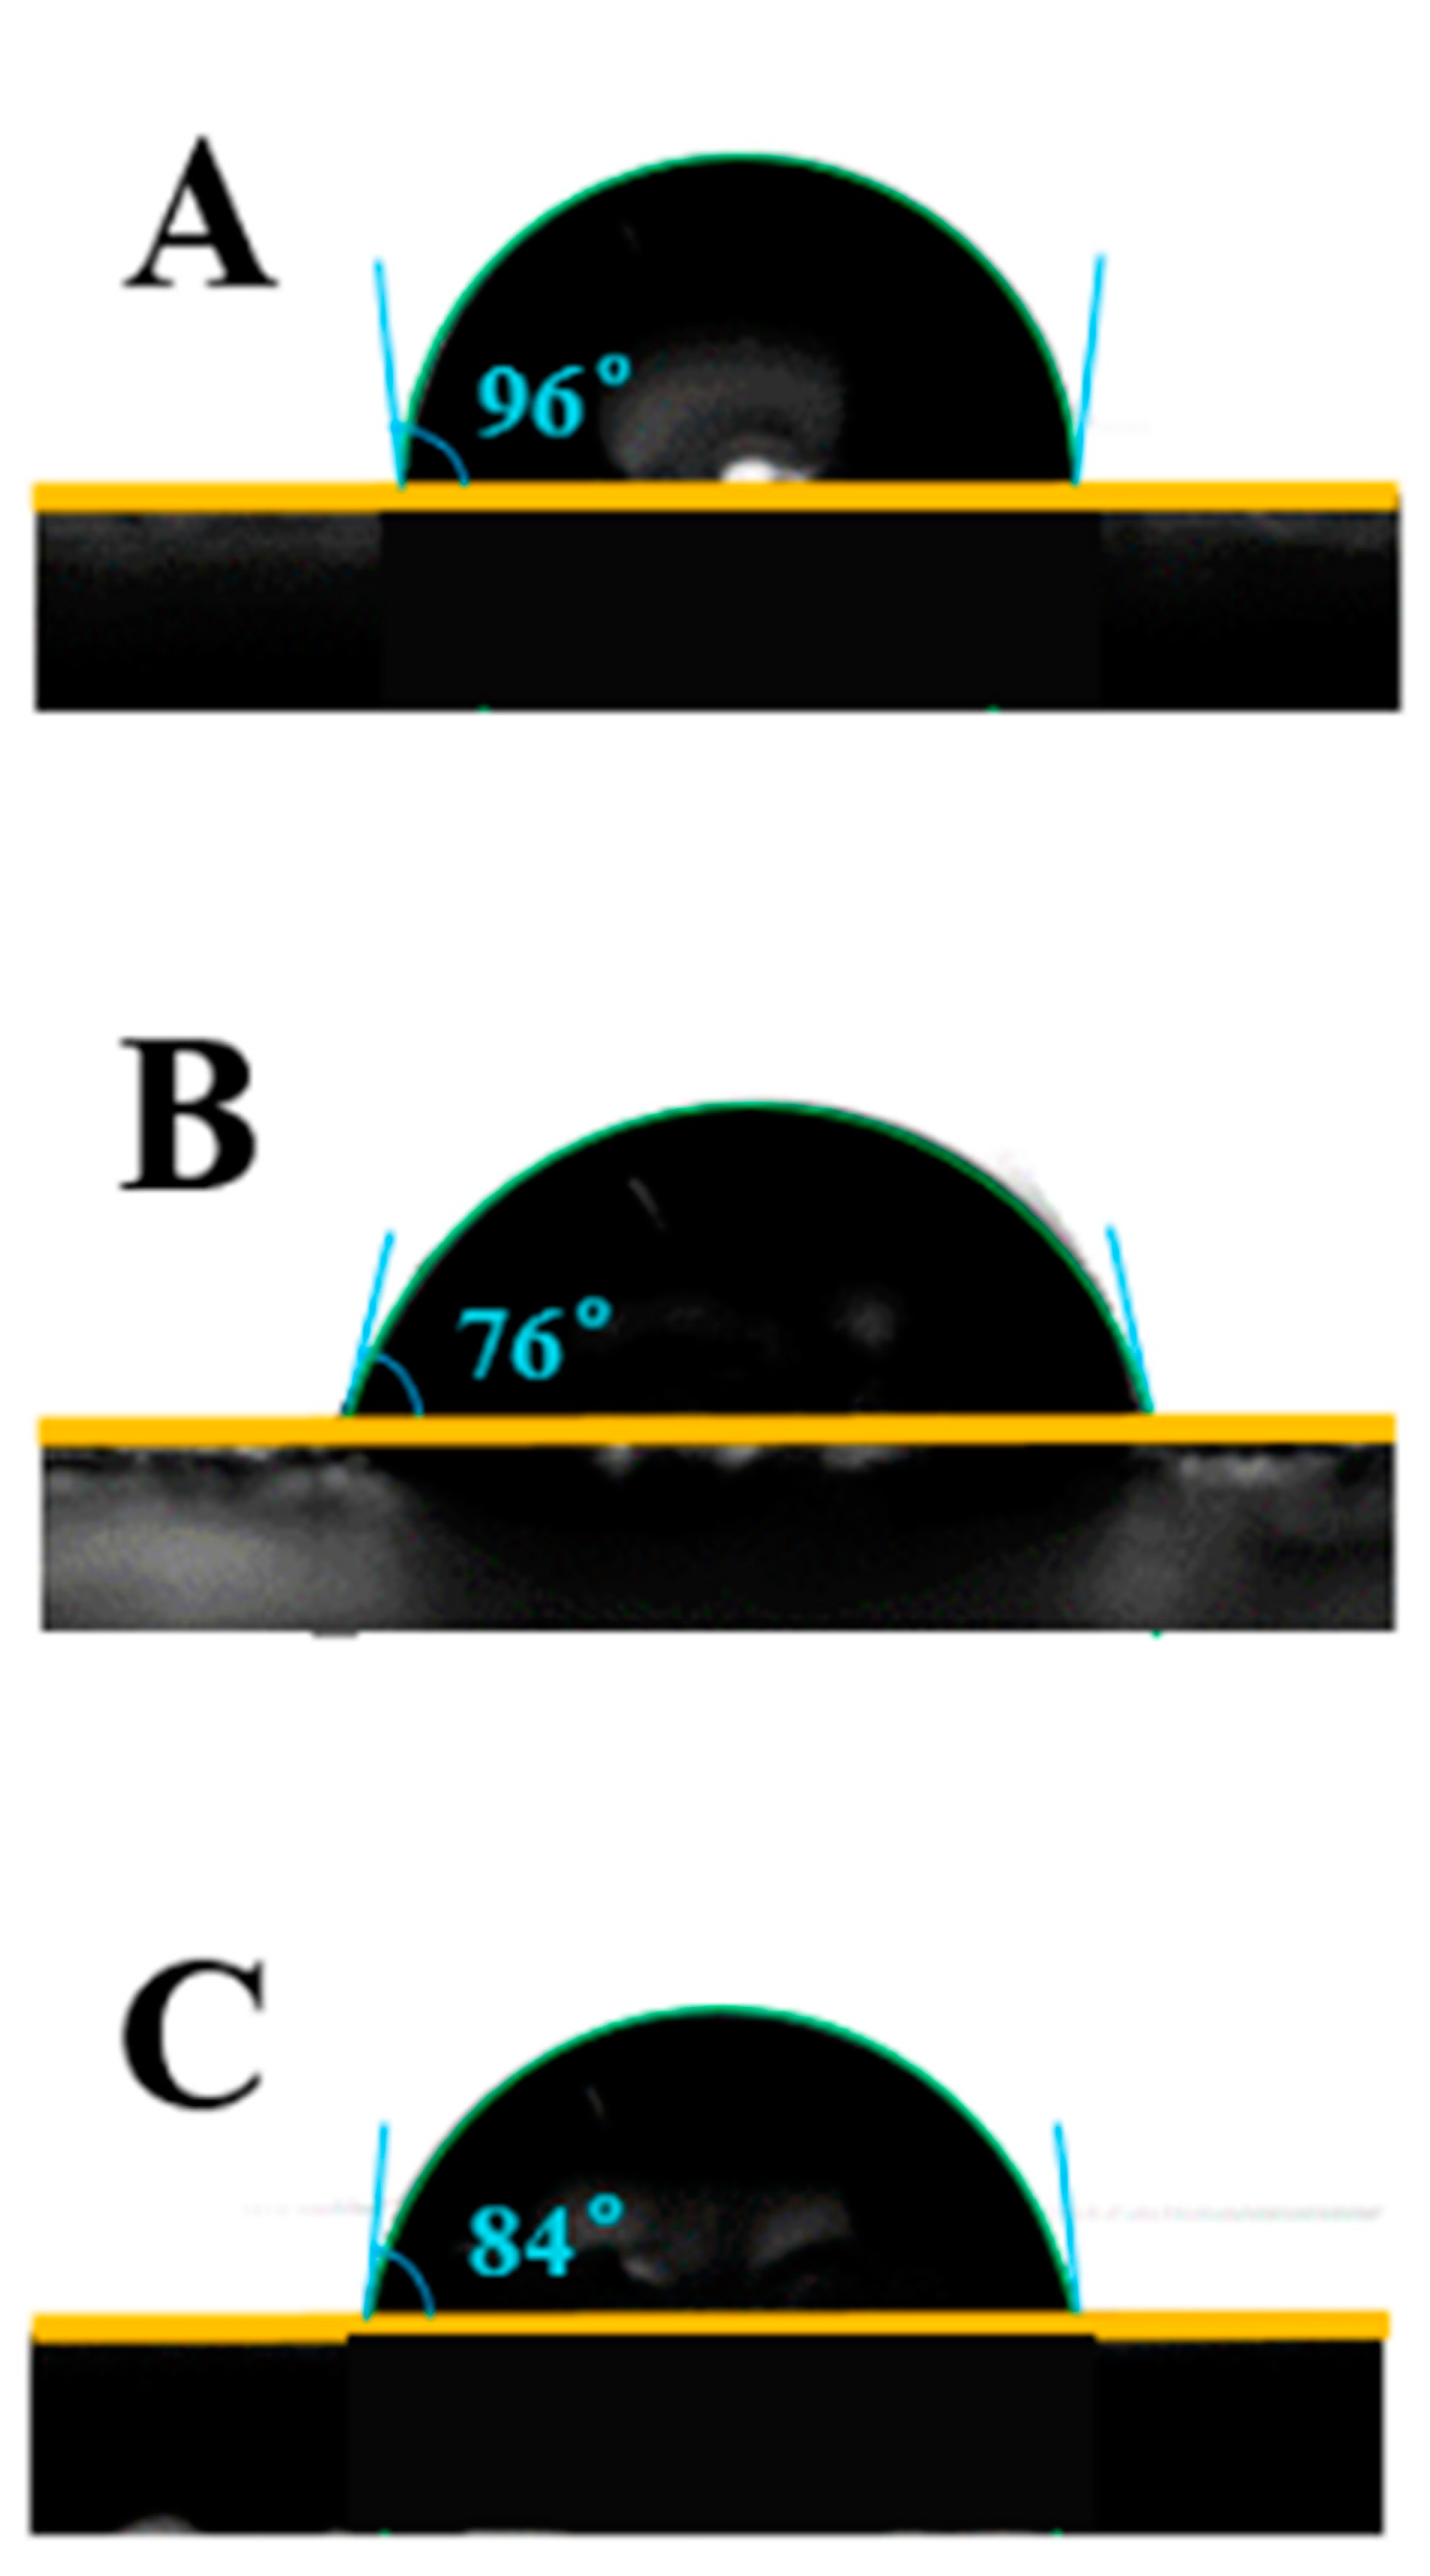
3.8. Water Contact Angle of Coating Materials
The wettability of all coating material surfaces was studied by using static water contact angle measurements. These images are displayed in
Figure 6. It was found that the water contact angles of the FPU, CPU and FCPU coating materials were 96°, 76° and 84°. The surface contact angle of FPU coating is the largest, indicating that the hydrophobic performance is the best. The results were consistent with the SEM images in
Figure 5. The reason for this may be that more hydroxyl groups reacted with isocyanate in the FPU coating, which reduces the hydrophilic groups on the material surface, and then improves the water resistance of the FPU coatings.
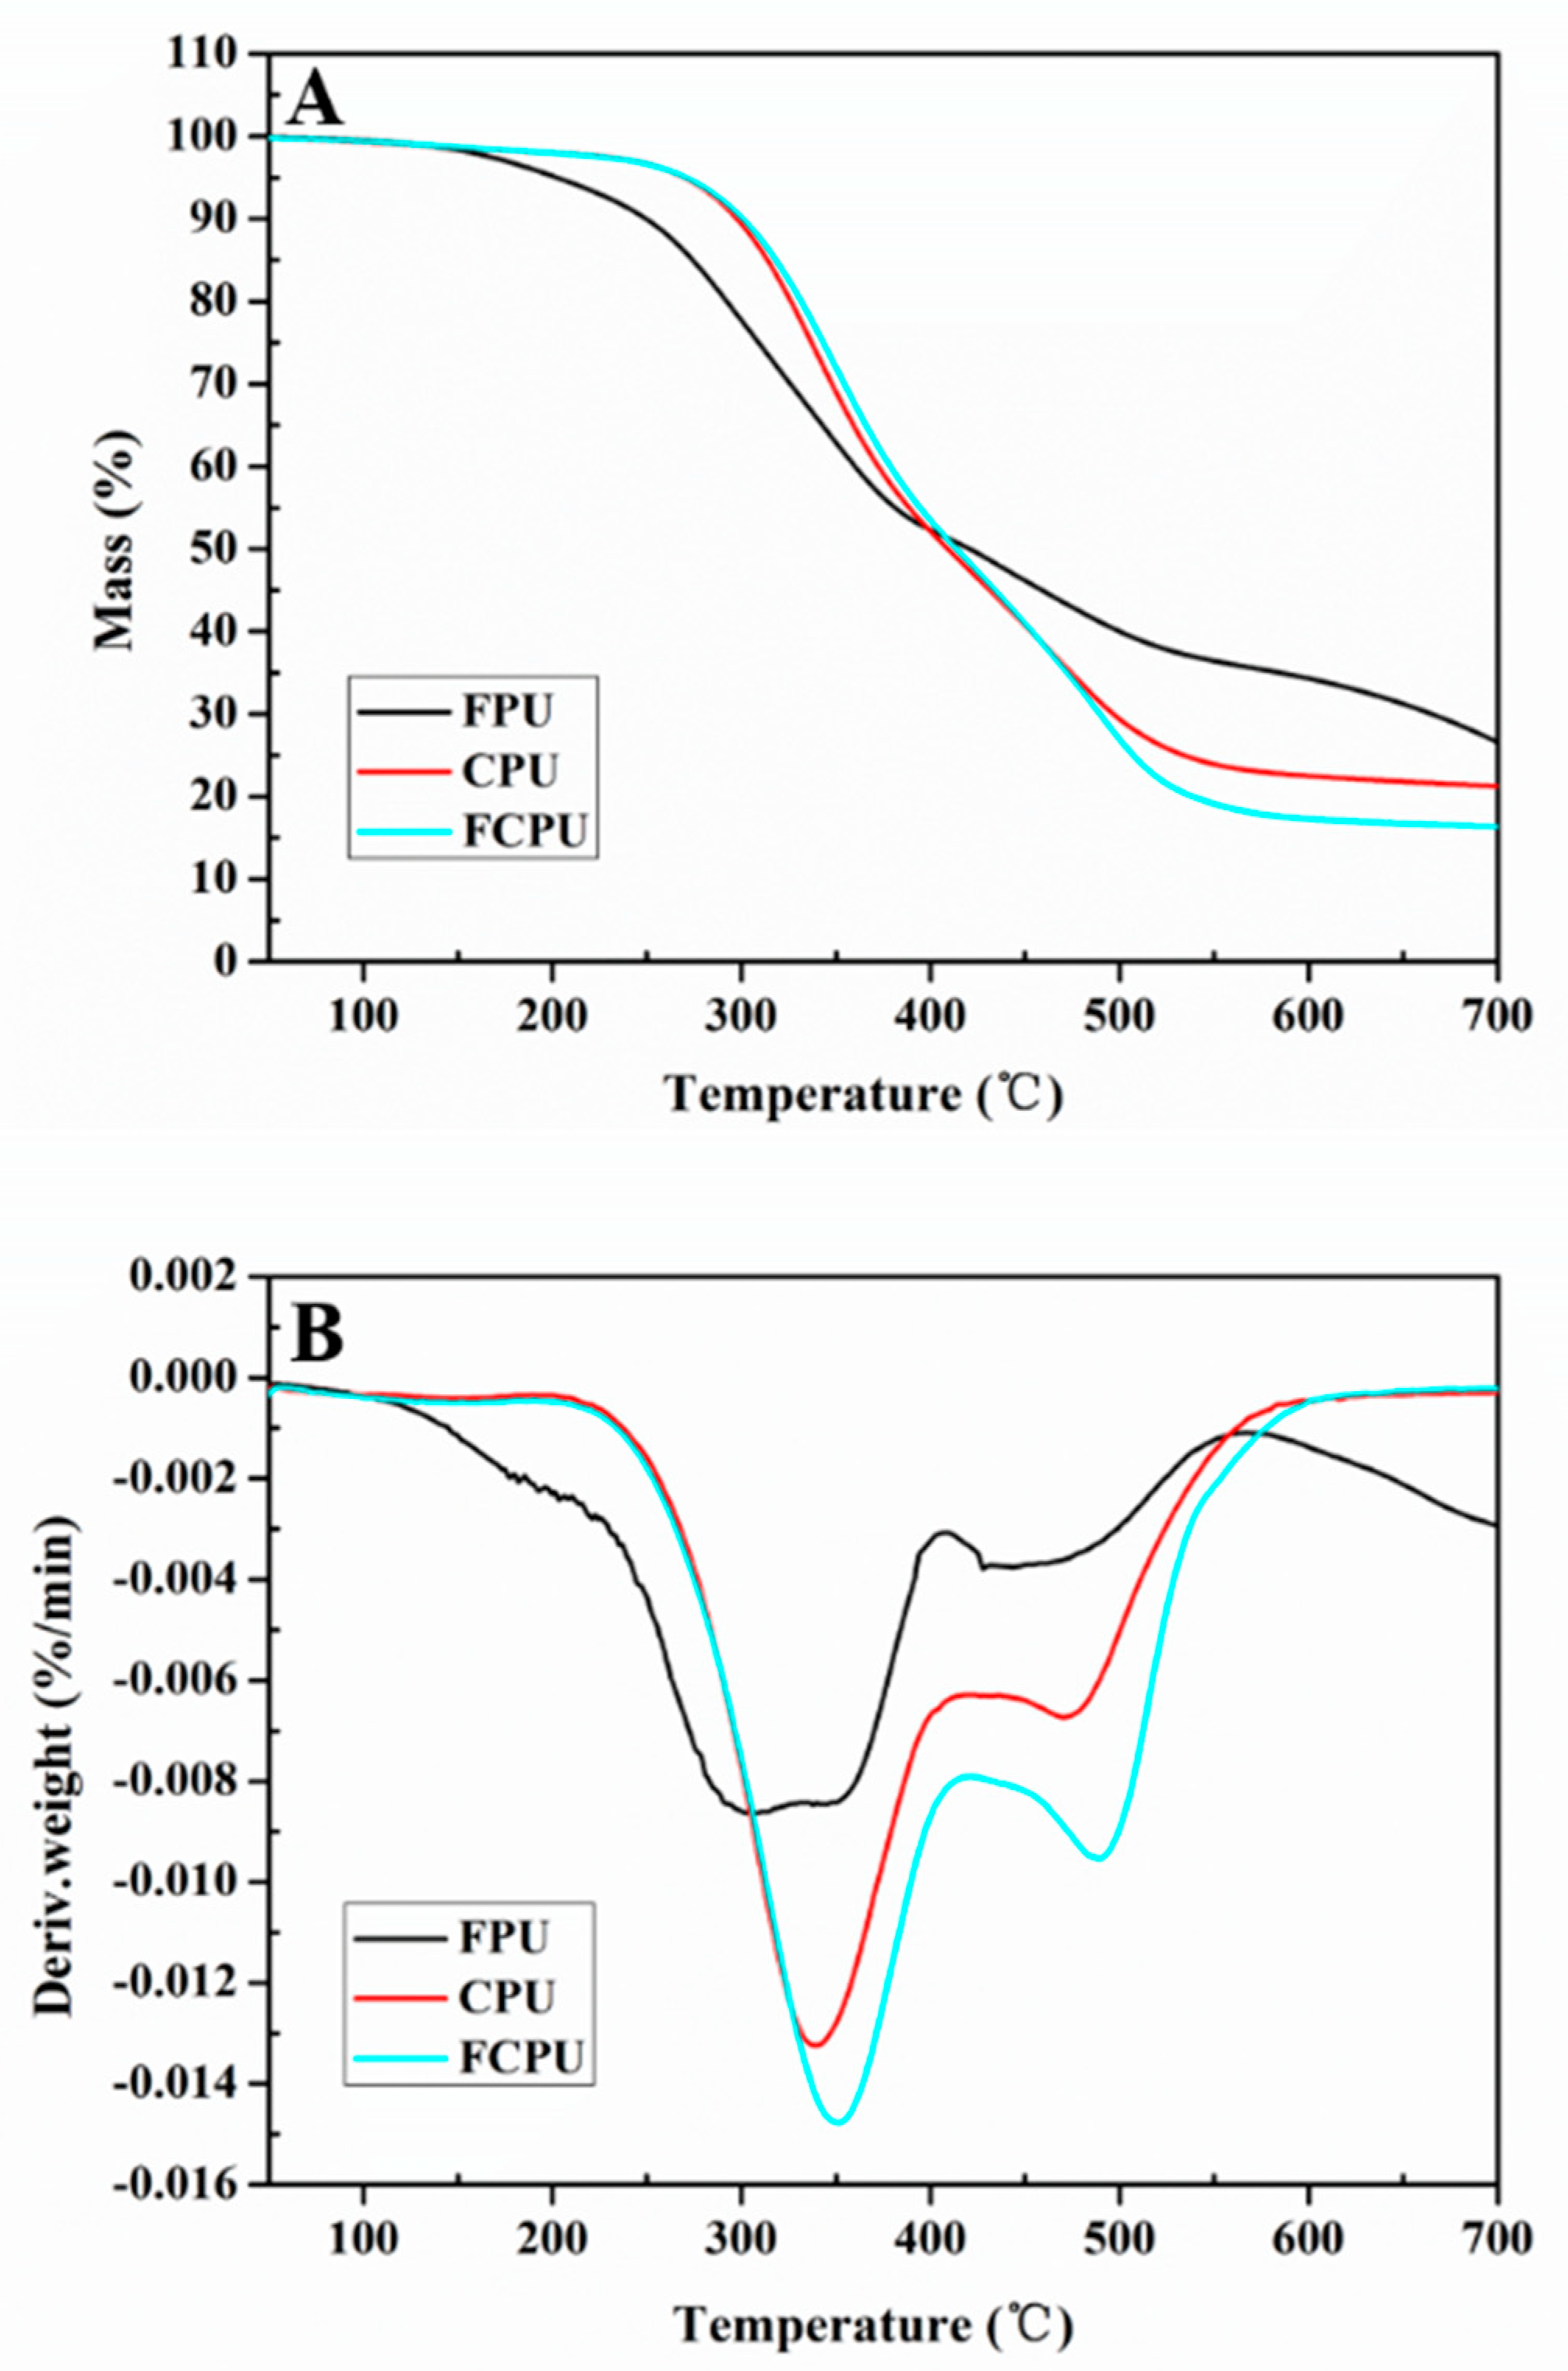
3.9. Thermal Properties
The thermal properties of FPU, CPU and FCPU coating materials were investigated by TGA and derivative thermogravimetric analysis (DTG). All coating materials showed thermal decomposition and mass loss at an elevated temperature.
The TGA and DTG curves of three coatings showed significant differences during the thermal degradation process. For the FPU, CPU and FCPU coating materials, two main thermal decomposition stages were markedly observed in the TGA curves (
Figure 7A) and DTG curves (
Figure 7B). The first of these was a strong peak occurring from 120 °C to 400 °C, due to the decomposition of the polymer. The second one was a weak peak from 420 °C to 520 °C, which was caused by the further decomposition of residues.
In the initial stage, the 5% weight loss temperature (T5%) of the FPU coating material is 202.7 °C, which is lower than that of the CPU coating material (276.5 °C) and the FCPU coating material (270.7 °C). This may be due to the fact that the FPU coating material contained more unreacted side chain groups that are easily decomposed upon heating. However, the 50% weight loss temperature (T50%) of the CPU, FCPU and FPU coating materials are 415.4, 412.7 and 420.9 °C, respectively. At the same time, when the temperature is 700 °C, the FPU residual amount is 26.5%, while the residual amounts of CPU and FCPU are 21.3% and 16.4%, respectively. The FPU exhibits higher thermal stability, which may be caused by More -OH and isocyanate reacting in the FPU to form a denser network structure, which in turn increases heat resistance.
3.10. Controlled Release Behavior
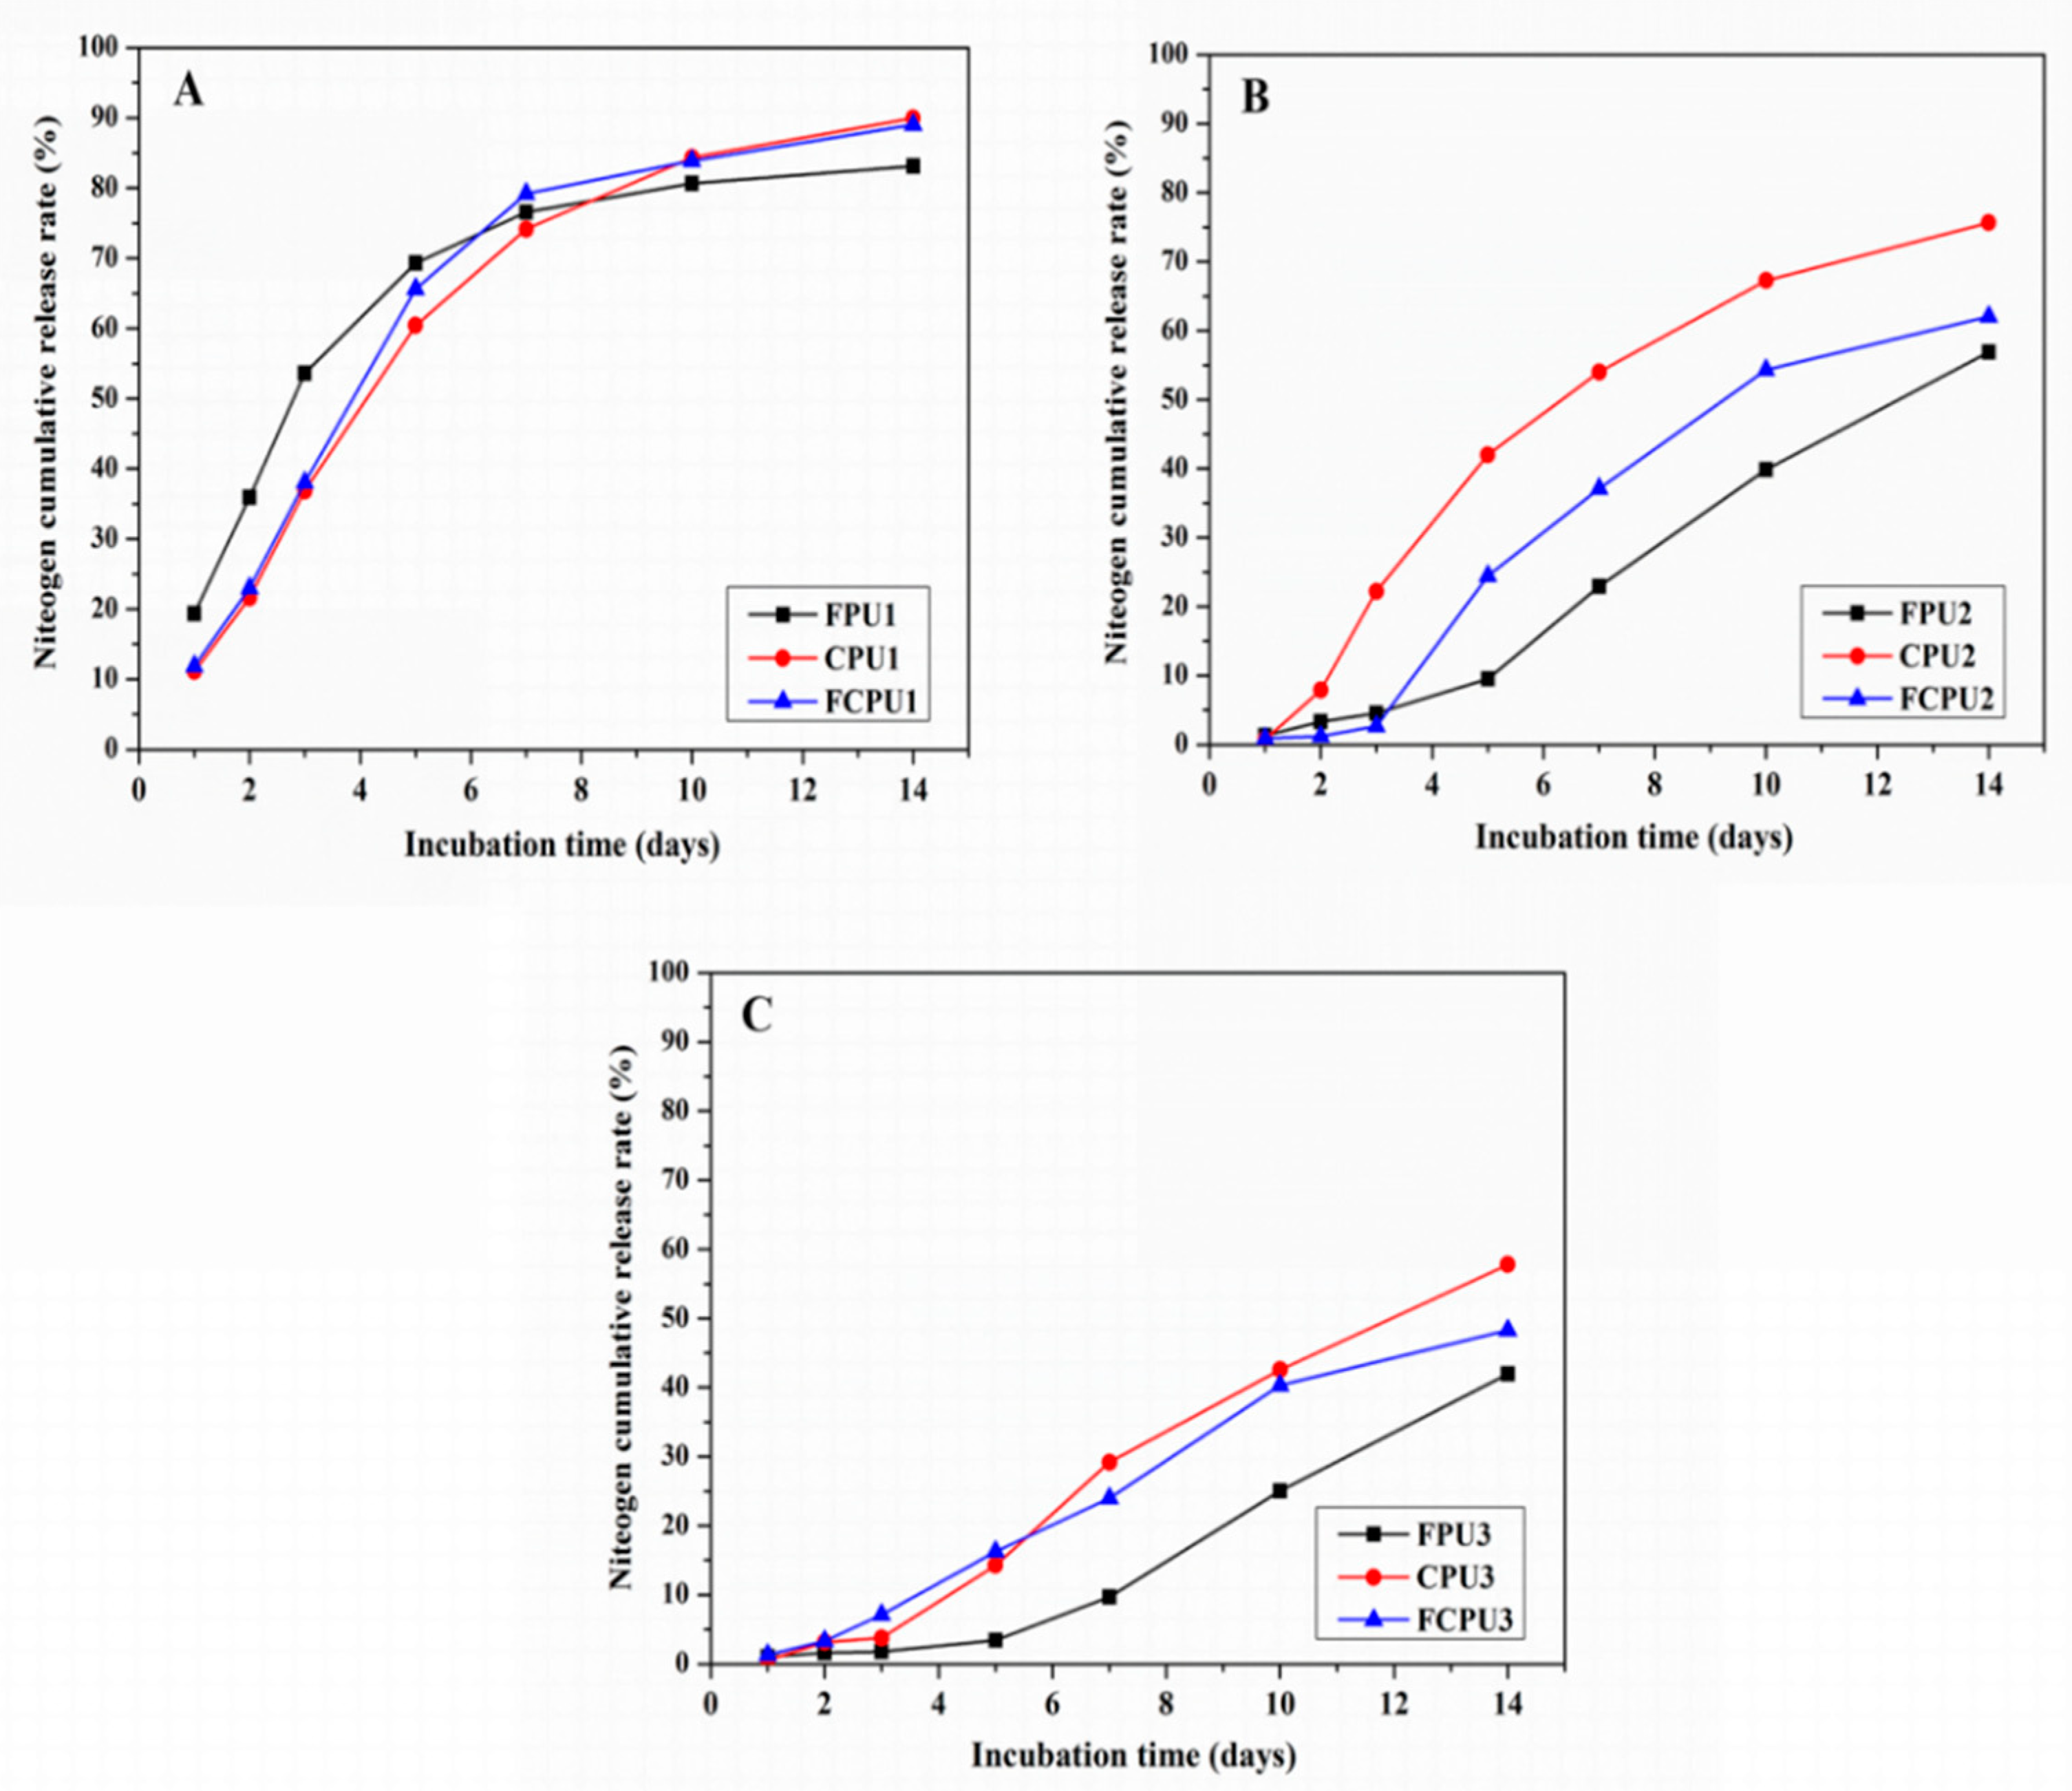
The N release characteristics of FPUs, CPUs and FCPUs were obviously affected by the different coating rates of the materials (
Figure 8). The N release rates in 24 h (i.e., initial release rate) were 19.34%, 11.11% and 11.87% for FPU1, CPU1 and FCPU1, respectively (4%,
Figure 8A). For the FPU2, CPU2 and FCPU2 (6%,
Figure 8B), the initial release rates were 1.36%, 0.75% and 0.90%, respectively. As the coating materials content was 8%, the initial release rates were 1.05%, 0.59% and 1.36%, respectively (
Figure 8C).
When the nutrient release time was 14 d, the N cumulative release rates of FPU1, CPU1 and FCPU1 were 83.11%, 89.97% and 89.06%, respectively. With the coating rates of the materials from 4% to 6% and 8%, the N cumulative release rates of FPU2 and FPU3 decreased to 56.89% and 41.95%, respectively; the N cumulative release rates of CPU2 and CPU3 decreased to 75.64% and 57.81%, respectively; and the N cumulative release rates of FCPU2 and FCPU3 decreased to 62.03% and 48.31%, respectively. Obviously, increasing the coating rates of the materials can effectively reduce the nutrient release rate. Then, the N release no longer decreased with increasing in coating materials due to the nature of the coating material [
23].
As shown in
Figure 8A–C, under the same coating rate of materials, the nutrient release rate of the FPU was lower than that of FCPU and CPU, which indicated that the controlled release ability of FPU was better than that of FCPU and CPU. The results were consistent with the analysis results of SEM. The above results indicated that the coating material and its rate have a strong effect on the nutrient release properties of CRF.
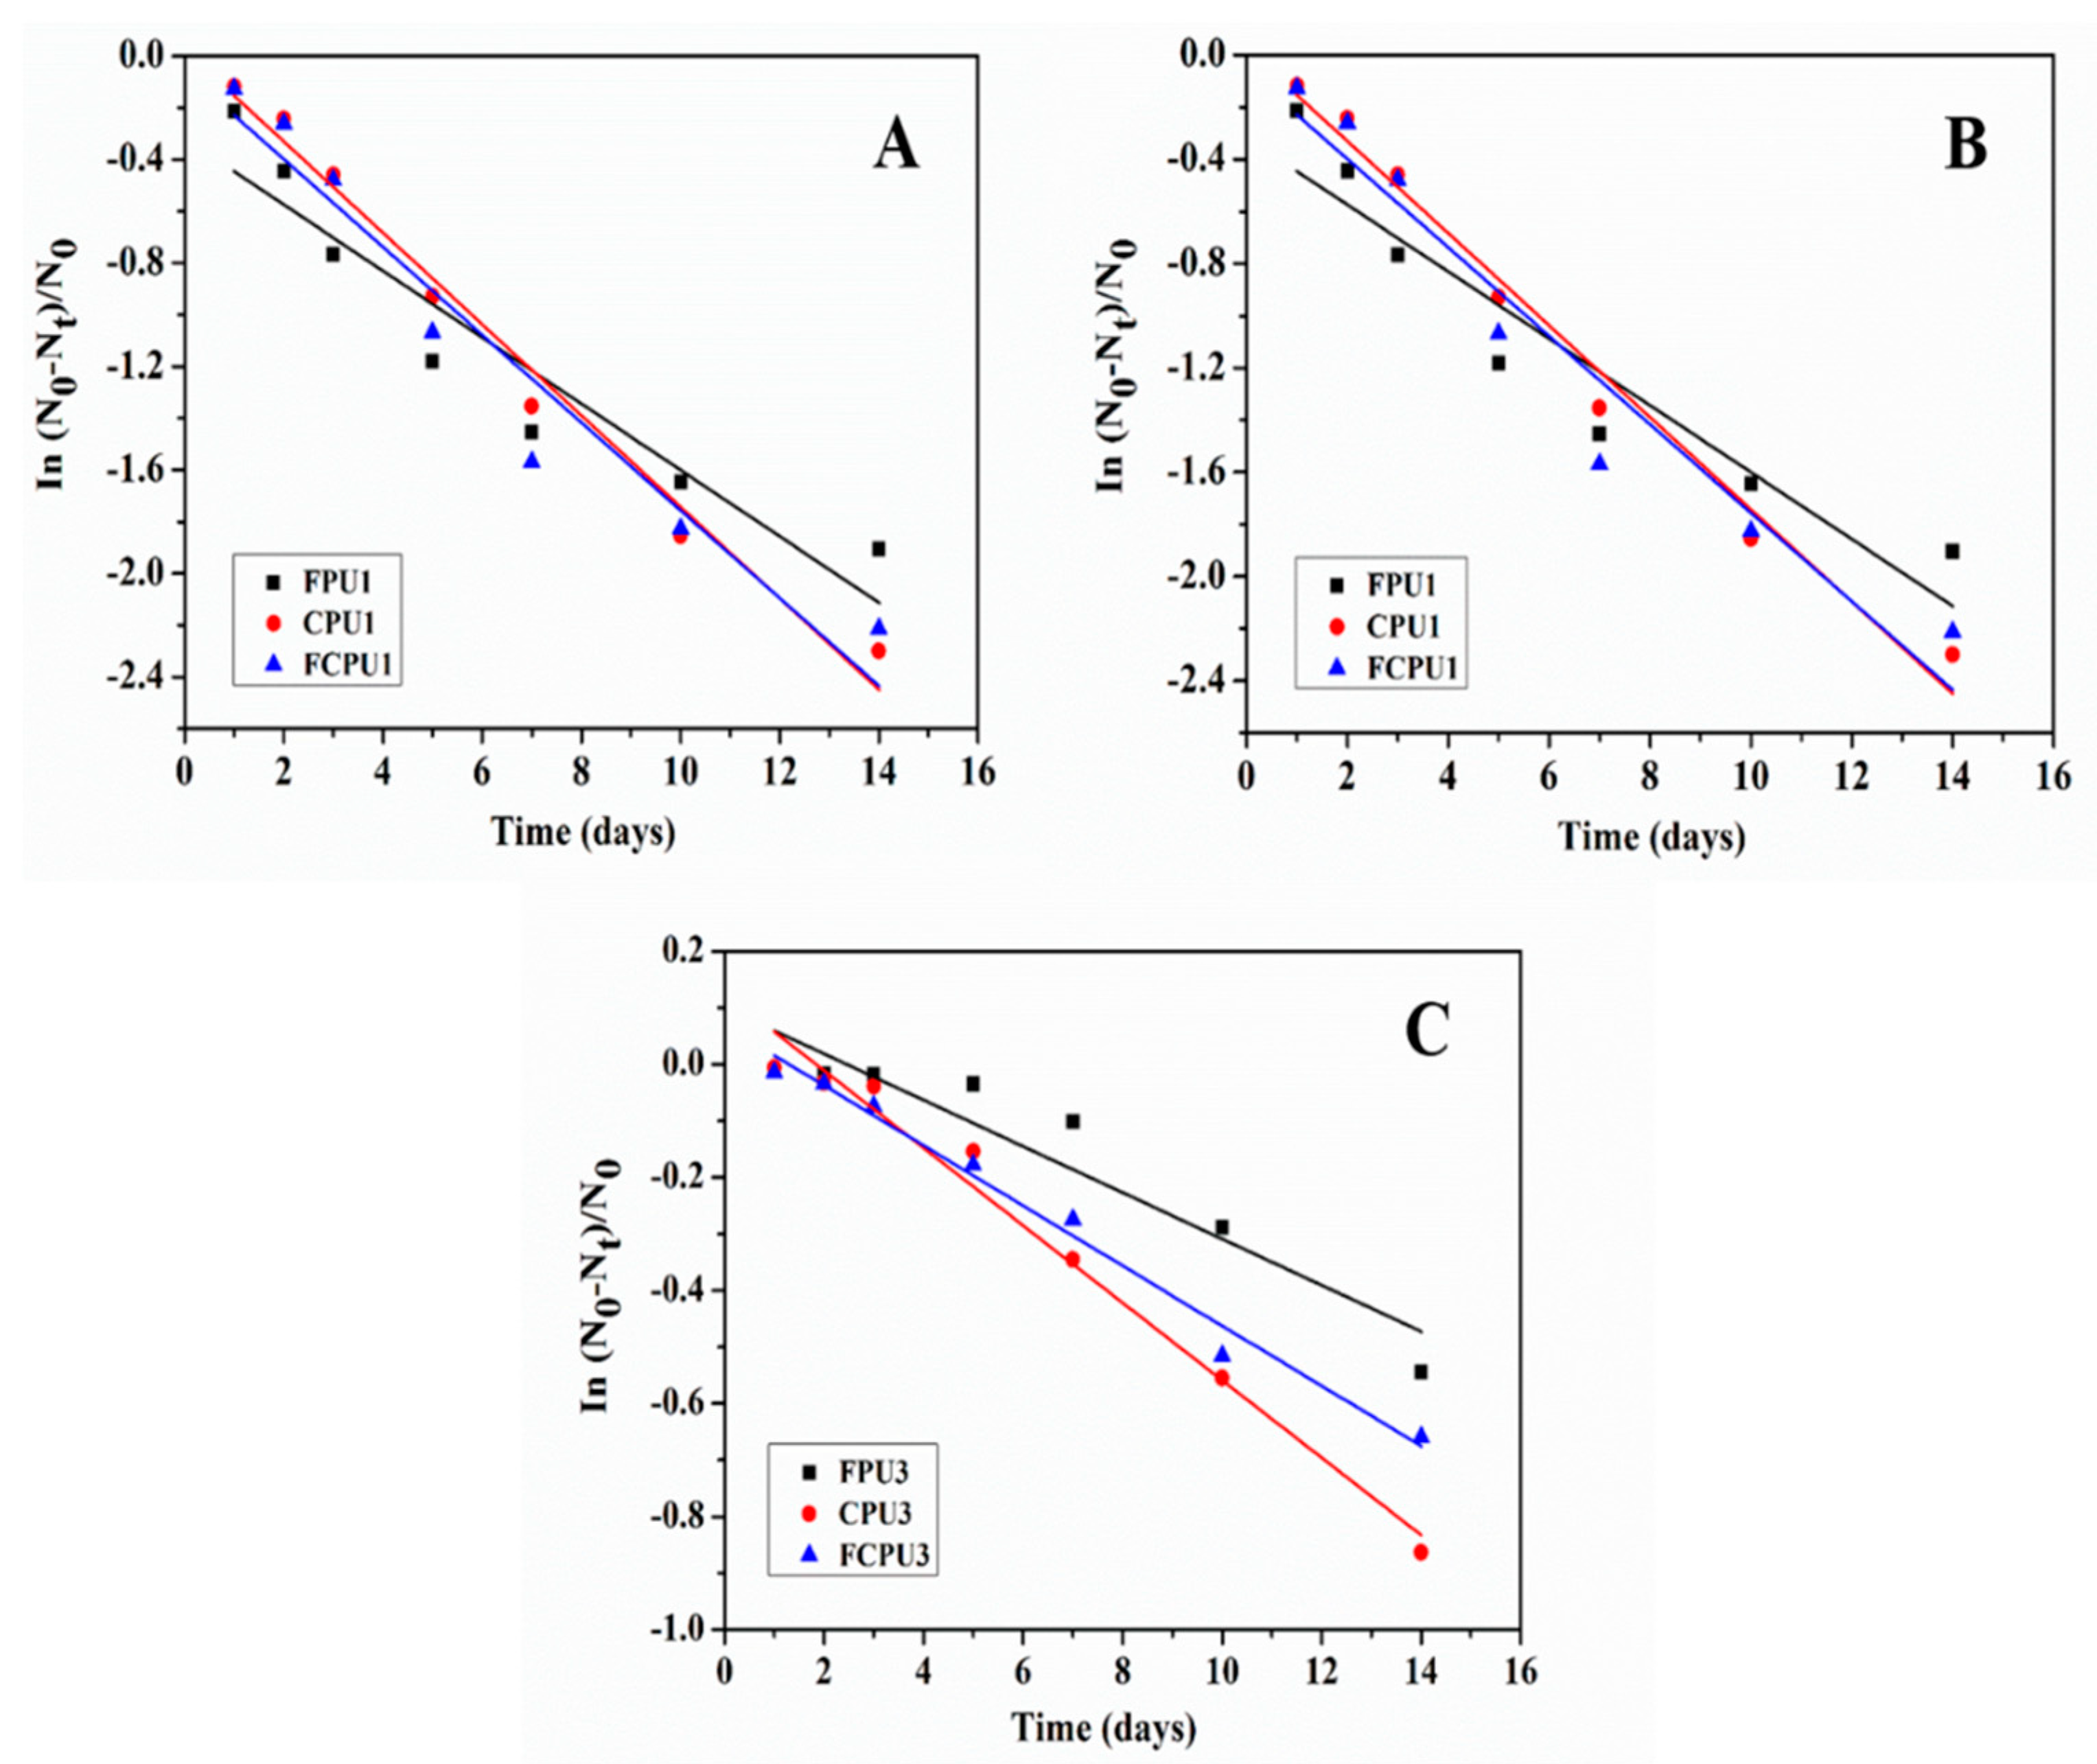
3.11. Controlled Release Kinetics
As shown in
Figure 9, the release kinetics of coated fertilizers were strongly related to the coating materials and rates [
31,
32]. The obtained release kinetic parameters, equations and correlation coefficients (
R2 ) are listed in
Table 6.
It can be seen from
Table 6 that the release rate constant
k of the FPUs, CPUs and FCPUs gradually decreases with the increase of the coating rate from 4% to 8%, which indicates that the nutrient release rates of fertilizers also gradually decreased. At the same coating rate, the order of
k value was as follows: FPUs < FCPUs < CPUs. The minimum
k value of FPU3 was 0.04091, which indicated that the nutrient release rate of FPU3 was the lowest, and the best nutrient controlled release performance was obtained. This result was consistent with the nutrient release performance results.
4. Conclusions
In this work, leftovers (SF) was successfully prepared to be bio-based polyurethane (PU) though a chemical modification reaction, and it was used as coating materials for SF-based PU-coated urea (FPU), rechauffe (SC)-based PU-coated urea (CPU) and SFC (a mixture of SF and SC, 1:1, w/w)-based PU-coated urea (FCPU). From the experimental data, compared with traditional PU, FPU contains more abundant elementals and higher N content in the coating material. Compared with CPU and FPU, FPU had a denser structure and better nutrient release ability (41.95%, 14 d). This work clearly shows that leftovers are a potentially viable material for the production of environment-friendly controlled release fertilizers (CRFs), and provides theoretical guidance. At the same time, it provides a new approach for the efficient utilization of leftover resources.


