Article

Evaluating Pre- and Post-Coagulation Configuration of Dissolved Air Flotation Using Response Surface Methodology

by
Emmanuel Kweinor Tetteh
* and
Sudesh Rathilal
Faculty of Engineering and the Built Environment, Department of Chemical Engineering, Durban University of Technology, Steve Biko Campus (S4 Level 1) Box 1334, Durban 4000, South Africa
*
Author to whom correspondence should be addressed.
Processes 2020, 8(4), 383; https://doi.org/10.3390/pr8040383
Submission received: 23 February 2020 / Revised: 18 March 2020 / Accepted: 19 March 2020 / Published: 25 March 2020
(This article belongs to the Section Chemical Processes and Systems)

Abstract

:
The effects of coagulation-dissolved air flotation (DAF) process configuration was studied on oil refinery wastewater. The configuration was done in two ways: acid-coagulation-DAF (pre-treatment) and acid-DAF-coagulation (post-treatment). Two different cationic and polymeric organic coagulants were employed in this study to compare their treatability performance with the two aforementioned configurations. All the coagulants applied before the DAF were found to be effective, with over 85% more contaminant removal efficiency than their post-treatment. Alum, being the most cost-effective coagulant, was then employed with response surface methodology (RSM) to obtain the optimum conditions. These include a coagulant dosage of 100 mg/L, air saturator pressure of 375 kPa and air–water ratio of 10% vol/vol corresponding to a desirability of 92% for the removal of oily pollutants from a local South Africa oil refinery’s wastewater. With the response quadratic models that were developed, the optimum conditions were tested experimentally, which were consistent with the models predicted results at a 95% confidence level.

1. Introduction

Globally, energy demand is escalating with the production of petrochemical products, which ends up generating high amounts of wastewater due to its complex process. This creates a global problem of contaminated oily wastewater which needs to be decontaminated [1]. Meanwhile, coagulation and dissolved air flotation (CDAF) systems have been the most widely used physio-chemical processes in the water and wastewater treatment settings [2,3]. Of these processes, the DAF can be operated alone or combined with other processes at different stages of the WWTPs for primary, secondary or tertiary treatment purposes [4]. In this context, the DAF was employed for primary purposes to improve separation of industrial oil and suspended materials from oily wastewater.
In South Africa, the concern about the environmental threats of oily waste pollution produced during oil exploration and production activities impedes the united nations (UN’s) sustainable goal for 2050, with a focus on clean water and sanitation [5,6]. It is therefore important to improve the treatment process to meet the stringent discharge limits of soap oil and grease (SOG) below discharge limits of 50 mg/L [7,8]. Some of the waste streams, including petrochemical industries, contain high amounts of contaminants viz. turbidity, total suspended solids (TSS), chemical oxygen demand (COD), SOG and other organic compounds’ derivatives [7,9,10]. These contaminants are not just detrimental to the environment, but also to aquatic life and human health [8].
Conventionally, treatment technologies including gravity separation, electrocoagulation, coagulation, flotation, advanced oxidation processes, membrane filtration, and biodegradation are used [11,12,13,14,15,16]. However, some of the aforementioned technologies are unsatisfactory relating to the separation of oil from water, whereby flotation remains remarkable [17]. Flotation involves the separation of bulk solids from the liquid medium using microbubbles [2,18]. Among the flotation processes, such as electrolytic flotation, dissolved-air flotation (DAF) and dispersed-air flotation, DAF has been the most commonly used flotation technology in mineral processing, potable water, and wastewater treatment industries [2,19].
The DAF system was firstly used in the early 1960s for the treatment of drinking water in Scandinavia, the UK and South Africa [2,18,20]. In this process, dissolved air is saturated at high pressure (300–600 kPa), which forms microbubbles when released into the flotation cell, serving as a driving force to move the aggregated flocs to the surface [18,19]. This phenomenon includes: (a) air bubble generation, (b) contact between air bubbles and oil droplets, (c) attachment of gas bubbles to oil droplets, and (d) the rising up of the air–oil combination [2,18,19]. Edzwald [2] reported some of the technical advantages of DAF as compared to conventional sedimentation process, including rapid output, a high loading rate, and low hydraulic retention time and the low cost of construction. Based on experience, DAF is easy to operate with a higher capacity and a more acceptable footprint than sedimentation processes [19,20]. A study by Adlan et al., [21] shows a 75% reduction in COD from synthetic landfill leachate with an initial COD of 2010 mg/L by using ferric chloride coagulation in a DAF treatment process [1,8]. In South Africa, to ascertain the variation in oil refinery wastewater (ORW) composition, combining chemical and physical treatment processes is implemented within an oil refinery plant for the recovery of valuable industrial oil potential from the oily wastewater [10].
Consequently, the optimisation of DAF in most industries is very complex due to the multivariable delays in responses and resources associated with the one-factor-at time (OFAT) approach. Optimising DAF by OFAT and keeping the rest of the factors constant does not provide much information on the interactive effects of the system operating conditions [21]. Some of these setbacks include the mixing mechanism, charge neutralisation, interfacial bridging and entrapment of air bubble–colloidal particles [2]. Meanwhile, response surface methodology (RSM), is used empirically to study the relationship between one or more responses as a function of specified input factors in the chemical, biological and wastewater facilities [21]. Therefore, this study aimed to evaluate the performance of combining coagulation and DAF in two configuration streams, namely (a) acid-coagulation-DAF (pre-treatment) and (b) acid-DAF-coagulation (post-treatment) using two polymeric organic coagulants (Z553D and Zetag-FS/A50) and two inorganic coagulants (ferric sulphate (FS) and alum). The study also examined the individual and interactive influence of three independent factors (coagulant dosage, air saturator pressure and air–water ratio) on the removal of COD, SOG, TSS and turbidity using RSM.

2. Materials and Methods

2.1. Chemical and Wastewater Samples

The experiments were carried out in two folds: the OFAT and RSM approach. The OFAT approach was used to evaluate the efficiency of two polymeric organic coagulants (Z553D and Zetag-FS/A50) and two inorganic coagulants (ferric sulphate (FS) and alum) supplied by Sigma-Aldrich Co, South Africa. The most effective coagulant was then selected to study the interactional effects of the factors on the suitable configuration option. A local South African oil refinery wastewater (ORW) sample was used as the feed. The samples were stored and characterised according to the America Standard for Water and Wastewater experiments [22], as well as the South African Bureau of Standards Method 1051 for SOG, as used by Tetteh et al. [10]. The average raw compositions of the ORW, characterised over a period of six months, were turbidity (2430 NTU), TSS (984 mg/L), COD (12,115 mg/L) and SOG (1230 mg/L). The pH of the effluent was adjusted with sodium hydroxide (NaOH) and sulfuric acid (H2SO4). Turbidity and TSS were analysed with Hach 2100N turbidimeter and Hach DR890 potable colorimeter, respectively.

2.2. DAF Configuration Process

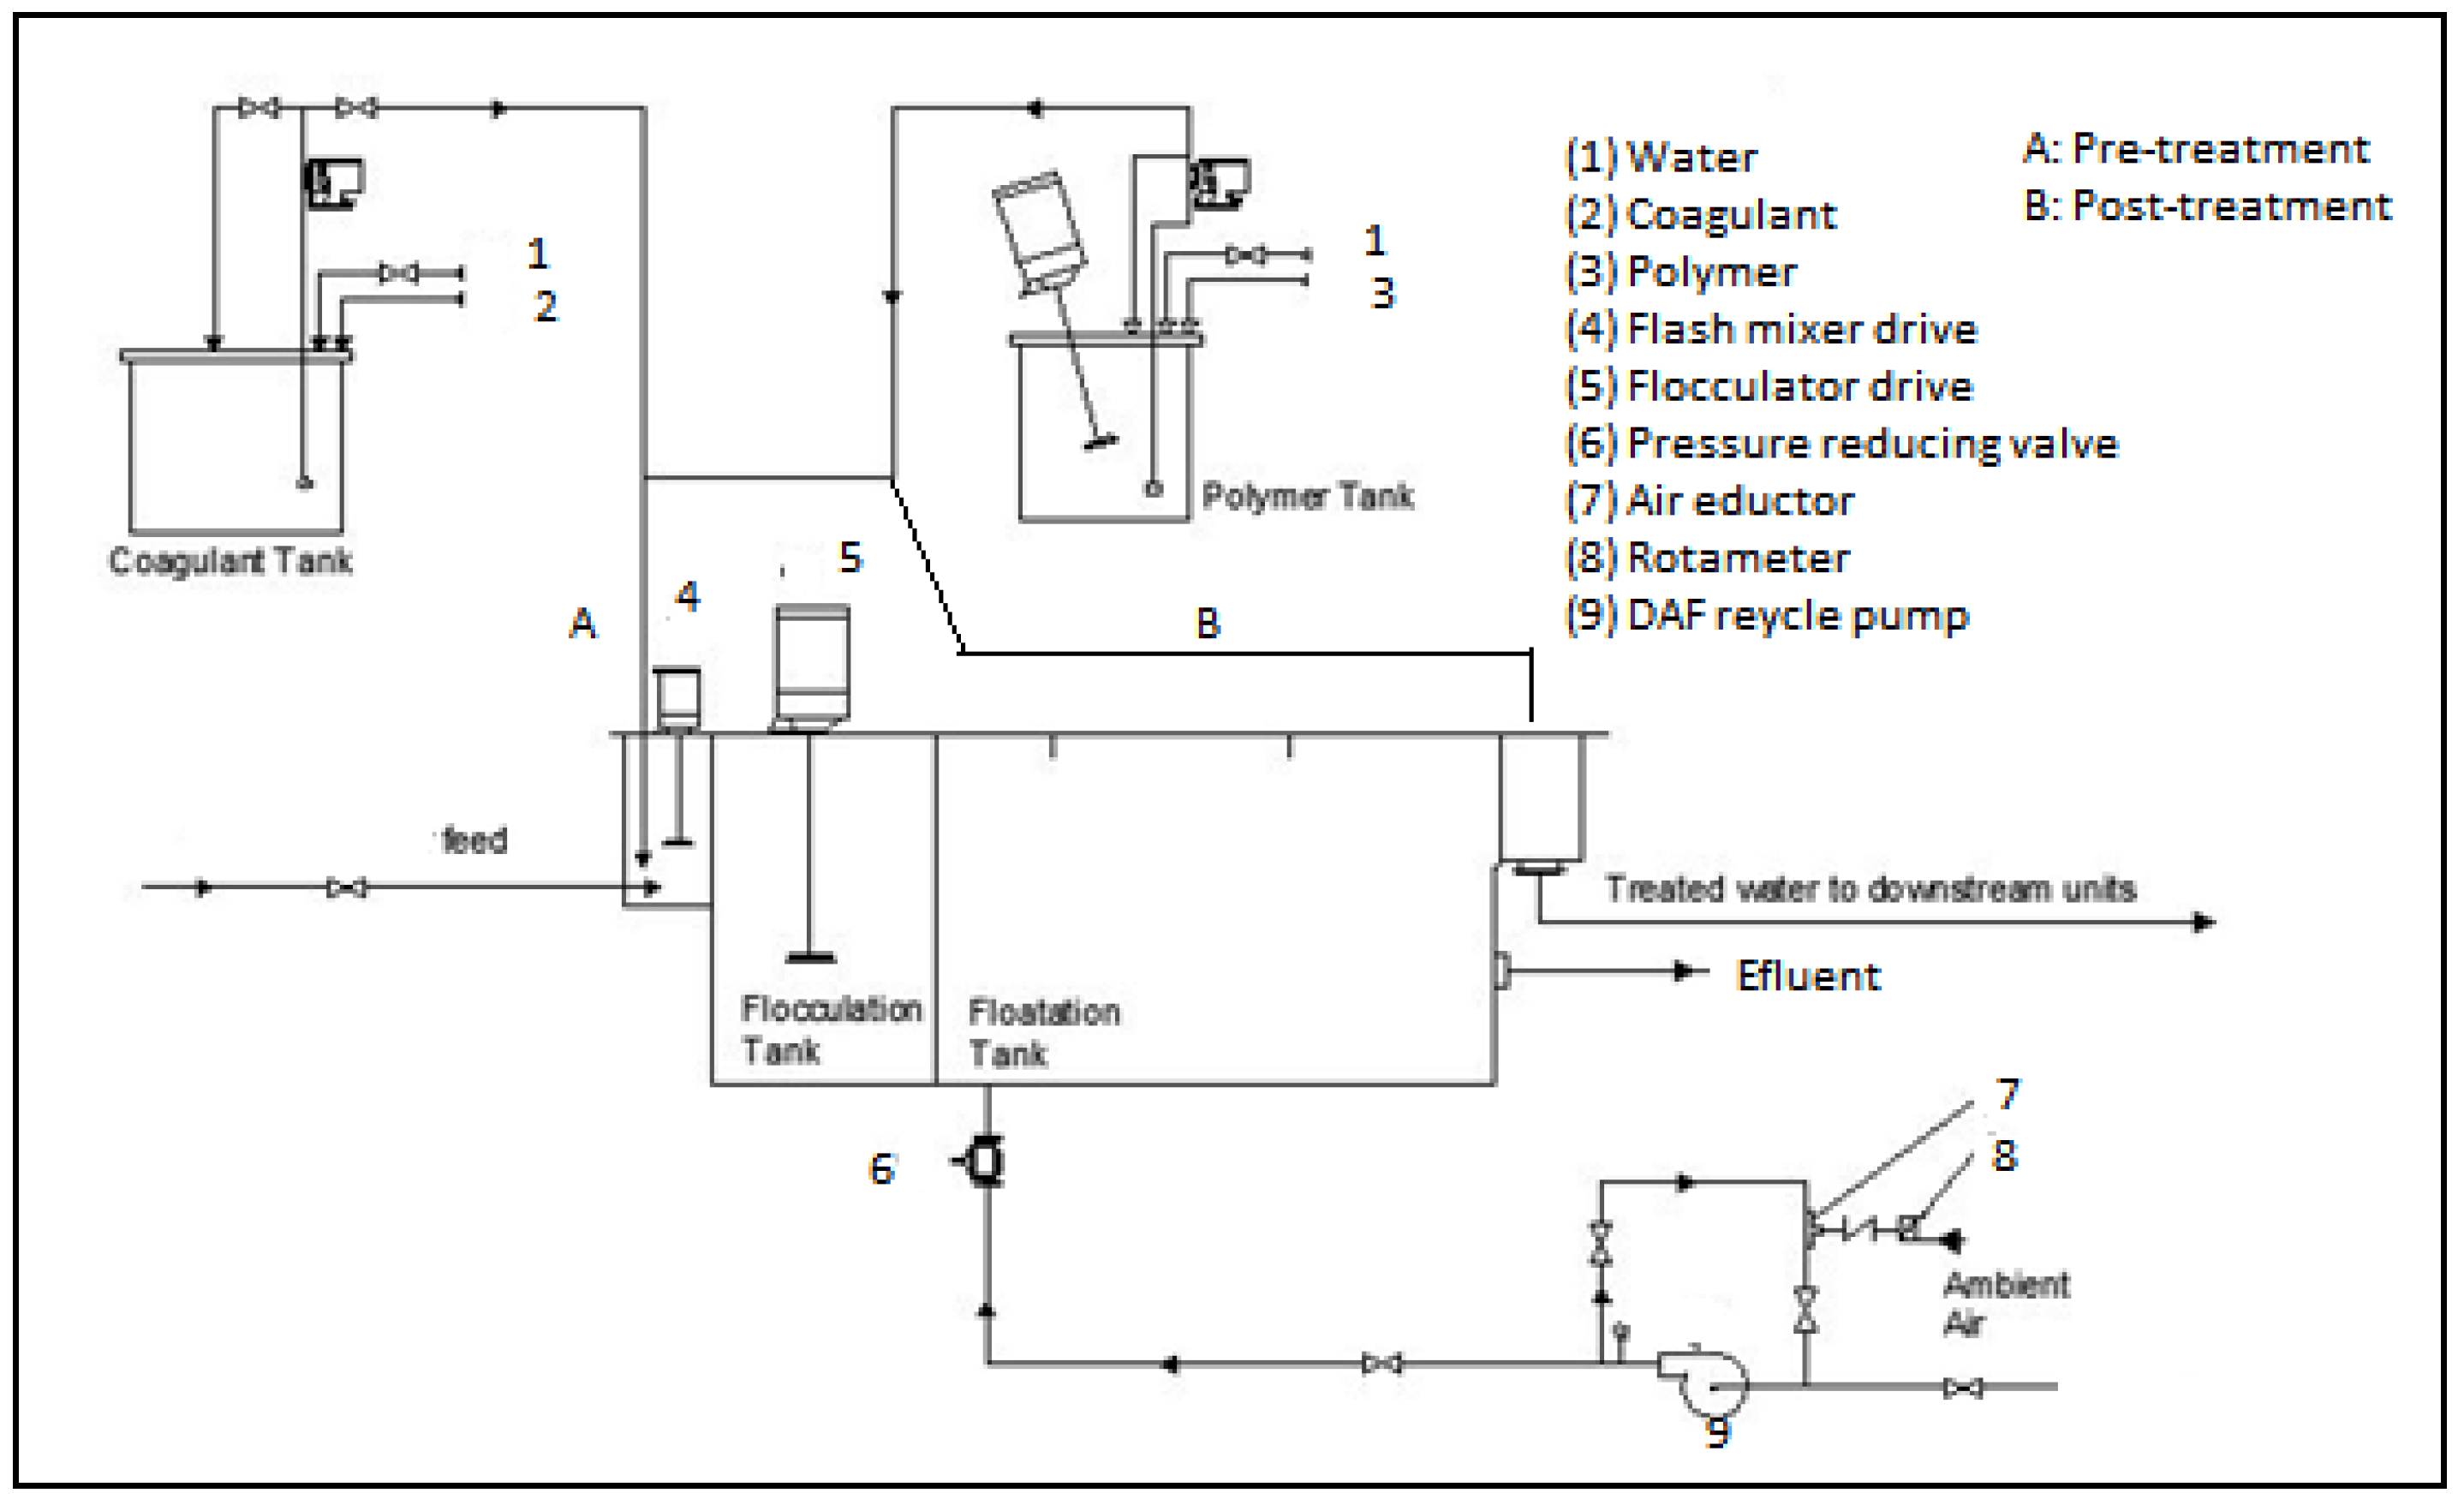
The DAF pilot plant (Figure 1) of 1 m3/h capacity was configured in two process streams: (A) acidification-coagulation and DAF (pre-treatment) and (B) acidification-DAF-coagulation (post-treatment). The system comprises a coagulation vessel, air saturator vessel and flotation compartment. Based on the experimental design and the specified coagulant type under investigation, the following steps were observed: (i) adjusting the pH to an acidic medium of 5, after which (ii) 50 mg/L of the coagulant was rapidly mixed (250 rpm) with the influent, then followed up with slowly mixing (40 rpm) in the coagulation zone. Lastly, in the air saturator vessel, the 15% volume of air–water ratio was saturated at a pressure of 400 kPa, where microbubbles were then injected into the flotation zone. Samples were then collected at the sampling point of the treated water for analysis after 15 minutes. This was repeated for the post-treatment, whereby coagulation (B) was introduced after the flotation zone.

2.3. Design of Experiments and Optimization

Three-level Box-Behnken design (BBD), being a second-order design, was employed to optimise the best configuration streams obtained after the preliminary study using alum. A total of 17 runs were used to evaluate the interactive effects of the independent variables such as coagulant dosage (50–150 mg/L), air–water ratio (10%–20 %) and air saturator pressure (300–500 kPa) on SOG, COD, TSS and turbidity removal. For easy interpretation of the statistical computation and modelling, the independent variables and responses were denoted as A, B and C, respectively. Table 1 presents the design matrix with three levels representing low (-1), medium (0) and high (+ 1). These ranges were selected, partly based on previous studies done on coagulation [23]. Design Expert software (version 11.1.2.0, Stat-Ease Inc., Minneapolis, USA) was used to design the experimental runs, analyse and model the data obtained. The responses (Y1, Y2, Y3, and Y4), are presented by second-order polynomial equations which correlate the response surface. This serves as the basis to fit the experimental data and determine the significant response model terms, as expressed in Equation (1)
Y = β 0 + i = 1 n β i x i + i = 1 n β i i x i 2 + i = 1 n = 1 j = i + 1 n β i j x i x j + ε
where β0, βi, βii , βij and X i X j represent coefficients of the intercept, linear, quadratic, interaction and independent variables, while Ɛ is the residual error connected to the experiments. The removal efficiency (% removal) was calculated using Equation (2)
%   removal = ( C 0 C C 0 ) × 100 %
where CO and C = COD, TSS, turbidity and SOG contents of ORW before and after coagulation treatment, respectively.

3. Results

3.1. DAF Configuration Performance

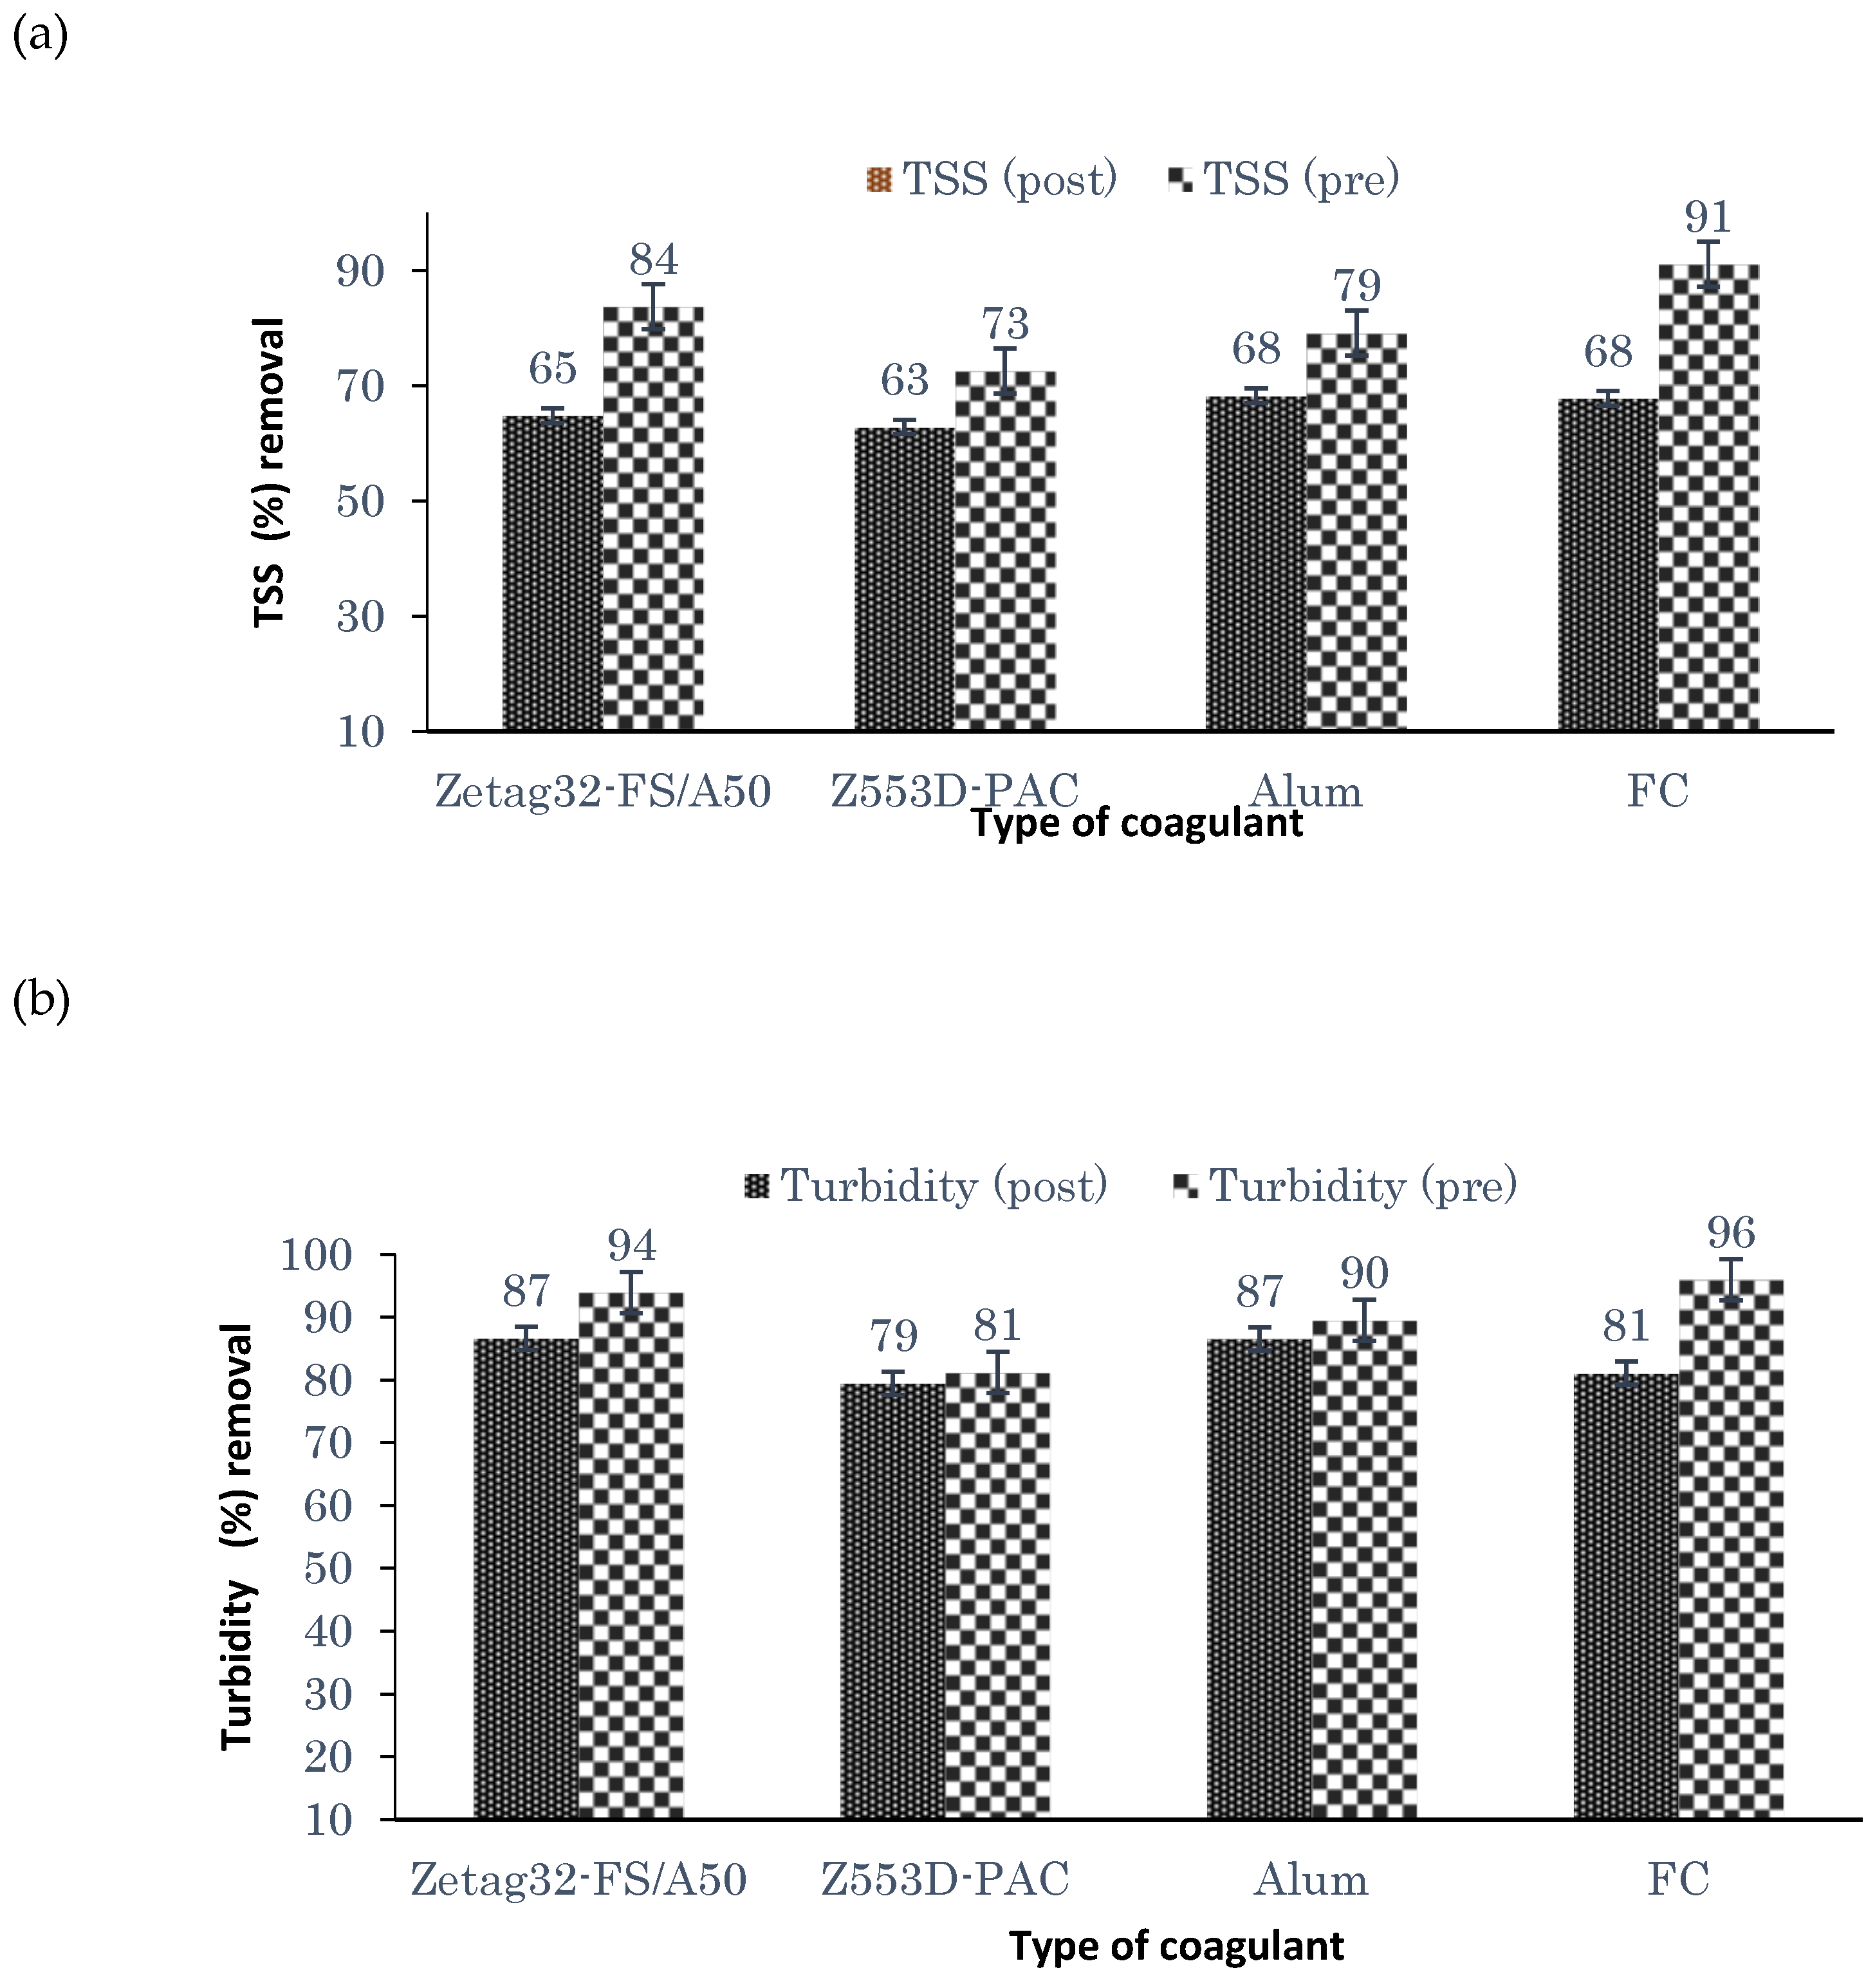
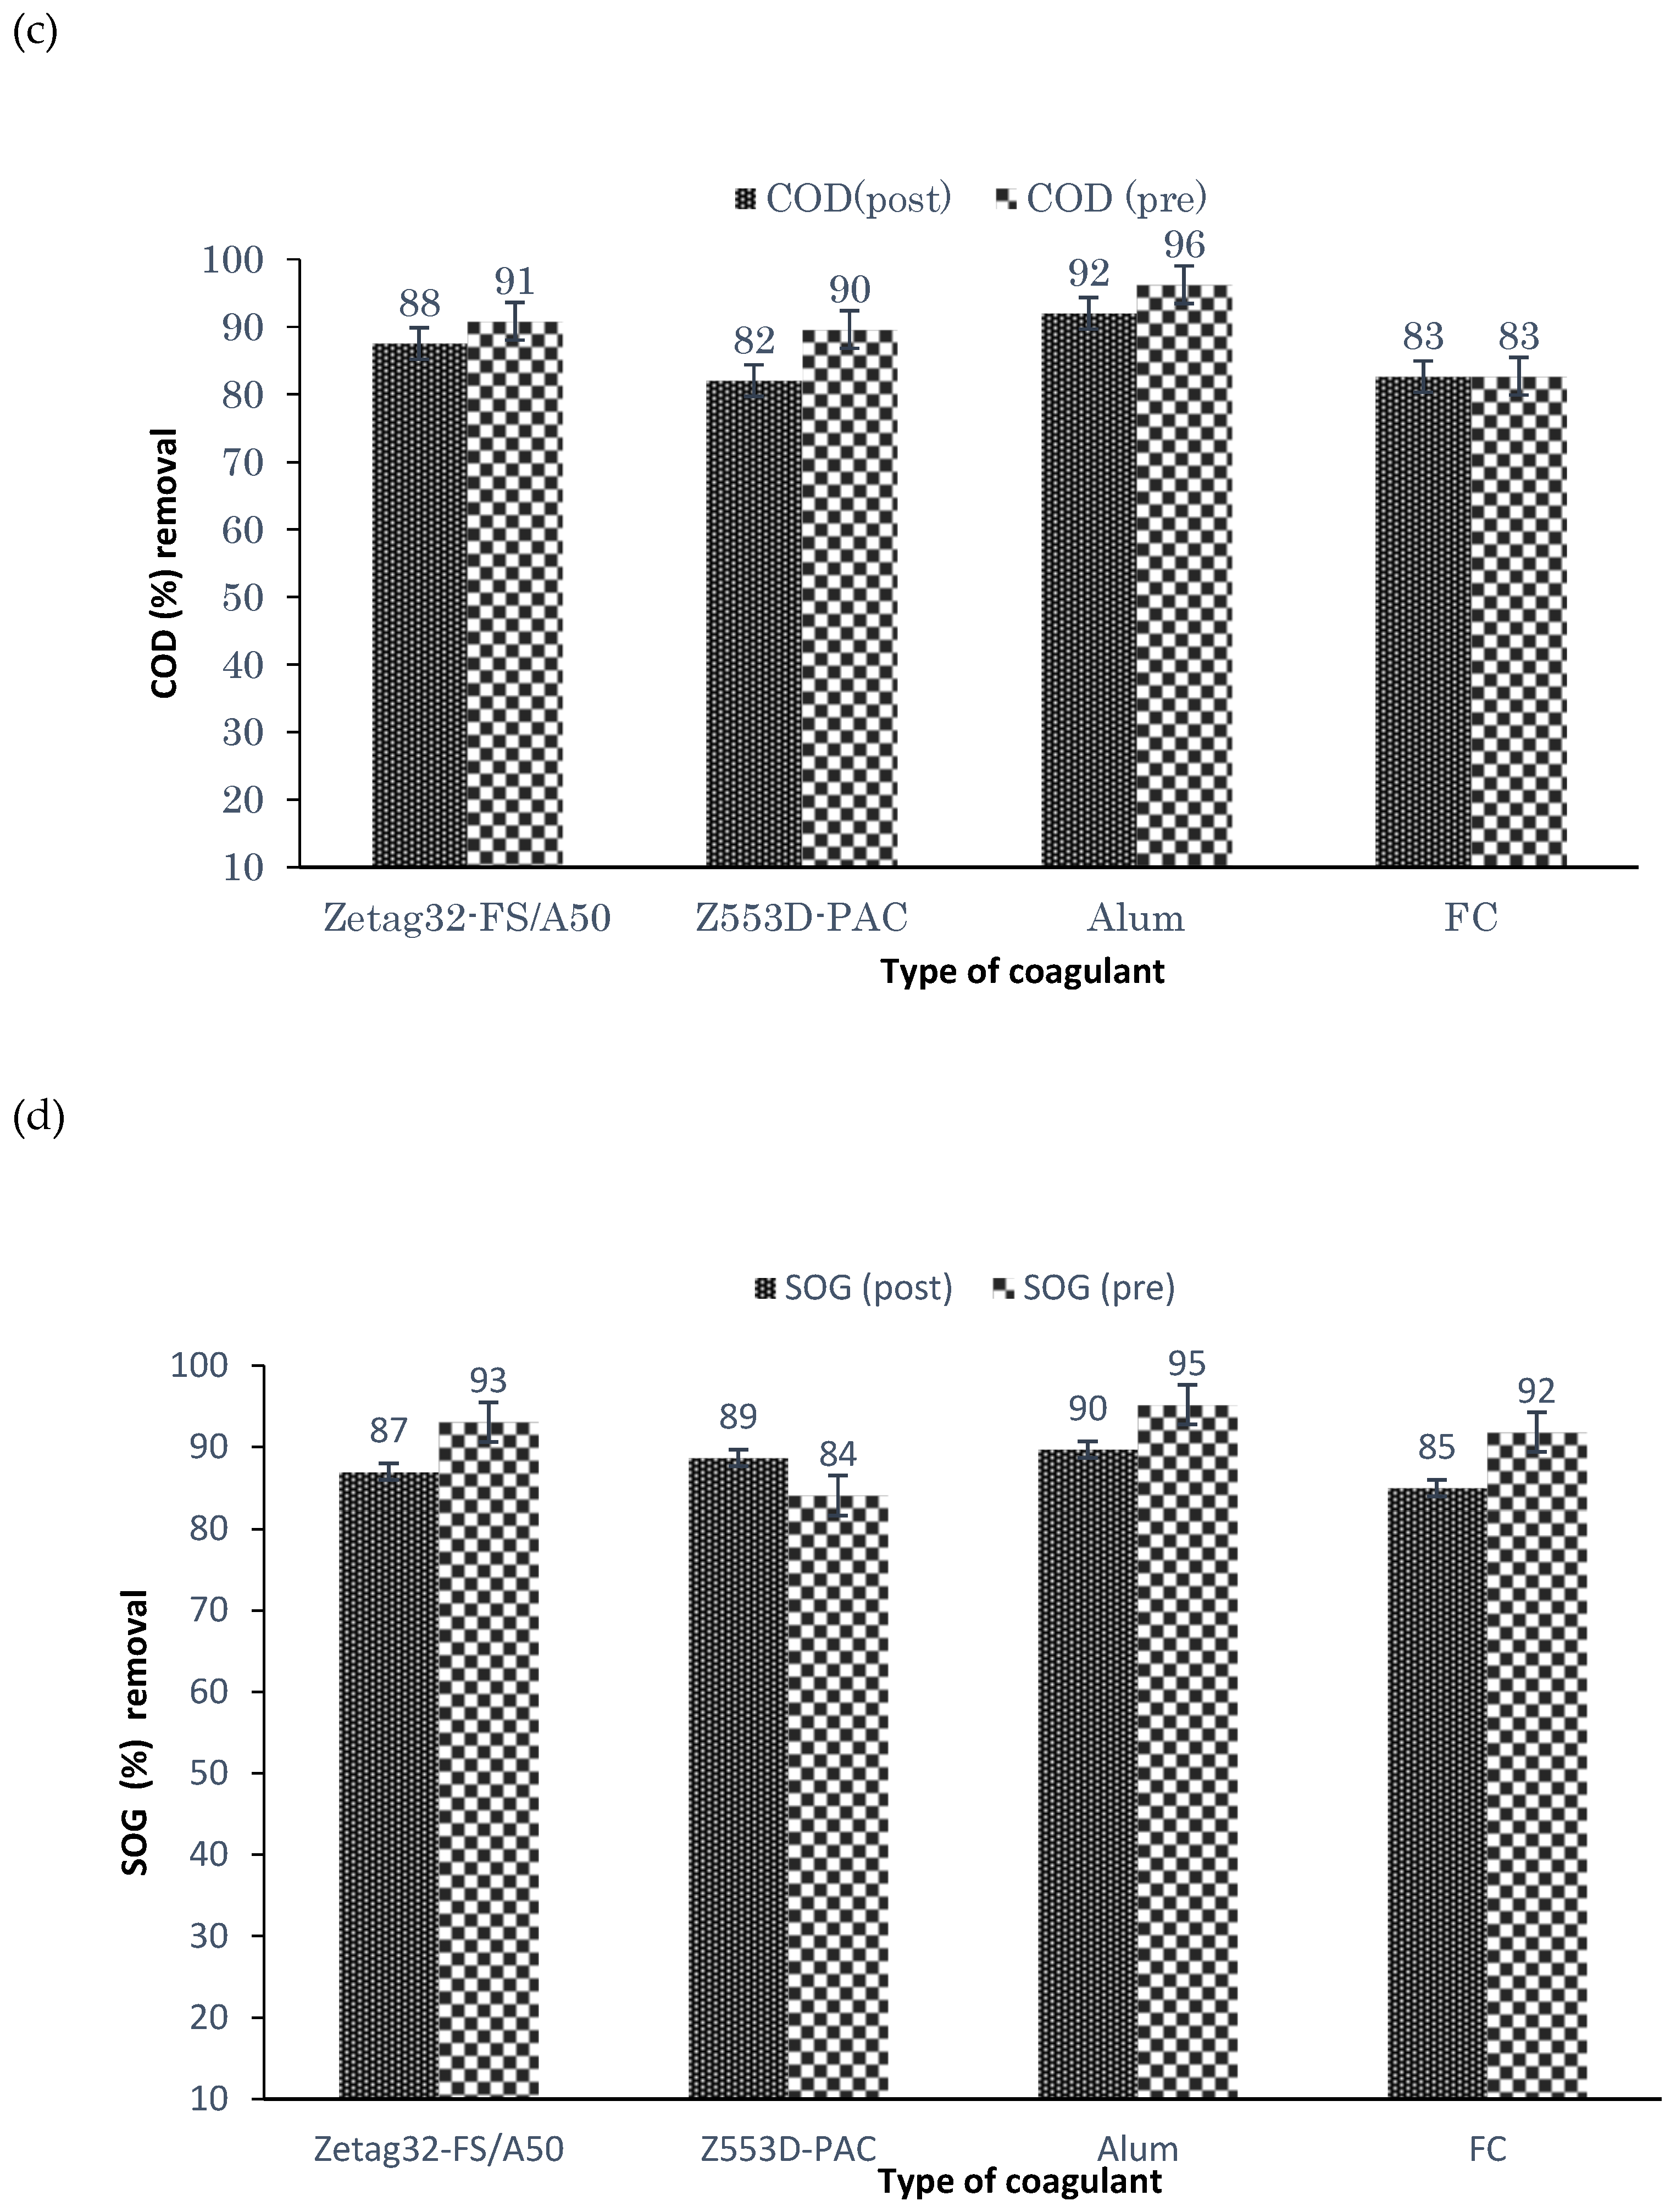
The results, presented in Figure 2a–d, show a comparison between the pre-and post-treatment of the DAF with the four aforementioned coagulants. It was deduced that the pre-treatment was more effective (with a difference of about 15%) than the post-treatment, thus all the coagulants applied before the DAF were seen to be more effective for the removal of the residual contaminants under study. This demonstrated that coagulation preceding DAF improved the DAF performance.

3.2. Response Surface Methodology

The BBD matrix presented in Table 2, was used to investigate the effect of the coagulant dosage (A), air saturator pressure (B) and air–water ratio (C). A total of 17 experimental runs were carried out, using alum as the destabilising coagulant for the oil droplets at pH 5. The mean COD, SOG, TSS and turbidity removal recorded were 94%, 92%, 98%, and 93%, with their respective standard deviations of 136% 167%, 69%, and 121%.

3.2.1. Model Equations and Analysis of Variance (ANOVA)

The ANOVA results for the reduced quadratic models for COD (Y1), SOG (Y2), TSS (Y3) and turbidity (Y4) removal are presented in Table A1, Table A2, Table A3 and Table A4. The ANOVA shows that all the independent variables were significant (p < 0.05) for determining COD, SOG, TSS, and turbidity. The models for COD, SOG, TSS, and turbidity percentage removal selected were not aliased. However, model modification was performed to improve their predictability by using the adjusted R2 as the reduction criterion. The reduced quadratic models generated by the Design Expert software for all the four responses (COD, SOG, TSS and turbidity) were coded as Y1, Y2, Y3 and Y4, respectively, and are presented in Equations (3) to (6). The model terms, being the independent variables, were also coded as A, B and C, respectively, for coagulant dosage, pressure and air–water ratio.
Y 1 = 94.33 0.56 A + 1.13 B 0.162 C + 0.66 AB + 0.88 A C + 1.49 B C + 0.458 B 2 0.539 C 2
Y 2 = 91.27 + 0.673 A + 0.198 B 1.41 C 1.36 A C 0.33 B C + 0.669 A 2 1.05 B 2 + 1.24 C 2
Y 3 = 98.37 + 0.12 A 0.48 B + 0.265 C + 0.25 AB 0.705 A C 0.705 B C 0.42 C 2
Y 4 = 93.91 0.758 A + 1.14 B + 0.316 C + 0.547 A C + 0.95 B C 0.336 A 2 + 0.591 B 2 0.296 C 2

3.2.2. Numerical Optimisation

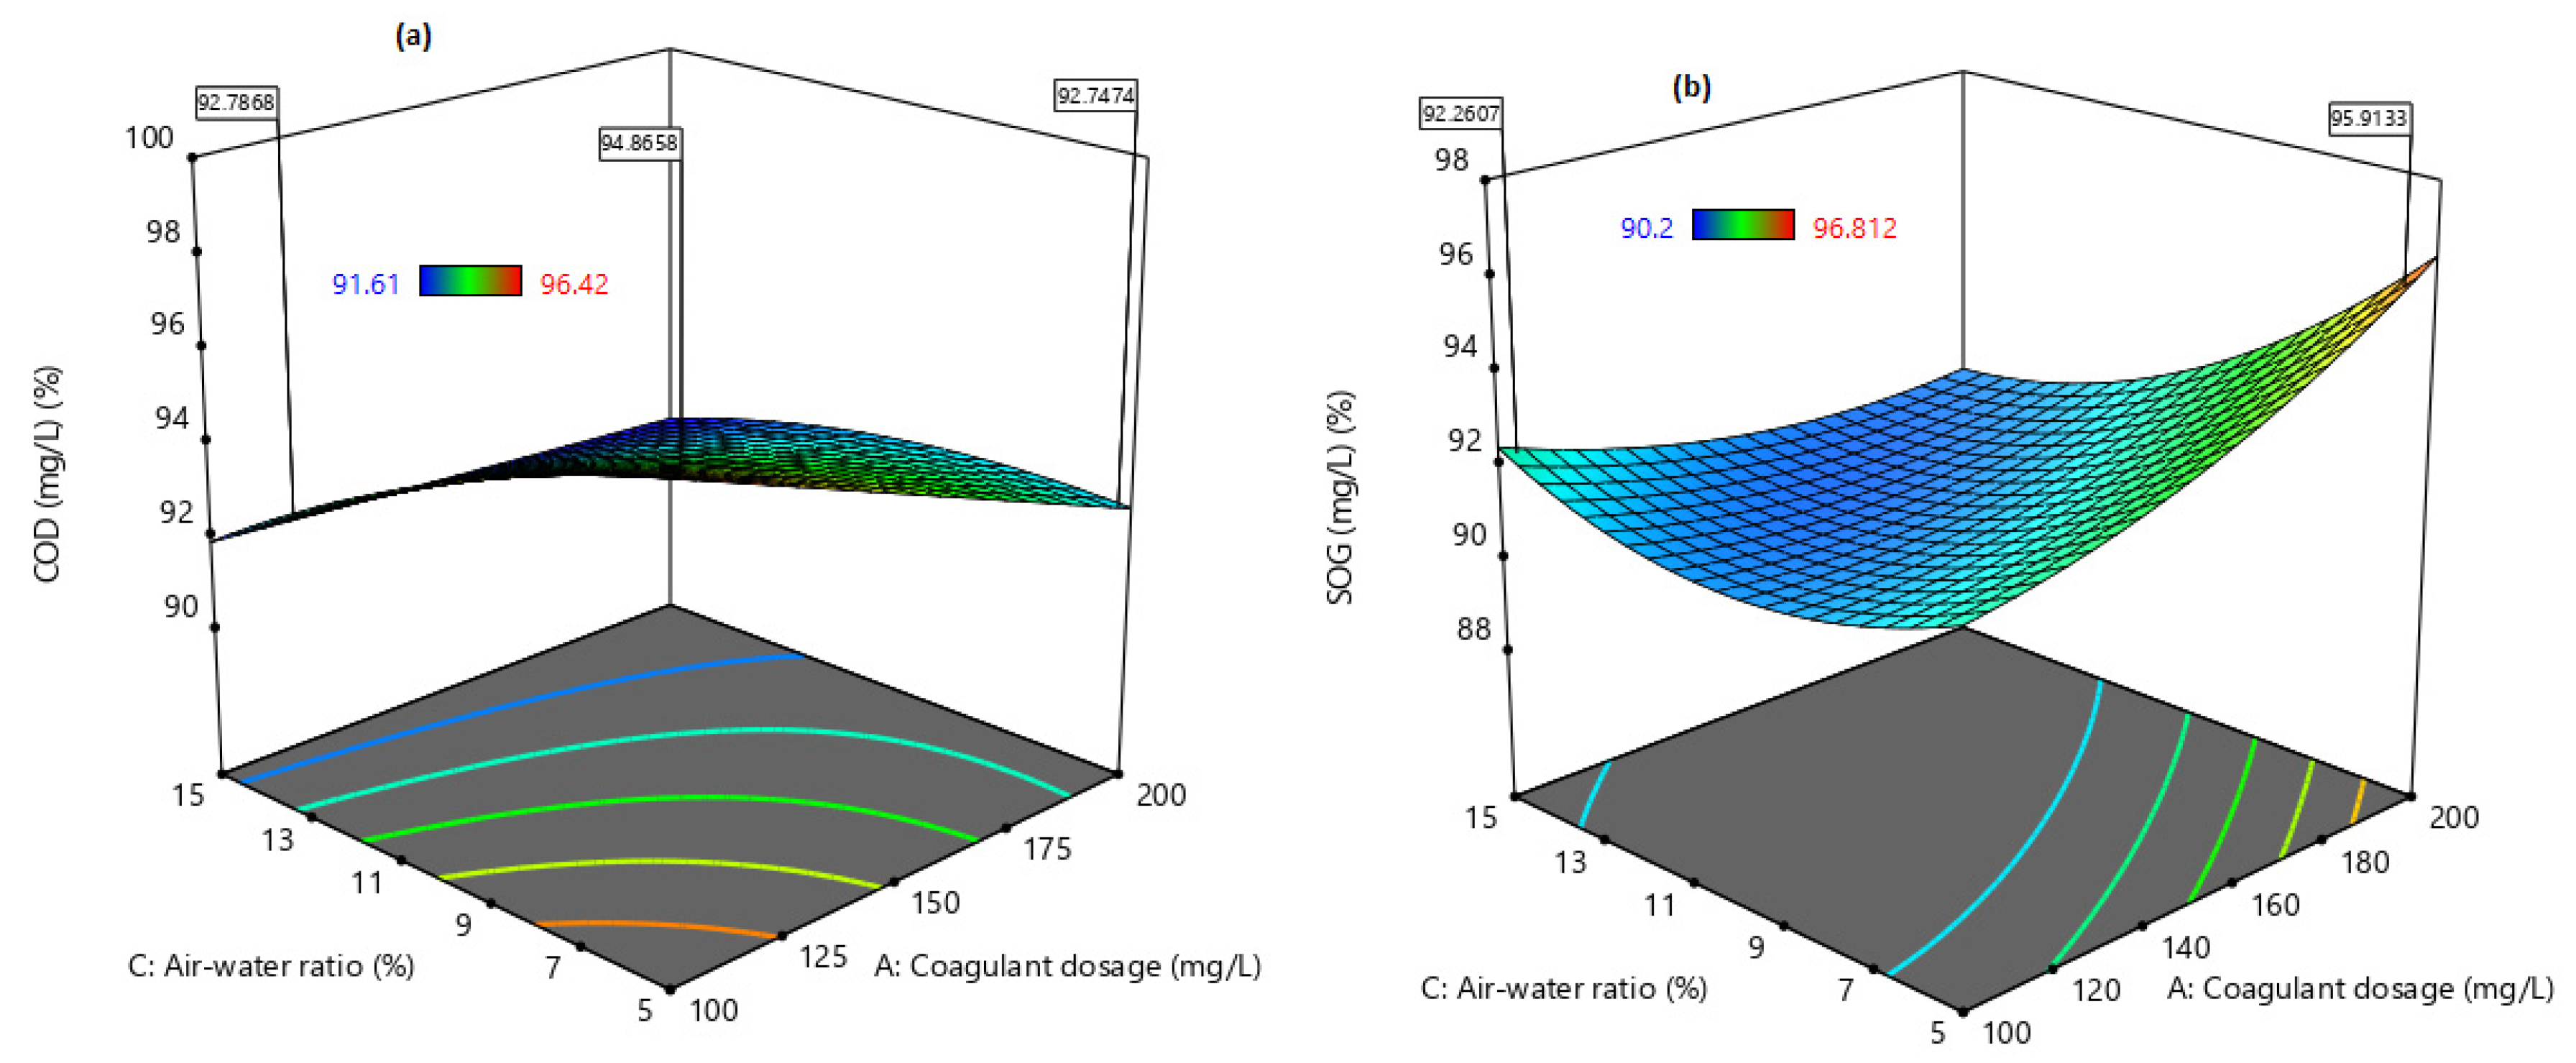
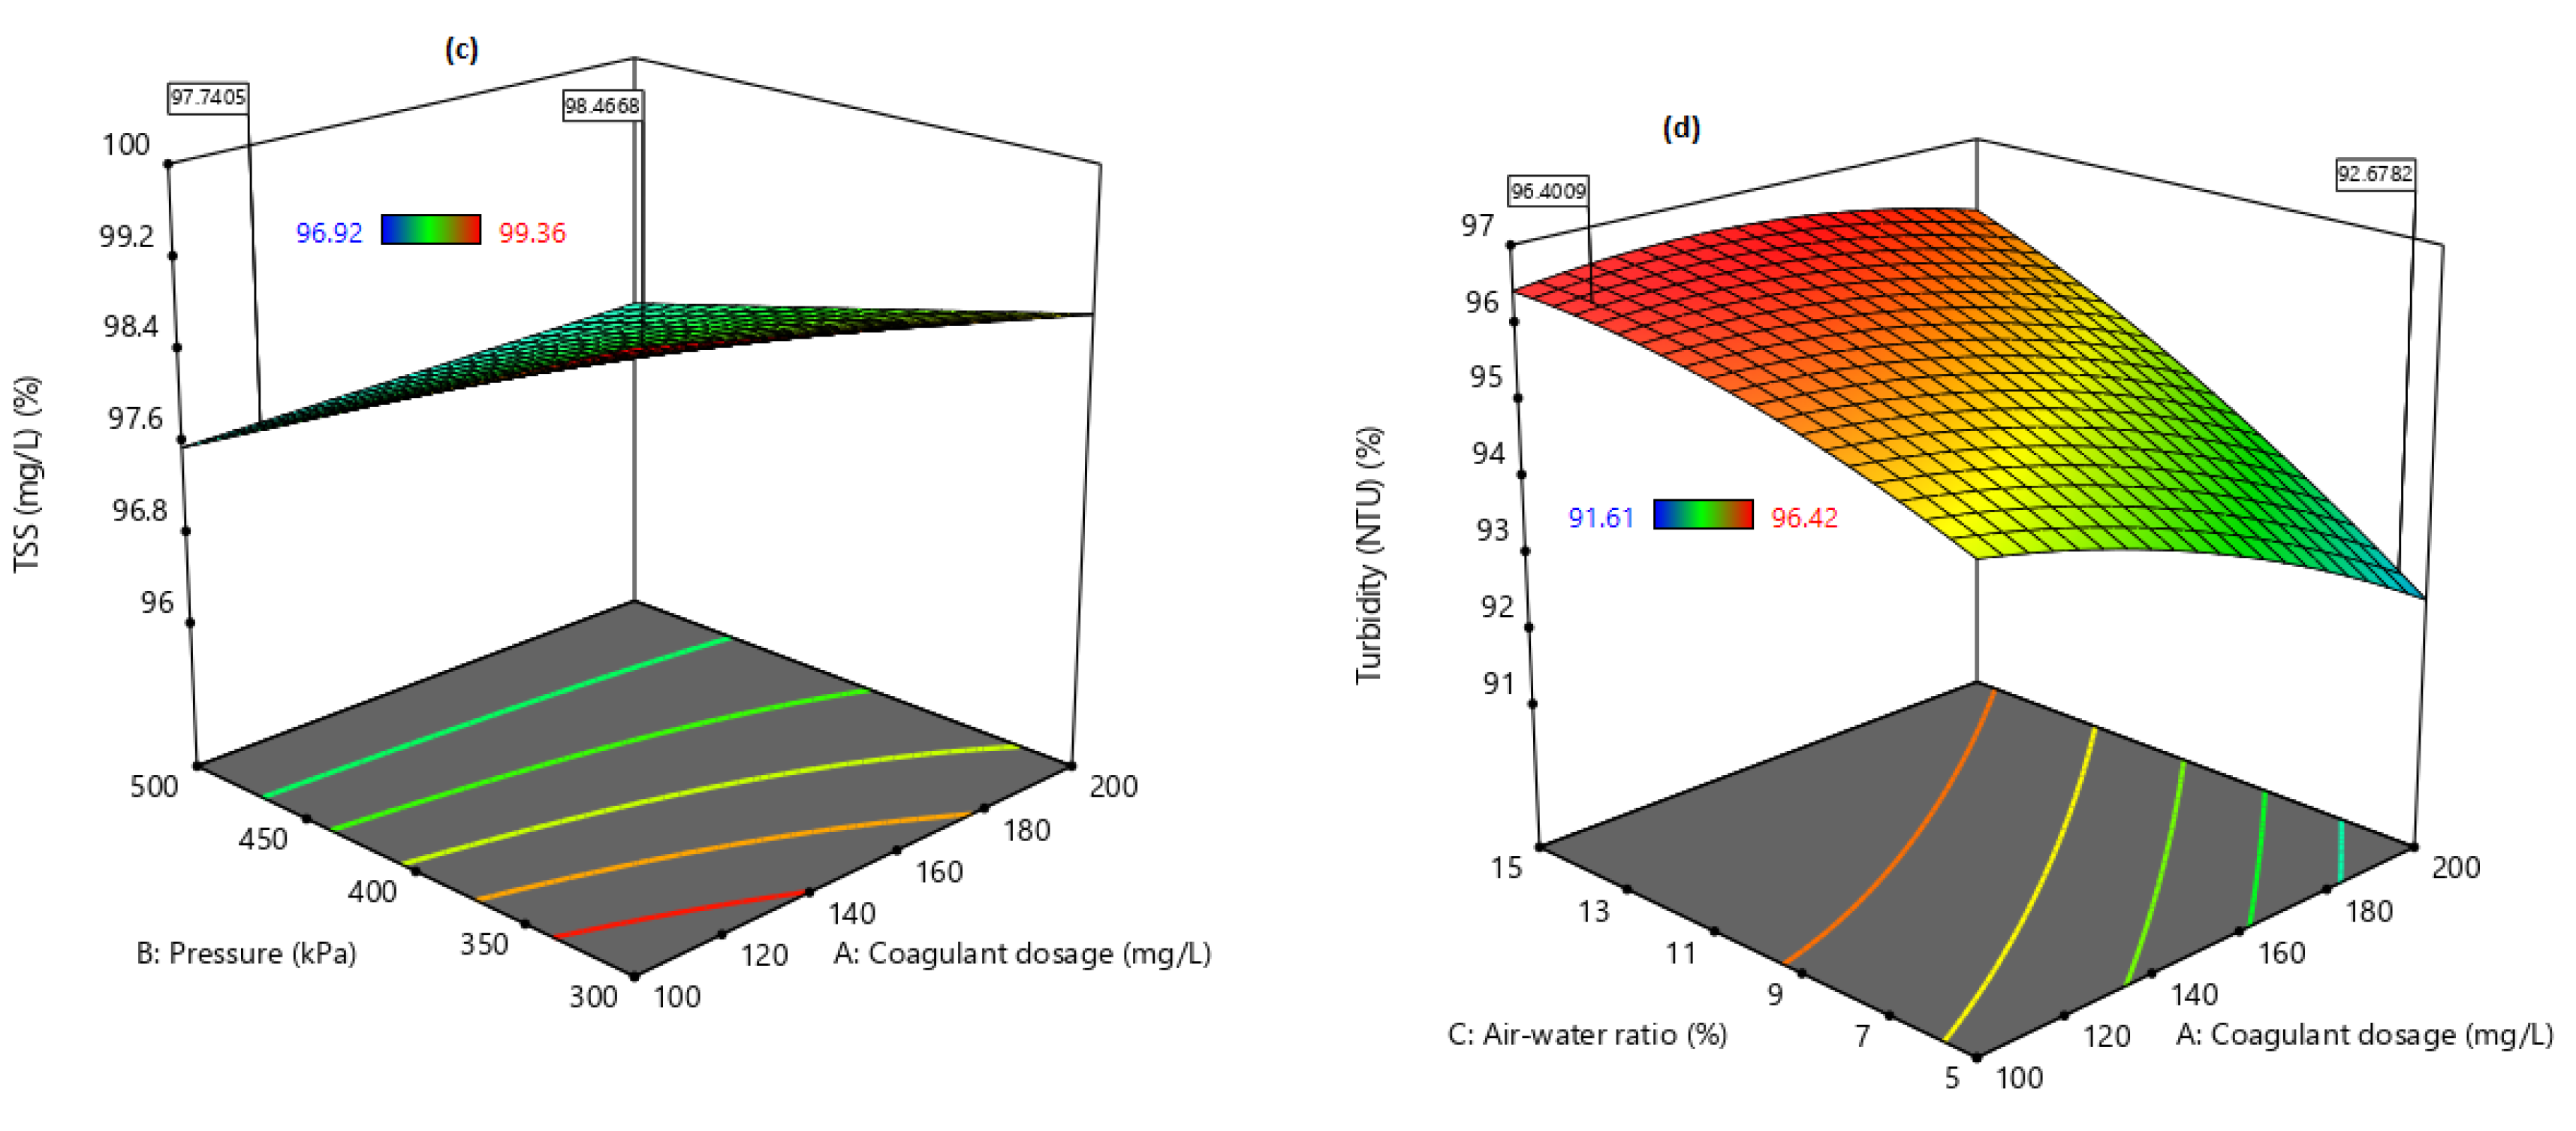
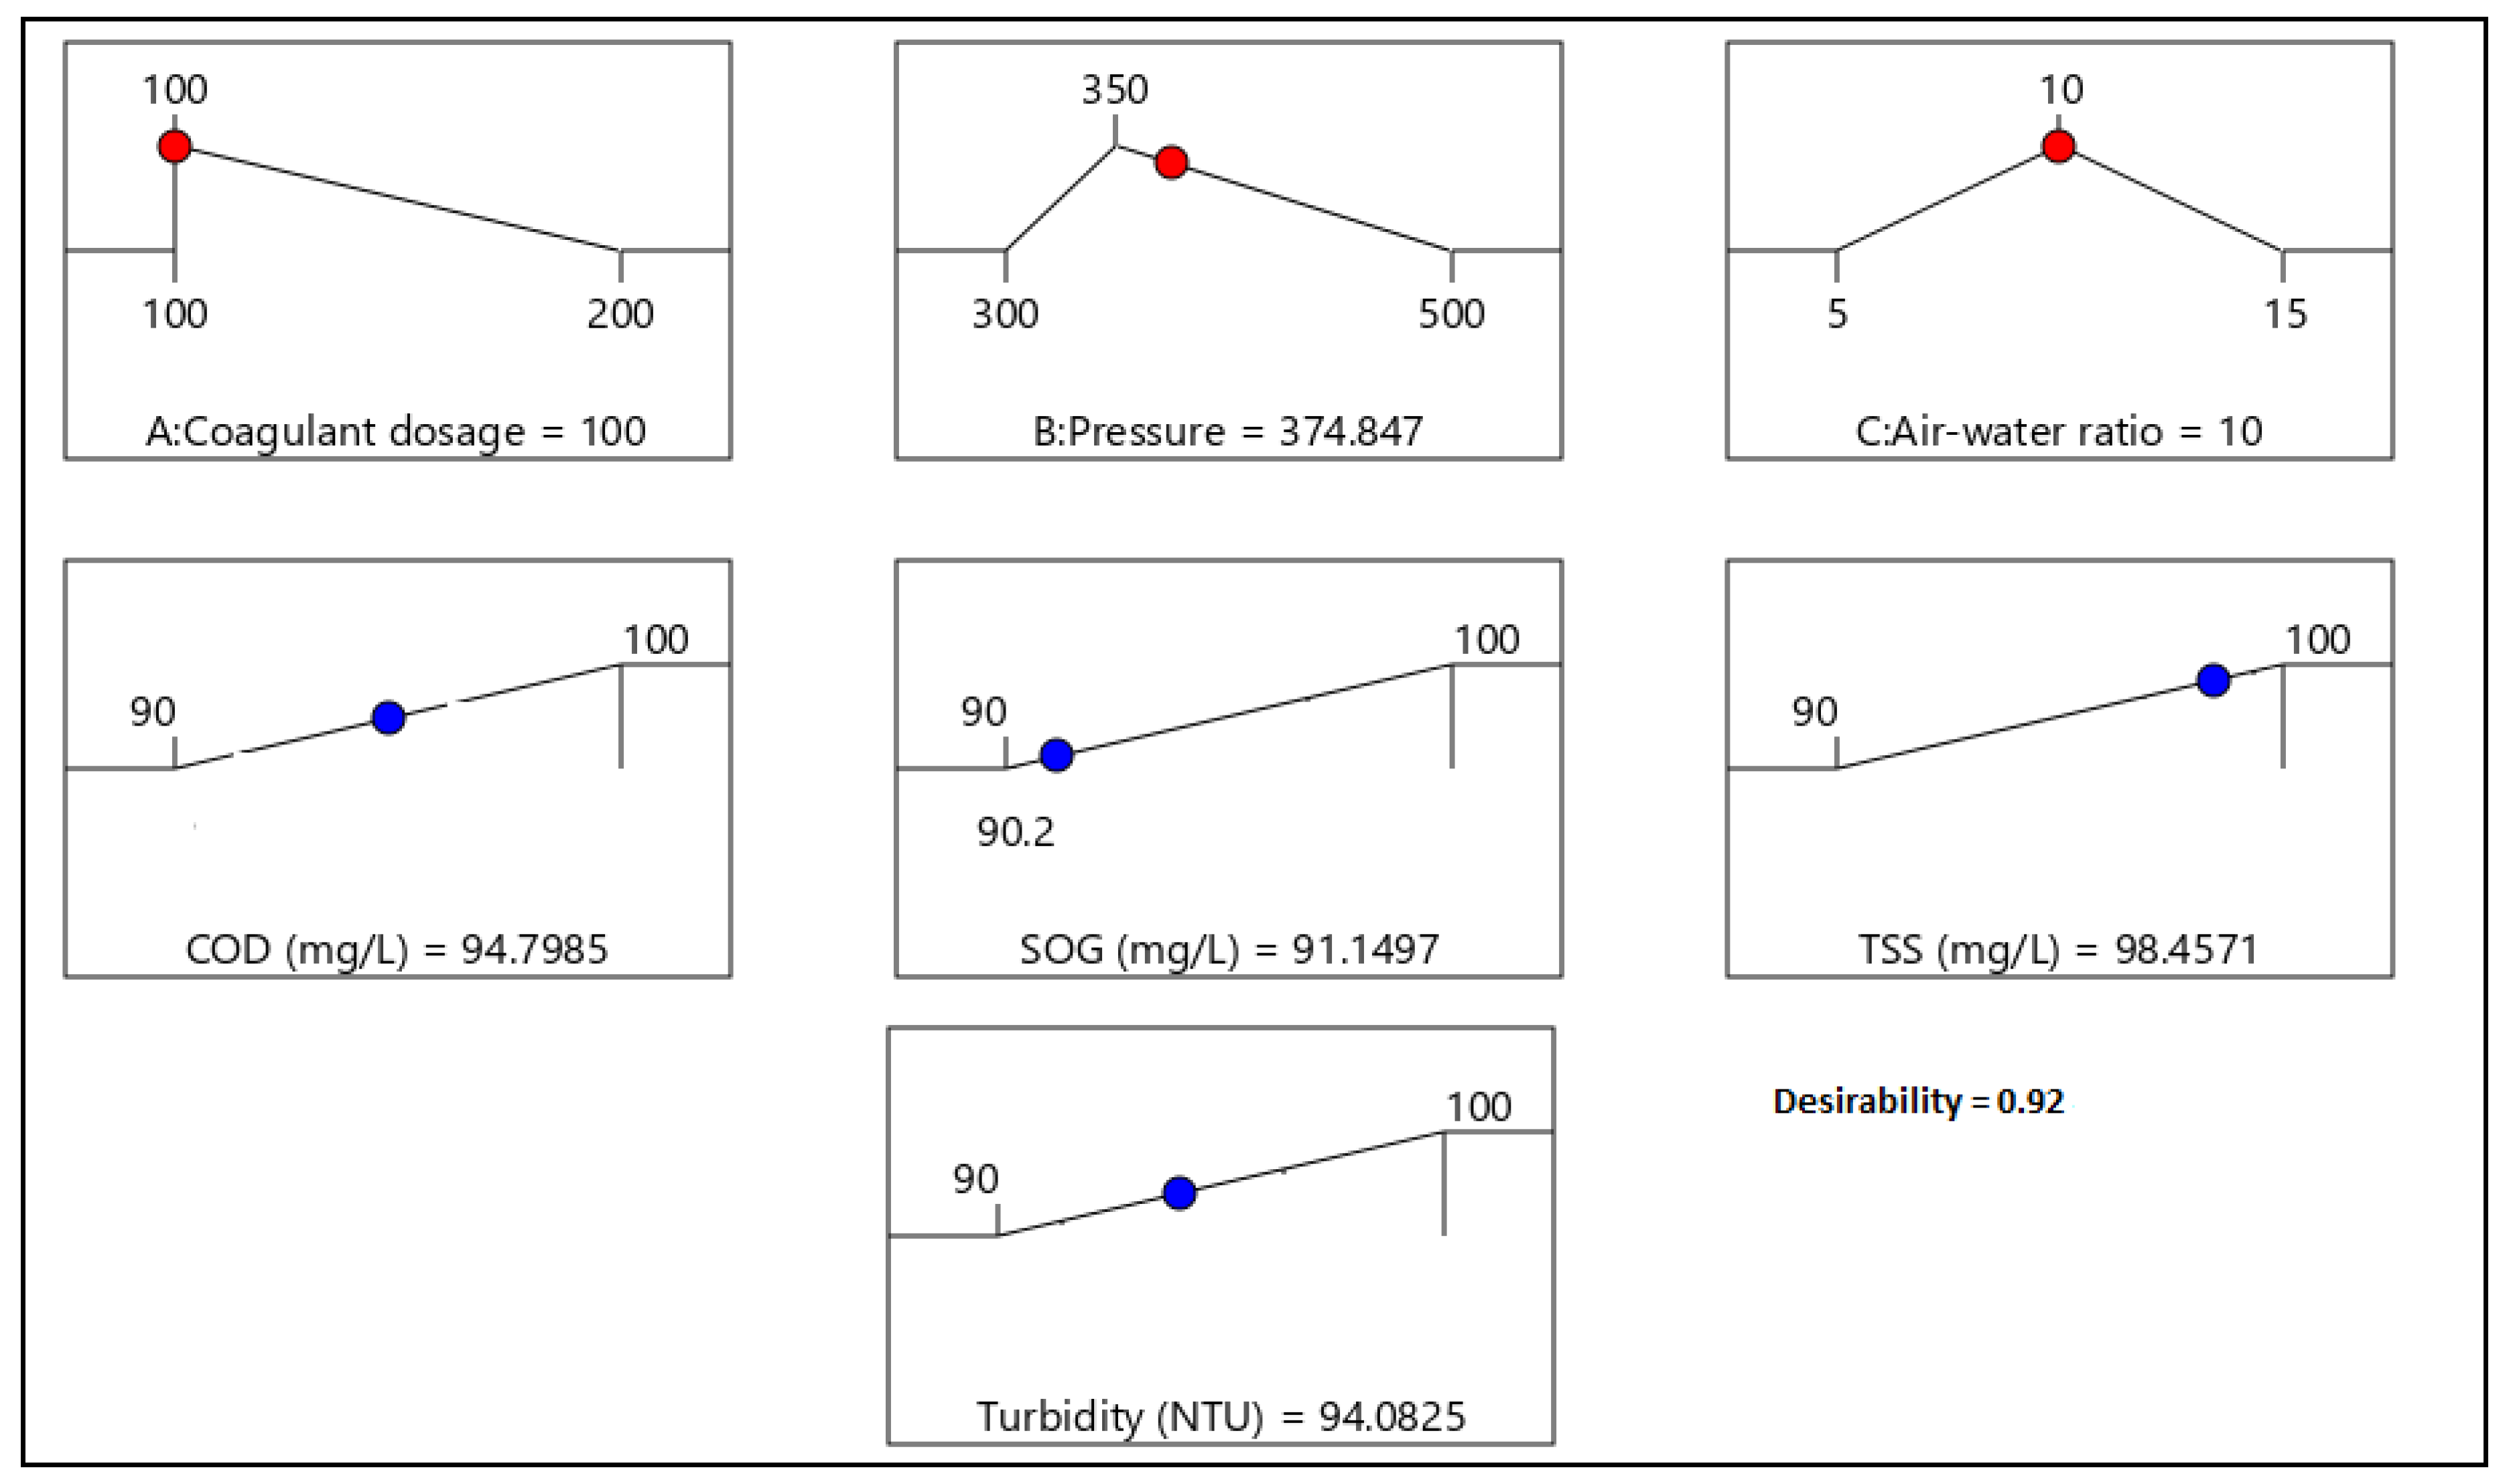
Three-dimensional (3D) representations of the interactive relationship between the independent variables and the responses are shown in Figure 3 and Figure 4. The two most significant factors, which are of interest, were varied along the design space, while the other factor was kept constant. This was based on the level of sensitivity of the variables towards the responses from the perturbation plots (Figure A1, Figure A2, Figure A3 and Figure A4). Numerical optimisation was then employed to determine the optimal conditions for the combined coagulation–DAF conditions to maximise the COD, SOG, TSS, and turbidity removal. The variable goals were set to be within the range of the design space, while the responses were set to “maximise”, with upper and lower limits of 100% and 90%, respectively. Figure 5 shows the optimised ramp plot (with a response desirability of 95%) based on the aforementioned conditions. The summarised result is presented in Table 3.

4. Discussion

4.1. DAF Performance

The performance of DAF coupled with coagulation was evaluated for the treatment of ORW. For this purpose, coagulation-DAF (pre-treatment) was compared with DAF-coagulation (post treatment), by investigating four different types of coagulants (Z553D, Zetag-FS/A50, FS, and alum). Similarly, introducing the saturated air into the flotation cell generated microbubbles, which was the driving force of the agglomerated oil droplet flocs [7,9]. At a saturation pressure of 400 kPa, the released of the dissolved air into the flotation zone resulted in the oil droplets being entrapped by the microbubbles [7]. This increased the buoyance force and the velocity of the flocs to the top surface, leaving the water below clear [17,19]. The addition of the coagulants flocculated and coalesced the oil droplets via neutralisation due to the ionic difference [7]. A similar trend was observed at a dosage of 50 mg/L for the coagulants used, to enhance the DAF process in the two configurations studied. The residual SOG, COD, TSS, and turbidity, respectively, were decreased to 62, 969, 89 mg/L, and 316 NTU during the pre-treatment configuration. Likewise, the post-treatment decreased the residual SOG, COD, TSS and turbidity to 197, 2181, 265 mg/L, and 462 NTU respectively.
The flocculated oil droplet size was seen to increase when trapped with the air bubbles; this relatively increased the rising up of the agglomerated flocs, as reported by [7,9]. As shown in Figure 2a,b, the removal efficiency of the coagulant for TSS (73%–91%) and turbidity (81%–96%) were FC > Zetag32-FS/A50 > Alum > Z553D-PAC for the pre-treatment configuration. Figure 2c shows COD removal (83%–96%) with FC being the least, leaving the reduction order as Alum > Zetag32-FS/A50 > Z553D-PAC > FC. In terms of the SOG removal (84%–95%), the removal efficiency was observed as Alum > Zetag32-FS/A50 > FC > Z553D-PAC, as depicted in Figure 2d.
Among the coagulants, Alum was found to be most effective for the treatment of the high-organic contaminants, viz. COD and SOG, while FC was found to be most effective for the physical parameters (TSS and turbidity). It appears that, for coagulation with the cationic coagulants, the interfacial characteristics of the oil–water were saturated with ionic charges, which influenced the rate of oil droplet–air bubble contact in the flotation zone [3]. The polymeric coagulants (Zetag32-FS/A50 and Z553D-PAC), though promising, needed to be continuously homogenised in the system, which was more or less a setback. According to Zouboulis and Avranas [24], polyelectrolytes used as flocculants have a low affinity for reformation whenever the flocs are disrupted with undeserved turbulence, or even if the turbulence is reduced. Therefore, based on the SOG removal efficiency, Alum was considered as the best coagulant, which was then used to investigate the operating conditions for the pre-treatment of the ORW using RSM. The increase in alum dosage from 50 to 100 mg/L dissociated into more trivalent ions, which increased the charge neutralisation of the oil droplets [24,25]. The floc formation increased the bubble–oil droplet attachment during the DAF process [17]. The increase in the air–water ratio above 10% vol/vol had no significant impact on the SOG residual removal, which was less than that reported by Zouboulis and Avranas [24].

4.2. Response Surface Methodology

Randomisation was used as an effective way of avoiding the possibility of bias in the treatment and measurement of outcomes for second-order analysis [26]. Positive and negative signs before the coefficient of the linear terms present synergetic and antagonistic effects on the empirical models. Equations (3)–(6) can be used to make predictions about their responses for specified levels of each factor. In that case, the factor is high and low levels must be coded as + 1 and −1, respectively, within the designed space. Consequently, the coded equations are useful for identifying the relative impact of the factors by comparing the factor’s coefficients [26]. Considering the increasing order of the response with respect to the coefficient interactive effects of the factors, the % COD removal was found to be BC > AC > AB, while BC > AC only for % SOG removal. In terms of % TSS removal, the order was AB > AC > BC, and % Turbidity removal as BC > AC.
ANOVA statistical analysis, in addition to the coefficient of determination (R2), was used to verify the quality of the models. The statistical significance for each of the regression models are presented by the R2 values, which were 0.945, 0.9886 0.9883, and 0.9727 for Y1, Y2, Y3, and Y4, respectively. The predicted R2 values were in good agreement with the adjusted R2 values with a difference of less than 0.2. This implies that the correlation between the predicted and experimental results were reasonably high. The adequate precision, which is a measure of the signal to noise ratio values, was also greater than four, which implies that the models can be navigated within the design space. The standard deviations for the models were 0.3065, 0.2407, 0.0994, and 0.283 for Y1, Y2, Y3, and Y4, respectively. As shown in Table A1, Table A2, Table A3 and Table A4, the correlation variability (CV %) was also attributed to the empirical model predictions.
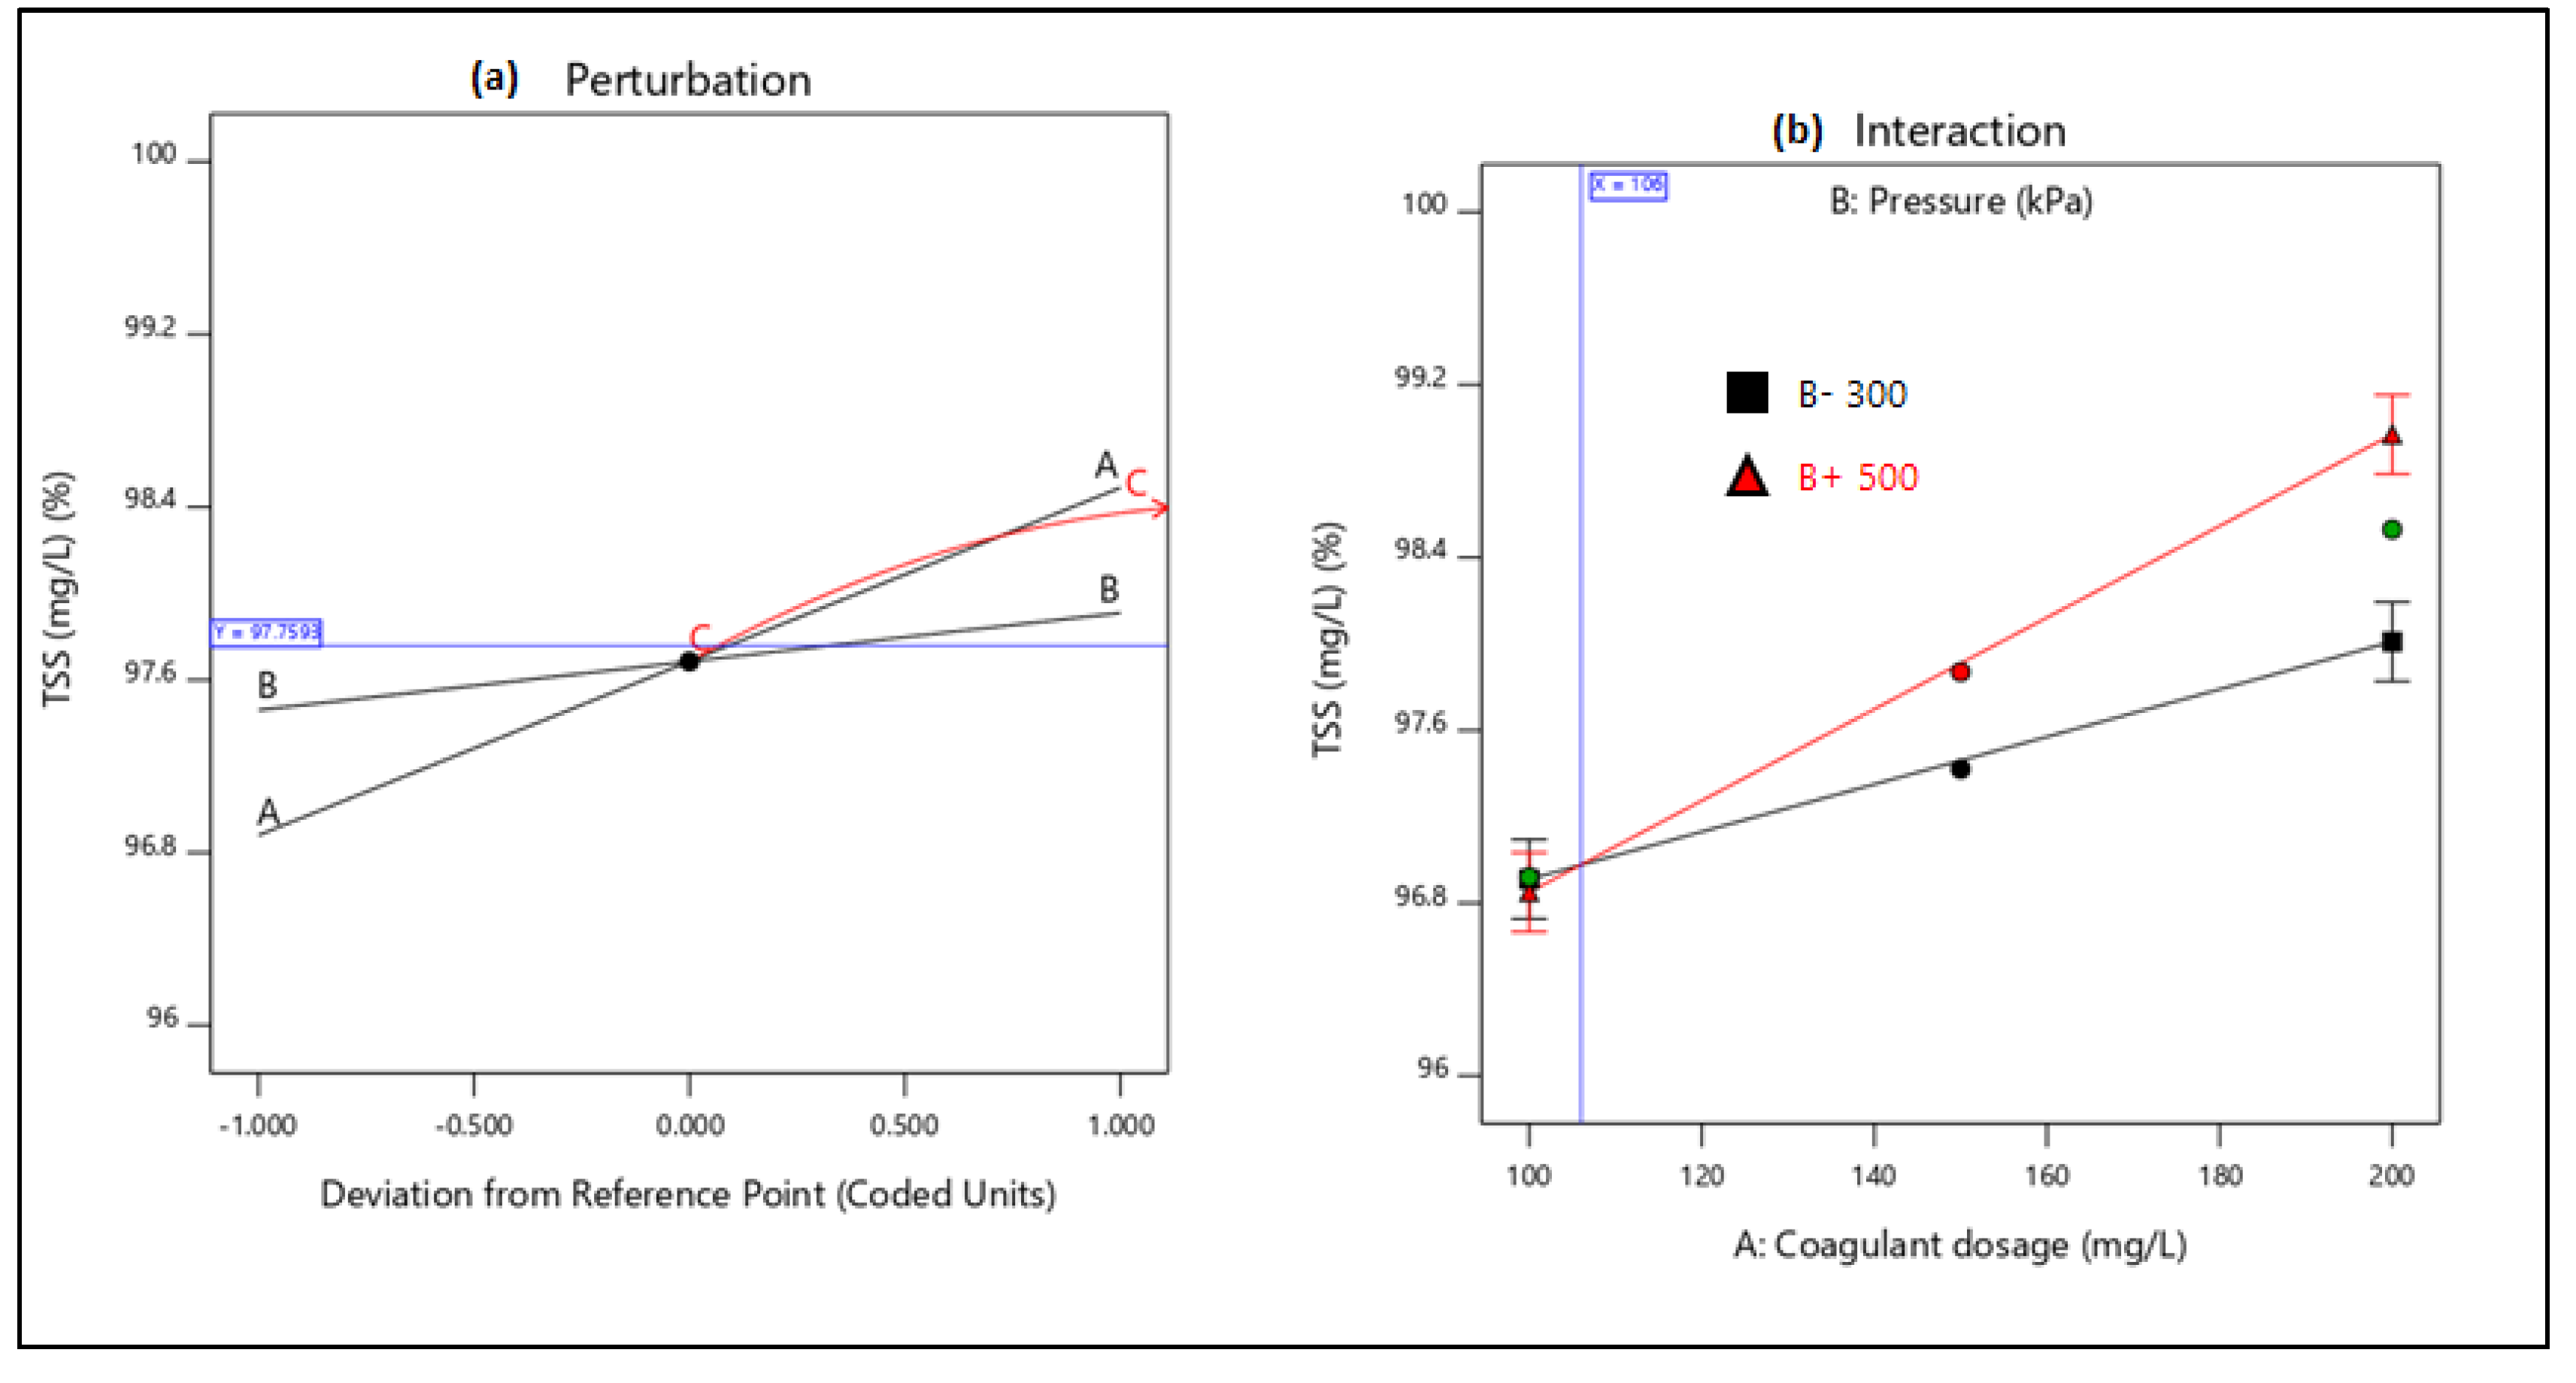
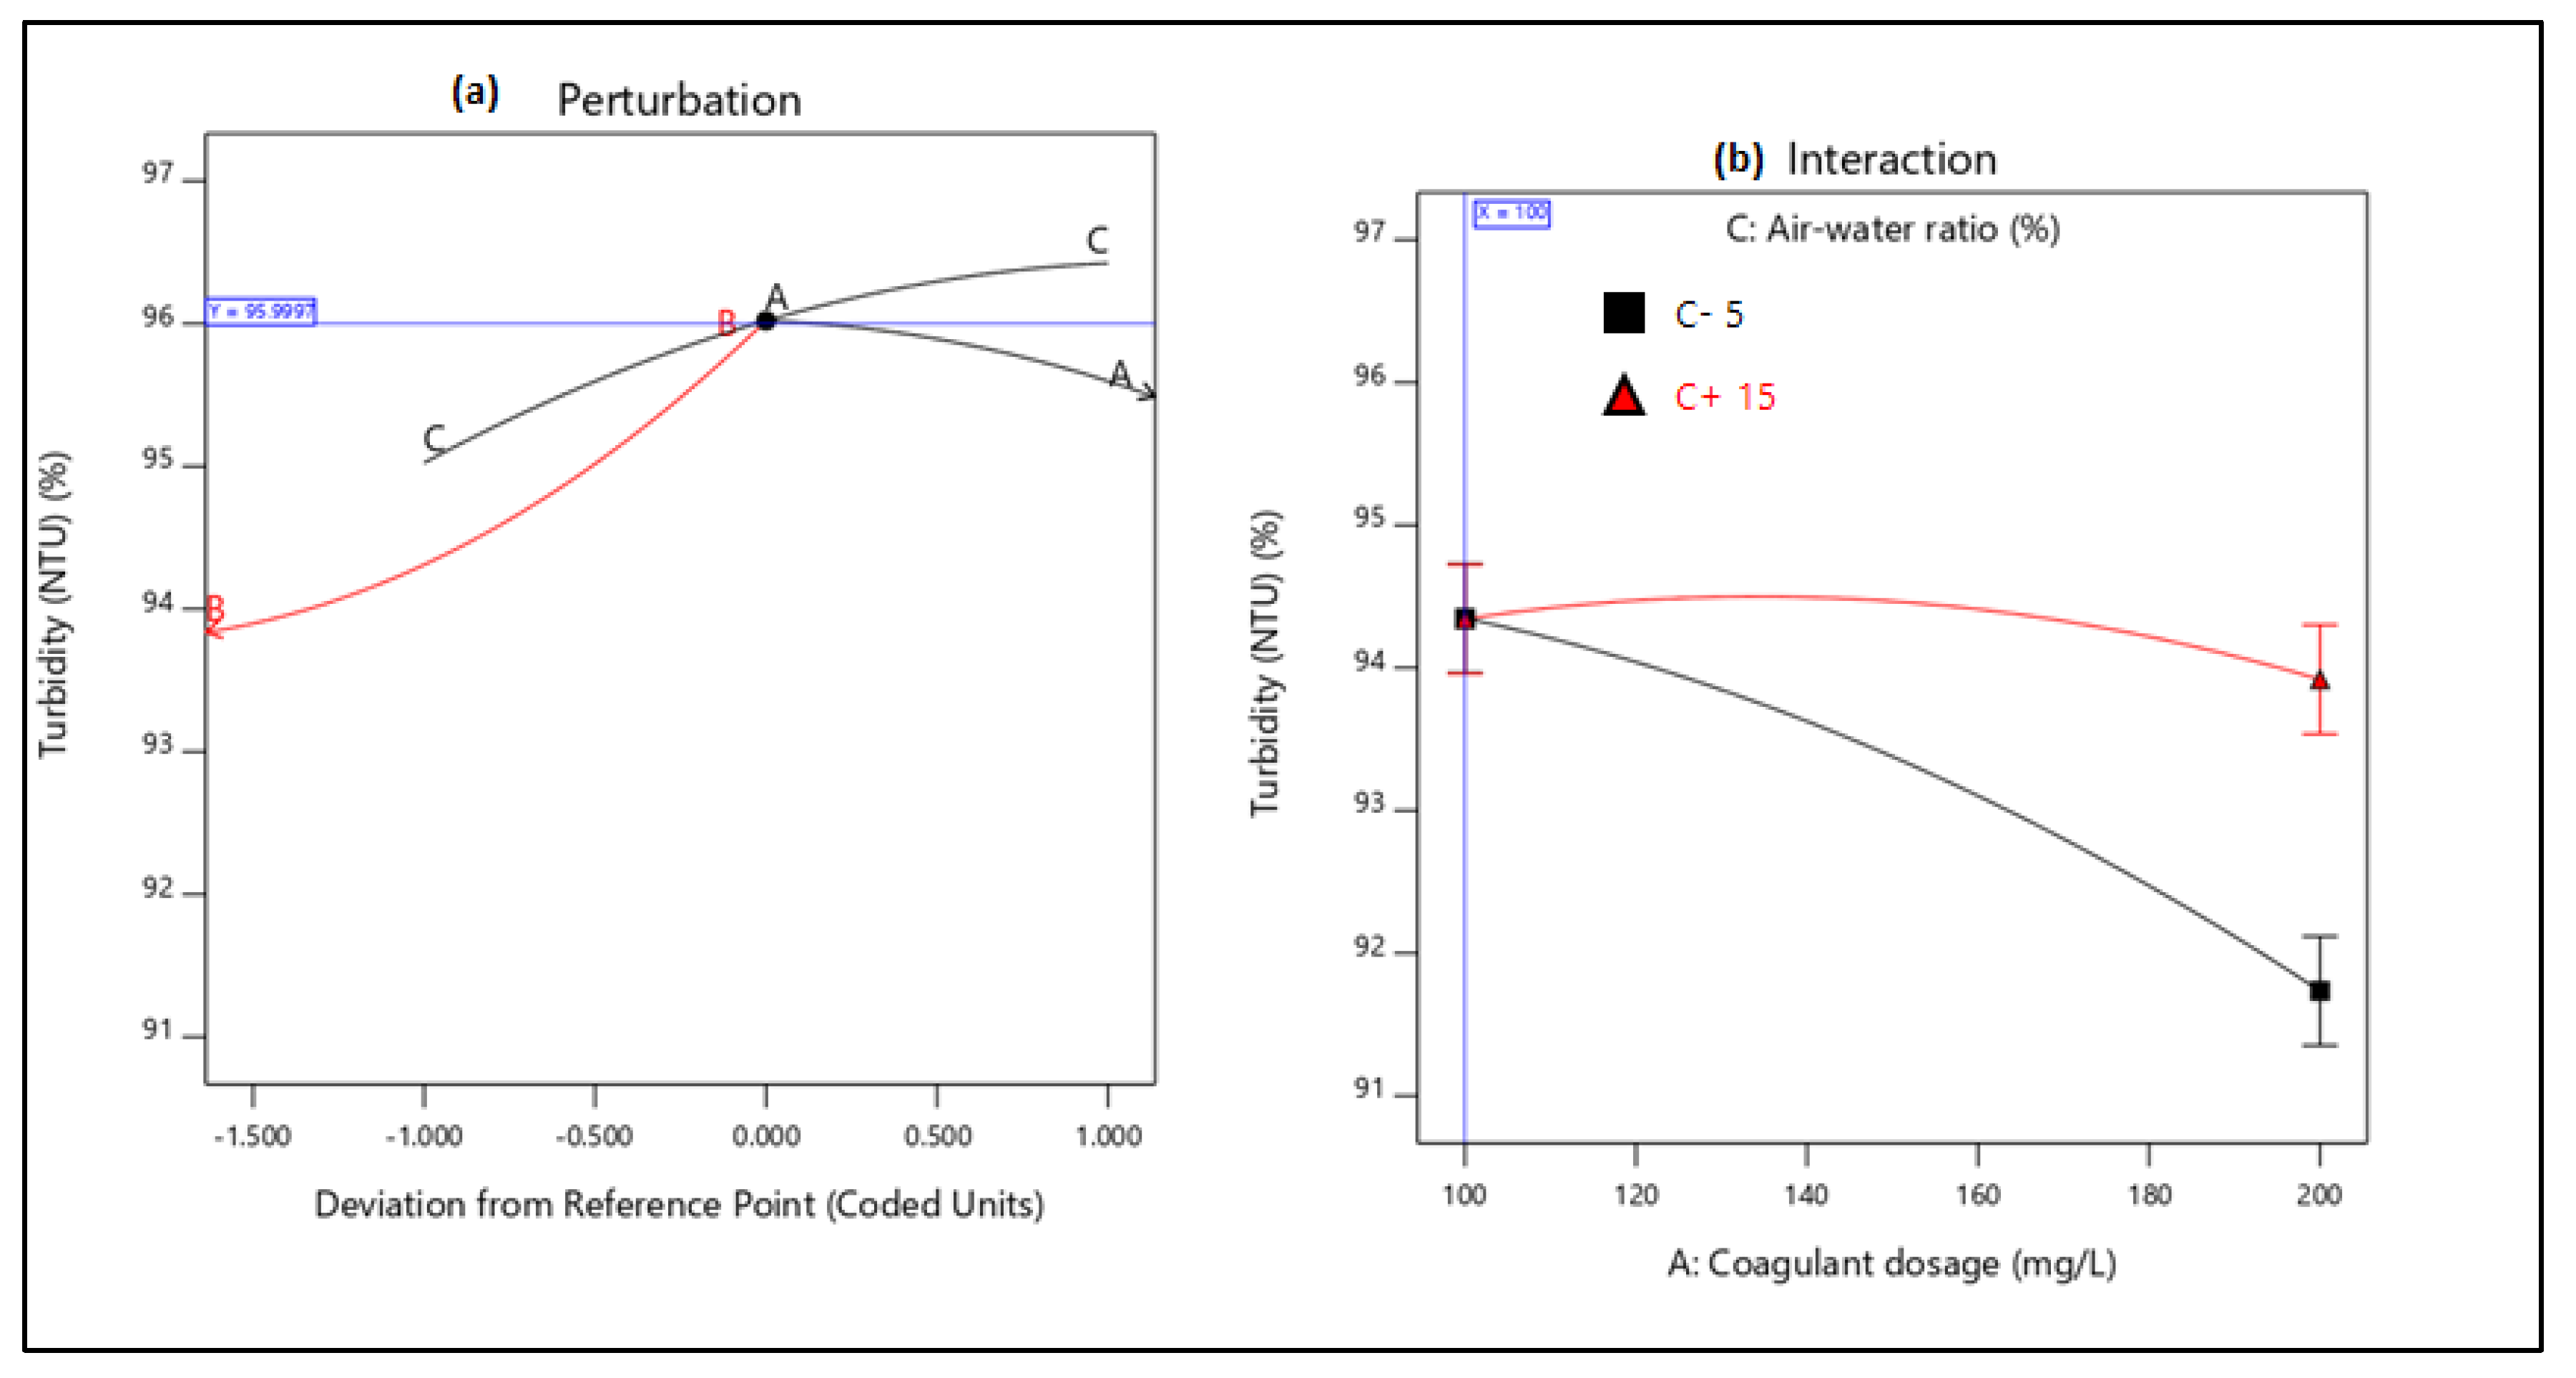
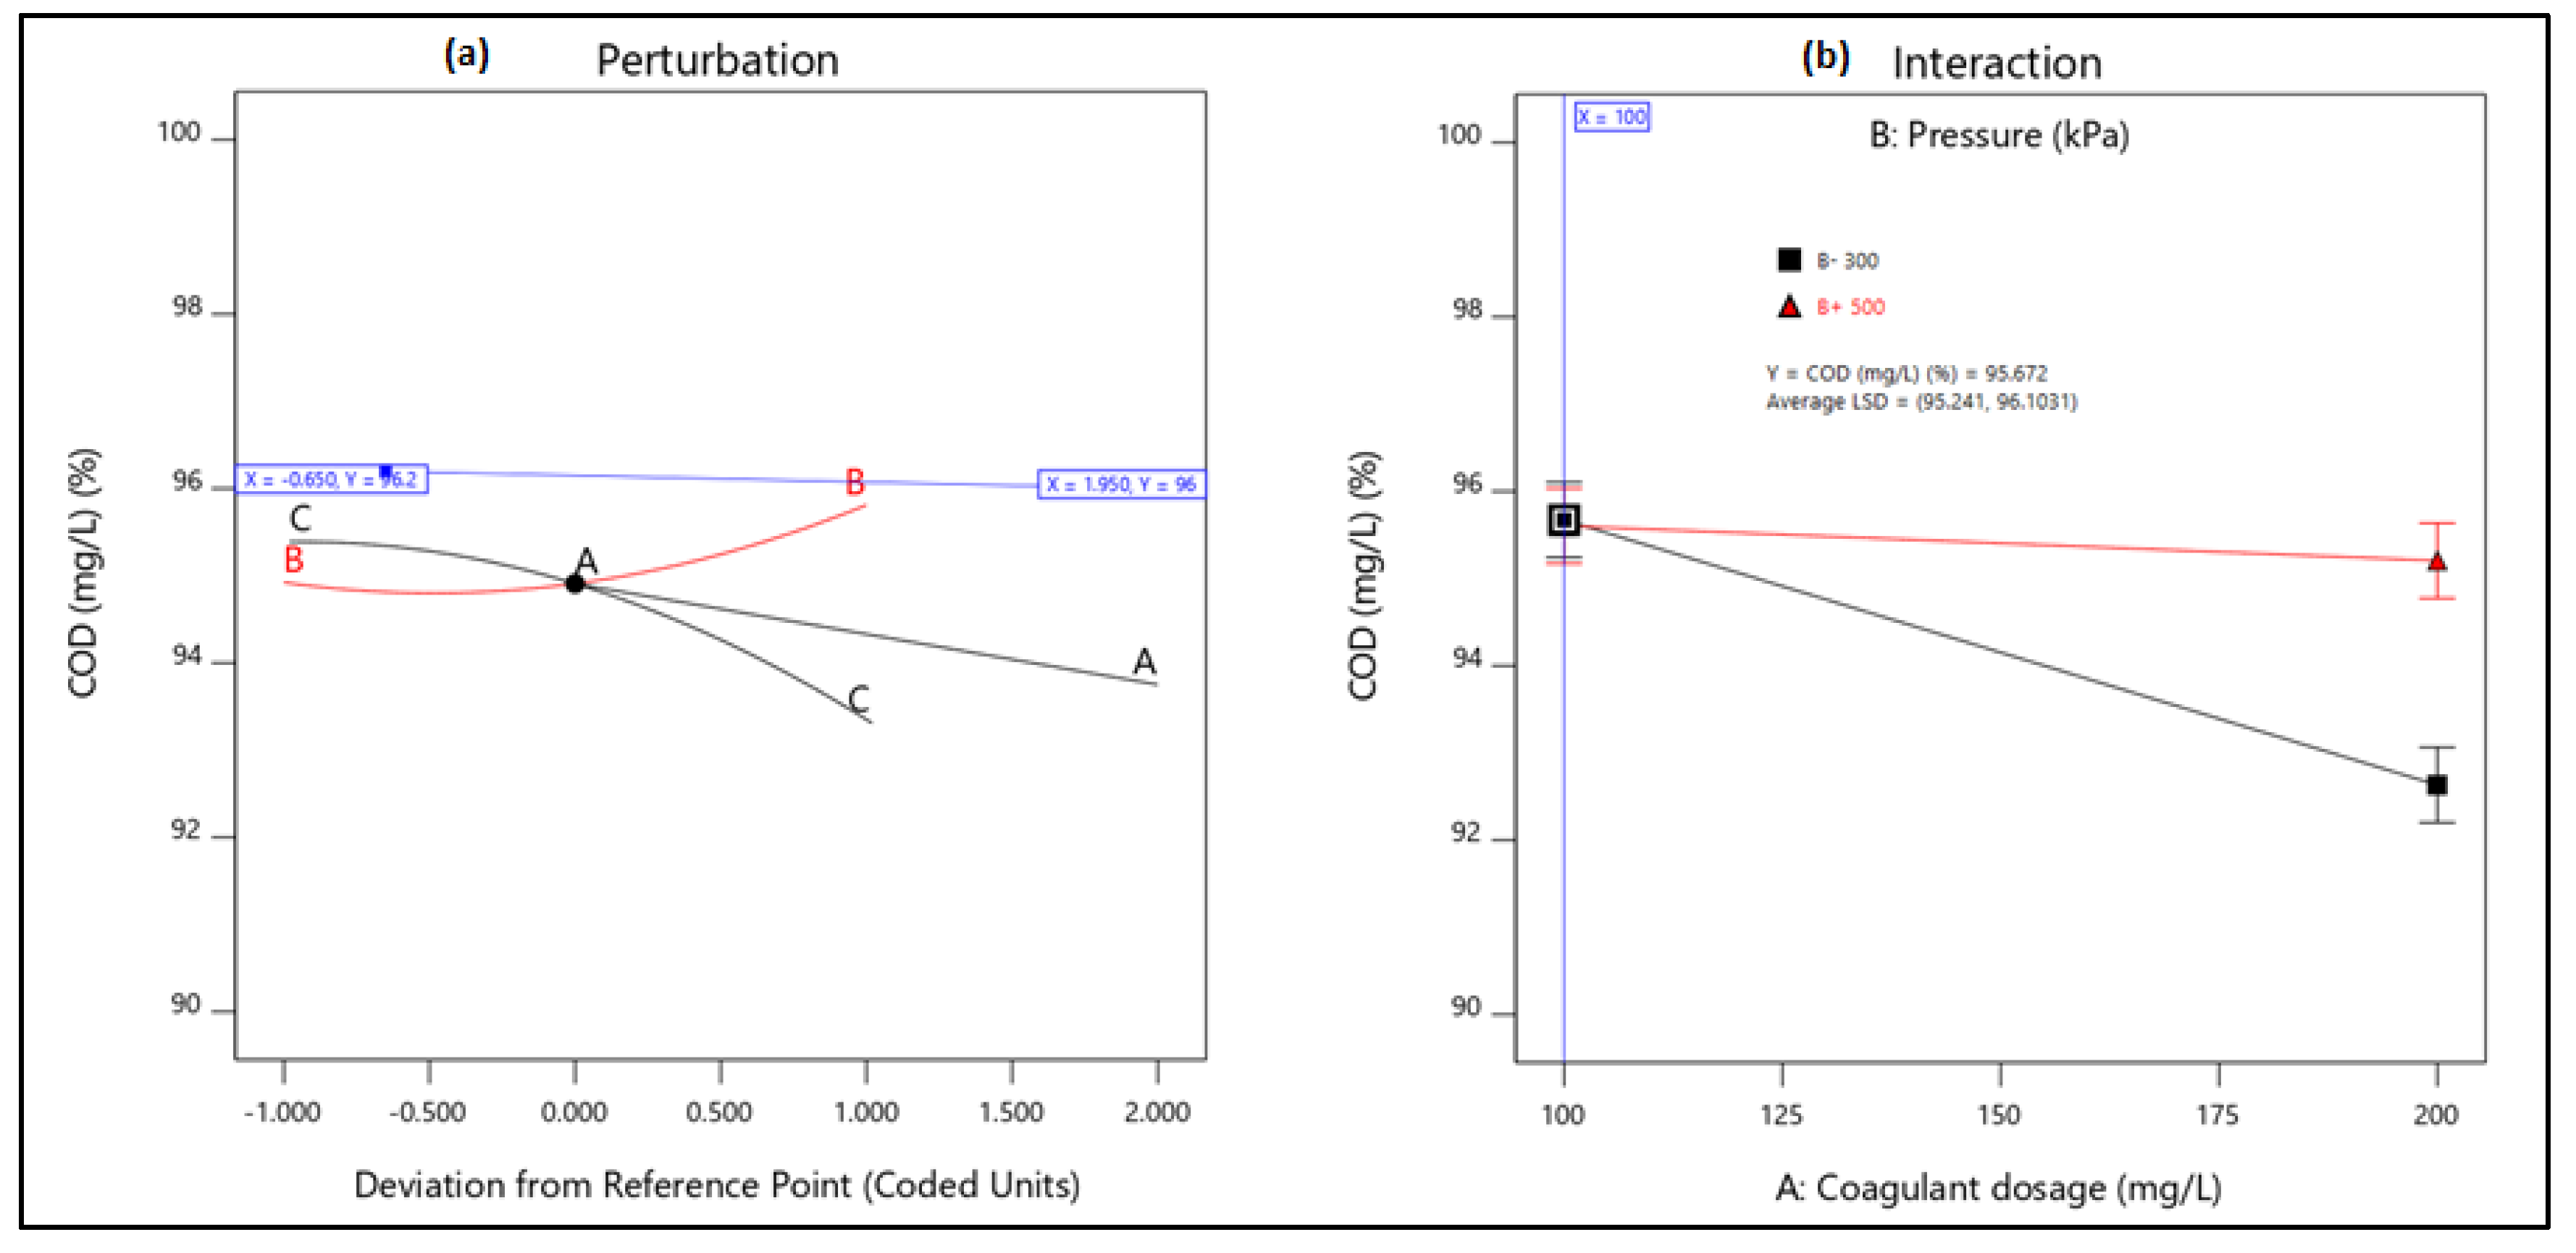
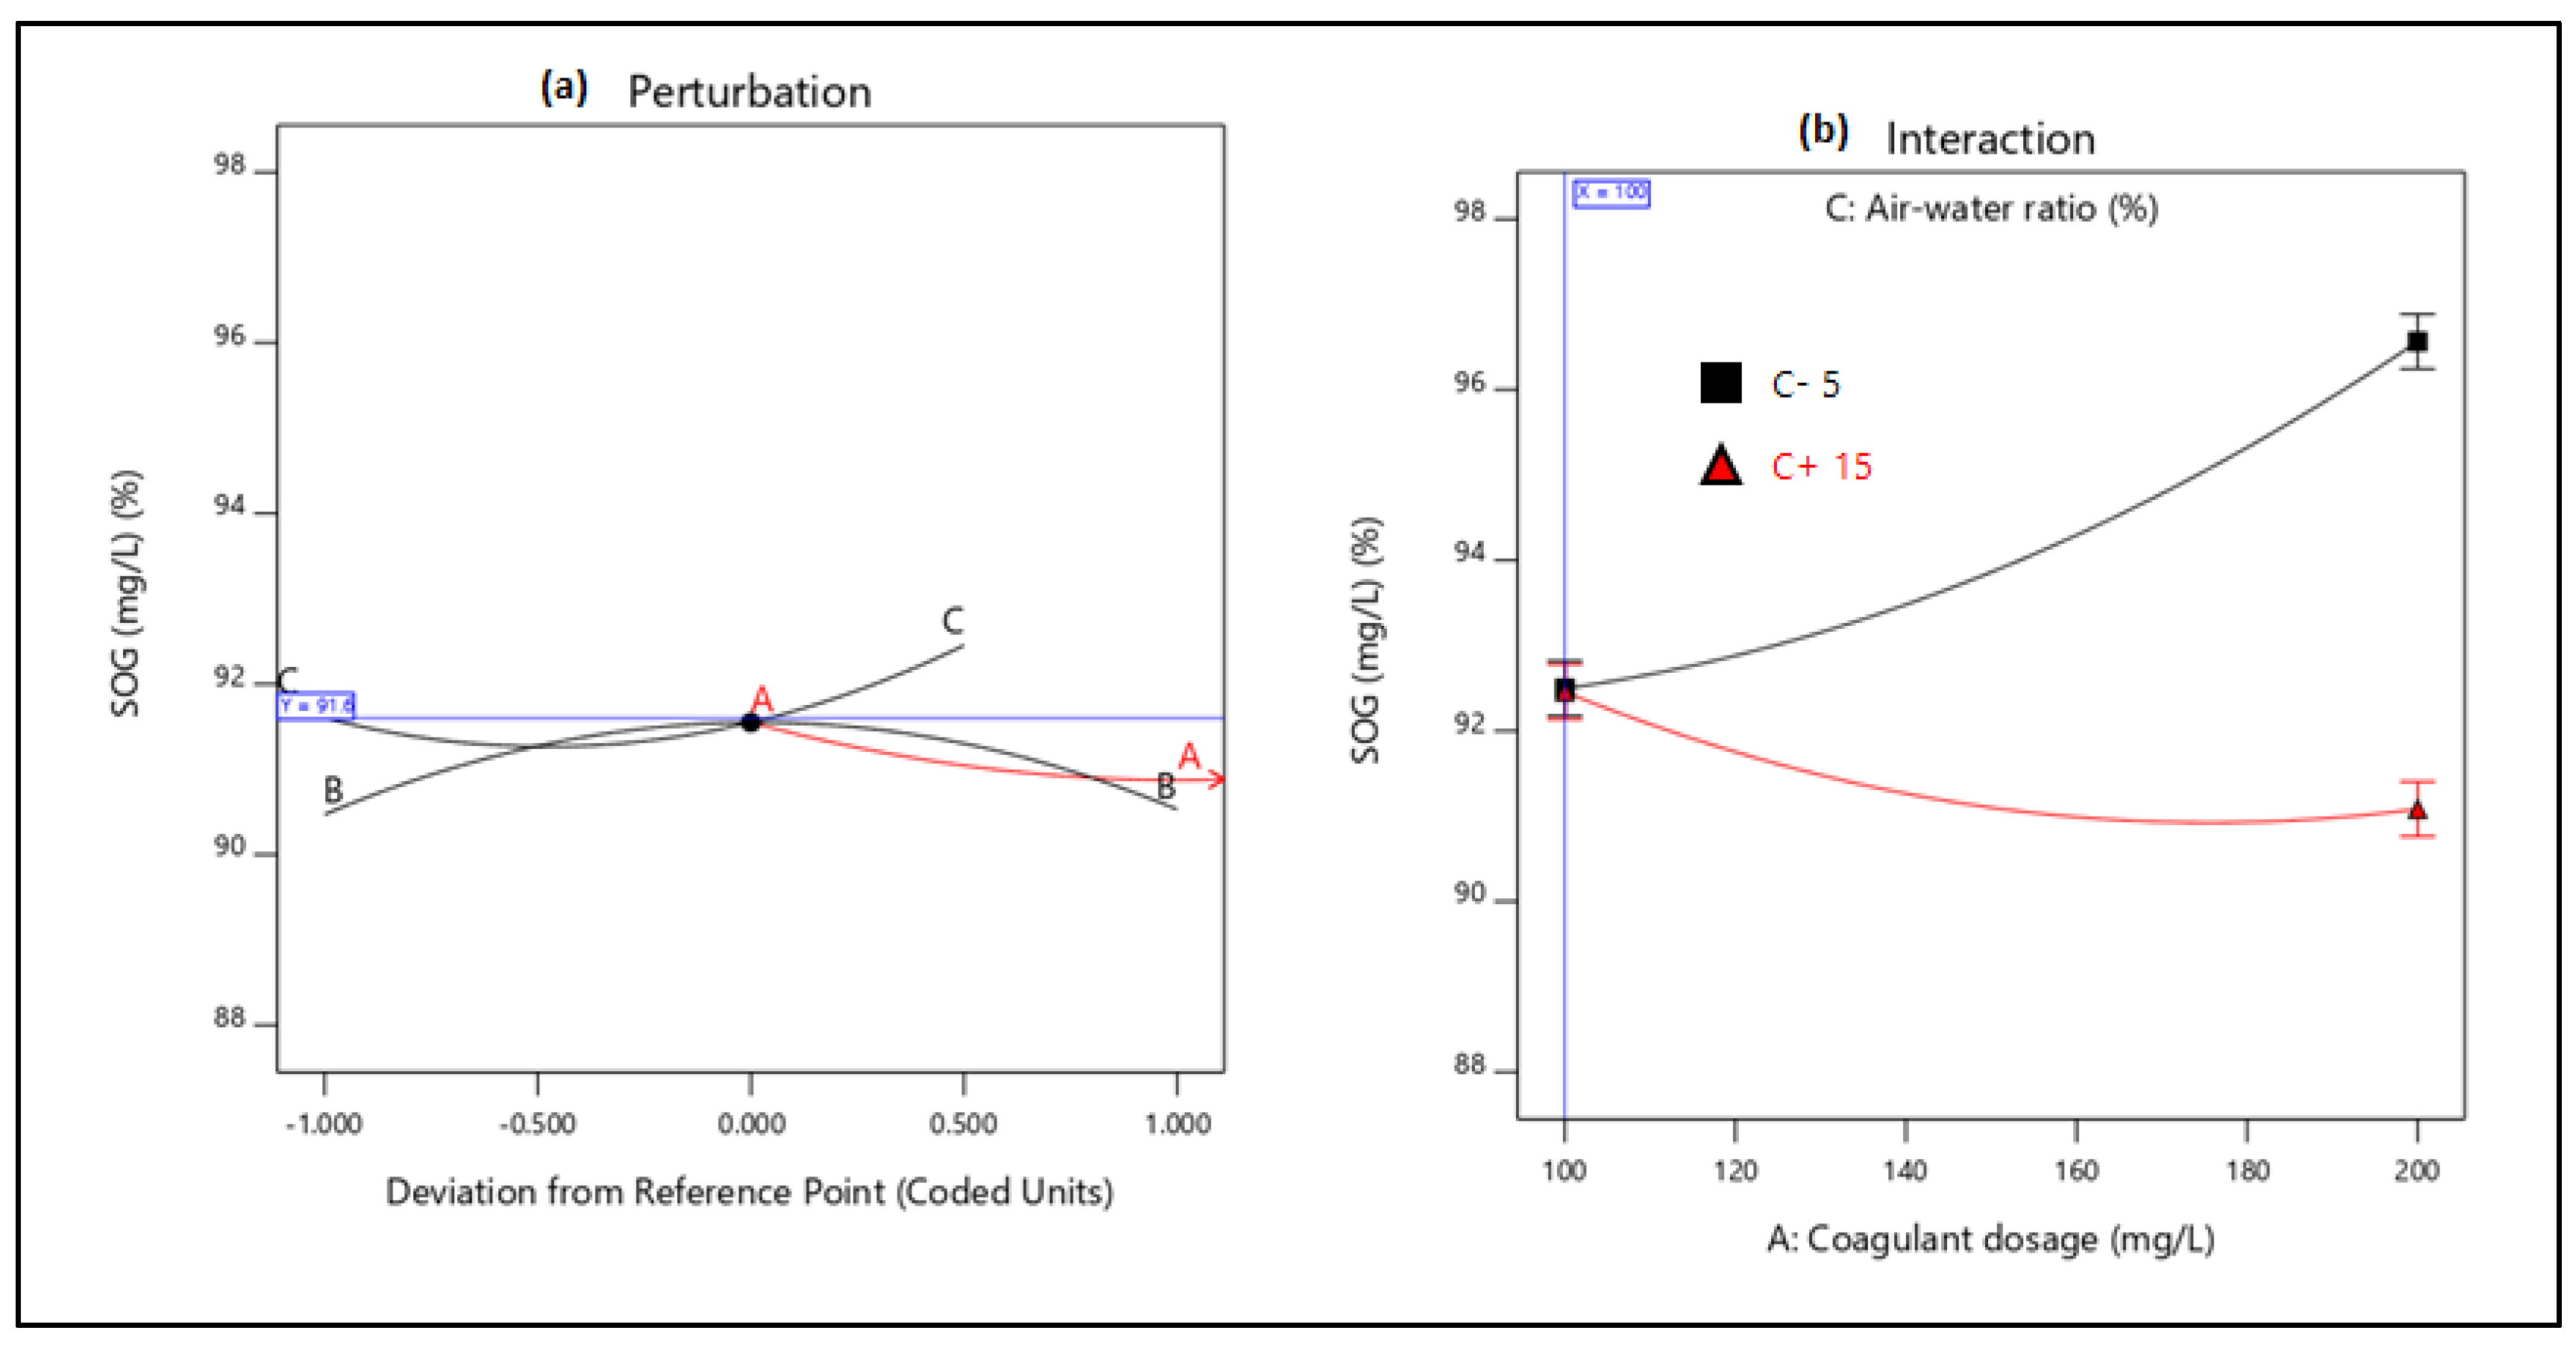
The perturbation plots (Figure A1a, Figure A2a, Figure A3a and Figure A4a) were done to identify the most sensitive factors for the treatment of the ORW using the coagulation-DAF system. The two-factor interaction plots are also presented in Figure A1b, Figure A2b, Figure A3b and Figure A4b and show the interactions for AB (coagulant dosage–pressure) and AC (coagulant dosage–air–water ratio). The interactional effects between AC had an influence on the system for the reduction in % SOG and % turbidity, whereas AB had an influence for % COD and % TSS reduction. In the perturbation plots (Figure A1a and Figure A4a), saturator pressure (B) appears to be the most influential factor in reducing COD and turbidity, followed by the air–water ratio (C) and coagulant dosage (A). The order of increase in SOG removal (Figure A1a) is associated with the high influence of the coagulant dosage (A), then pressure (B) and air–water ratio (C). Air–water ratio (C) had a high impact on the TSS reduction (Figure A2a), followed by coagulant dosage (A) and pressure (B). The least-significance-difference (LSD) bars representing the existence of mean difference between the two factors are depicted in Figure A1b, Figure A2b, Figure A3b and Figure A4b. The overlapping beams on the interaction graphs (Figure A1b, Figure A2b, Figure A3b and Figure A4b) show the model’s predicted values and the significant effects of the independent levels. The black and red lines (Figure A1b, Figure A2b, Figure A3b and Figure A4b) illustrate the low and high levels of the factors, respectively, to maximise the response [26,27]. In all cases (>Figure A1b, Figure A2b, Figure A3b and Figure A4b), keeping the coagulant dosage at 100 mg/L constant and other factors set at low levels, the differences observed between them were highly significant. Overall, coagulant dosage was found to be the most influential factor for COD, SOG, TSS, and turbidity removal.
The optimum conditions (Figure 5) occurred at a coagulant dosage of 100 mg/L, a saturator pressure of 375 kpa and an air-water ratio of 10%. The removal percentage of COD, SOG, TSS, and turbidity were 95%, 92%, 98%, and 94%, respectively, which were in good agreement with the empirical results using these optimum conditions experimentally (Table 3). However, the independent factors viz. coagulant dosage and saturator pressure could influence the studied responses. Thus, increasing the coagulant dosage and air saturator pressure might contribute to decreasing the response values. The minimum coagulant dosage and air saturator pressure obtained successively should be the focus when optimising DAF to reduce the chemical and energy utilisation and cost of production.

5. Conclusions

This study presents coagulation before DAF (pre-treatment) as the better configuration option compared to coagulation after DAF (post-treatment). Among the four coagulants used to evaluate the DAF configuration’s treatability performance, Alum was found to be superior to the other types of coagulants. Alum, due to its trivalent ions, was able to neutralise the negatively charged oil droplets. The use of RSM was seen as far better than the OFAT approach, in terms of cost-effectiveness and optimising the complex factors of the coagulation–DAF process. The Box-Behnken design for the RSM shows valuable information on the interactions between the factors and the possibility of obtaining optimum conditions with a smaller number of experiments, time and resources. The impact of the three factors (coagulant dosage, pressure and air–water ratio) and their interactions were modelled and optimised simultaneously to maximise the response variables (%removal of COD, SOG, TSS, and Turbidity). The ANOVA indicated that the quadratic models developed were highly significant at a 95% confidence level, and the predicted results at the optimum conditions were in good agreement with the experimental data. Consequently, coagulant dosage was the most influential factor for contaminant removal.
Author Contributions

Conceptualization of the manuscript was by E.K.T. and S.R.; methodology, formal analysis, investigation, writing—original draft preparation, E.K.T.; writing—review and editing, E.K.T. and S.R.; supervision, S.R. All authors have read and agreed to the published version of the manuscript.

Funding

This research received no external funding.

Acknowledgments

The authors are grateful to FFS Refiners, Umgeni Water (Process Evaluation Centre) and Durban University of Technology for their support towards this project.

Conflicts of Interest

The authors declare no conflict of interest

Appendix A

Table A1. ANOVA of quadratic model for COD (Y1) removal.
SourceSum of SquaresdfMean SquareF-Valuep-Value
Model28.7583.5938.25< 0.0001significant
A-Coagulant dosage2.5212.5226.820.0008
B-Pressure10.28110.28109.44< 0.0001
C-Air-water ratio0.211310.21132.250.022
AB1.7411.7418.540.0026
AC3.0813.0832.780.0004
BC8.9118.9194.83< 0.0001
0.887310.88739.440.0153
1.2311.2313.060.0068
Residual0.751780.0940
Lack of Fit0.721740.18793.23 0.0012
Pure Error0.030040.120
Cor Total29.5016
Std. Dev. 0.3065Mean 94.29C.V. % 0.3251R² 0.9745Adjusted R² 0.9490Predicted R² 0.7522Adeq Precision 23.5498
Table A2. ANOVA of quadratic model for SOG (Y2) removal.
SourceSum of SquaresdfMean SquareF-Valuep-Value
Model40.3385.0486.99< 0.0001significant
A-Coagulant dosage3.6313.6362.57< 0.0001
B-Pressure0.316310.31635.460.0477
C-Air-water ratio15.99115.99275.97< 0.0001
AC7.4017.40127.66< 0.0001
BC0.456410.45647.880.0230
1.8911.8932.550.0005
4.6414.6480.02< 0.0001
6.4916.49112.01< 0.0001
Residual0.463680.0580
Lack of Fit0.42140.1159 4.20.0016
Pure Error0.042540.021
Cor Total40.7916
Std. Dev. 0.2407Mean 91.68C.V. % 0.2626R² 0.9886Adjusted R² 0.9773Predicted R² 0.8501Adeq Precision 38.3583
Table A3. ANOVA of quadratic model for TSS (Y3) removal.
SourceSum of SquaresdfMean SquareF-Valuep-Value
Model7.4871.07108.18< 0.0001significant
A-Coagulant dosage0.080010.08008.100.0192
B-Pressure1.8411.84186.69< 0.0001
C-Air-water ratio0.561810.561856.90< 0.0001
AB0.260110.260126.350.0006
AC1.9911.99201.37< 0.0001
BC1.9911.99201.37< 0.0001
0.755010.755076.48< 0.0001
Residual0.088990.0099
Lack of Fit0.066850.01783.62 0.0062
Pure Error0.022140.0200
Cor Total7.5716
Std. Dev. 0.0994Mean 98.17C.V. % 0.1012R² 0.9883Adjusted R² 0.9791Predicted R² 0.9454Adeq Precision 36.9708
Table A4. ANOVA of quadratic model for Turbidity (Y4) removal.
SourceSum of SquaresdfMean SquareF-Valuep-Value
Model22.8682.8635.67< 0.0001significant
A-Coagulant dosage4.6114.6157.49< 0.0001
B-Pressure10.44110.44130.35< 0.0001
C-Air-water ratio0.800110.80019.990.0134
AC1.2011.2014.970.0047
BC3.6113.6145.060.0002
0.476110.47615.940.0407
1.4711.4718.370.0027
0.369510.36954.610.0640
Residual0.640980.0801
Lack of Fit0.510940.1602 4.13 0.024
Pure Error0.130040.0200
Cor Total23.5016
Std. Dev. 0.2830Mean 93.89C.V. % 0.3015R² 0.9727Adjusted R² 0.9455Predicted R² 0.7385Adeq Precision 24.0787
Figure A1. (a) Perturbation plot and (b) interaction plot of (A) coagulant dosage (mg/L) and (B) saturator pressure (kPa) for %COD removal.
Processes 08 00383 g0a1
Figure A2. (a) Perturbation plot and (b) interaction plot of (A) coagulant dosage (mg/L) and (C) air-water ratio (%) for %SOG removal.
Processes 08 00383 g0a2
Figure A3. (a) Perturbation plot and (b) interaction plot of (A) coagulant dosage (mg/L) and (B) saturator pressure (kPa) for %TSS removal.
Processes 08 00383 g0a3
Figure A4. (a) Perturbation plot and (b) interaction plot of (A) coagulant dosage (mg/L) and (C) Air-water ratio for %Turbidity removal.
Processes 08 00383 g0a4

References

  1. Pal, S.; Banat, F.; Almansoori, A.; Haija, M.A. Review of technologies for biotreatment of refinery wastewaters: Progress, challenges and future opportunities. Environ. Technol. Rev. 2016, 5, 12–38. [Google Scholar] [CrossRef]
  2. Edzwald, J.K. Dissolved air flotation and me. Water Res. 2010. [Google Scholar] [CrossRef] [PubMed]
  3. Bensadok, K.; Belkacem, M.; Nezzal, G. Treatment of cutting oil/water emulsion by coupling coagulation and dissolved air flotation. Desalination 2007, 206, 440–448. [Google Scholar] [CrossRef]
  4. Crossley, I.A.; Valade, M.T. A review of the technological developments of dissolved air flotation. J. Water Supply: Res. Technol. AQUA 2006, 55, 479–491. [Google Scholar] [CrossRef]
  5. Water, U.N. Sustainable Development Goal 6 Synthesis Report on Water and Sanitation 2018; United Nations New York: New York, NY, USA, 2018; p. 10017. [Google Scholar]
  6. Connor, R. Water for a Sustainable World; UNESCO: Paris, France, 2015; Volume 1. [Google Scholar]
  7. You, Z.; Xu, H.; Sun, Y.; Zhang, S.; Zhang, L. Effective treatment of emulsified oil wastewater by the coagulation-flotation process. RSC Adv. 2018, 8, 40639–40646. [Google Scholar] [CrossRef] [Green Version]
  8. Hui, L.; Yan, W.; Juan, W.; Zhongming, L. A Review: Recent Advances in Oily Wastewater Treatment. Recent Innov. Chem. Eng. Former. Recent Pat. Chem. Eng. 2015, 7, 17–24. [Google Scholar] [CrossRef]
  9. Louhıchı, G.; Bousselmı, L.; Ghrabı, A.; Khounı, I. Process optimization via response surface methodology in the physico-chemical treatment of vegetable oil refinery wastewater. Environ. Sci. Pollut. Res. 2019, 26, 18993–19011. [Google Scholar] [CrossRef]
  10. Tetteh, E.K.; Rathilal, S.; Robinson, K. Treatment of industrial mineral oil wastewater—Effects of coagulant type and dosage. Water Pract. Technol. 2017, 12, 139–145. [Google Scholar] [CrossRef]
  11. Fakhru’l-Razi, A.; Pendashteh, A.; Abdullah, L.C.; Biak, D.R.A.; Madaeni, S.S.; Abidin, Z.Z. Review of technologies for oil and gas produced water treatment. J. Hazard. Mater. 2009, 170, 530–551. [Google Scholar] [CrossRef]
  12. Chen, G. Electrochemical technologies in wastewater treatment. Sep. Purif. Technol. 2004, 38, 11–41. [Google Scholar] [CrossRef]
  13. Jamaly, S.; Giwa, A.; Hasan, S.W. Recent improvements in oily wastewater treatment: Progress, challenges, and future opportunities. J. Environ. Sci. (China) 2015, 37, 15–30. [Google Scholar] [CrossRef] [PubMed]
  14. Wu, S.; Wallace, S.; Brix, H.; Kuschk, P.; Kirui, W.K.; Masi, F.; Dong, R. Treatment of industrial effluents in constructed wetlands: Challenges, operational strategies and overall performance. Environ. Pollut. 2015, 201, 107–120. [Google Scholar] [CrossRef] [PubMed]
  15. Aljuboury, D.A.D.A.; Palaniandy, P.; Aziz, H.B.A.; Feroz, S. Treatment of petroleum wastewater by conventional and new technologies—A review. Glob. Nest J. 2017, 19, 439–452. [Google Scholar]
  16. Wu, T.Y.; Mohammad, A.W.; Jahim, J.M.; Anuar, N. Pollution control technologies for the treatment of palm oil mill effluent (POME) through end-of-pipe processes. J. Environ. Manag. 2010, 91, 1467–1490. [Google Scholar] [CrossRef] [PubMed]
  17. Etchepare, R.; Oliveira, H.; Azevedo, A.; Rubio, J. Separation of emulsified crude oil in saline water by dissolved air flotation with micro and nanobubbles. Sep. Purif. Technol. 2017, 186, 326–332. [Google Scholar] [CrossRef]
  18. Edzwald, J.K. Principles and applications of dissolved air flotation. Water Sci. Technol. 1995, 31, 1–23. [Google Scholar] [CrossRef]
  19. Al-Shamrani, A.A.; James, A.; Xiao, H. Separation of oil from water by dissolved air flotation. Colloids Surf. A: Physicochem. Eng. Asp. 2002, 209, 15–26. [Google Scholar] [CrossRef]
  20. Russell, D. Dissolved Air Flotation and Techniques. In Practical Waste Water Treatment; Wikipedia: Hoboken, NJ, USA, 2019; p. 288. [Google Scholar]
  21. Adlan, M.N.; Palaniandy, P.; Aziz, H.A. Optimization of coagulation and dissolved air flotation (DAF) treatment of semi-aerobic landfill leachate using response surface methodology (RSM). Desalination 2011, 277, 74–82. [Google Scholar] [CrossRef]
  22. APHA. Standard Methods for the Examination of Water and Wastewater; American Public Health Association: Washington, DC, USA, 2012; 1496p. [Google Scholar]
  23. Tetteh, E.K.; Rathilal, S. Effects of a polymeric organic coagulant for industrial mineral oil wastewater treatment using response surface methodology (Rsm). Water SA 2018, 44, 155–161. [Google Scholar] [CrossRef] [Green Version]
  24. Zouboulis, A.I.; Avranas, A. Treatment of oil-in-water emulsions by coagulation and dissolved-air flotation. Colloids Surf. A: Physicochem. Eng. Asp. 2000, 172, 153–161. [Google Scholar] [CrossRef]
  25. Tetteh, E.K.; Rathilal, S. September. Investigating Dissolved Air Flotation Factors For Oil Refinery Wastewater Treatment. CBU Int. Conf. Proc. 2018, 6, 1173–1177. [Google Scholar] [CrossRef] [Green Version]
  26. Kleijnen, J.P.C. Response Surface Methodology. In Handbook of Simulation Optimization; Springer: New York, NY, USA, 2015; pp. 81–104. [Google Scholar]
  27. K Tetteh, E.; Obotey Ezugbe, E.; Asante-Sackey, D. Removal of COD and SO42− from Oil Refinery Wastewater Using a Photo-Catalytic System—Comparing TiO2 and Zeolite Efficiencies. Water 2020, 12, 214. [Google Scholar] [CrossRef] [Green Version]
Figure 1. Schematic presentation of 1 m3/h dissolved air flotation (DAF) pilot plant.
Processes 08 00383 g001
Figure 2. Removal of (a) total suspended solids (TSS); (b) Turbidity; (c) chemical oxygen demand (COD) and (d) soap oil and grease (SOG); pre-and post-coagulation with Zetag32-FS/A50, Z553D, alum and FC (dosage-50 mg/L, pH-5, saturator pressure-400 kPa, and air-water ratio-15%vol/vol).
Processes 08 00383 g002aProcesses 08 00383 g002b
Figure 3. Response surface 3D plot for (a) %COD removal and (b) %SOG removal.
Processes 08 00383 g003
Figure 4. Response surface 3D plot for (c) %TSS removal and (d) %Turbidity removal.
Processes 08 00383 g004
Figure 5. Numerical optimization ramp plot predicted conditions.
Processes 08 00383 g005
Table 1. Box-Behnken design (BBD) matrix with range of factor values.
Factors Sign Levels
−101
Coagulant dosage (mg/L)A100150200
Saturator pressure (kPa)B300400500
Air-water ratio (% vol/vol)C51015
Table 2. Box-Behnken design (BBD) matrix with experimental data.
FactorsResponses
RunA: Coagulant Dosage (mg/L)B: Pressure (kPa)C: Air-water Ratio (%vol/vol)COD (%)SOG (%)TSS (%)Turbidity (%)
100094919894
200094919894
30−1192909993
4−11096909896
510−192969991
600094919894
701196909796
811096929895
9−10193939994
1000094919894
1110194919893
12−1−1095909994
13−10−195939794
141−1092929992
1501−194949894
160−1−195949794
1700094919894
Table 3. Removal of oil refinery wastewater (ORW) contaminants using model-predicted optimum values.
ResponsePredicted Mean (%)Data Mean (%)Std DevStd Error
COD (mg/L)95%96%0.310.34
SOG (mg/L)92%91%0.100.28
TSS (mg/L)98%97%20.11
Turbidity (NTU)94%95%0.280.33