1. Introduction
Among the commonly used biomaterials, 316L stainless steel is in use since ancient times when total hip replacement of a patient was carried out using 316L stainless steel for implantation [
1,
2]. Since then, 316L stainless steel has been gaining great attention in biomedical applications. It is available at a low cost with adequate mechanical properties, biocompatibility and corrosion resistance [
3,
4]. The implants and medical devices can be manufactured from 316L stainless steel at a relatively low cost as compared to its counterpart materials including cobalt chromium, titanium and other biomaterials [
5,
6,
7,
8,
9,
10]. Austenitic 316L stainless steel is also recommended by ASTM International for use in implant manufacturing and medical devices [
11,
12,
13]. The low carbon content and high chromium concentration in this material makes it resistant to corrosive environment specially in chlorine bearing solutions [
14]. The human body saline resembles the chlorine bearing solution making this material an ideal choice for usage in implant manufacturing [
15].
The 316L stainless steel contains 10%–14% nickel for promoting the austenitic structure [
16]. It has been reported that the implants made of biomaterials have been reported to be associated with release of metal ions and debris due to poor surface finish and corrosion resistance [
17,
18]. Among the released metal ions, nickel and chromium have been proven to be the cause of many genotoxic and mutagenic activities [
19]. Nickel has been associated with contact allergy for patients allergic to metals causing skin diseases including dermatitis and eczematous rash [
16,
19]. The leaching of ions and debris due to ionic leaching have been reported to be the cause of swelling and localized pain due to inflammation [
20]. The leaching of metal ions demands the surface improvement of 316L stainless steel implant material [
21,
22]. Various methods have been developed to improve the surface quality and corrosion resistance of stainless-steel including surface modification techniques. These include physical, chemical and mechanical surface modification techniques [
23,
24]. However, certain disadvantages are associated with these techniques which limit their application in biomedical field Including low coating deposition rate, crack free coatings, line of sight and expensive raw materials [
25,
26]. To overcome these short comings and develop an alternative solution, optimization of sintering parameters for surface nitriding of the material can address these issues [
27,
28,
29]. The optimal sintering parameters with increased dwell time can help in creating a protective surface layer on the stainless-steel surface. This will help in improving the corrosion resistance of the material and act as an inhibitor for controlling the leaching of ions.
2. Materials and Methods
In this research, commercially available pure irregular shape water atomized 316L stainless steel powder was selected due to high packing density and better sinter ability than gas atomized powder. The chemical composition of the powder has been summarized in
Table 1. The particle size distribution of the powder was characterized and is presented in
Table 2.
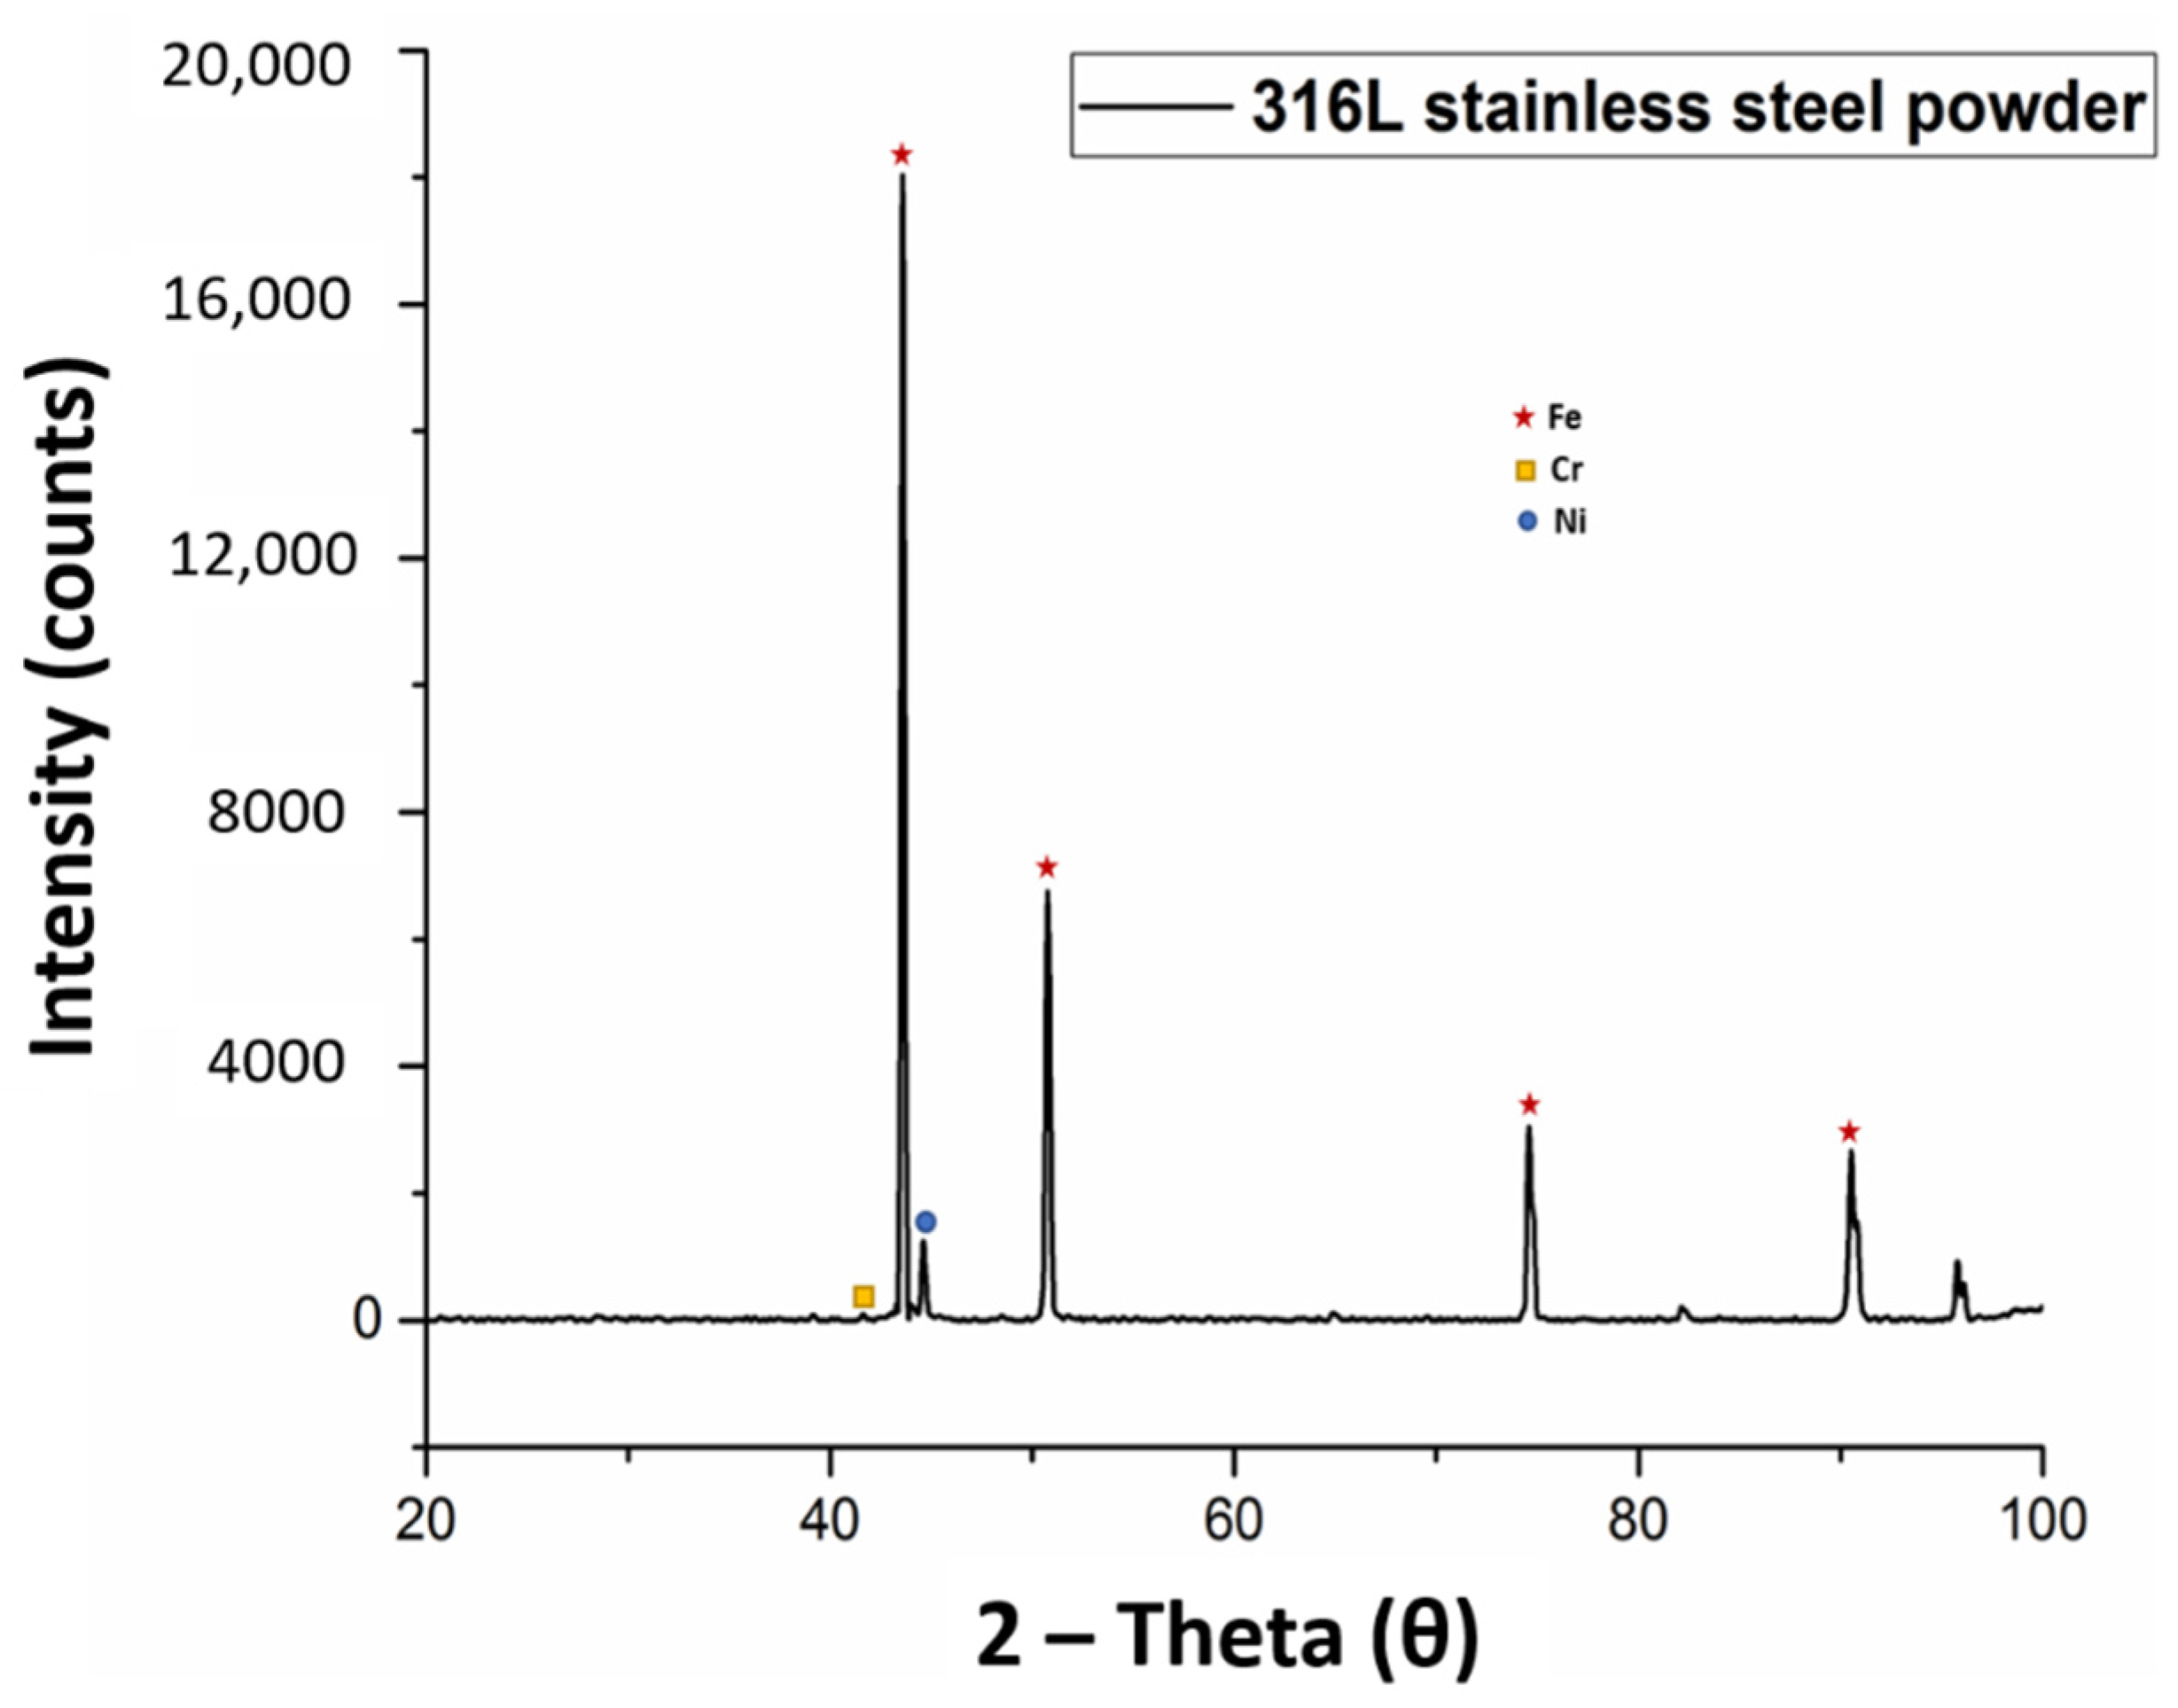
Uniaxial cold compaction process was used to prepare the samples of size 30 mm diameter and 5 mm thickness using stainless steel die. The powder was compressed at 800 MPa pressure to prepare the green compacts followed by sintering in nitrogen atmosphere at two different temperatures of 1150 and 1200 °C. The dwell time was varied for each temperature and was set at 1, 3, 5 and 8 h. The SEM and XRD of the powder have been presented in
Figure 1 and
Figure 2 respectively.
The most influential parameter settings, optimizing and generating a mathematical model for the selected responses was carried out by response surface methodology (RSM) (D-optimum custom design). This design generates a design that estimates the influence of the process parameters in the best possible way, particularly suited for screening studies. Considering the role of nitrogen absorption (N-abs), density (D) and microhardness (HV) in developing suitable implant material and the capability of powder metallurgy process, three major responses (N-abs, D and HV) were selected for parameters optimizations. The two important factors influencing these responses namely sintering temperature (St) and dwell time (Dt) and mixed level design were used to plan the experiment. A total of 16 experimental runs were conducted according to the procedure described above and have been presented in
Table 3.
The sintered samples were then characterized using X-ray diffractometer (Model: X’pert3, Powder and Empyrean, PANalytical, B.V, Lelyweg, Almelo, The Netherlands), X-ray photoelectron spectrometer (Model: Thermo Scientific, K-alpha, East Grinstead, UK), optical microscope (Model: Leica DM LM, Wetzlar, Germany) and Vickers hardness tests using tester (Model: Leco LM 247AT, St Joseph, MI, USA) to examine the resulting properties of the sintered samples.
3. Results and Discussion
The XRD evaluation was carried out to analyze the diffusion of nitrogen into the matrix of the sintered samples. The results indicated that the sintering atmosphere and dwell times helped in diffusing nitrogen to form strong nitrides with the constituents of 316L stainless steel matrix. The XRD spectrum of the sintered samples have been presented in
Figure 3, indicating S1 sample sintered for 1 h dwell time, S2 sintered for 3 h dwell time, S3 sintered for 5 h dwell time and S4 sintered at dwell time of 8 h at sintering temperature of 1200 °C. The results indicate the formation of C
3N
4 at d spacing of 2.51960 Å, FeN
0.324 at d spacing of 2.07500 Å, Cr
2O
3 at d spacing of 2.66348 Å and Ni (Cr
2O
4) at d spacing of 2.49354 Å. The presence of γFe in all the samples indicated that the austenitic structure of the 316L stainless steel was retained at increased dwell times.
The XPS was done to analyze the existence of nitrogen onto the sample surface. The results indicated that the dwell time has a notable effect on the amount of nitrogen on surface of the sample. The amount of nitrogen increased with increasing dwell time and a maximum of 2.82% nitrogen was observed for samples sintered at 1200 °C temperature and 8 h dwell time. The XPS analysis has been presented in
Figure 4.
The microstructure of the sintered samples was observed under optical microscope after complete metallographic preparation. The micrographs of the sintered samples as viewed from optical microscope have been presented in
Figure 5, indicating S1 sample sintered for 1 h dwell time, S2 sintered for 3 h dwell time, S3 sintered for 5 h dwell time and S4 sintered at dwell time of 8 h at sintering temperature of 1200 °C. It can be observed from the micrographs that the samples are sintered properly with clear grain boundaries. Moreover, increased sintering dwell time helped in creation of clear grain boundaries with reduced porosity as observed in the micrographs.
The FESEM (Field Emission Scanning Electron Microscope) of sintered samples was done to further explore the effect of sintering parameters and presence of nitrogen. The elemental mapping was held for different elements present in the stainless steel. It was also helpful in identifying the effect of prolonged sintering dwell time. The results indicated the occurrence of nitrogen in the samples indicating that nitrogen diffused into the stainless steel matrix. The elemental mapping of the selected sample has been demonstrated in the
Figure 6.
The increased dwell time of sintering created a strong nitride layer onto the surface of the sample. The parameters of sintering simultaneously sintered and surface nitride the samples. The nitride layer developed onto the sample surface improves the corrosion resistance of the material along with controlling the leaching of metal ions during exposure to corrosive environments. The nitride layer formation of selected sample has been illustrated in
Figure 7.
The microhardness of the sintered samples was measured using Vickers hardness testing whereby, 200 gf was applied on the polished surface sample for a time period of 15 s. The microhardness value of 185 HV was measured for 1 h dwell time sintered sample, whereas its value increased to 235 HV for 8 h dwell time sintered samples. The increased absorption of nitrogen at increased dwell times can be attributed to the increase of microhardness values. The microhardness values of the sintered samples have been presented in
Figure 8.
3.1. Influence of Input Parameters on Nitrogen Absorption
The impact of process parameters on nitrogen absorption was determined using D-optimum design analysis. The analysis of variance (ANOVA) for the nitrogen absorption has been presented in
Table 4. The regression model, significant factors, interactions and lack of fit are summarized. The model and the model terms with the values of “prob > F” less than 0.0500 are considered as significant terms. It can be noticed from the ANOVA table that the factors St and Dt are significant model terms for nitrogen absorption. The lack of fit “prob > F” value of 0.7039 employs that it is non-significant. The difference between adjusted R-square predicted R-square shows that the terms are in reasonable agreement with each other as presented in
Table 5.
Most of the data was found to lie along straight line as observed in the normal probability plot of residuals shown in
Figure 9a. This indicated the selected model terms are only significant factors and the errors are normally distributed.
A well fitted regression which scattered along straight line could be observed in the predicted (software calculated) versus actual (experimental) values plot shown in
Figure 9b. This confirmed that the model is very well designated. A non-clear pattern and randomly scattered data as required was observed in the residual versus predicted values plot (
Figure 9c). To measure the number of the standard deviation, an internally studentized residuals is calculated by taking the ratio between the residuals to that of the residuals of estimated standard deviation. The residual values are obtained by calculating the difference between measured and predicted values. The plot of residuals versus internally studentized residuals presented in
Figure 9d confirmed that all values lie within limits and that the model can be used to predict the response.
The one factor effect plot for nitrogen absorption has been depicted in
Figure 10. The one factor plot helps in predicting the behavior of each output by changing the respective input parameter. It can be noticed that increase in the dwell time from 1 h to 8 h results in increased nitrogen absorption values as shown in
Figure 10d–f. The increase in sintering temperature also resulted in increased nitrogen absorption and can be observed in
Figure 10a–c.
The two-dimensional representation of nitrogen absorption for the selected parameters is shown by the contour plot presented in
Figure 11a. The nitrogen absorption values indicated in the middle of each contour increases linearly from the first to the last contour. The influence of sintering parameters on nitrogen absorption in the form of a three-dimensional (3D) surface plot has been presented in
Figure 11b. The plot shows that nitrogen absorption increases with increase of sintering temperature and dwell time.
3.2. Influence of Input Parameters on Density
The ANOVA table indicating the contribution of each factor on density is presented in
Table 6. It signifies the significance of the model since “Prob > F” value is 0.0001. The table also shows that the factors St and Dt are significant model terms with “Prob > F” values <0.05.
The value of 0.7315 for predicted R-square indicates that it lies within acceptable range to that of adjusted R-square as shown in
Table 7. The value “Adeq precision” of 16.423 is good for a suitable signal indicating that the model can be employed to navigate the design space.
The normal probability plot of the residuals plot shows that nearly all the data lies along a straight line as shown in
Figure 12a. A well fitted regression which scattered along straight line could be observed in the predicted (software calculated) versus actual (experimental) values plot shown in
Figure 12b. This confirmed that the selected terms are only significant factors and the errors are normally distributed. The residuals versus predicted values plot shows a randomly distributed data as shown in
Figure 12c. The studentized residuals of regression lines of residuals versus run plot lie within the limits as shown in
Figure 12d. This confirms the capability of the model to predict the density.
The one factor effect plot for density has been presented in
Figure 13. It can be observed that increased dwell time from 1 h to 8 h results in increased density value as shown in
Figure 13d–f. The increase in sintering temperature also has also a notable effect on the densification as can be seen in
Figure 13a–c.
The two-dimensional representation of density for the selected parameters is shown by the contour plot presented in
Figure 14a. The influence of sintering parameters on densification in the form of 3D surface plot has been presented in
Figure 14b. The plot shows that density increases with increase of sintering temperature and dwell time.
3.3. Influence of Input Parameters on Microhardness
The impact of process parameters on microhardness was determined using D-optimum design analysis. The analysis of variance (ANOVA) for microhardness has been presented in
Table 8. The model and the model terms with the values of “prob > F” less than 0.0500 are considered as significant terms. It can be noticed from the ANOVA table that the factors St and Dt are significant model terms for micro hardness. The model is expected to fit, the reason being the lack of fit “prob > F” value of 0.9126 employs that it is non-significant. The difference between adjusted R-square and predicted R-square shows that the terms are in reasonable agreement with each other as seen in
Table 9.
Most of the data was found to lie along straight line as observed in the plot of residuals for normal probability and can be seen in
Figure 15a. This indicated the selected model terms are only significant factors and the errors are normally distributed.
A well fitted regression which scattered along straight line could be observed in the predicted (software calculated) versus actual (experimental) values plot shown in
Figure 15b. This confirmed that the model is very well designated. A non-clear pattern and randomly scattered data as required was observed in the residual versus predicted values plot (
Figure 15c). To measure the number of the standard deviations between predicted and actual values, an internally studentized residuals is calculated by taking the ratio between the residuals to that of the residuals of estimated standard deviation. The residual values are obtained by calculating the difference between measured and predicted values. The plot of residuals versus internally studentized residuals shown in
Figure 15d verified that the model can be used to predict the response, due to the absence of any outlier and all the values lie within the limits.
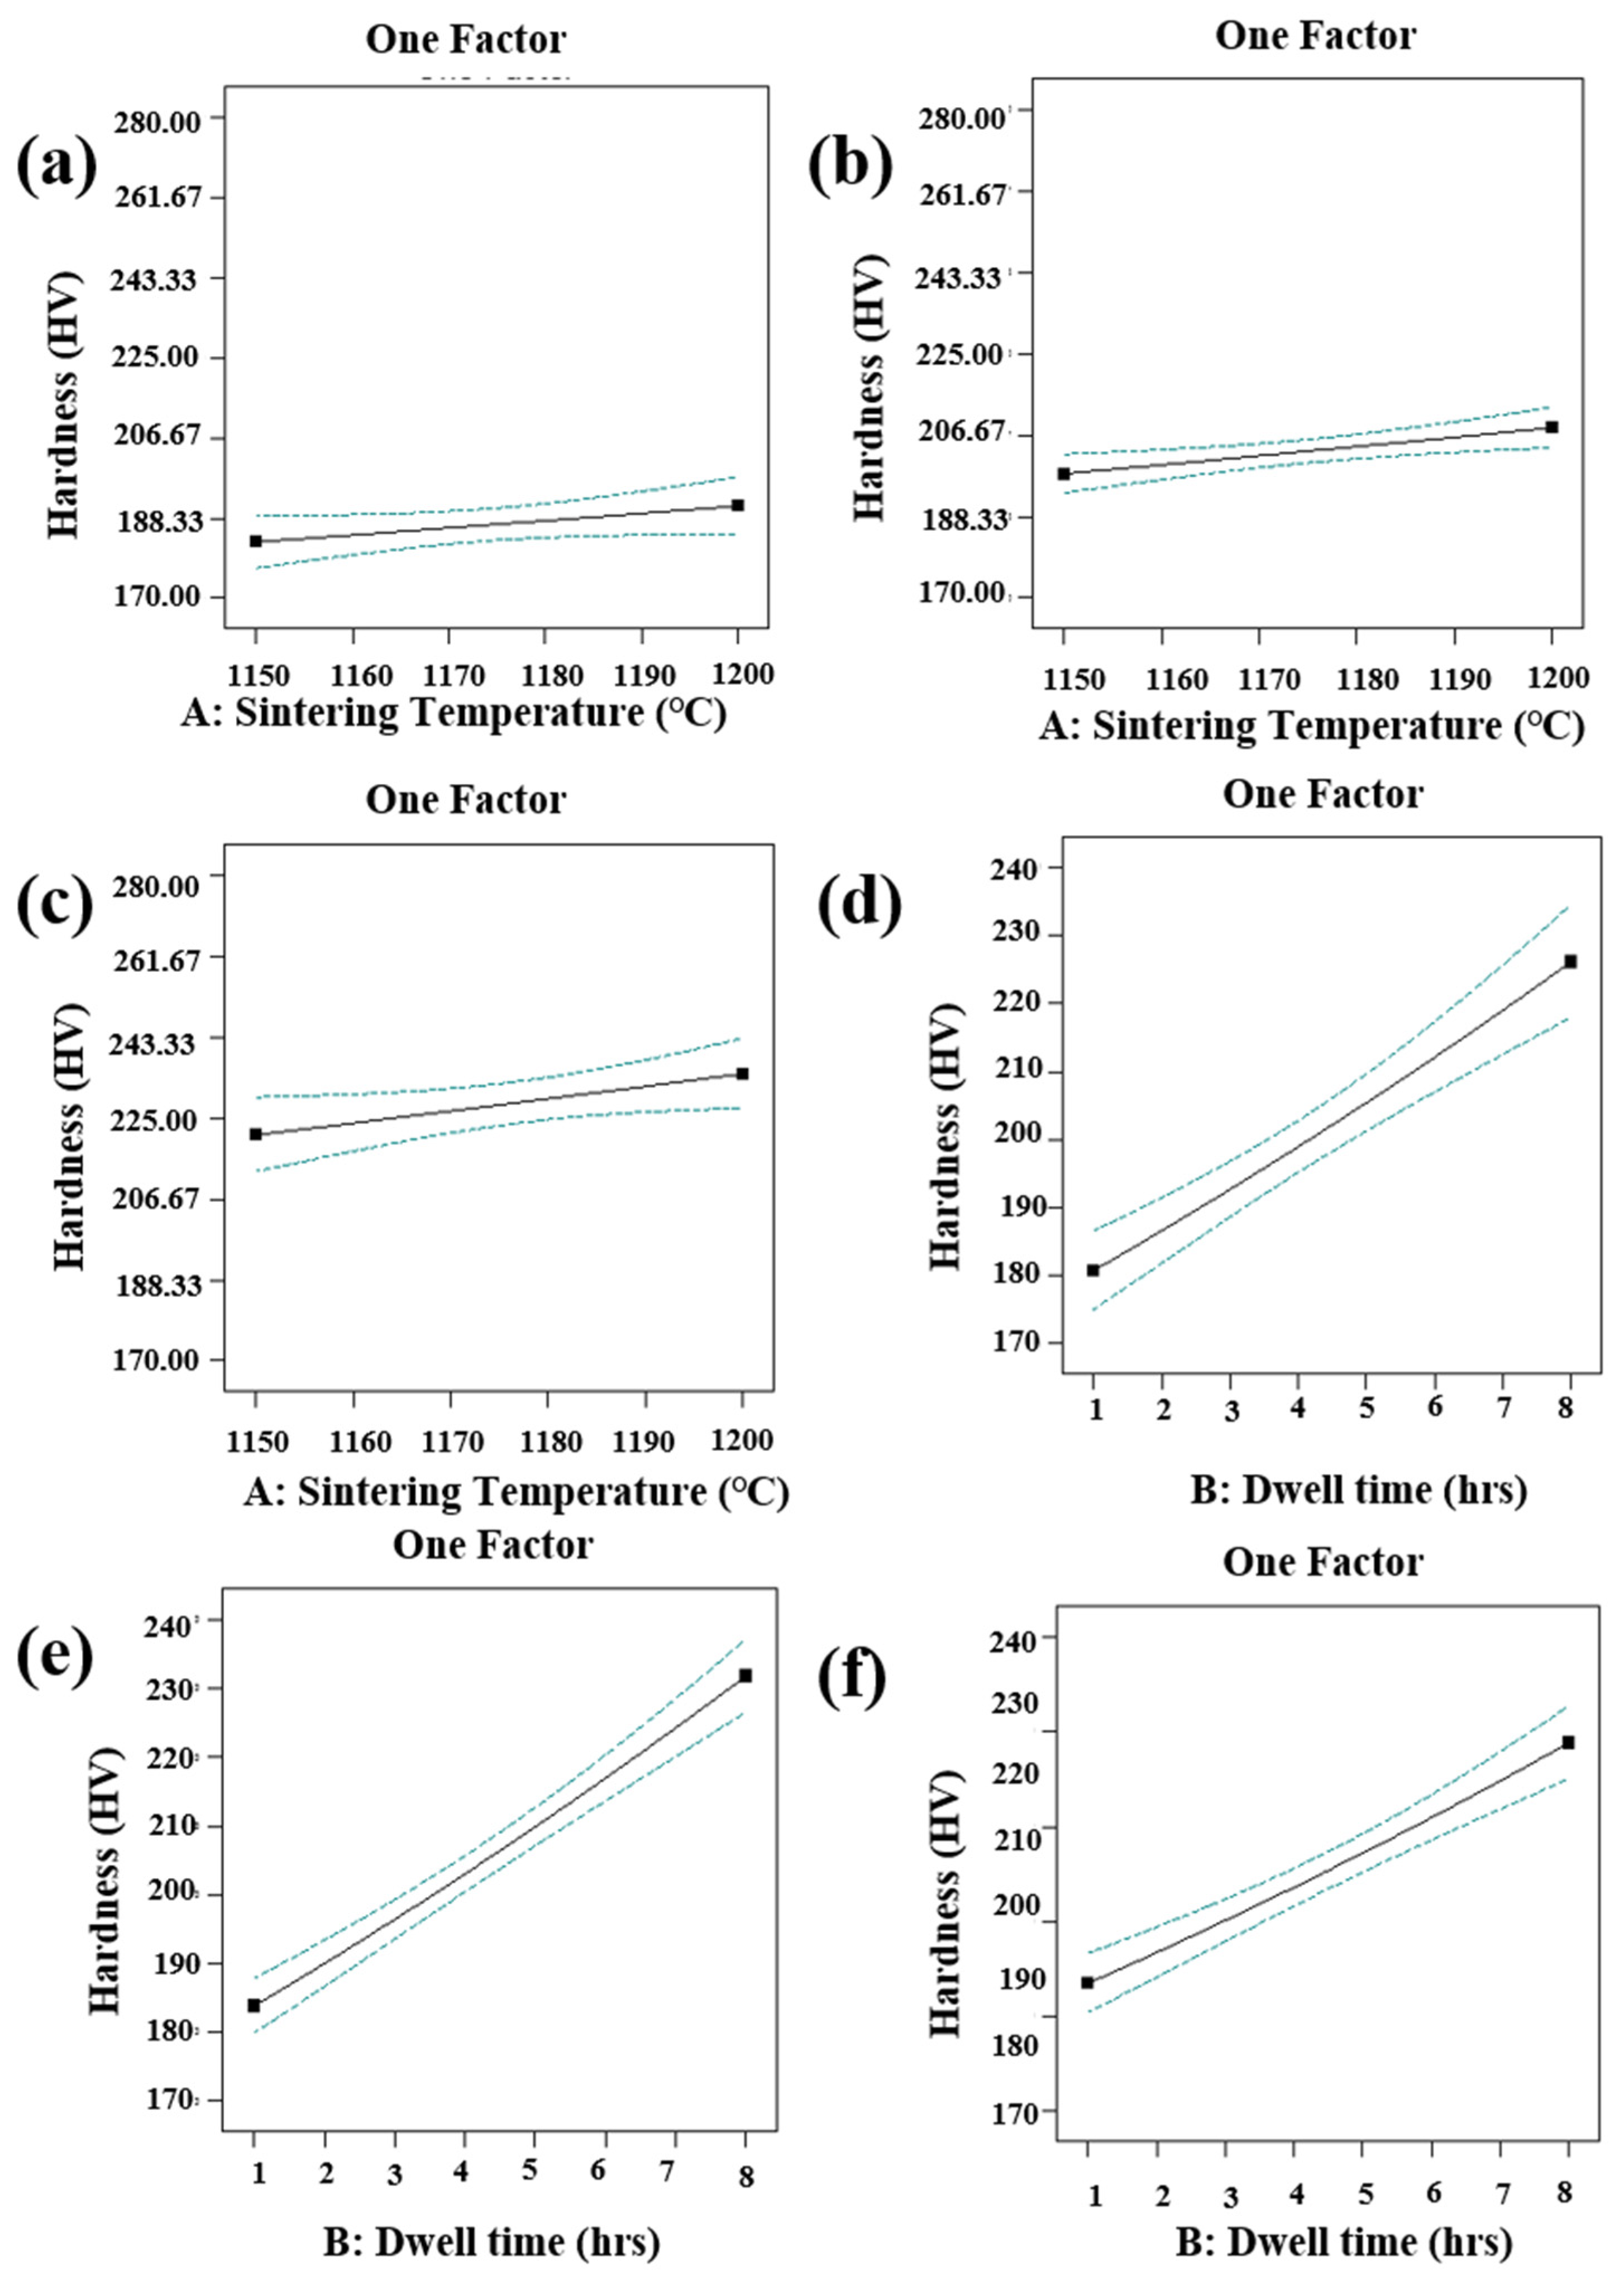
The one factor effect plot for micro hardness has been depicted in
Figure 16. It can be noticed that increase in the dwell time from 1 h to 8 h results in increased micro hardness values as shown in
Figure 16d–f. The increase in sintering temperature also has a notable effect on the increased nitrogen absorption as can be seen in
Figure 16a–c.
The two-dimensional representation of micro hardness for the selected parameters is shown by the contour plot presented in
Figure 17a. The nitrogen absorption values indicated in the middle of each contour increases linearly from the first to the last contour. The influence of sintering parameters on microhardness in the form of 3D surface plot has been presented in
Figure 17b. The plot shows that nitrogen absorption increases with increase of sintering temperature and dwell time.
4. Modelling of Responses
The ANOVA tables discussed in the previous sections developed the equations which relate the responses nitrogen absorption (N-abs), density (D) and micro hardness (HV) and the input parameters. The final predicted model equations in terms of the actual factors for N-abs, D and HV are presented in the equations below.
4.1. Predicted Model Equation for Nitrogen Absorption
The predicted model equation for nitrogen absorption from the analysis has been presented in the Equation (1).
4.2. Predicted Model Equation for Density
The predicted model equation for density from the analysis has been presented in Equation (2).
4.3. Predicted Model Equation for Microhardness
The predicted model equation for microhardness from the analysis has been presented in Equation (3).
5. Model Adequacy Test
The model summary statistics for each response was recorded, the details of which have been discussed below:
5.1. Model Adequacy Test for Nitrogen Absorption
The model summary statistics for nitrogen absorption have been given in
Table 10. It can be observed that the linear model for nitrogen absorption has been suggested by the design expert software.
5.2. Model Adequacy Test for Density
The model summary statistics for density have been given in
Table 11. It can be observed that the linear and cubic models for density has been suggested by the design expert software.
5.3. Model Adequacy Test for Microhardness
The model summary statistics for micro hardness have been given in
Table 12. It can be observed that the linear model for micro hardness has been suggested by the software.
6. Optimization of the Responses
The optimization of the responses was obtained from the design expert software by considering the response value and desirability. The software suggested the optimum parameters combination. The details of the constraints and optimized responses are shown in
Table 13 and
Table 14 respectively.
7. Experimental Validation Study
The validation of the developed models for the responses (N-abs, D and HV) was carried out by a confirmation test using the same procedure as discussed above. Thus, it becomes possible to authenticate the developed mathematical models. The optimum parameter settings not only improve the quality but also in the industries by reducing parts production time and cost. Therefore, the development of optimum parameters settings plays a major role in this context.
The experimental results of this study were in close agreement with the predicted values of the responses between them and was less than 2% as shown in
Table 15.
8. Conclusions
This study analyzed and evaluated the results on the experimental application of modifying 316L stainless steel alloy surface with increased dwell time for simultaneous sintering and in situ surface nitriding. In this research, the feasibility of sintering process to simultaneously sinter and nitride the surface layer of 316L stainless steel alloy was tested and established successfully. The experimental results revealed that a significant amount of nitride layer was formed on the surface of the sintered samples. The XRD results revealed that the sintering parameters helped in diffusion of nitrogen into the matrix of 316L stainless steel. The diffusion resulted in the formation of nitrides of iron and carbon. The XPS results indicated the presence of nitrogen onto the surface of the sintered samples in the form of nitride layer. This nitride layer was also observed under optical microscope with a thickness of 6 μm. The nitrogen gas as sintering atmosphere, sintering temperature and increased dwell time for sintering of green compacts helped in increased properties of the samples. The nitrogen uptake increased the microhardness of the sintered samples by 27%. Nitrogen as the sintering atmosphere helped in nitrogen diffusion and surface nitriding of the sintered samples. Austenitic stainless steels have low hardness and wear resistance values, therefore, this nitride layer formation not only helps in improving surface layer but also increases the corrosion and wear resistance of the material. The best results in the form of densification, microhardness and nitrogen absorption were observed at 1200 °C and 8 h dwell time.
The influence of processing parameters on densification, microhardness, nitrogen absorption and spectroscopic properties were investigated. Further analysis to set the optimum parameters setting for surface nitriding has been carried out. The mathematical model and equations for numerical prediction of densification, micro hardness and nitrogen absorption were also developed.
The newly modified approach of simultaneous sintering and surface nitriding was successful in addressing the related issues of this material.
The model and equations developed can be used to estimate the theoretical values of such responses by the industries for the production of implants and medical devices with desired properties. Moreover, the confirmation tests revealed that the experimental results are in close agreement with the predicted values of the responses with an error of less than 2%. This indicates that the developed model and equations are helpful in predicting material behavior in terms of its improved properties.
Author Contributions
Conceptualization, S.A.; formal analysis, S.A.; funding acquisition, A.M.A.R.; methodology, S.A.; project administration, A.M.A.R. and R.A.M.; resources, S.W.A. and A.A.A.A.; supervision, A.M.A.R. and R.A.M.; writing—original draft, S.A.; writing—review and editing, Z.B., S.H. and M.A.A.R. All authors have read and agreed to the published version of the manuscript.
Funding
This research was funded by YUTP-Fundamental Research grant and “The APC was funded by YUTP FRG, cost center, 015LC0-164”.
Acknowledgments
The authors would like to acknowledge Universiti Teknologi PETRONAS, Malaysia and National University of Sciences and Technology (NUST), Islamabad, Pakistan for carrying out research and other facilities.
Conflicts of Interest
The authors declare no conflict of interest.
References
- Wiles, P. The classic: The surgery of the osteo-arthritic hip. Clin. Orthop. Relat. Res. 2003, 417, 3–16. [Google Scholar]
- Wiles, P. The surgery of the osteo-arthritic hip. Br. J. Surg. 1958, 45, 488–497. [Google Scholar] [CrossRef] [PubMed]
- Lo, K.H.; Shek, C.H.; Lai, J. Recent developments in stainless steels. Mater. Sci. Eng. R Rep. 2009, 65, 39–104. [Google Scholar] [CrossRef]
- Ali, S.; Rani, A.; Altaf, K.; Baig, Z. Investigation of Boron addition and compaction pressure on the compactibility, densification and microhardness of 316L Stainless Steel. IOP Conf. Ser. Mater. Sci. Eng. 2018, 344, 012023. [Google Scholar] [CrossRef]
- Disegi, J.; Eschbach, L. Stainless steel in bone surgery. Injury 2000, 31, D2–D6. [Google Scholar] [CrossRef]
- Dewidar, M. Influence of processing parameters and sintering atmosphere on the mechanical properties and microstructure of porous 316L stainless steel for possible hard-tissue applications. Int. J. Mech. Mech. Eng. 2012, 12, 10–24. [Google Scholar]
- Talha, M.; Behera, C.; Sinha, O. A review on nickel-free nitrogen containing austenitic stainless steels for biomedical applications. Mater. Sci. Eng. C 2013, 33, 3563–3575. [Google Scholar] [CrossRef]
- Alvarez, K.; Sato, K.; Hyun, S.; Nakajima, H. Fabrication and properties of Lotus-type porous nickel-free stainless steel for biomedical applications. Mater. Sci. Eng. C 2008, 28, 44–50. [Google Scholar] [CrossRef]
- Niinomi, M.; Nakai, M.; Hieda, J. Development of new metallic alloys for biomedical applications. Acta Biomater. 2012, 8, 3888–3903. [Google Scholar] [CrossRef]
- Muley, S.V.; Vidvans, A.N.; Chaudhari, G.P.; Udainiya, S. An assessment of ultra fine grained 316L stainless steel for implant applications. Acta Biomater. 2016, 30, 408–419. [Google Scholar] [CrossRef]
- Wong, J.Y.; Bronzino, J.D.; Peterson, D.R. Biomaterials: Principles and Practices; CRC Press: Boca Raton, FL, USA, 2012. [Google Scholar]
- Bronzino, J.D.; Peterson, D.R. Biomedical Engineering Fundamentals; CRC press: Boca Raton, FL, USA, 2014. [Google Scholar]
- Bronzino, J.D. Biomedical Engineering Handbook; CRC press: Boca Raton, FL, USA, 1999; Volume 2. [Google Scholar]
- Park, J.B. Biomaterials Science and Engineering; Springer Science & Business Media: Berlin, Germany, 2012. [Google Scholar]
- Saini, M.; Singh, Y.; Arora, P.; Arora, V.; Jain, K. Implant biomaterials: A comprehensive review. World J. Clin. Cases WJCC 2015, 3, 52. [Google Scholar] [CrossRef] [PubMed]
- Yang, K.; Ren, Y. Nickel-free austenitic stainless steels for medical applications. Sci. Technol. Adv. Mater. 2010, 11, 014105. [Google Scholar] [CrossRef] [PubMed]
- Cordeiro, J.M.; Beline, T.; Ribeiro, A.L.R.; Rangel, E.C.; da Cruz, N.C.; Landers, R.; Faverani, L.P.; Vaz, L.G.; Fais, L.M.; Vicente, F.B.; et al. Development of binary and ternary titanium alloys for dental implants. Dent. Mater. 2017, 33, 1244–1257. [Google Scholar] [CrossRef] [PubMed]
- Mirza, A.; King, A.; Troakes, C.; Exley, C. Aluminium in brain tissue in familial Alzheimer’s disease. J. Trace Elem. Med. Biol. 2017, 40, 30–36. [Google Scholar] [CrossRef] [PubMed]
- Vahter, M.; Berglund, M.; Åkesson, A.; Liden, C. Metals and women’s health. Environ. Res. 2002, 88, 145–155. [Google Scholar] [CrossRef]
- Bhola, R.; Bhola, S.M.; Mishra, B.; Olson, D.L. Corrosion in titanium dental implants/prostheses—A review. Trends Biomater. Artif. Organs 2011, 25, 34–46. [Google Scholar]
- Manam, N.; Harun, W.; Shri, D.; Ghani, S.; Kurniawan, T.; Ismail, M.; Ibrahim, M.H. Study of corrosion in biocompatible metals for implants: A review. J. Alloys Compd. 2017, 701, 698–715. [Google Scholar] [CrossRef]
- Chen, Q.; Thouas, G.A. Metallic implant biomaterials. Mater. Sci. Eng. R Rep. 2015, 87, 1–57. [Google Scholar] [CrossRef]
- Singh, R.; Dahotre, N.B. Corrosion degradation and prevention by surface modification of biometallic materials. J. Mater. Sci. Mater. Med. 2007, 18, 725–751. [Google Scholar] [CrossRef]
- Liu, X.; Chu, P.K.; Ding, C. Surface modification of titanium, titanium alloys, and related materials for biomedical applications. Mater. Sci. Eng. R Rep. 2004, 47, 49–121. [Google Scholar] [CrossRef]
- Dayss, E.; Leps, G.; Meinhardt, J. Surface modification for improved adhesion of a polymer–metal compound. Surf. Coat. Technol. 1999, 116, 986–990. [Google Scholar] [CrossRef]
- Huang, Y.; Qu, Y.; Yang, B.; Li, W.; Zhang, B.; Zhang, X. In vivo biological responses of plasma sprayed hydroxyapatite coatings with an electric polarized treatment in alkaline solution. Mater. Sci. Eng. C 2009, 29, 2411–2416. [Google Scholar] [CrossRef]
- Ali, S.; Rani, A.; Majdi, A.; Mufti, R.A.; Hastuty, S.; Hussain, M.; Shehzad, N.; Baig, Z.; Aliyu, A.; Azeez, A. An Efficient Approach for Nitrogen Diffusion and Surface Nitriding of Boron-Titanium Modified Stainless Steel Alloy for Biomedical Applications. Metals 2019, 9, 755. [Google Scholar] [CrossRef]
- Ali, S.; Rani, A.; Majdi, A.; Mufti, R.A.; Azam, F.I.; Hastuty, S.; Baig, Z.; Hussain, M.; Shehzad, N. The Influence of Nitrogen Absorption on Microstructure, Properties and Cytotoxicity Assessment of 316L Stainless Steel Alloy Reinforced with Boron and Niobium. Processes 2019, 7, 506. [Google Scholar] [CrossRef]
- Ali, S.; Rani, A.M.; Altaf, K.; Hussain, P.; Prakash, C.; Hastuty, S.; Rao, T.V.; Subramaniam, K. Investigation of Alloy Composition and Sintering Parameters on the Corrosion Resistance and Microhardness of 316L Stainless Steel Alloy. In Advances in Manufacturing II; Springer: Cham, Switzerland, 2019; pp. 532–541. [Google Scholar]
Figure 1.
SEM (a) and EDX (b) of 316L stainless steel powder.
Figure 1.
SEM (a) and EDX (b) of 316L stainless steel powder.
Figure 2.
XRD spectrum of 316L stainless steel powder.
Figure 2.
XRD spectrum of 316L stainless steel powder.
Figure 3.
XRD spectra of sintered samples at different dwell times.
Figure 3.
XRD spectra of sintered samples at different dwell times.
Figure 4.
XPS analysis of sintered samples at different dwell times.
Figure 4.
XPS analysis of sintered samples at different dwell times.
Figure 5.
Microstructure of the sintered samples.
Figure 5.
Microstructure of the sintered samples.
Figure 6.
FESEM-EDS elemental maps for sample sintered at 8 h dwell time.
Figure 6.
FESEM-EDS elemental maps for sample sintered at 8 h dwell time.
Figure 7.
Surface nitride layer of sintered samples.
Figure 7.
Surface nitride layer of sintered samples.
Figure 8.
Microhardness values of sintered samples at varying dwell times.
Figure 8.
Microhardness values of sintered samples at varying dwell times.
Figure 9.
(a) Normal plot of residuals (b) predicted vs. actual plot (c) residuals vs. predicted plot (d) residuals vs. run plot.
Figure 9.
(a) Normal plot of residuals (b) predicted vs. actual plot (c) residuals vs. predicted plot (d) residuals vs. run plot.
Figure 10.
One factor effect plot for nitrogen absorption.
Figure 10.
One factor effect plot for nitrogen absorption.
Figure 11.
Contour and three-dimensional (3D) plots of nitrogen absorption.
Figure 11.
Contour and three-dimensional (3D) plots of nitrogen absorption.
Figure 12.
(a) Normal plot of residuals (b) predicted vs. actual plot (c) residuals vs. predicted plot (d) residuals vs. run plot.
Figure 12.
(a) Normal plot of residuals (b) predicted vs. actual plot (c) residuals vs. predicted plot (d) residuals vs. run plot.
Figure 13.
One factor effect plot for density.
Figure 13.
One factor effect plot for density.
Figure 14.
Contour and 3D plots of density.
Figure 14.
Contour and 3D plots of density.
Figure 15.
(a) Normal plot of residuals (b) predicted vs. actual plot (c) residuals vs. predicted plot (d) residuals vs. run plot.
Figure 15.
(a) Normal plot of residuals (b) predicted vs. actual plot (c) residuals vs. predicted plot (d) residuals vs. run plot.
Figure 16.
One factor effect plot for micro hardness.
Figure 16.
One factor effect plot for micro hardness.
Figure 17.
Contour and 3D plots of microhardness.
Figure 17.
Contour and 3D plots of microhardness.
Table 1.
Chemical composition of 316L stainless steel powder used in the study.
Table 1.
Chemical composition of 316L stainless steel powder used in the study.
| Element | C | Si | O | Mn | Ni | Cr | Mo | Fe |
|---|
| wt.% | 0.028 | 0.9 | 0.068 | 1.5 | 12.01 | 17.04 | 2.4 | Balance |
Table 2.
Particle size distribution of 316L stainless steel powder.
Table 2.
Particle size distribution of 316L stainless steel powder.
| Particle Distribution | D10 | D50 | D90 |
|---|
| Particle size (μm) | 3.98 | 10.27 | 19.61 |
Table 3.
Design of Experiments (DOE) matrix and experimental results for the responses.
Table 3.
Design of Experiments (DOE) matrix and experimental results for the responses.
| Run Order | Sintering Temperature (°C) | Dwell Time (hours) | Nitrogen Absorption (%) | % of Theoretical Density | Sintered Density (g/cm3) | Micro Hardness (HV) |
|---|
| 1 | 1150 | 5 | 1.61 | 92.74 | 7.410 | 203 |
| 2 | 1200 | 1 | 1.04 | 92.01 | 7.352 | 185 |
| 3 | 1156 | 8 | 2.41 | 93.82 | 7.497 | 229 |
| 4 | 1150 | 5 | 1.61 | 92.74 | 7.410 | 203 |
| 5 | 1178 | 8 | 2.56 | 94.11 | 7.520 | 231 |
| 6 | 1158 | 3 | 1.10 | 92.20 | 7.367 | 196 |
| 7 | 1200 | 5 | 1.93 | 94.80 | 7.575 | 210 |
| 8 | 1175 | 3 | 1.20 | 92.30 | 7.375 | 197 |
| 9 | 1175 | 3 | 1.20 | 92.30 | 7.375 | 197 |
| 10 | 1178 | 8 | 2.56 | 94.11 | 7.520 | 231 |
| 11 | 1200 | 5 | 1.61 | 94.80 | 7.575 | 231 |
| 12 | 1167 | 1 | 0.98 | 91.73 | 7.330 | 182 |
| 13 | 1192 | 3 | 1.26 | 92.35 | 7.379 | 198 |
| 14 | 1175 | 3 | 1.20 | 92.30 | 7.375 | 197 |
| 15 | 1200 | 8 | 2.82 | 94.80 | 7.575 | 235 |
| 16 | 1150 | 1 | 0.96 | 91.58 | 7.318 | 180 |
Table 4.
ANOVA for nitrogen absorption.
Table 4.
ANOVA for nitrogen absorption.
| Source | Sum of Squares | df | Mean Square | F Value | p-Value
Prob > F | Significance |
|---|
| Model | 2.03 | 5 | 0.41 | 154.42 | <0.0001 | significant |
| A-St | 0.024 | 1 | 0.024 | 9.25 | 0.0125 | |
| B-Dt | 1.82 | 1 | 1.82 | 689.78 | <0.0001 | |
| AB | 6.5 × 10⁻⁴ | 1 | 6.5 × 10⁻⁴ | 0.25 | 0.6298 | |
| A2 | 9.91 × 10⁻³ | 1 | 9.91 × 10⁻³ | 3.77 | 0.0810 | |
| B2 | 9.93 × 10⁻³ | 1 | 9.93 × 10⁻³ | 3.77 | 0.0808 | |
| Residual | 0.026 | 10 | 2.63 × 10⁻³ | | | |
| Lack of fit | 9.9 × 10⁻³ | 5 | 1.98 × 10⁻³ | 0.60 | 0.7039 | not significant |
| Pure Error | 0.016 | 5 | 3.28 × 10⁻³ | | | |
| Cor Total | 2.06 | 15 | | | | |
Table 5.
Predicted R-square vs. adjusted R-square.
Table 5.
Predicted R-square vs. adjusted R-square.
| Std. Dev. | 0.051 | R-squared | 0.9872 |
| Mean | 0.42 | Adj R-squared | 0.9808 |
| C.V.% | 12.19 | Pred R-squared | 0.9731 |
| PRESS | 0.055 | Adeq Precision | 35.175 |
| −2 Log Likelihood | −57.14 | | |
Table 6.
ANOVA for density.
Table 6.
ANOVA for density.
| Source | Sum of Squares | df | Mean Square | F Value | p-Value
Prob > F | Significance |
|---|
| Model | 2.132 × 10⁻³ | 5 | 4.264 × 10⁻⁴ | 23.66 | <0.0001 | significant |
| A-St | 3.695 × 10⁻⁴ | 1 | 3.695 × 10⁻⁴ | 20.50 | 0.0011 | |
| B-Dt | 1.457 × 10⁻³ | 1 | 1.457 × 10⁻³ | 80.83 | <0.0001 | |
| AB | 3.56 × 10⁻⁵ | 1 | 3.568 × 10⁻⁵ | 1.98 | 0.1897 | |
| A2 | 6.941 × 10⁻⁵ | 1 | 6.941 × 10⁻⁵ | 3.85 | 0.0781 | |
| B2 | 2.847 × 10⁻⁵ | 1 | 2.847 × 10⁻⁵ | 1.58 | 0.2374 | |
| Residual | 1.802 × 10⁻⁴ | 10 | 1.802 × 10⁻⁵ | | | |
| Lack of fit | 1.802 × 10⁻⁴ | 5 | 3.604 × 10⁻⁵ | | | |
| Pure Error | 0.000 | 5 | 0.000 | | | |
| Cor Total | 2.312 × 10⁻³ | 15 | | | | |
Table 7.
Predicted R-square vs. adjusted R-square.
Table 7.
Predicted R-square vs. adjusted R-square.
| Std. Dev. | 4.24 × 10⁻³ | R-squared | 0.9221 |
| Mean | 2.01 | Adj R-squared | 0.8831 |
| C.V.% | 0.21 | Pred R-squared | 0.7315 |
| PRESS | 6.209 × 10⁻⁴ | Adeq Precision | 16.423 |
| −2 Log Likelihood | −136.90 | | |
Table 8.
ANOVA for microhardness.
Table 8.
ANOVA for microhardness.
| Source | Sum of Squares | df | Mean Square | F Value | p-Value
Prob > F | Significance |
|---|
| Model | 0.12 | 3 | 0.039 | 71.38 | <0.0001 | significant |
| A-St | 5.825 × 10⁻³ | 1 | 5.825 × 10⁻³ | 10.58 | 0.0069 | |
| B-Dt | 0.11 | 1 | 0.11 | 192.71 | <0.0001 | |
| AB | 9.377 × 10⁻⁵ | 1 | 9.377 × 10⁻⁵ | 0.17 | 0.6871 | |
| A2 | 6.607 × 10⁻³ | 12 | 5.506 × 10⁻⁴ | | | |
| B2 | 2.065 × 10⁻³ | 7 | 2.950 × 10⁻⁴ | 0.31 | 0.9126 | not significant |
| Residual | 4.542 × 10⁻³ | 5 | 9.084 × 10⁻⁴ | | | |
| Lack of fit | 0.12 | 15 | 0.039 | | | |
| Pure Error | 0.12 | 3 | 5.825 × 10⁻³ | | | |
| Cor Total | 5.825 × 10⁻³ | 1 | | | | |
Table 9.
Predicted R-square vs. adjusted R-square.
Table 9.
Predicted R-square vs. adjusted R-square.
| Std. Dev. | 0.023 | R-squared | 0.9469 |
| Mean | 5.33 | Adj R-squared | 0.9337 |
| C.V.% | 0.44 | Pred R-squared | 0.9055 |
| PRESS | 0.012 | Adeq Precision | 24.226 |
| −2 Log Likelihood | −79.27 | | |
Table 10.
Model summary statistics for nitrogen absorption.
Table 10.
Model summary statistics for nitrogen absorption.
| Source | Std. Dev. | R-Squared | Adjusted R-Squared | Predicted R-Squared | PRESS | |
|---|
| Linear | 0.059 | 0.9778 | 0.9743 | 0.9665 | 0.069 | suggested |
| 2FI | 0.061 | 0.9787 | 0.9733 | 0.9584 | 0.086 | |
| Quadratic | 0.051 | 0.9872 | 0.9802 | 0.9731 | 0.055 | |
| Cubic | 0.053 | 0.9919 | 0.9798 | 0.9323 | 0.14 | |
| Quartic | 0.057 | 0.9920 | 0.9761 | | + | Aliased |
Table 11.
Model summary statistics for density.
Table 11.
Model summary statistics for density.
| Source | Std. Dev. | R-Squared | Adjusted R-Squared | Predicted R-Squared | PRESS | |
|---|
| Linear | 5 × 10⁻³ | 0.8590 | 0.8373 | 0.7864 | 4 × 10⁻⁴ | suggested |
| 2FI | 4 × 10⁻³ | 0.8741 | 0.8427 | 0.7751 | 5 × 10⁻⁴ | |
| Quadratic | 4 × 10⁻³ | 0.9221 | 0.8831 | 0.7315 | 6 × 10⁻⁴ | |
| Cubic | 6 × 10⁻⁴ | 0.9988 | 0.9969 | 0.5274 | 1 × 10⁻³ | suggested |
| Quartic | 0.000 | 1.0000 | 1.0000 | | + | Aliased |
Table 12.
Model summary statistics for microhardness.
Table 12.
Model summary statistics for microhardness.
| Source | Std. Dev. | R-Squared | Adjusted R-Squared | Predicted R-Squared | PRESS | |
|---|
| Linear | 0.023 | 0.9462 | 0.9379 | 0.9182 | 0.010 | suggested |
| 2FI | 0.023 | 0.9469 | 0.9337 | 0.9055 | 0.012 | |
| Quadratic | 0.025 | 0.9509 | 0.9264 | 0.8740 | 0.016 | |
| Cubic | 0.028 | 0.9633 | 0.9083 | 0.7729 | 0.028 | |
| Quartic | 0.030 | 0.9635 | 0.8906 | | + | Aliased |
Table 13.
Constraints of the process.
Table 13.
Constraints of the process.
| Constraints |
|---|
| Name | Goal | Lower Limit | Upper Limit | Lower Weight | Upper Weight | Importance |
|---|
| A: St | is in range | 1150 | 1200 | 1 | 1 | 3 |
| B: Dt | is in range | 1 | 8 | 1 | 1 | 3 |
| N-abs | maximize | 0.96 | 2.82 | 1 | 1 | 5 |
| D | maximize | 7.318 | 7.575 | 1 | 1 | 3 |
| HV | maximize | 180 | 235 | 1 | 1 | 4 |
Table 14.
Suggested solutions for maximum output.
Table 14.
Suggested solutions for maximum output.
| Number | St | Dt | N-abs | D | HV | Desirability | |
|---|
| 1 | 1199.434 | 7.995 | 2.836 | 7.614 | 238.965 | 1.000 | Selected |
| 2 | 1199.751 | 7.956 | 2.823 | 7.615 | 238.740 | 1.000 | |
| 3 | 1200.000 | 8.000 | 2.850 | 7.617 | 239.178 | 1.000 | |
| 4 | 1199.226 | 7.981 | 2.825 | 7.612 | 238.795 | 1.000 | |
| 5 | 1199.946 | 7.956 | 2.827 | 7.616 | 2.8.797 | 1.000 | |
| 6 | 1199.631 | 7.999 | 2.842 | 7.615 | 239.057 | 1.000 | |
| 7 | 1198.868 | 7.999 | 2.827 | 7.611 | 238.836 | 1.000 | |
| 8 | 1199.537 | 7.966 | 2.823 | 7.614 | 238.757 | 1.000 | |
| 9 | 1198.588 | 7.999 | 2.821 | 7.609 | 238.752 | 1.000 | |
| 10 | 1199.819 | 7.986 | 2.839 | 7.616 | 239.012 | 1.000 | |
| 11 | 1197.444 | 8.000 | 2.799 | 7.603 | 238.418 | 0.995 | |
Table 15.
Experimental validation of the responses.
Table 15.
Experimental validation of the responses.
| Response | Predicted | Experimental | % Error |
|---|
| N-abs | 2.84977 | 2.82 | 1.05 |
| D | 7.61741 | 7.575 | 0.55 |
| HV | 239.178 | 235 | 1.77 |
© 2020 by the authors. Licensee MDPI, Basel, Switzerland. This article is an open access article distributed under the terms and conditions of the Creative Commons Attribution (CC BY) license (http://creativecommons.org/licenses/by/4.0/).

 ,
, 


