Article

Thermodynamic Performance Analysis of Hydrofluoroolefins (HFO) Refrigerants in Commercial Air-Conditioning Systems for Sustainable Environment

1
Department of Mechanical Engineering, University of Engineering and Technology, Lahore 54890, Pakistan
2
Research Centre for Carbon Solutions, Heriot-Watt University, Edinburgh EH14 4AS, UK
3
Department of Engineering and Chemical Sciences, Karlstad University, Karlstad 65188, Sweden
4
School of Chemical & Materials Engineering, National University of Sciences & Technology, H-12, Islamabad 44000, Pakistan
5
Department of Mechanical Engineering & Design Group, School of Engineering and Applied Science, Aston University, Aston Triangle, Birmingham B4 7ET, UK
6
Department of Chemical and Process Engineering, Engineering Faculty, Yalova University, 77200 Yalova, Turkey
7
Sotacarbo S.p.A., Grande Miniera di Serbariu, 09013 Carbonia, Italy
*
Authors to whom correspondence should be addressed.
Processes 2020, 8(2), 187; https://doi.org/10.3390/pr8020187
Submission received: 30 December 2019 / Revised: 28 January 2020 / Accepted: 31 January 2020 / Published: 5 February 2020
(This article belongs to the Special Issue Progress in Energy Conversion Systems and Emission Control)

Abstract

:
Global warming is one of most severe environmental concerns that our planet is facing today. One of its causes is the previous generation of refrigerants that, upon release, remain in the atmosphere for longer periods and contribute towards global warming. This issue could potentially be solved by replacing the previous generation’s high global warming potential (GWP) refrigerants with environmentally friendly refrigerants. This scenario requires an analysis of new refrigerants for a comparison of the thermodynamic properties of the previously used refrigerants. In the present research, a numerical study was conducted to analyze the thermodynamic performance of specifically low GWP hydrofluoroolefens (HFO) refrigerants for an actual vapor compression refrigeration cycle (VCRC) with a constant degree of 3 K superheat. The output parameters included the refrigeration effect, compressor work input, the coefficient of performance (COP), and the volumetric refrigeration capacity (VRC), all of which were calculated by varying the condenser pressure from 6 to 12 bars and vapor pressure from 0.7 to 1.9 bars. Results showed that R1234ze(Z) clearly possessed the desired thermodynamic performance. The drop in refrigeration effect for R1234ze(Z) was merely 14.6% less than that of R134a at a 12 bar condenser pressure; this was minimum drop among candidate refrigerants. The drop in the COP was the minimum for R1234ze(Z)—5.1% less than that of R134a at a 9 bar condenser pressure and 4.7% less than that of R134a at a 1.9 bar evaporator pressure, whereas the COP values of the other refrigerants dropped more drastically at higher condenser pressures. R1234ze(Z) possessed favorable thermodynamic characteristics, with a GWP of 7, and it can serve as an alternative refrigerant for refrigeration systems for a sustainable environment.

1. Introduction

Global warming is one of most severe environmental concerns that our planet is facing today. One of its causes is the previous generation of refrigerant gases and carbon dioxide emissions [1,2,3]. Upon release, these gases remain in the atmosphere for longer periods and contribute towards global warming [4]. The severity of these gases’ environment impacts is determined by their life cycle analysis (LCA) [5] and the conversion efficiency of refrigeration systems [6]. Due to global warming, Earth’s temperature is expected rise 2.5–10 degrees Fahrenheit over the period of the next 100 years [7]. This will affect agriculture, which will result in heavy precipitation patterns and rainfalls, more heat waves, and sea level can rise of 1–4 feet by the next century [8]. Therefore, the member countries of the Montreal Protocol during October, 2016, agreed to phase down hydrofluorocarbons (HFCs) and hydrochlorofluorocarbons (HCFCs) to reduce net earth warming by 0.5 °C by the year 2100 and to protect the ozone layer [9]. Chlorofluorocarbons (CFCs) and HCFCs were already depleting the ozone layer [10], so these were wiped out after the Montreal Protocol and the Kyoto Protocol, respectively [11]. Currently, the different refrigerants being used for domestic, automotive, commercial refrigeration and air-conditioning systems are mostly HFCs, i.e., R134a, R23, R404A, R407A, R410A, and R507A [12]. Though HFCs have zero ozone depletion potential (ODP), these still possess large global warming potential (GWP) values. R134a has a GWP of 1430, R23 has a GWP of 14800, R404A has a GWP of 3922, R410A has a GWP of 2088, R407A has a GWP of 2107, and R507A has a GWP of 3985 [13]. R22 was being used in the previous generation of commercial refrigeration systems, e.g., centrifugal chillers [14] and central air conditioning systems that are used in buildings [15], and the current generation is using R134a and R123 [16]. As per the safety classifications of refrigerants, R22 comes under the category of A1: very low toxicity and no flame propagation [17], but it has large GWP of 1810 [18]. R134a is a globally accepted refrigerant for various types of refrigeration systems [19]. It has a better safety rating compared with A1, and it has a low toxicity, no flame propagation, and a GWP around 1430 [20]. It is also an HFC and will be phased down 100% by 2034 [21]. R123 is used in chillers due to its high thermodynamic efficiency [22] and reduced possibility of leakages, but it is HCFC compound with a B1 classification, and it has been a cause of tumors in livers and pancreases due to long term inhalation and hence, it is expected to be phased out by 2025 [23]. Due to the large GWP values of the previous generation of refrigerants, the USA’s Environmental Protection Agency (EPA) has decided to systematically phase out HFCs to 50% by 2024, 80% by 2029, and 100% by 2034 [24]. Therefore, it is necessary to find substitute refrigerant for the sustainability of the environment [25] that should have a low GWP for minimum environmental impact. Table 1 shows properties of a few refrigerants and indicates that the heavier refrigerants R123, R1233zd(E) and R365mfc have higher normal boiling point (NBP) than the light refrigerants R134, R1234yf and R1234ze(E). Consequently, lighter refrigerants have a higher vapor pressure than heavier refrigerants, which is due to the interatomic bonding of molecules.
An experimental study of R450A, a R1234ze(Z)/R134a mixture, was reported as a drop-in replacement of R134a on vapor compression refrigeration (VCRC) with a variable speed compressor [32] and input parameters of evaporator and condenser temperature. The results showed an average 6% drop in the cooling capacity of R450A compared to R134a and an average 1% increase in the coefficient of performance (COP) compared to R134a [32]. The experimental setup of Organic Rankine Cycle (ORC) was used to investigate the applicability of HFO-1233zd(E) as a substitute working fluid of the previously used R245fa by comparing its efficiency and power output against its mass-flow rate, condensation temperature, and expander rotational speed. This showed R1233zd(E)’s thermal efficiency to be 6.92%, which was better than R245fa, but the maximal gross power output of R1233zd(E) was 12.17%, which was less than that of R245fa [33]. The thermal performance of an automotive air conditioning system was studied by using R152a, R1234yf, and R1234ze(Z), and this study analyzed the effect of compressor speed and condensing temperature on the thermodynamic performance of the system. The results showed that the COP of R1234yf remained highest of all over wide range of evaporating and condensing temperatures, and its cooling performance was similar to that of R134a [34]. The energy performance of two low GWP refrigerants R1234yf and R1234ze(Z) as drop-in replacements was evaluated by varying the value of the evaporating and condensing temperatures of a VCRC-based refrigeration system with/without an internal heat exchanger (IHX) [35]. The results showed that cooling capacity obtained with the R1234yf and R1234ze was decreased to 9% and 30% on average, the COP for R1234yf and R1234ze(Z) was 7% and 6% less than R134a, respectively, and the use of an IHX resulted in reduced differences between the two refrigerants [35]. The performance of various refrigerants, including R134a, R152a, and R1234yf, was analyzed by changing different thermodynamic performance parameters, including engine speed, while the evaporating and condensing temperatures were maintained constant at 5 and 50 °C, respectively. It was observed that the input power of R152a was 7.724%, 7.72% and 7.752% less than that of R134a, the COP of R152a showed a 5.33%, 5.16% and 4.92% improvement at engine speeds of 1000, 2000 and 3000 rpms, respectively, as compared to R134a and, hence, R152 [36]. An experimental analysis was conducted to analyze the energy consumption of R134a and R1234yf by running the system for 24 hours with different evaporator temperatures, and the results showed that low evaporating temperatures were observed in the case of R1234yd, the discharge pressure was 10% higher for R1234yf, and the evaporator pressures were almost the same for both refrigerants [37]. The performances of the three HFO and HC refrigerant mixtures R413A, R417A and R422A were studied by using REFPROP in a VCRC-based system for which the average COP values for R413A, R417A and R422A were found to be 4.2%, 9.0%, and 12.6%, respectively, less than those of R22, and the compressor discharge pressures of R417A and R413A were 12.0% and 28.5%, respectively, lower [38]. A study was conducted by analyzing a comprehensive database of refrigerants while considering chemical safety, miscibility with copper tubes used in refrigeration, miscibility with oil used in compressor, zero-to-low toxicity, and non-corrosiveness; this study concluded that a limited number of refrigerants have these above-mentioned characteristics. Due to safety considerations, some blends could also be used if a pure refrigerant could not show all of desirable properties [39]. The suitability of HFO-1234yf and HFO-1234ze as potential alternatives to R134a was studied by using the MATLAB software package, which showed that a small amount of mixing with these refrigerants improved performance without significantly increasing the GWP [40]. The results also showed that the COP of the mixture decreased to 1.5% compared to R134a [40]. Different HFC and HFO refrigerants were analyzed experimentally by using a hermetic compressor under the same working conditions, and it was shown that R290 achieved the best results for cooling capacity and the COP and R152a showed average reduction in cooling capacity and power consumed by compressor; hence, the COP was increased by 1–4.8% [41]. R1234yf and R1234ze(E) were analyzed experimentally as potential replacements for R134 by using a vending machine and two ambient temperatures of 32.2 and 40.5 °C; the results showed that R1234yf showed the closest performance to R134a compared to R1234ze(E) [42]. Possibilities for low GWP refrigerants were studied by applying the screening criteria of flammability, toxicity, and critical temperature; 1200 candidate fluids, including halogenated olefins, fluids having oxygen, nitrogen and carbon dioxide, were analyzed, and the results showed that, when considering thermodynamics properties, flammability and toxicity, no fluid possesses the characteristics of an ideal fluid and all candidate fluids have some tradeoffs associated [43]. The criteria for the acceptance of alternative refrigerants, including the chemical stability of refrigerant, toxicity, flammability, and volumetric efficiency, was discussed [44]. A study was conducted to look for alternative refrigerants with low or ultra-low GWPs for the environmentally sustainable use of mobile and residential air conditioners (for which HFOs were considered), but most of these refrigerants possessed a low volumetric capacity, mild toxicity and flammability; hence, choices for a suitable HFO refrigerant were considered to be limited [45]. Prior research work regarding the thermodynamic performance of specifically low GWP HFO refrigerants with constraints of toxicity and flammability against evaporator and condenser pressures of commercial refrigeration systems is limited. There are important parameters to extend the research by examining the performance of these HFO refrigerants over a range of these parameters.
The present study examines the thermodynamic performance of these HFO refrigerants. Mathematical modeling in Engineering Equation Solver (EES) was used with the input parameters of evaporator pressure and condenser pressure. Condenser pressure was enhanced from 6 to 12 bar, whereas evaporator pressure was increased from 0.7 to 1.9 bars with output parameters of refrigeration effect, compressor work input, the coefficient of performance (COP), and volumetric refrigeration capacity (VRC), all of which were examined for comparative performance analysis with R134a taken as the baseline refrigerant. This research will help in finding alternative refrigerants for the next generation of refrigeration systems that possess environmentally friendly characteristics and minimum drops in thermodynamic properties compared to previously used refrigerants for a sustainable environment.

2. Materials and Methods

2.1. Selection of Refrigerants

Table 2 compares the flammability and toxicity classifications of the refrigerants. These refrigerants have constraints in term of different categories, as shown in the table (ASHARE Standard 34). A1 category refrigerants have medium-to-large GWPs, whereas, if ultra-low GWP refrigerants are chosen, refrigerants become either highly flammable (A3) or highly toxic (B1 and B2).
These hydrocarbons possess excellent thermodynamics performance but are highly flammable. In the current scenario, fluids with no flammability possess a high GWP or am ultra-low GWP have a high flammability. This situation demands some suitable tradeoff between flammability and GWP. By carefully reviewing the wide range of pure refrigerants, zeotropic mixture refrigerants, azeotropic mixture refrigerants, a few refrigerants were selected for performance analyses. These refrigerants included R1233zd(E), R1234yf, R1234ze(Z), and R365mfc. All of these refrigerants had an ultra-low-to-low GWP of around 800. The GWP of R1233zd(E) was less than 150, which made it the most environmentally friendly refrigerant, and it is still classified as A1, with no flammability and non-toxicity.

2.2. Numerical Modeling of VCRC-Based Refrigeration System

In a VCRC-based system, a refrigerant is initially at evaporator pressure and is fed to compressor, which compresses it to condenser pressure, which is considerably higher than that of evaporator pressure. At this state, a refrigerant has a quite high temperature. This high temperature refrigerant is sent to a condenser to remove the heat of compression; as a result, the state of the refrigerant changes to a high pressure liquid. A filter drier is used to remove the moistness in the refrigerant, and it is allowed to expand. Due to a sudden reduction in pressure, the refrigerant changes into a vapor/liquid mixture. This low pressure vaporized refrigerant is passed into the evaporator and generates a refrigeration effect [47].
The HFO refrigerants that were selected were analyzed by using the software package Engineering Equation Solver EES V.9-644. The input parameters for analysis were condenser pressure, which was varied to 6, 9, and 12 bars, and evaporator pressure was varied to 0.7, 1.3, and 1.9 bars. Compressor size was taken to be 171.26 cm3.
Steady state conditions were assumed, and changes in potential energy, kinetic energy, and pressure drops across all the components of the refrigeration system were so small that their effects were neglected. A compressor with an isentropic efficiency of 0.75 was considered for study [48], and the angular speed of the compressor was taken to be 3000 rpm. A constant degree of superheat and a sub-cooling of 3 K were assumed. The process of expansion in the throttling valve was considered to be isenthalpic [49].
A vapor compression refrigeration cycle with 3 K degrees of superheat/sub-cool is shown in Figure 1, and this cycle was used for this study. The thermodynamic states of the refrigerant are highlighted by state points (1, 2, 3, …, 7).
For this numerical study, four parameters were selected to evaluate the thermodynamic performance of the HFO refrigerants. Mathematical expressions are given for the output parameters.
Q e v a p   =   m · ( h 1     h 7 )
P c o m p   =   m · ( h 3     h 2 )
C O P   =   Q e v a p / P c o m p
V R C   =   m · ( h 1     h 7 ) / v 1
m   =   N 60 · D c o m p · ρ 1 · η v
where N is the compressor speed (rpm), Dcomp is the compressor displacement (m3/rev), ρ1 is the density of the refrigerant at the compressor inlet (kg/m3), and ηv is the compressor’s volumetric efficiency.
To determine the variation of the output parameters, Equations (1)–(4) were used. Similarly, to determine the output parameters’ variation compared to those of R134a, e.g., the refrigeration effect, compressor work input, and the COP, Equations (6)–(9) were used for Figure 5b to Figure 12b.
Q e v a p ,   i m p   =   Q e v a p ,   r e f Q e v a p ,   R 134 a Q e v a p ,   R 134 a
P c o m p , i m p   =   P c o m p , r e f P c o m p , R 134 a P c o m p , R 134 a
C O P i m p   =   C O P r e f C O P R 134 a C O P R 134 a
V R C i m p   =   V R C r e f V R C R 134 a V R C R 134 a

2.3. Comparison of EES Model Using Vapor Compression Refrigeration System

The thermodynamic characteristics of the refrigeration effect and compressor work input of present work were compared using the EES model with the published literature for the validation of the EES model. A study was conducted to analyze the performance of R1234yf as a potential replacement of the R134a refrigerant in which the condensing temperature and superheating degree were varied with and without use of an internal heat exchanger [50].
Two parameters of the present work, i.e., the refrigeration effect and the compressor power input, were compared to previous published work. Figure 2 shows a comparison of the R134a refrigeration effect and the compressor work input of the present study with that of the published literature at an evaporator temperature of 273.1 K, showing that the results of R134a were closer to that of previous work by J. Navarro-Esbri [50]. In the case of R134a, the refrigeration effect minimum error was 2.4% at a 333.1 K condenser temperature, and the maximum error was found to be 14.1% at a 313.1 K condenser temperature, which can be attributed to the thermophysical properties of the refrigerant and the assumptions that were considered for this numerical study.
Similarly, in the case of the compressor, the work input minimum error was 0.6%, as obtained at a 323.1 K condenser temperature, and the maximum error was 15.4% at a 333.1 K condenser temperature; again, these can be attributed to a continuous change in density during compression. From Figure 1, it is clear that errors in the refrigeration effect and compressor power input for R134a were found to be within limits and showed good agreement with already published work. Therefore, this EES model is validated and can be used for further analyses of different refrigerants that are used in this study.

2.4. Error Analysis of Results

An error analysis of the results was performed with the published literature for R134a on the same operating conditions, as shown in Figure 3. Two output parameters, the refrigeration effect and the compressor work input, were analyzed against published data. For both output parameters, the overall trends that were observed were similar to those of published data.
For the refrigeration effect, the maximum error found was 18% at a 10 bar condenser pressure, and the minimum error was observed to be 9.8% at a 16.8 bar condenser pressure, which can be attributed to assumptions for this numerical model. Similarly, for the compressor work, the input trends were overall the same compared to those of the published literature. The maximum error for the compressor work input found was 15% at a 10 bar condenser pressure, and the minimum error was observed to be 6.5% at a 13.8 bar condenser pressure. On average, the values of the output parameters remained within limits and showed good agreement with already published work.

2.5. Comparison of VCRC for HFO refrigerants

Figure 4 shows p–h plots for the HFO refrigerants R365mfc and R1233zd(E) that were examined in study. Saturation temperatures lines are shown against a 1.5 bar evaporator pressure and a 9 bar condenser pressure. All HFO refrigerants are azeotropic, as these refrigerants evaporate and condense at same temperature for a specific pressure. Refrigerants with temperature glides more than 2 K are considered zeotropic, and those having glides less than 2 K are considered to be azeotropic refrigerants [51]. The difference in the graphs of refrigerants is because of the refrigerants’ thermos-physical properties, and these properties are responsible for increases or decreases in a refrigerant’s thermodynamic behavior, e.g., the refrigeration effect at higher pressures. The saturation temperatures against a 1.5 bar evaporator pressure were found to be 324.7 K for R365mfc and 302 K for R1233zd(E). The refrigeration effect is a function of the enthalpy of vaporization, which is a difference of the enthalpies of the refrigerant leaving the evaporator and entering the evaporator. For R365mfc, this difference gets smaller as the condenser pressure gets higher, and, therefore, the refrigeration effect of R365mfc gets smaller; for R1233zd(E), this difference also causes a decrease, but this decrease is lesser than that of R365mfc.
Figure 5 show p–h plots for HFO refrigerants R1234ze(Z) and R1234yf. The saturation temperatures against a 1.5 bar evaporator pressure were found to be 253 K for R1234yf and 293 K for R1234ze(Z). The refrigeration effect is a function of the enthalpy of vaporization, which is a difference of the enthalpies of the refrigerant leaving the evaporator and entering the evaporator. This shape difference predicts the behavior of refrigerants at lower and higher condenser pressures. For R1234yf, this difference was quite large at a smaller condenser pressure, but, as it gets higher, the difference in the corresponding enthalpies gets smaller. For R1234ze(Z), this difference remained almost the same even at a higher condenser pressure, and, therefore, the refrigeration effect is not very affected at higher condenser pressures.

3. Results and Discussions

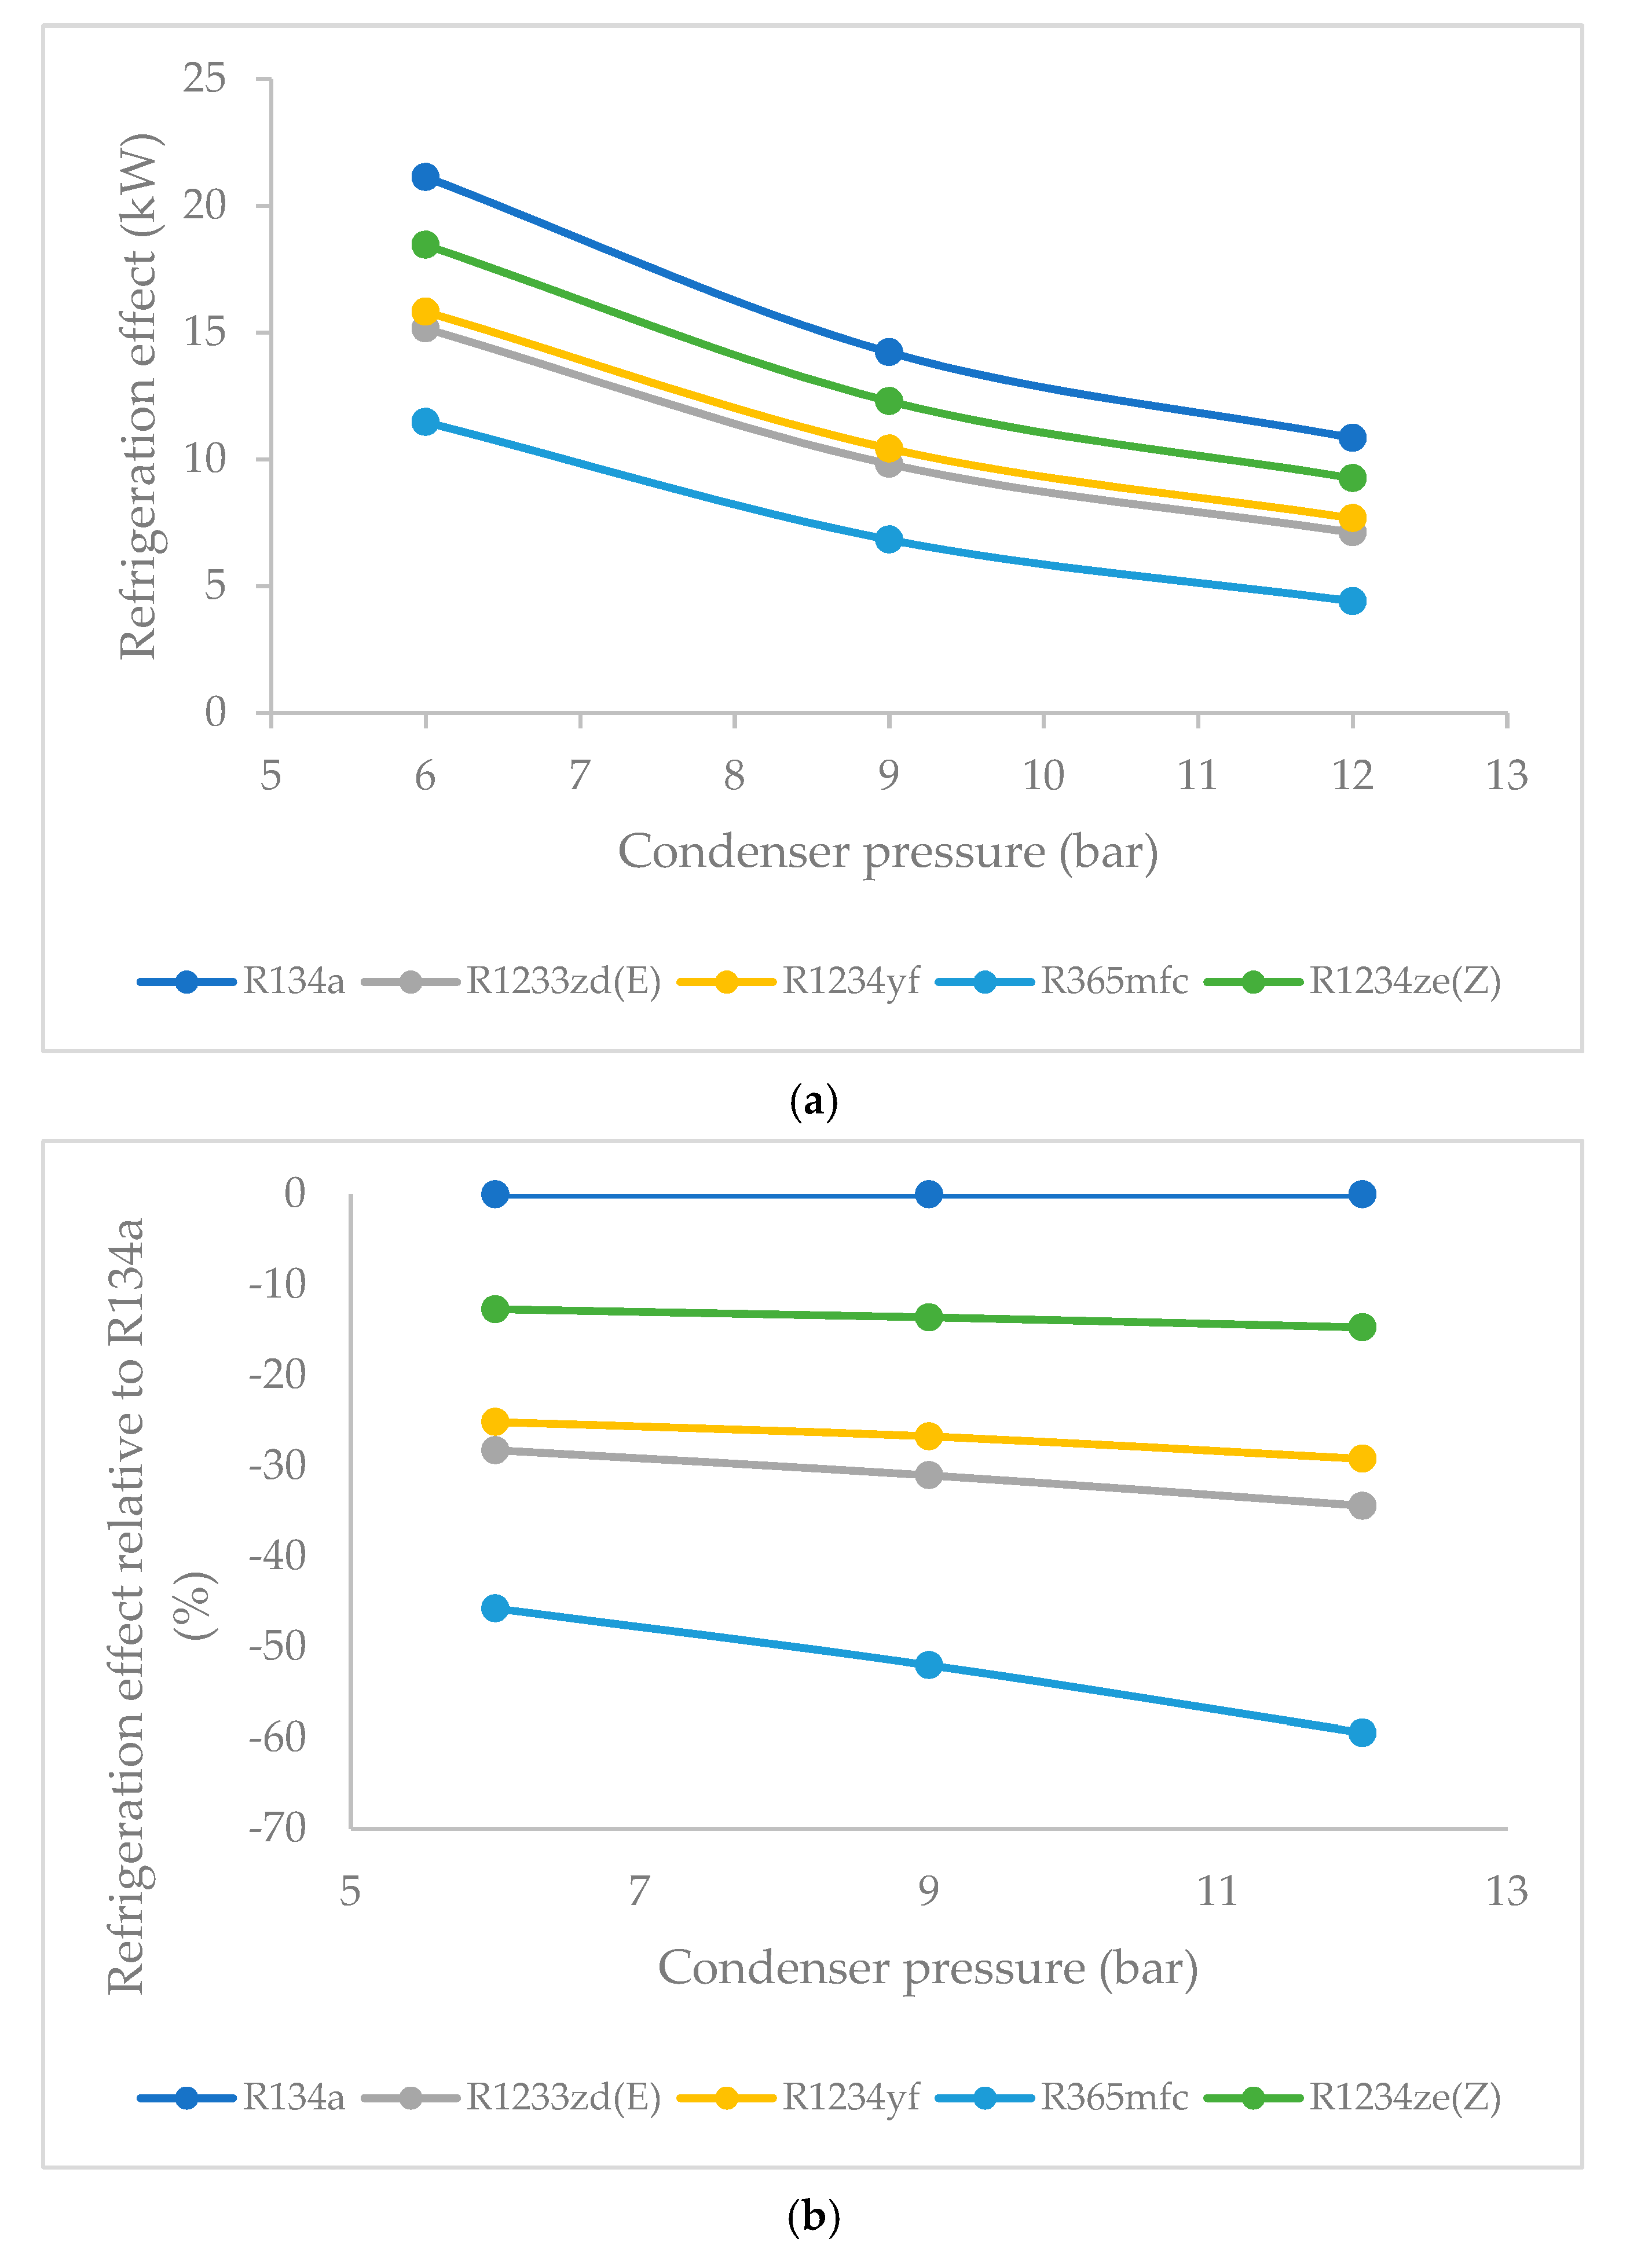
3.1. Effect of Condenser Pressure on Refrigeration Effect

As Figure 6a shows, the refrigeration effect is a function of condenser pressure. As the trend shows, R134a clearly possessed the highest refrigeration effect overall at all condenser pressures. The second refrigerant that performed closest to R134a was R1234ze(Z), which is an HFO refrigerant. The refrigeration effect of R1234ze(Z) was less than that of R134a and greater than that of all of other HFO refrigerants at all condenser pressures. R1233zd(E) fell midway between R1234ze(Z) and R365mfc. The refrigeration effect of R365mfc drastically decreased at higher condenser pressures. At Pcondenser = 6 bars, the maximum refrigeration effect of 21.1 kW was obtained in the case of R134a, 18.4 kW was obtained for R1234ze(Z), 15.82 kW was obtained for R1234yf, 15.16 kW was obtained for R1233zd(E), and 11.4 kW was obtained for R365mfc. R1234ze(Z) possessed the highest refrigeration effect among all HFO refrigerants. The trend remained the same at higher condenser pressures. At Pcondenser = 9 bars, the highest refrigeration effect after R134a was obtained for R1234ze(Z): 12.3 kW. It was followed by the refrigeration effect of R1234yf and R1233zd(E), which were 10.4 and 9.8 kW, respectively. The refrigeration effect of R365mfc was found to be the least among the HFO refrigerants: 6.8 kW.
Figure 6b shows the percentage variation in the refrigeration effect relative to that of R134a as a function of condenser pressure. As condenser pressure increased, the refrigeration effect decreased in general. The lowest decrease in the refrigeration effect was observed in the case of R1234ze(Z), and largest drop was observed for R365mfc at higher condenser pressures. At Pcondenser = 6 bars, the refrigeration effect of R1234ze(Z) was 12.6% less than that of R134a. In the case of R1234yf, the refrigeration effect was found to be 25% less than that of R134a, it was 28.2% less than that of R134a for R1233zd(E), and it was 45.7% less than that of R134a for R365mfc. Similarly, at Pcondenser = 9 bars, the trend remained the same, as the refrigeration effect of R1234ze(Z) was found to be 13.5% less than that of R134a, it was 26.7% less than that of R134a for R1234yf, it was 31% less than that of R134a for R1233zd(E), and it was 52% less than that of R134a for R365mfc. The performance of all other refrigerants decreased at higher condenser pressures except for that of R1234ze(Z). The refrigeration effect of R365mfc decreased to a larger extent than the other refrigerants.

3.2. Refrigeration Effect as a Function of Evaporator Pressure

Figure 7a shows the refrigeration effect as a function of the evaporator pressure. At a lower evaporator pressure, the highest refrigeration effect among the HFO refrigerants was observed for R1234ze(Z) followed by those of R1234yf and R1233zd(E). R365mfc had the lowest refrigeration effect among all refrigerants. This trend remained the same at higher evaporator pressures. At Pevaporator = 0.7 bars, the maximum refrigeration effect of 5.5 kW was obtained in the case of R134a. The second highest refrigeration effect was observed to be 4.6 kW for R1234ze(Z) and was followed by those of R1234yf and R1233zd(E), whose effects were 3.9 and 3.6 kW, respectively. For R365mfc, the lowest refrigeration effect was observed with 2.2 kW. R1234ze(Z) possessed highest refrigeration effect among all HFO refrigerants, and this trend remained the same at higher evaporator pressures. At Pevaporator = 1.3 bars, the highest refrigeration effect after R134a was obtained for R1234ze(Z): 10.1 kW. It was followed by the refrigeration effects of R1234yf and R1233zd(E), which were 8.6 and 8.0 kW, respectively. The refrigeration effect of R365mfc was found to be the least among the HFO refrigerants at 5.5 kW.
Figure 7 shows the percentage variation in the refrigeration effects relative to that of R134a as a function of evaporator pressure. As evaporator pressure increased, the refrigeration effect of all refrigerants increased and tended to approach that of the reference refrigerant R134a. The refrigeration effect for R1234ze(Z) increased steadily, while it increased rapidly for R365mfc, though it lagged behind all refrigerants at all evaporator pressures. At Pevaporator = 0.7 bar, the lowest drop in the refrigeration effect was observed for R1234ze(Z), being 15.5% less than that of R134a at the same evaporator pressure. In the case of R1234yf, it was 28.5% less than that of R134a, and for R1233zd(E), it was 34.2% less than that of R134a. R365mfc’s refrigeration effect was 59% less than that of R134a. Similarly, at Pevaporator = 1.3 bar, this drop in the refrigeration effect for R1234ze(Z) was 14%, which was the smallest drop among the HFO refrigerants. The refrigeration effect for R1234yf was 27% less than that of R134a, and it was 31.6% less than that of R134a for R1233zd(E). The refrigeration effect of R365mfc was 53% less than that of R134a at the same evaporator pressure. Therefore, for this parameter, the drop in the refrigeration effect was found to be the least for R1234ze(Z) compared to all other HFO refrigerants.

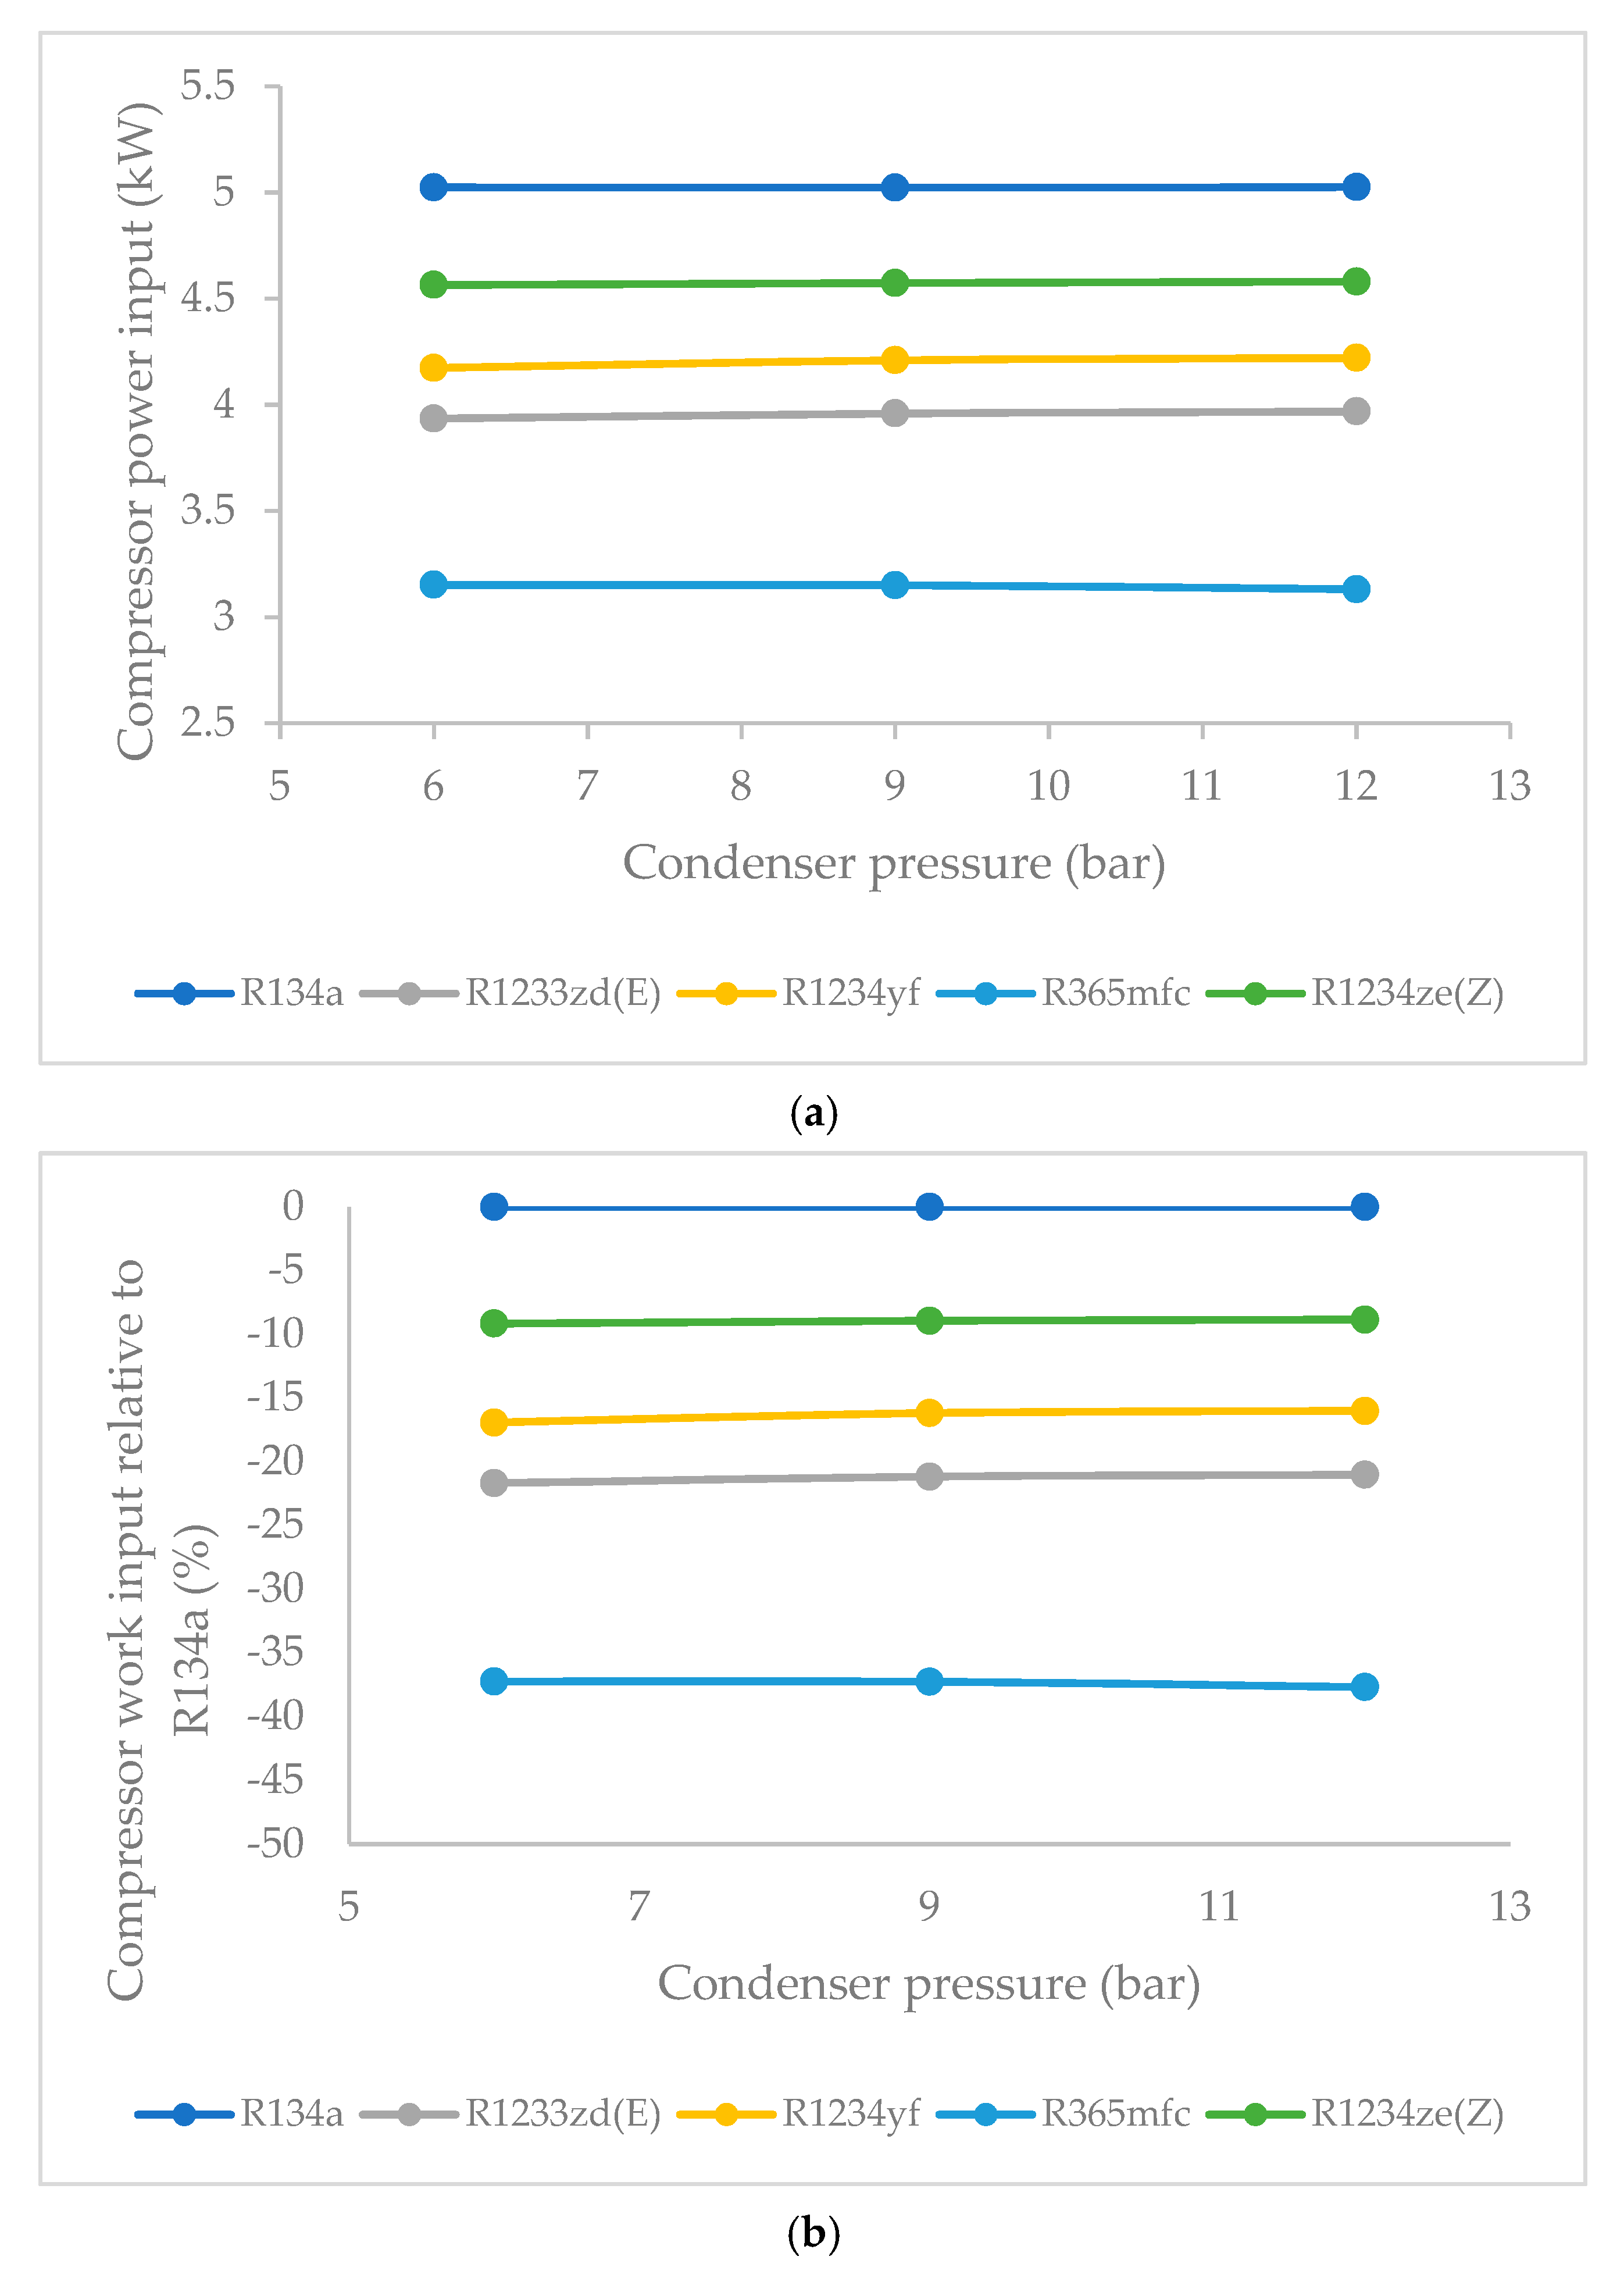
3.3. Effect of Condenser Pressure on Compressor Work Input

Figure 8a shows the compressor work input as a function of condenser pressure. The compressor work input varied slightly against the selected range of condenser pressures. The base refrigerant R134a clearly drew the highest compressor work input at all condenser pressures, followed by R1234ze(Z), R134yf, and R1233zd(E). The lowest power consumption among the HFO refrigerants was observed in the case of R365mfc. At Pcondenser = 9 bars, the maximum compressor work input of 5.02 kW was obtained in the case of R134a, followed by that of 4.57 kW for R1234ze(Z), 4.21 kW for R1234yf, 3.95 kW for R1233zd(E), and 3.15 kW for R365mfc. R1234ze(Z) required the highest compressor work input but subsequently produced the highest refrigeration effect as well. The trend remained the same at higher condenser pressures. At Pcondenser = 12 bars, the highest compressor work input consumption after R134a was observed for R1234ze(Z) at 4.58 kW. This was followed by the compressor work input of R1234yf and R1233zd(E) at 4.22 and 3.96 kW, respectively. The compressor work input of R365mfc was found to be the least among HFO refrigerants at 3.13 kW.
Figure 8b shows the percentage variation in the compressor work input relative to that of R134a as a function of condenser pressure. All refrigerants possessed straight lines regardless of condenser pressure, which meant that varying condenser pressure did not significantly affect the compressor work input in this range. When the condenser pressure was increased, the compressor work input increased slightly and approached that of R134a. At Pcondenser = 9 bars, the compressor work input for R1234ze(Z) was 8.9% less than that of R134a. It was 16.2% less than that of R134a in the case of R1234yf, it was 21.1% less than that of R134a in the case of R1233zd(E), and it was 37.2% less than that of R134a in the case of R365mfc at the same pressure. At Pcondenser = 12 bars, the compressor work input for all refrigerants slightly increased. For R1234ze(Z), it was 8.8% less than that of R134a at the same pressure. It was 16% less than that of R134a in the case of R1234yf, and it was 21% less than that of R134a in the case of R1233zd(E). For R365mfc, it was 37.7% lower than that of R134a at the same pressure.

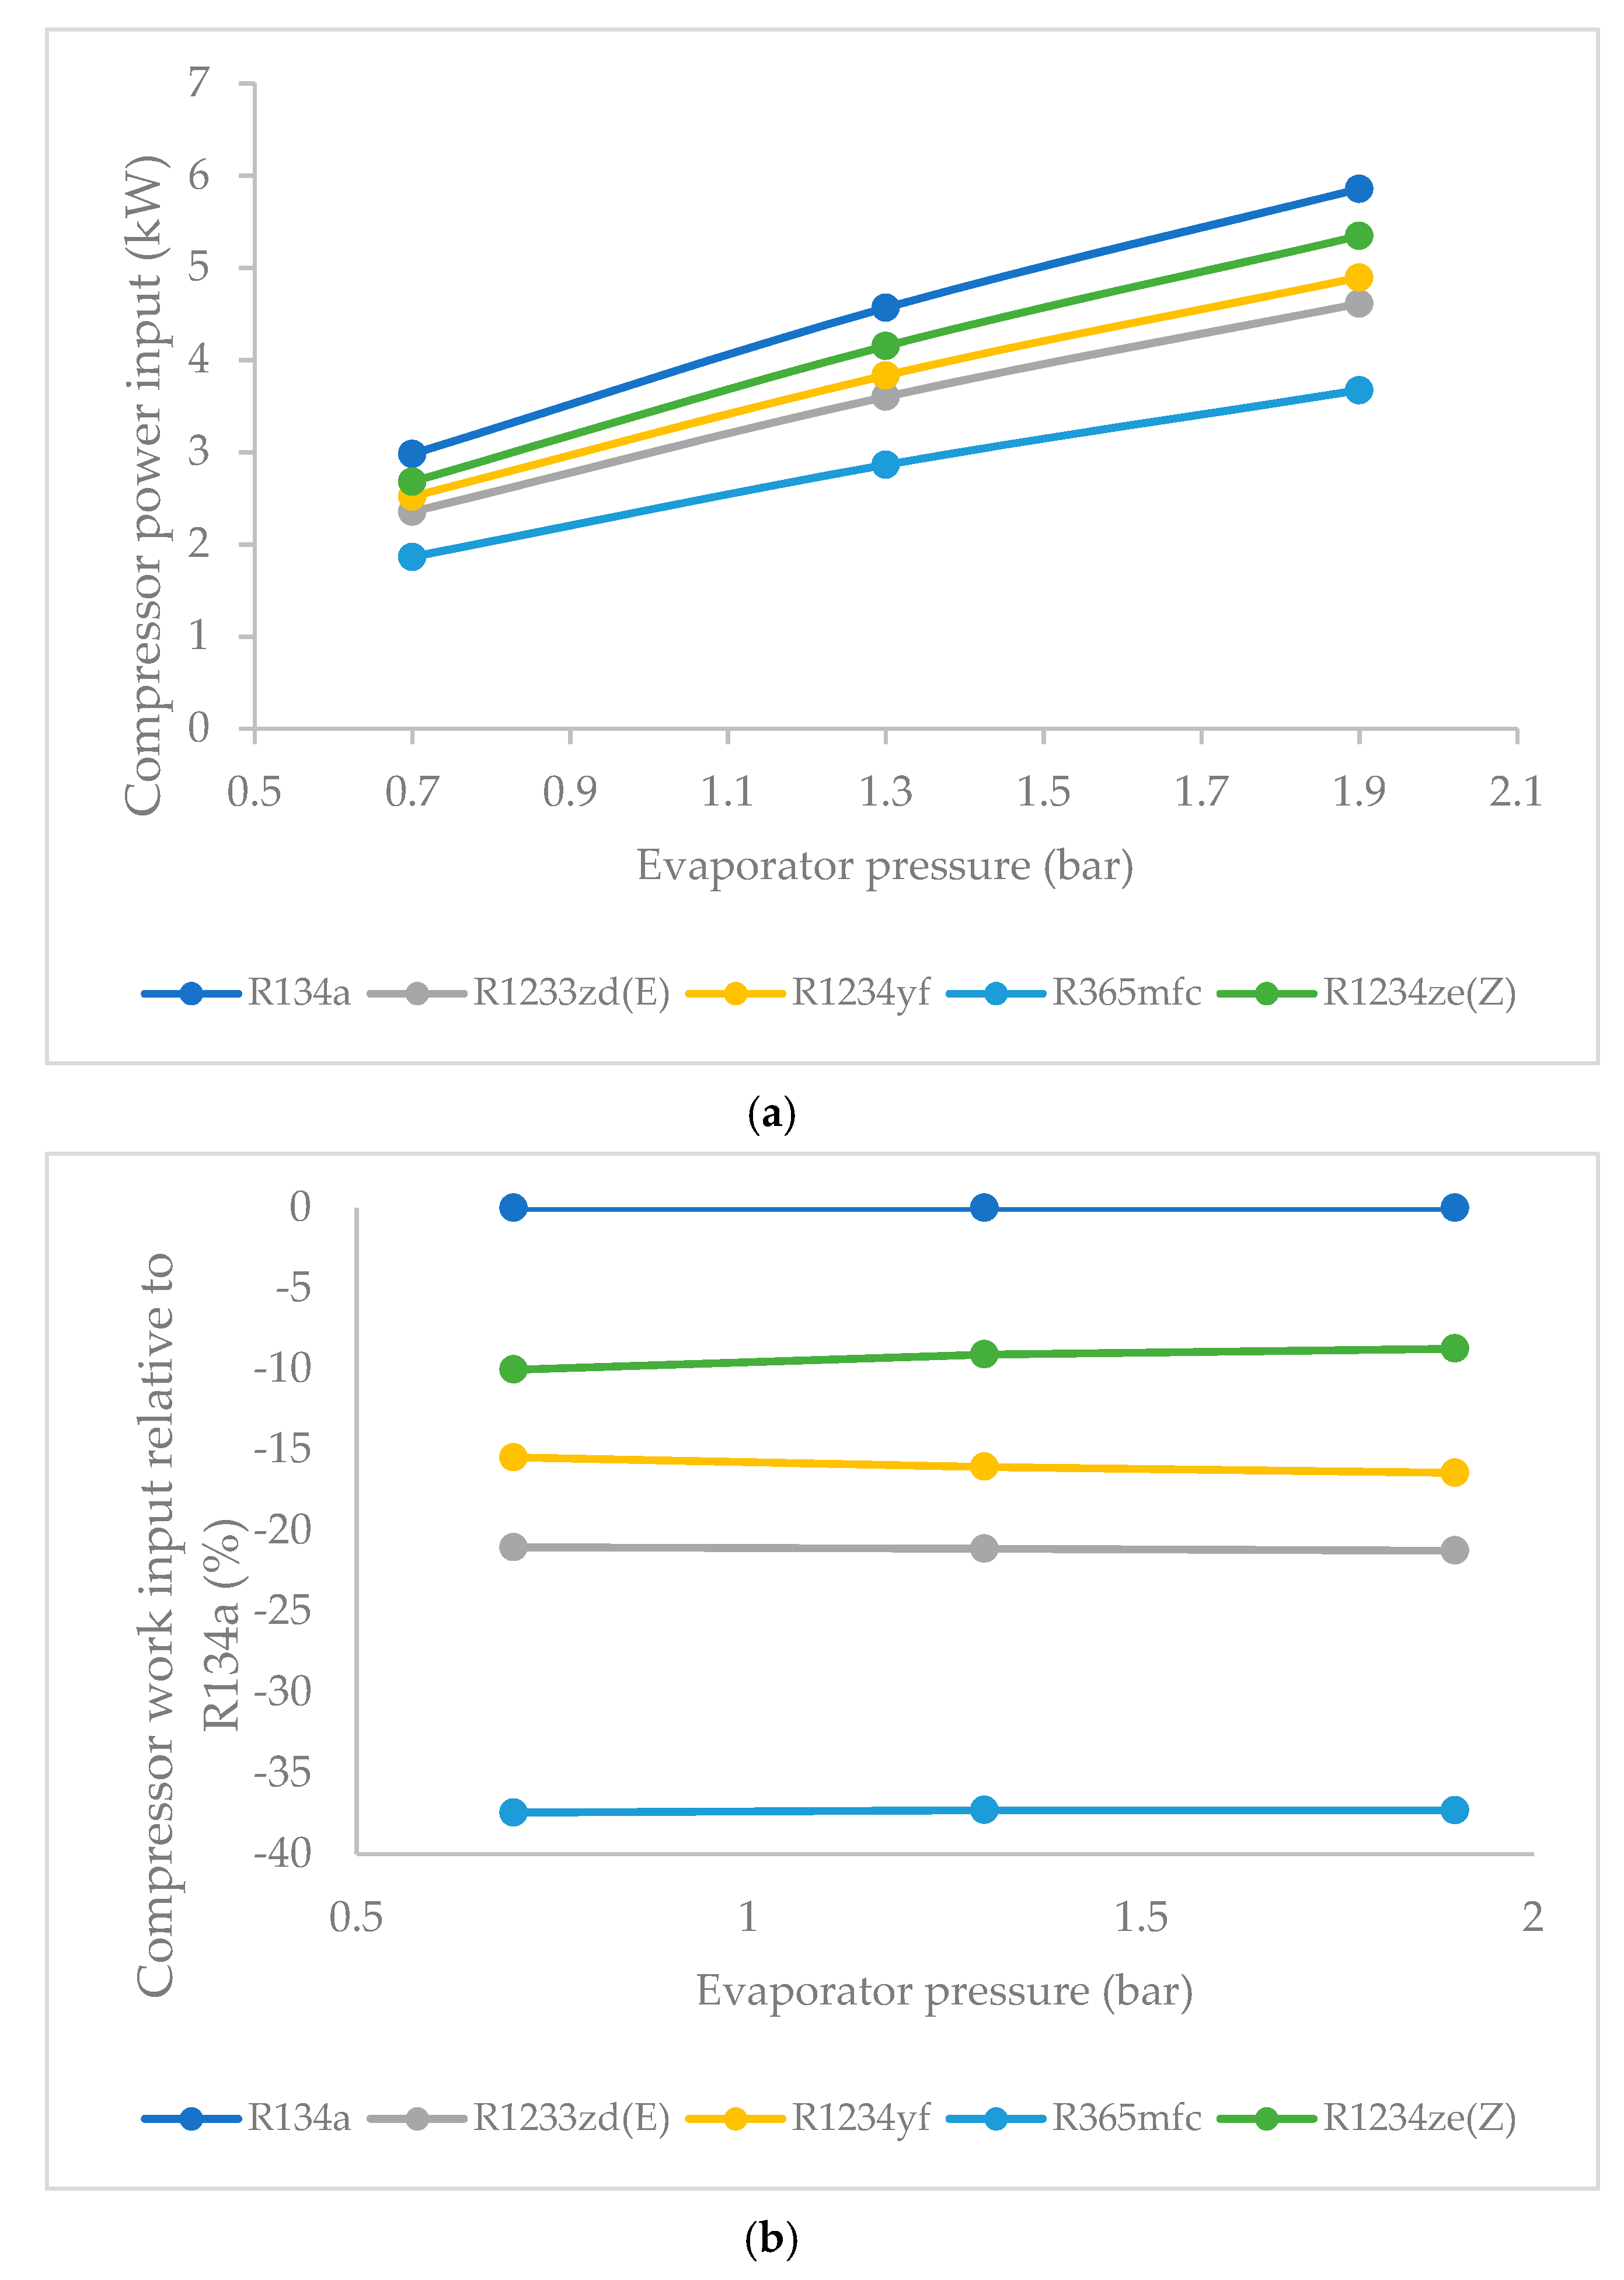
3.4. Effect of Evaporator Pressure on Compressor Work Input

Figure 9a shows the compressor work input as a function of evaporator pressure. As evaporator pressure increased, the compressor work input of all refrigerants increased. As shown in Figure, the compressor work input was highest for R1234ze(Z) among the HFO refrigerants, followed by those of R1234yf, R1233zd(E) and R365mfc. R365mfc offered the lowest compressor work input among the HFO refrigerants, and its refrigeration effect was also the lowest of all. At Pevaporator = 1.3 bars, the highest compressor work input of 4.15 kW was obtained for R1234ze(Z) among the HFO refrigerants, followed by the 3.83 kW of compressor work for R1234yf, 3.6 kW for R1233zd(E), and 2.86 kW for R365mfc. R1234ze(Z) required the highest compressor work input but subsequently produced the highest refrigeration effect as well. The trend remained the same at higher condenser pressures. At Pevaporator = 1.9 bars, the compressor work input consumption for R1234ze(Z) was 5.3 kW, followed by the compressor work input of R1234yf and R1233zd(E) at 4.9 and 4.6 kW, respectively. The compressor work input of R365mfc was 3.6 kW.
Figure 9b shows the percentage variation in the compressor work input relative to that of R134a as a function of evaporator pressure. As evaporator pressure increased, the compressor work input of all refrigerants generally increased and approached that of the reference refrigerant R134a. The compressor work input for R1234ze(Z) and R365mfc increased relative to that of R134a, while it slightly decreased for R1234yf, and it remained almost constant for R1233zd(E). At Pevaporator = 1.3 bar, the compressor work input for R1234ze(Z) was 9% less than that of R134a. It was 16% less than that of R134a in the case of R1234yf, it was 21.1% less than that of R134a in the case of R1233zd[E], and it was 37.2% less than that of R134a in the case of R365mfc. A similar trend was observed at higher pressures. For Pevaporator = 1.9 bar, the compressor work input for R1234ze(Z) was 8.7% less than that of R134a. It was 16.4% less than that of R134a in the case of R1234yf, it was 21.4% less than that of R134a in the case of R1233zd(E), and it was 37.3% less than that of R134a in the case of R365mfc.

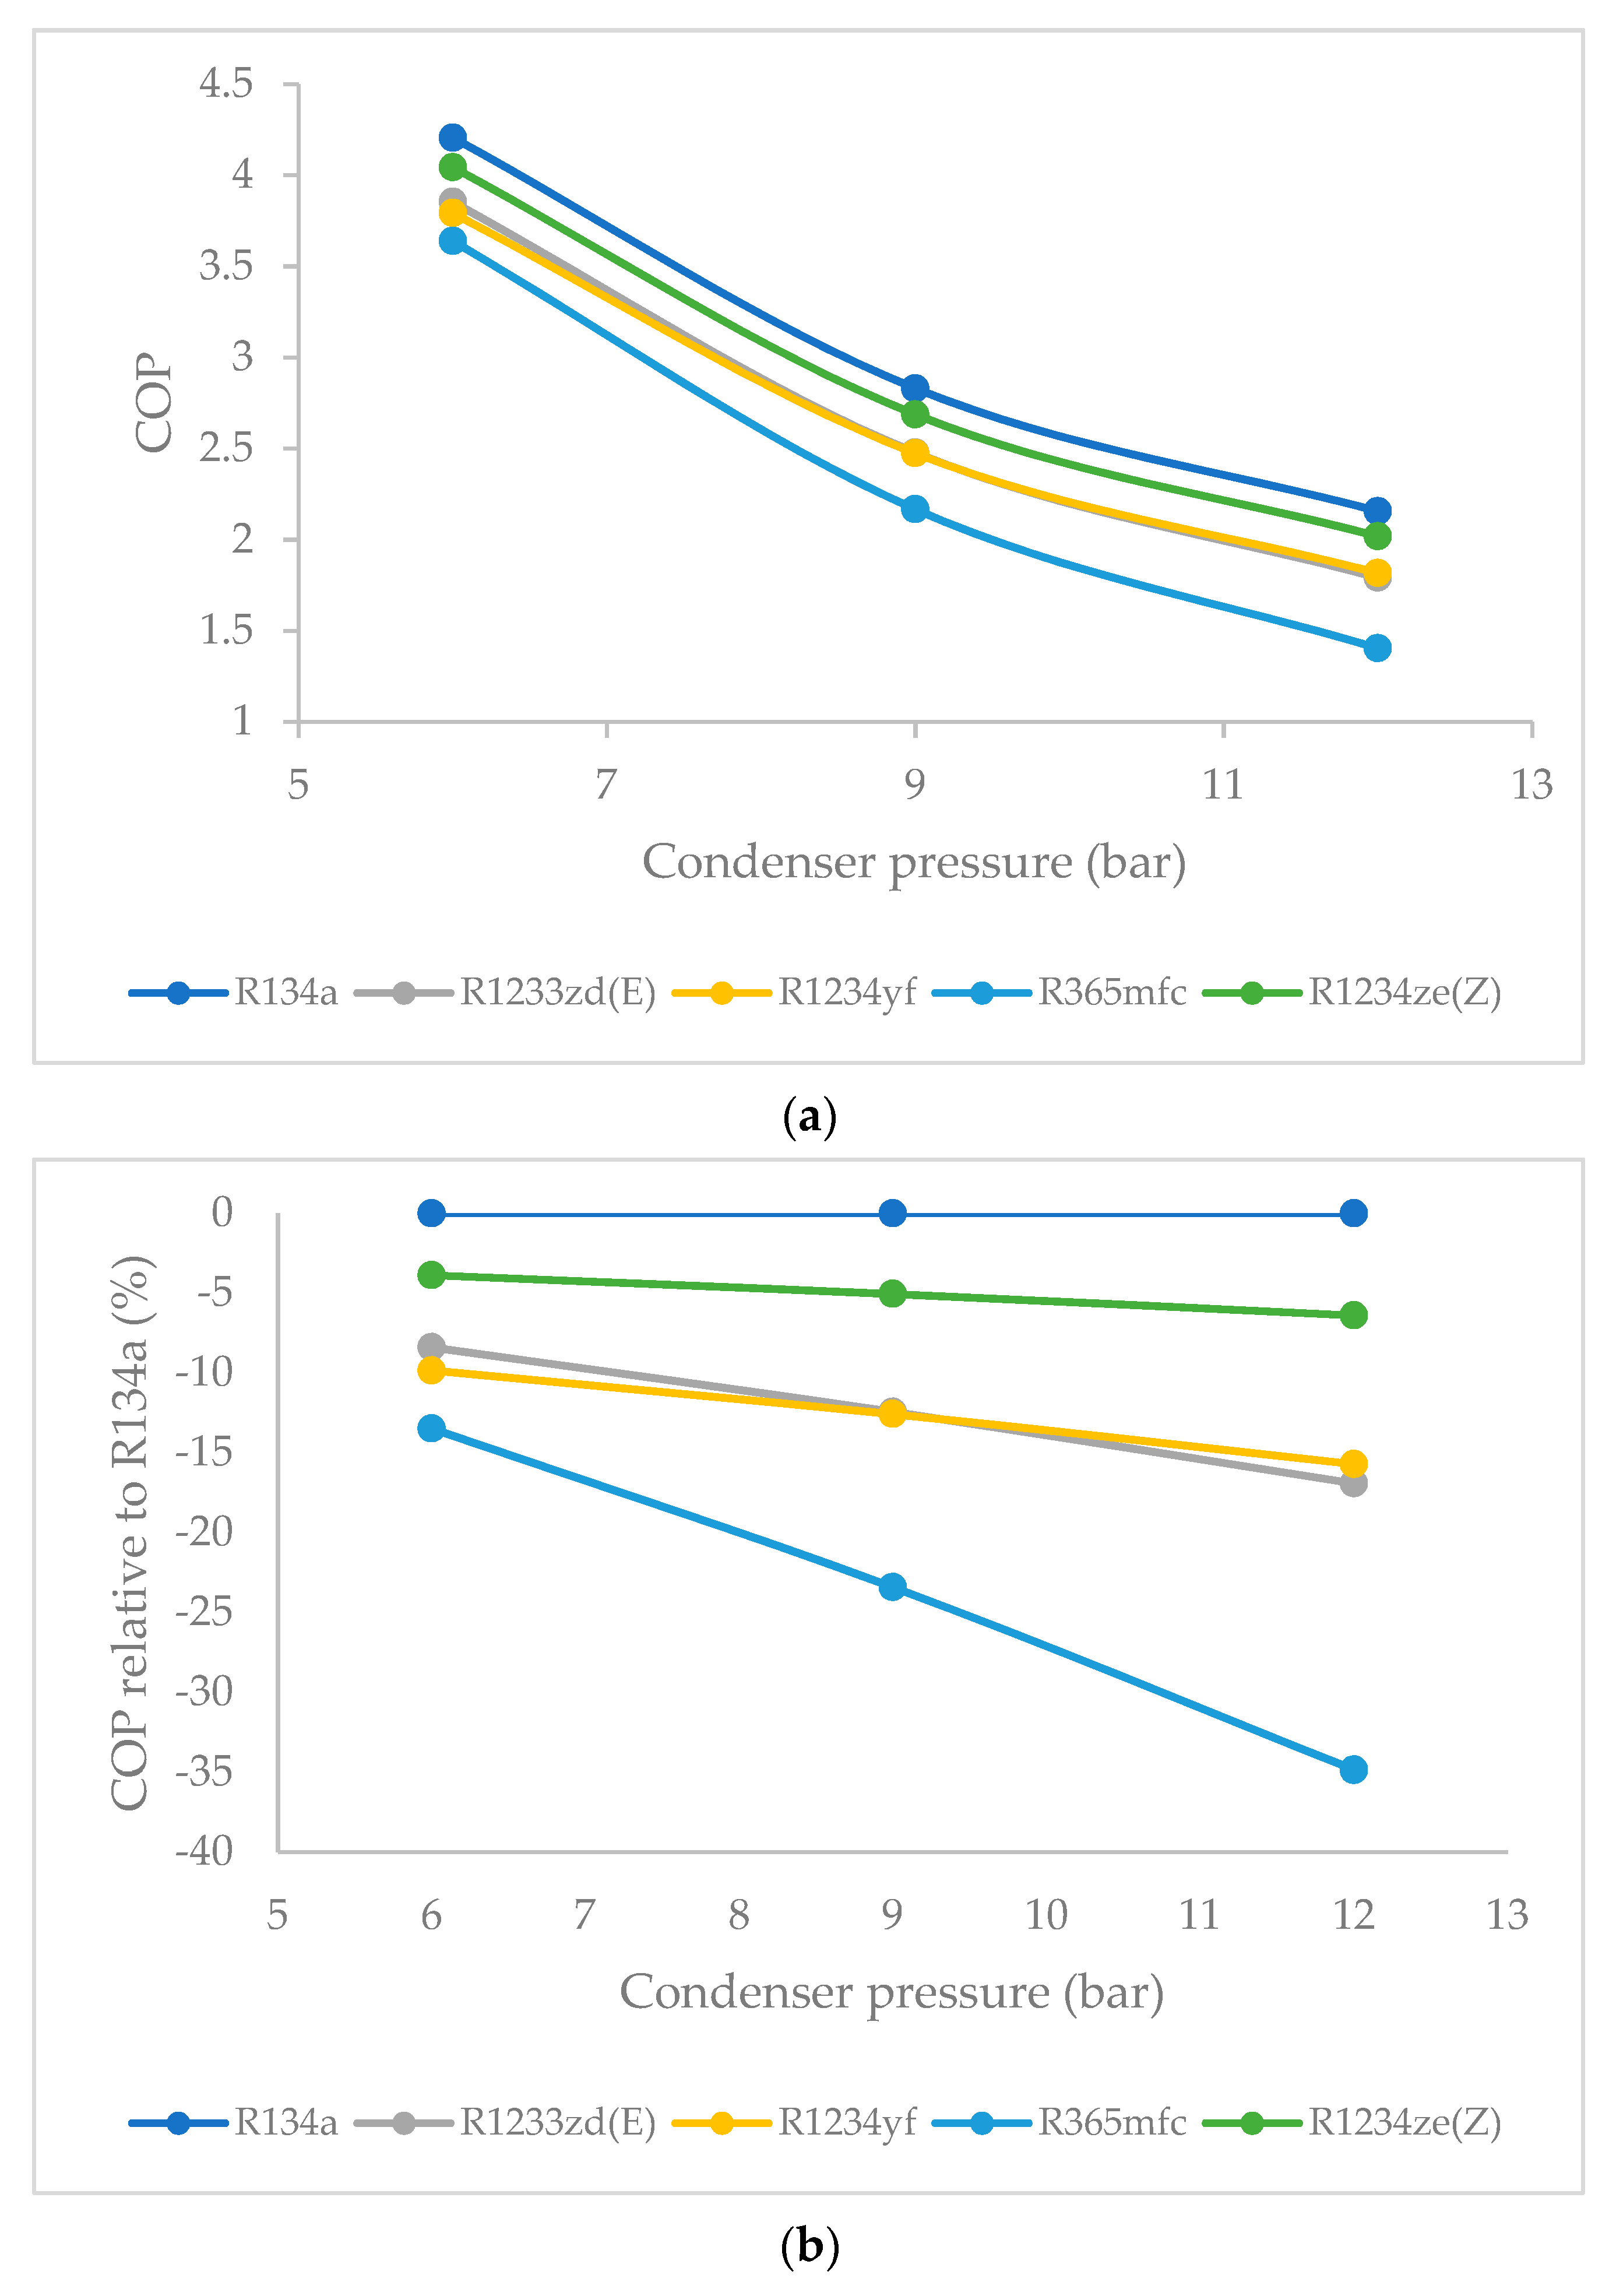
3.5. Effect of Condenser Pressure on Coefficient of Performance (COP)

The COP is important parameter for measuring the performance of refrigeration systems. Figure 10a shows the COP as a function of condenser pressure. Overall, the COP was highest for R134a, and, among all HFO refrigerants, the COP was highest for R1234ze(Z) and decreased steadily at higher condenser pressures. At Pcondenser = 6 bars, the highest COP of 4.2 was observed for R134a, followed by 4.04 for R1234ze(Z), 3.85 for R1233zd[E], 3.79 for R1234yf, and 3.63 for R365mfc. At Pcondenser = 9 bars, the COP of 2.68 was obtained for R1234ze(Z). The COP values that were obtained for R1234yf and R1233zd(E) were similar at this condenser pressure, being 2.47. The COP of R365mfc was 2.16.
Figure 10b shows the percentage variation in the COP relative to that of R134a as a function of condenser pressure. When the condenser pressure increased, the COP decreased for all refrigerants in general. This decrease was quite steady for R1234ze(Z), and it was relatively rapid for R1233zd(E) and R1234yf. For R365mfc, the COP dropped drastically at higher condenser pressures. For Pcondenser = 6 bars, the COP of R1234ze(Z) was just 3.8% less than that of R134a at the same pressure. For R1233zd(E), it was found to be 8.3% less than that of R134a, and it was 9.8% less than that of R134a in the case of R1234yf; however, for R365mfc, this decrease was higher than 13.4%. Therefore, the decrease in the COP was observed to be the lowest for R1234ze(Z) among the HFO refrigerants.

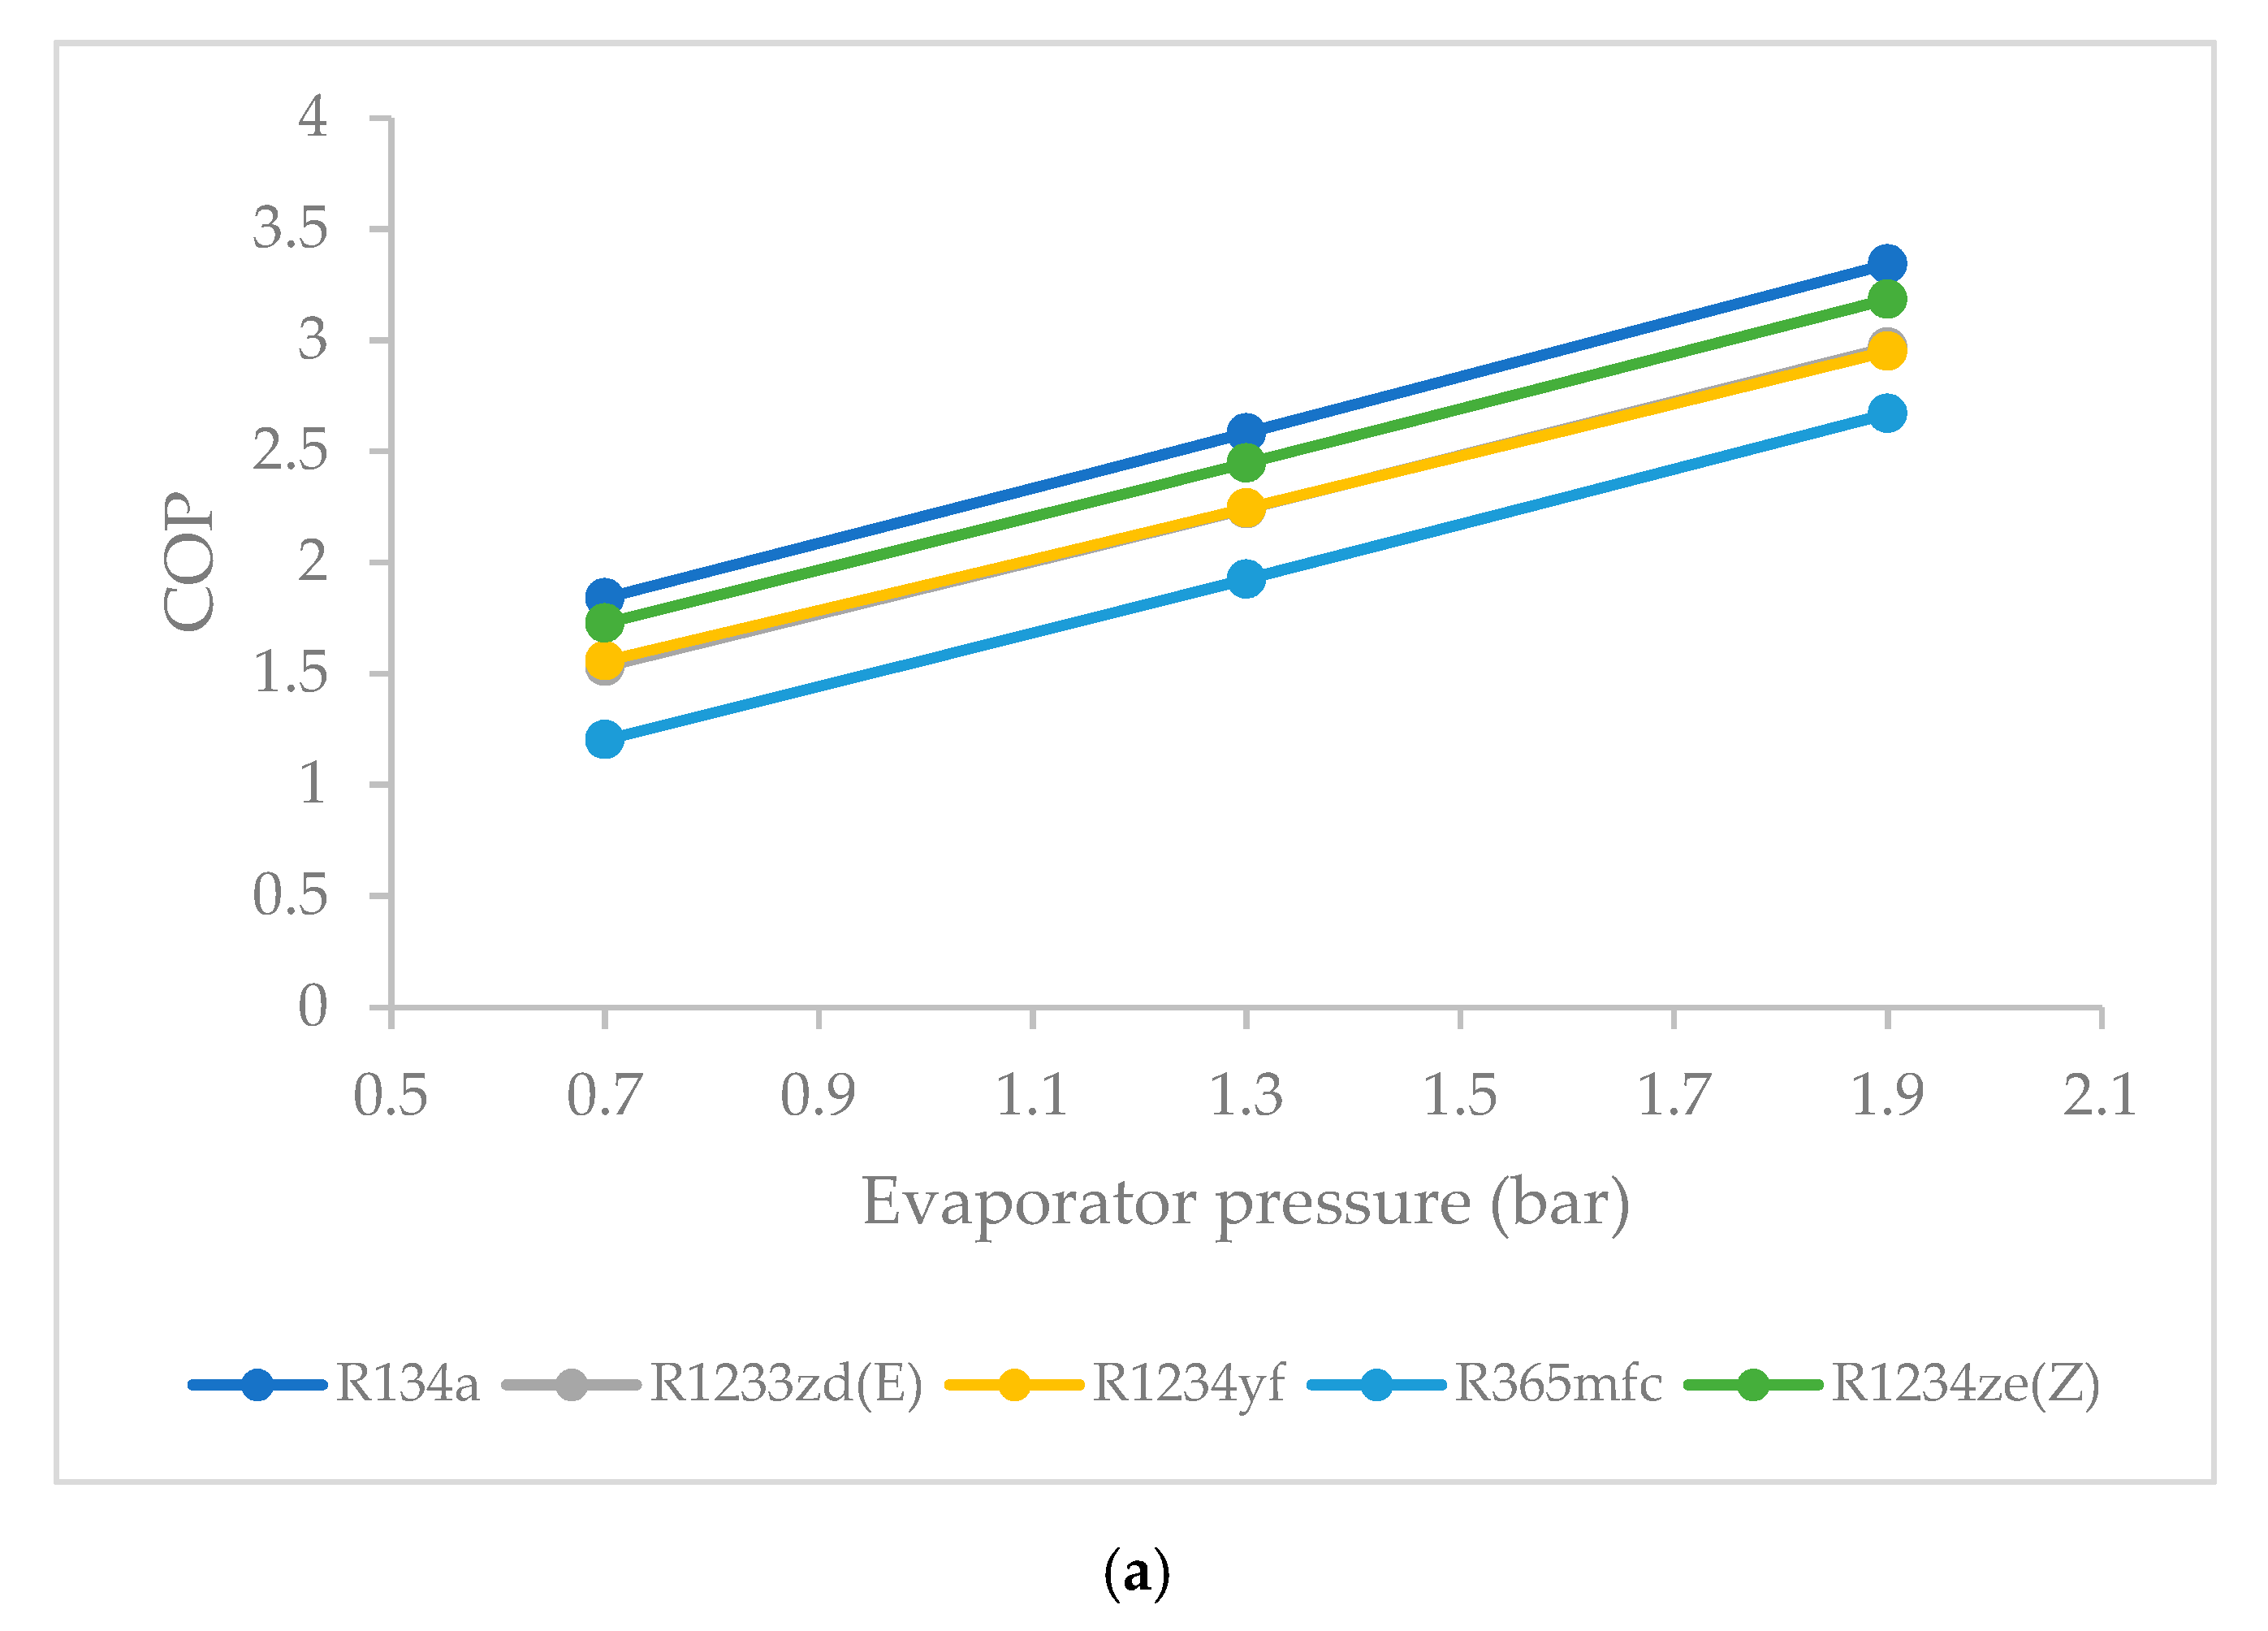
3.6. Effect of Evaporator Pressure on Coefficient of Performance (COP)

The COP as a function of evaporator pressure is shown in Figure 11a. The COP was again highest for R1234ze(Z) among the HFO refrigerants, and the COP was the lowest for R365mfc, as indicated. At Pevaporator = 0.7 bars, the COP of 1.84 was obtained in the case of R134a. The second highest refrigeration effect was observed to be 1.7 for R1234ze(Z), followed by those of R1234yf and R1233zd(E) at 1.55 and 1.53, respectively. For R365mfc, the COP observed was 1.2. R1234ze(Z) possessed the highest COP among all HFO refrigerants at this evaporator pressure. At a higher evaporator pressure, the COP of all refrigerants increased. At Pevaporator = 1.9 bars, the highest COP after R134a was obtained for R1234ze(Z) at 3.2. The COP for R1234yf was 2.95, and it was 2.96 for R1233zd(E). For R365mfc, the COP was found to be 2.67.
Figure 11b shows the percentage variation in the COP relative to that of R134a as a function of evaporator pressure. The COP of all refrigerants tended to increase when the evaporator pressure was increased. The COP of R365mfc increased rapidly but still lagged behind those of all other refrigerants at all evaporator pressures. At Pevaporator = 0.7 bars, the COP of R1234ze(Z) was 6.1% less than that of R134a. The COP was 15.3% less than that of R134a in the case of R1234yf, and it was quite high at 34.6% less than that of R134a in the case of R365mfc. At a higher evaporator pressure, the difference in the COP was reduced relative to that of R134a. At Pevaporator = 1.9 bars, the COP of R1234ze(Z) was 4.7% less than that of R134a. In the case of R1234yf, it was 111.7% less than that of R134a, and it was 20.1% less than that of R134a for R365mfc. As such, the lowest decrease of the COP was observed for R1234ze(Z).

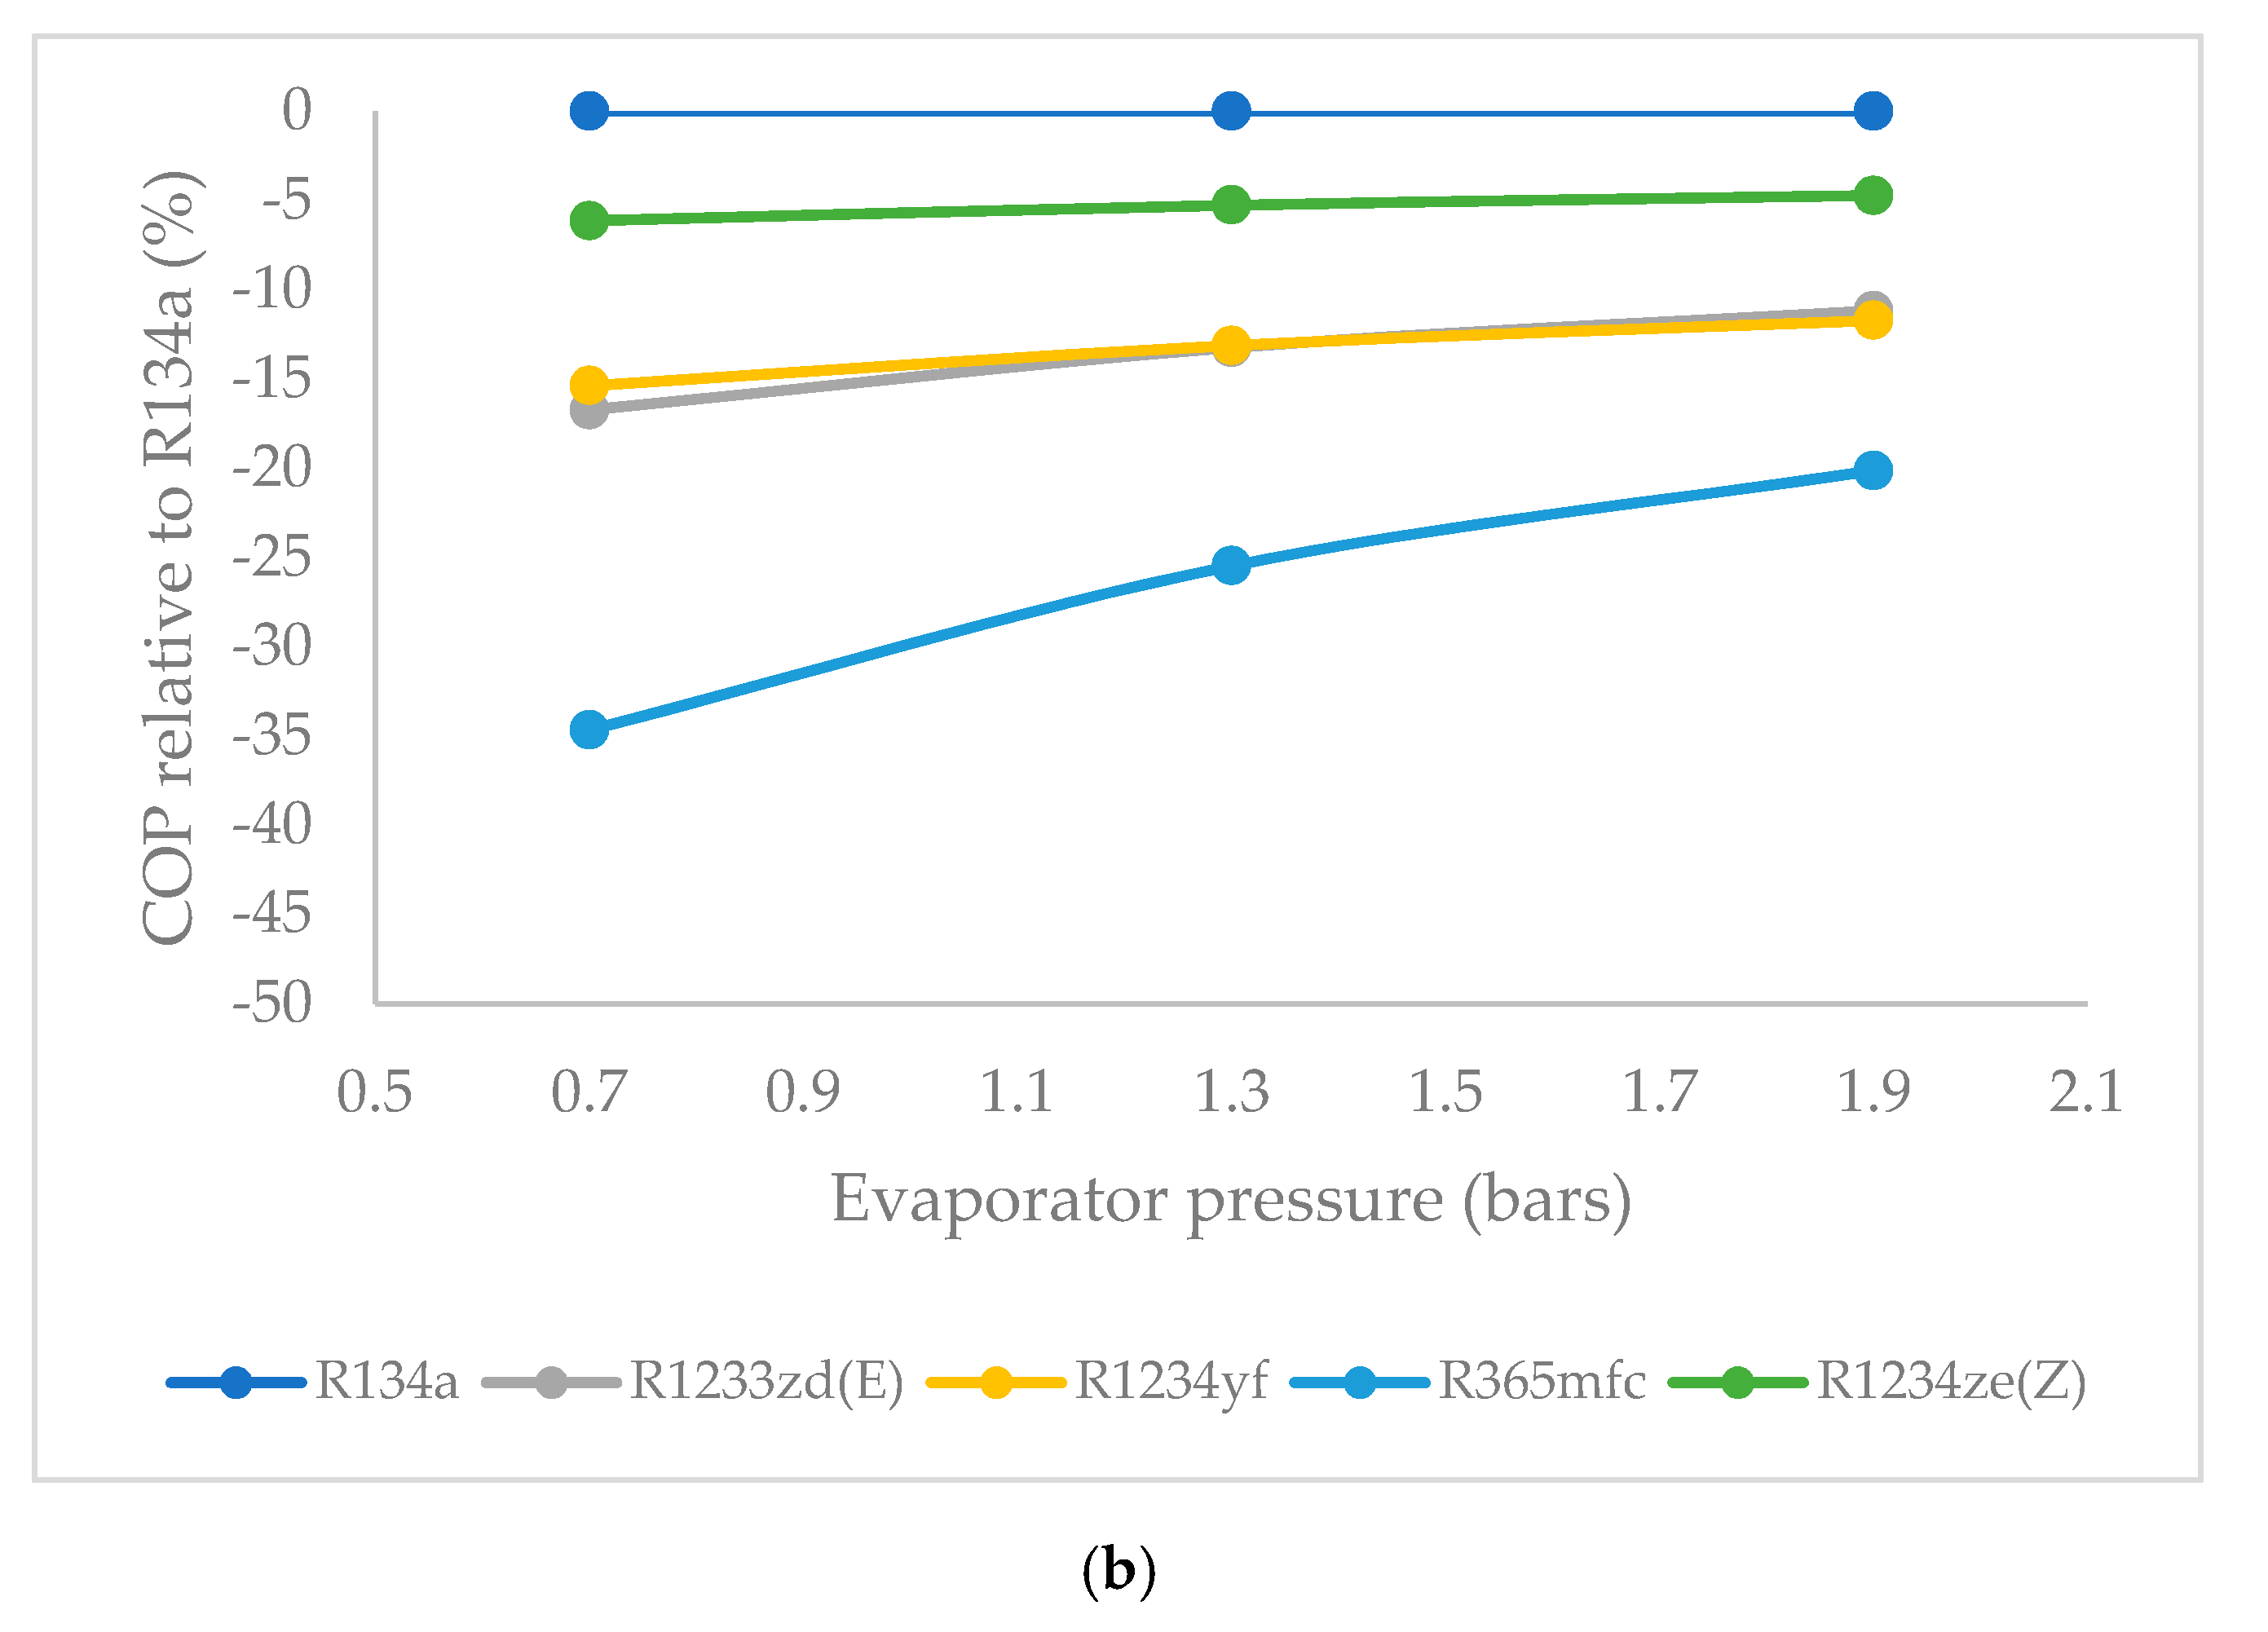
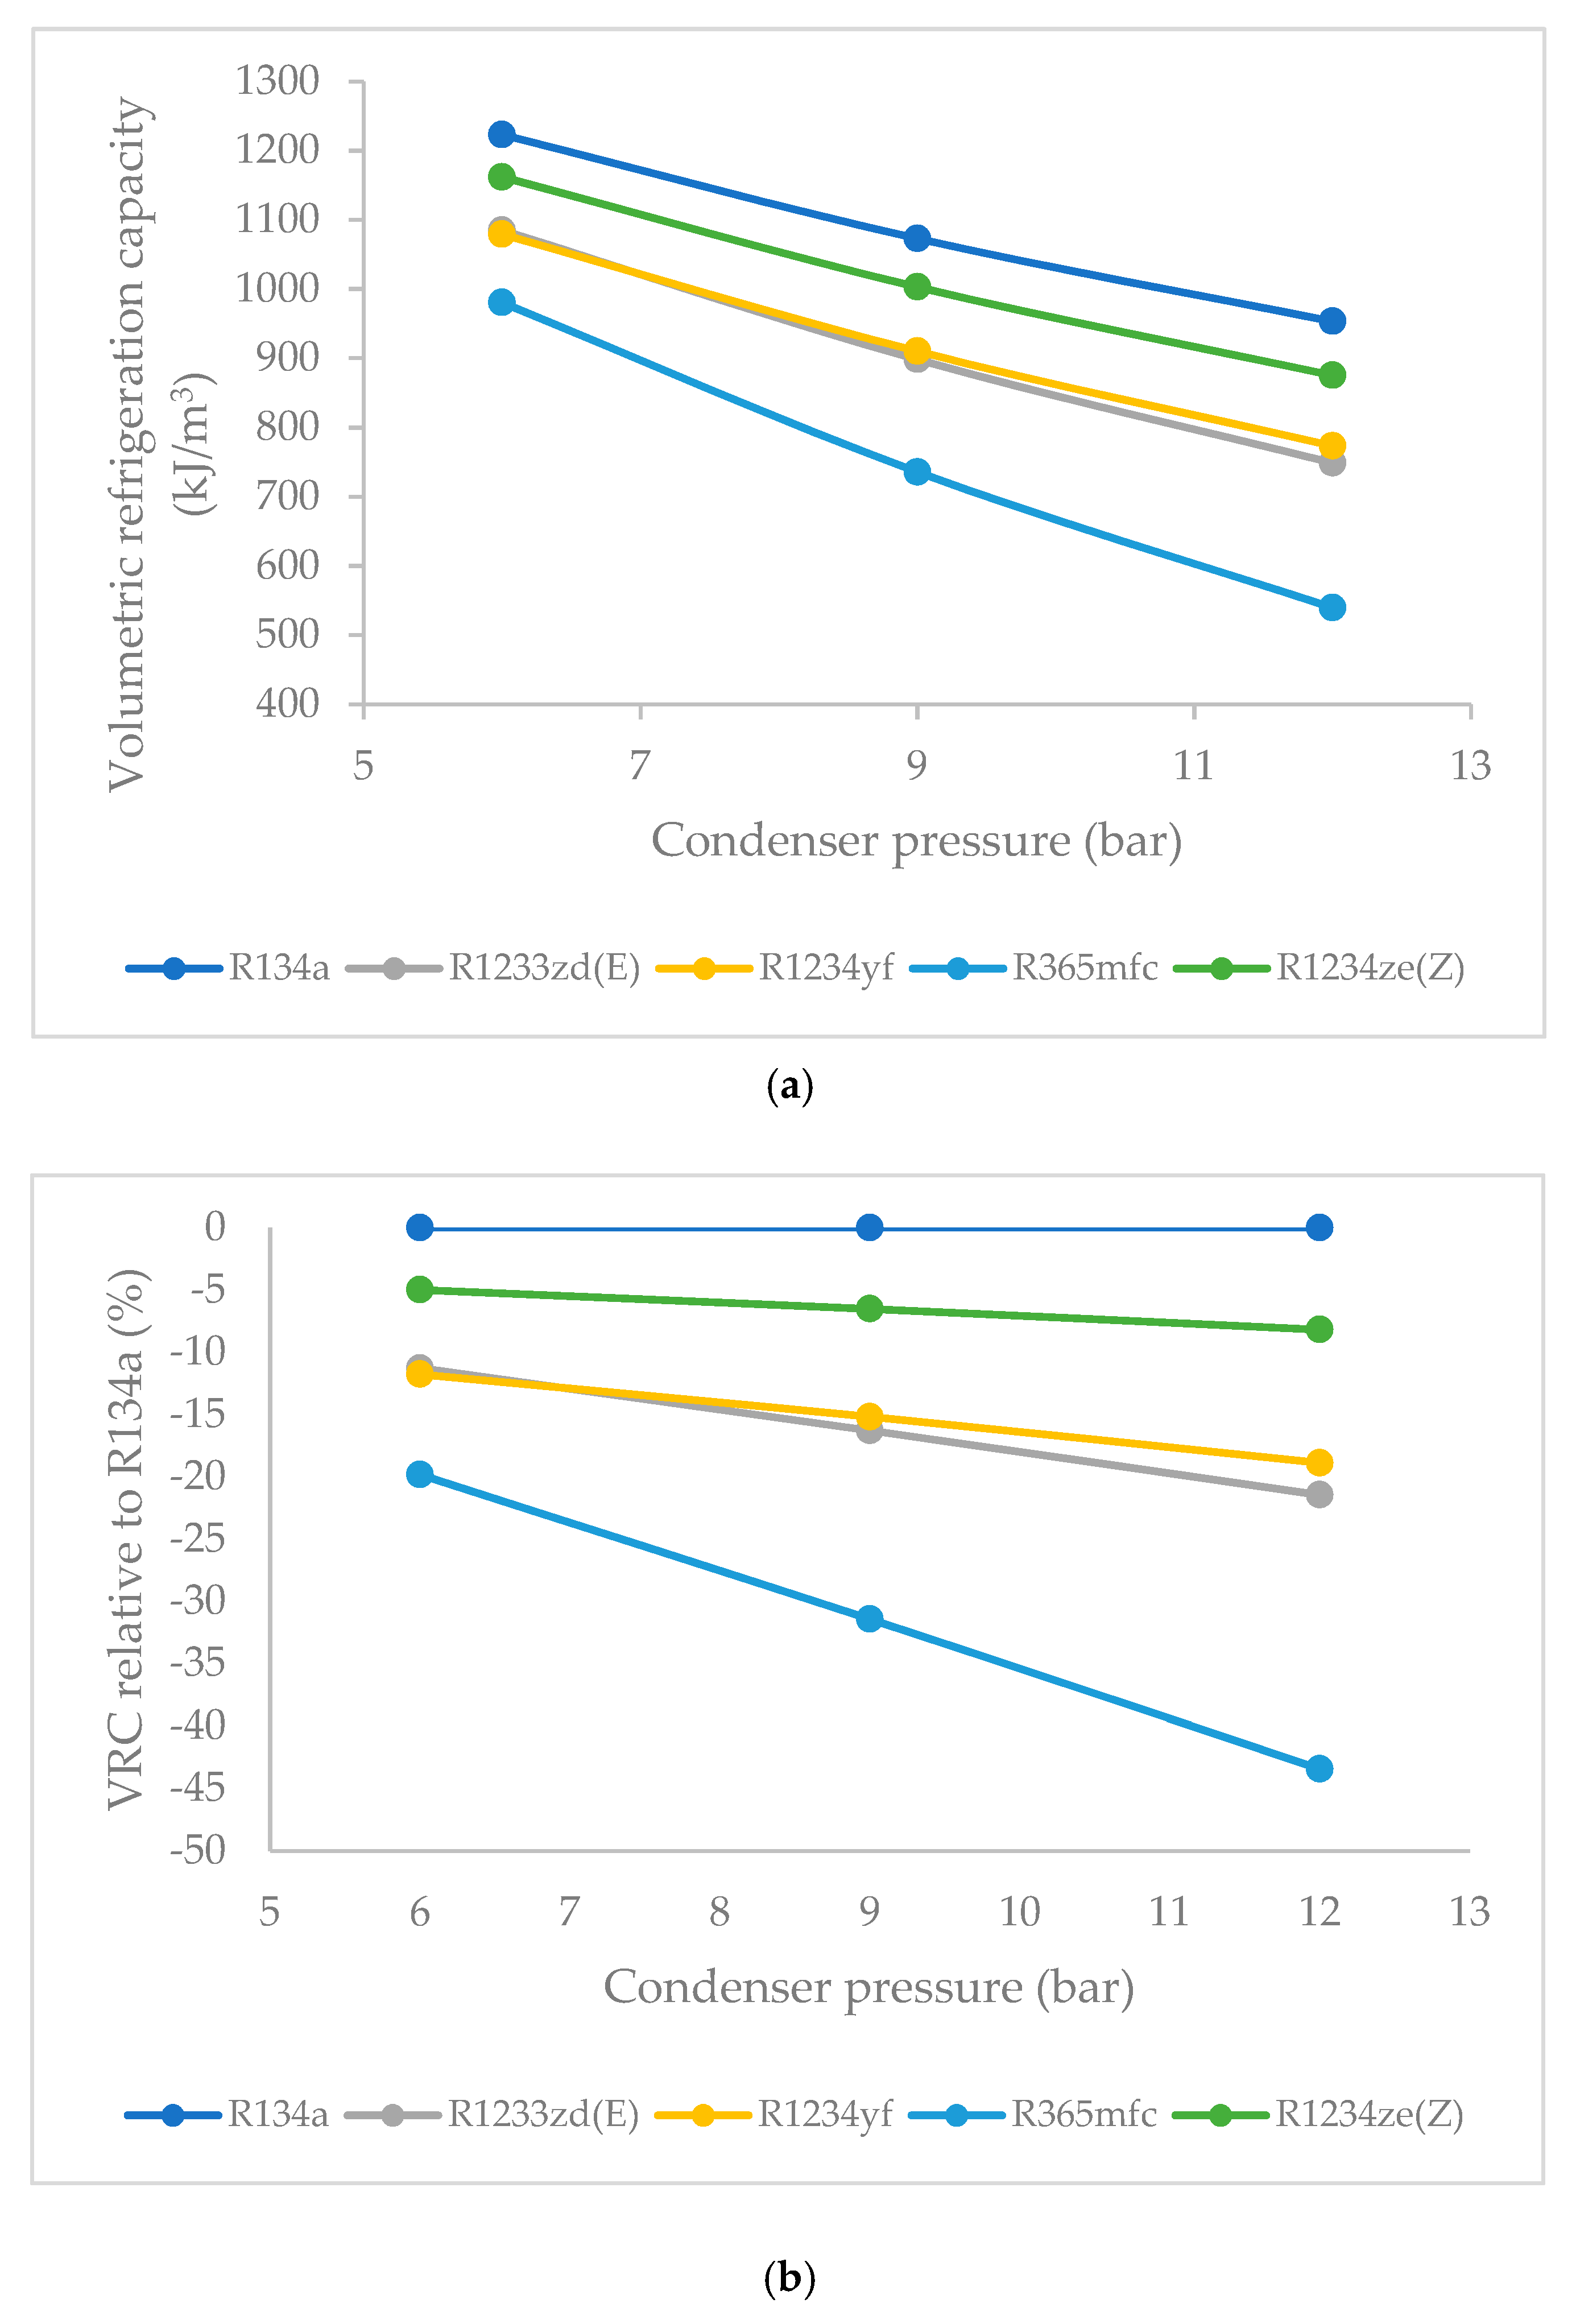
3.7. Effect of Condenser Pressure on Volumetric Refrigeration Capacity (VRC)

Figure 12a shows the VRC as a function of the condenser pressure. The VRC of R134a was taken as reference for all refrigerants at all condense pressures. The VRC of R1234ze(Z) was observed to be the highest at Pcondenser = 6 bars, the VRC of R1234yf and R1233zd(E) were found to be nearly equal, and the lowest values were obtained in the case of R365mfc. At Pcondenser = 6 bars, the highest VRC of 1223 kJ/m3 was observed for R134a, 1162 kJ/m3 was observed for R1234ze(Z), 1085 kJ/m3 was observed for R1233zd(E), 1079 kJ/m3 for R1234yf, and 980 kJ/m3 was observed for R365mfc. At a higher condenser pressure, the VRC of all refrigerants was increased. At Pcondenser = 9 bars, the VRC of 1003 kJ/m3 was obtained for R1234ze(Z). The VRC values that were obtained for R1234yf and R1233zd(E) were almost equal at 910 and 898 kJ/m3, respectively. The VRC of R365mfc was 765 kJ/m3.
Figure 12b shows the percentage variation in VRC relative to that of R134a as a function of the condenser pressure. As condenser pressure increased, the VRC decreased linearly. The decrease was lowest for R1234ze(Z) and highest for R365mfc at a higher condenser pressure. At Pcondenser = 9 bars, the VRC of R1234ze(Z) was found to be 6.5% less than that of R134a. The VRC was 15.1% less than that of R134a in the case of R1234yf, it was 16.3% less than that of R134a in the case of R1233zd (E) and it was 31.4% less than that of R134a in the case of R365mfc. This trend remained the same at higher condenser pressures. The performance of all other refrigerants decreased at higher condenser pressures except for that of of R1234ze(Z).

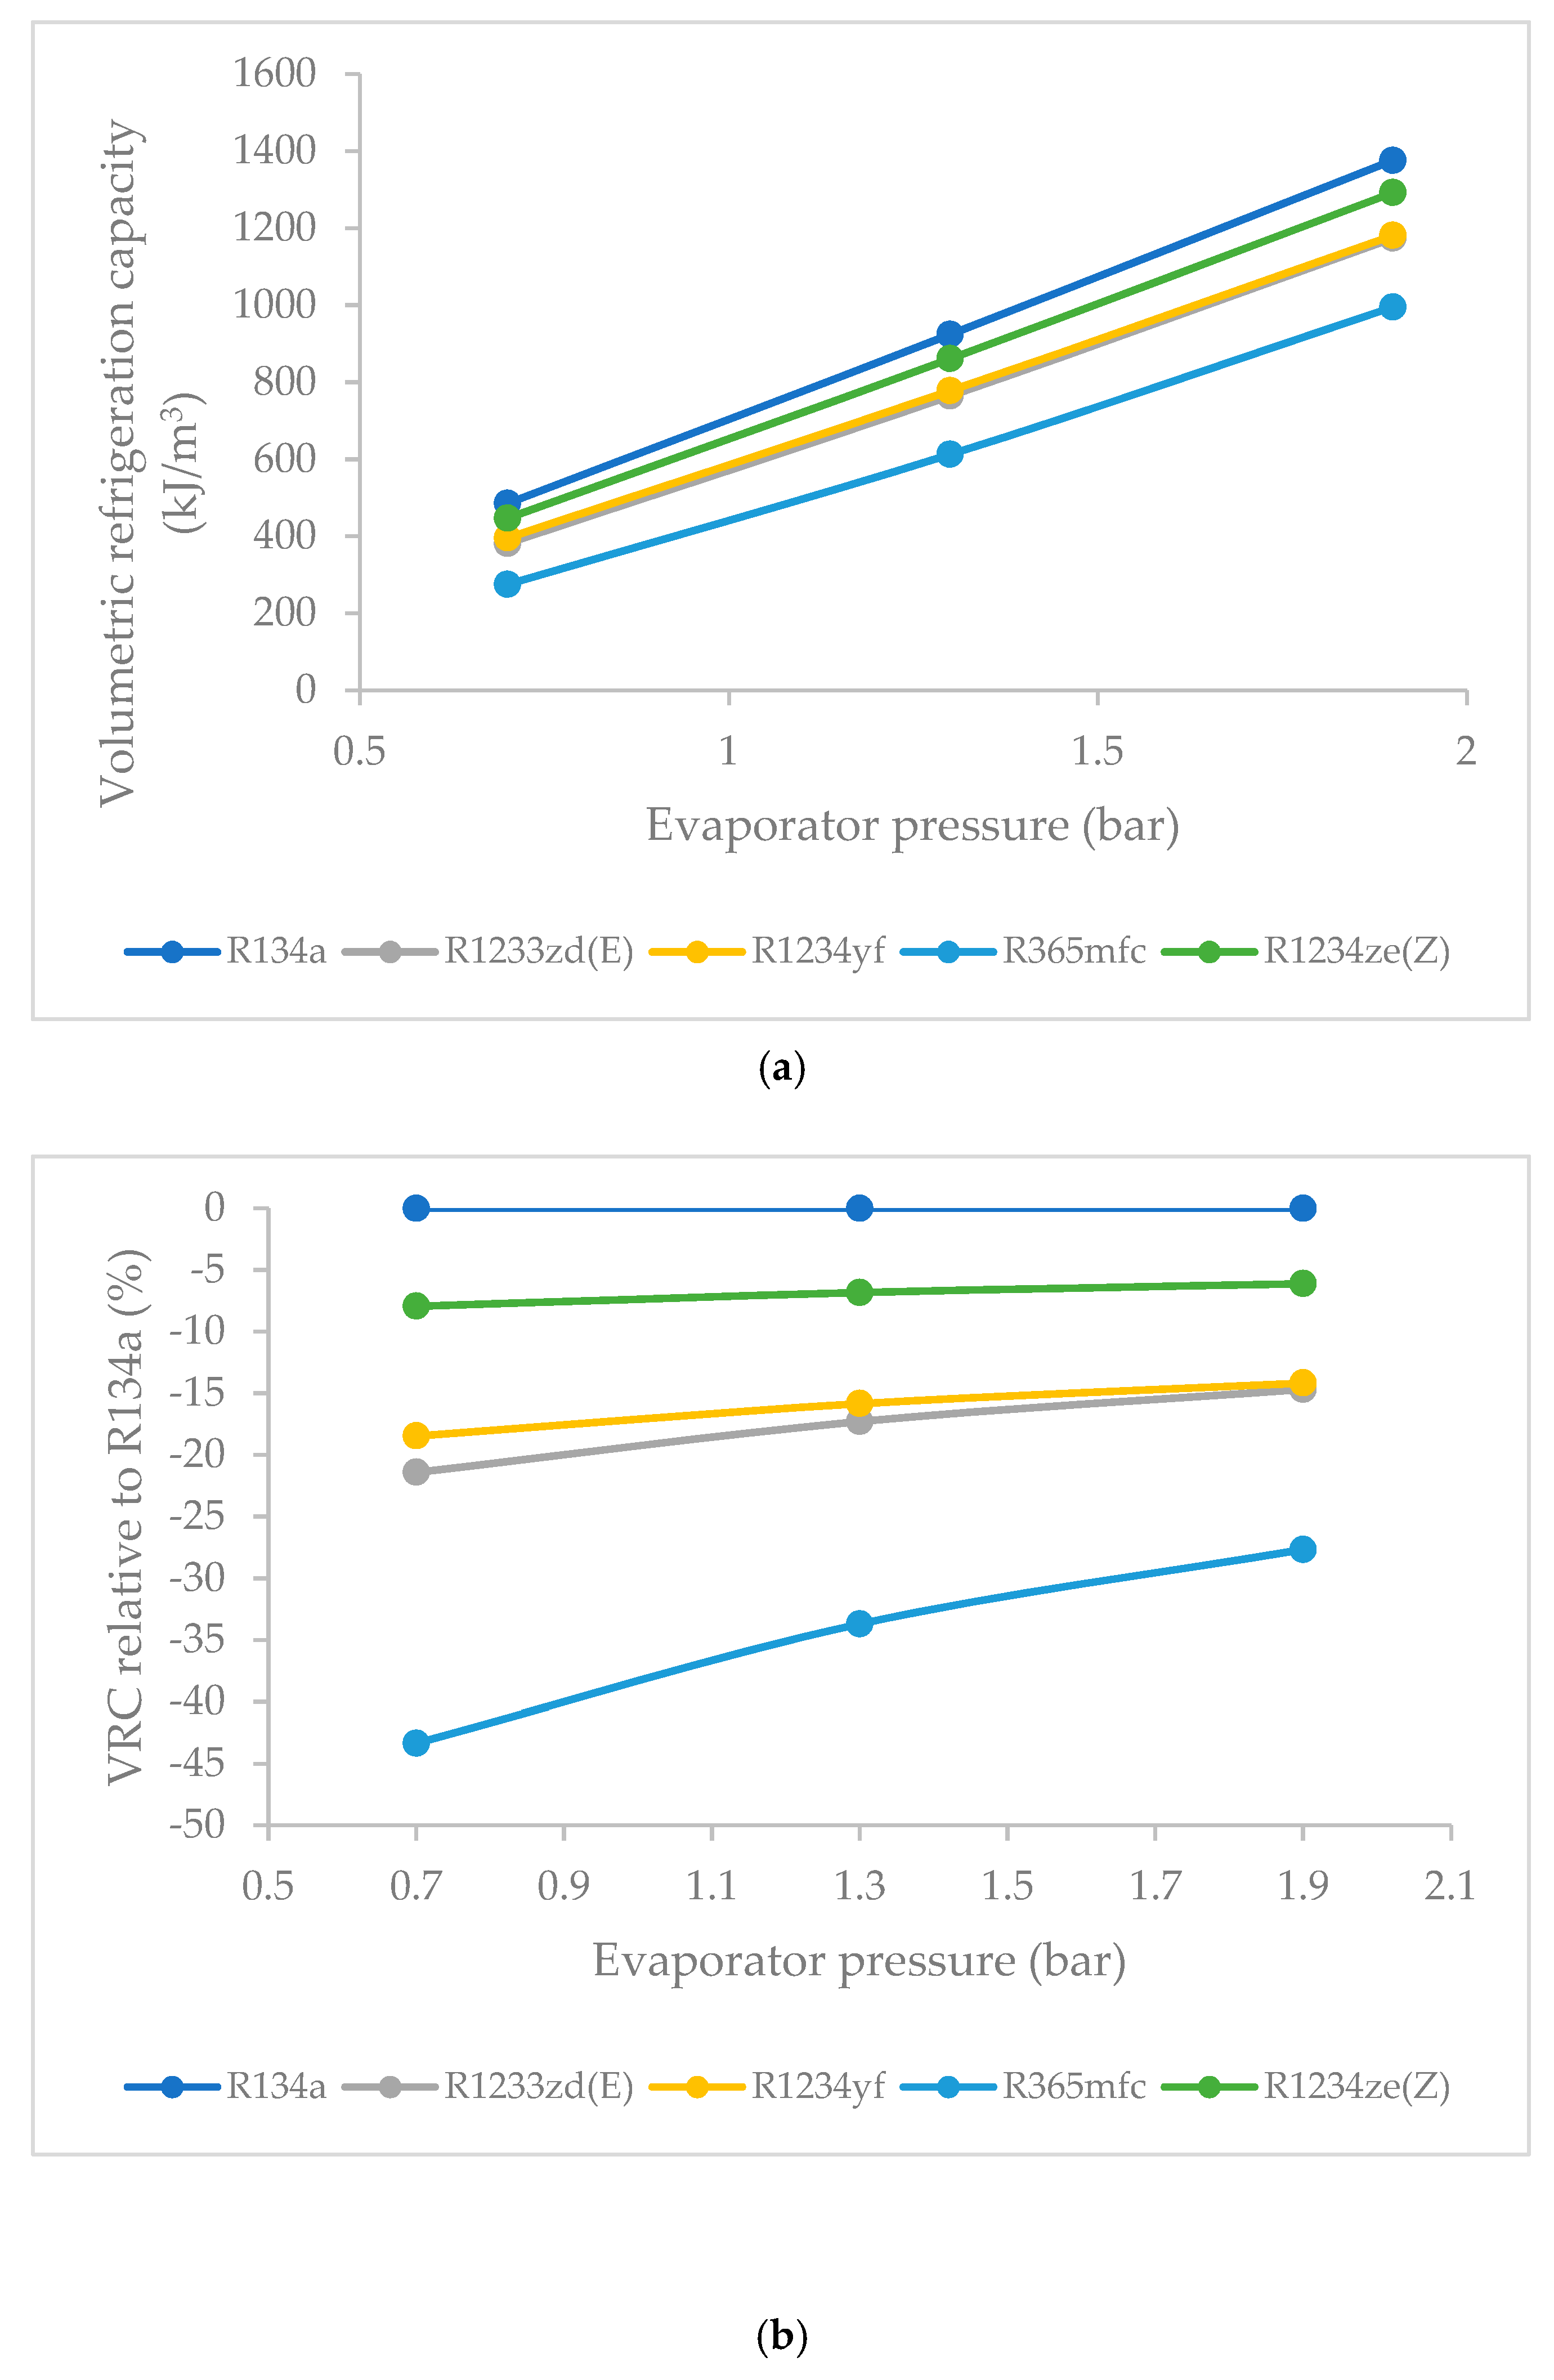
3.8. Effect of Evaporator Pressure on Volumetric Refrigeration Capacity (VRC)

Figure 13a shows the VRC relative to that of R134a as a function of evaporator pressure. R1234ze(Z) was found to have the highest VRC among the HFO refrigerants at all evaporator pressures, followed by R1234yf, R1233zd(E) and R365mfc. At Pevaporator = 0.7 bars, R134a possessed the maximum VRC value of 485 kJ/m3, R1234ze(Z) possessed the VRC value of 446 kJ/m3, R1234yf possessed the VRC value of 396 kJ/m3, and R365mfc possessed the VRC value of275 kJ/m3. At Pevaporator = 0.7 bars, the VRC that was obtained for R1234ze(Z) was 446 kJ/m3, that for R1234yf was 396 kJ/m3, that for R1233zd(E) was 381 kJ/m3, and that for R365mfc 275 kJ/m3. At a higher condenser pressure, the VRC of all refrigerants was increased significantly, but the trend was similar. At Pevaporator = 1.3 bars, the VRC of 860.8 kJ/m3 was obtained for R1234ze(Z). The VRC values obtained for R1234yf and R1233zd(E) were almost equal at 777 and 764 kJ/m3, respectively. The VRC of R365mfc was 612 kJ/m3.
Figure 13b shows the percentage variation in the VRC relative to that of R134a as a function of evaporator pressure. The VRC of the refrigerants increased rapidly as evaporator pressure was increased. This increase was sharp for R365mfc and relatively steady for R1234yf and R1233zd(E). The VRC of R1234ze(Z) was 6.8% less than that of R134a at the same pressure. In the case of R1234yf, the VRC was 15.8% less than that of R134a, and it was 33.7% less than that of R134a in the case of R365mfc.

4. Conclusions

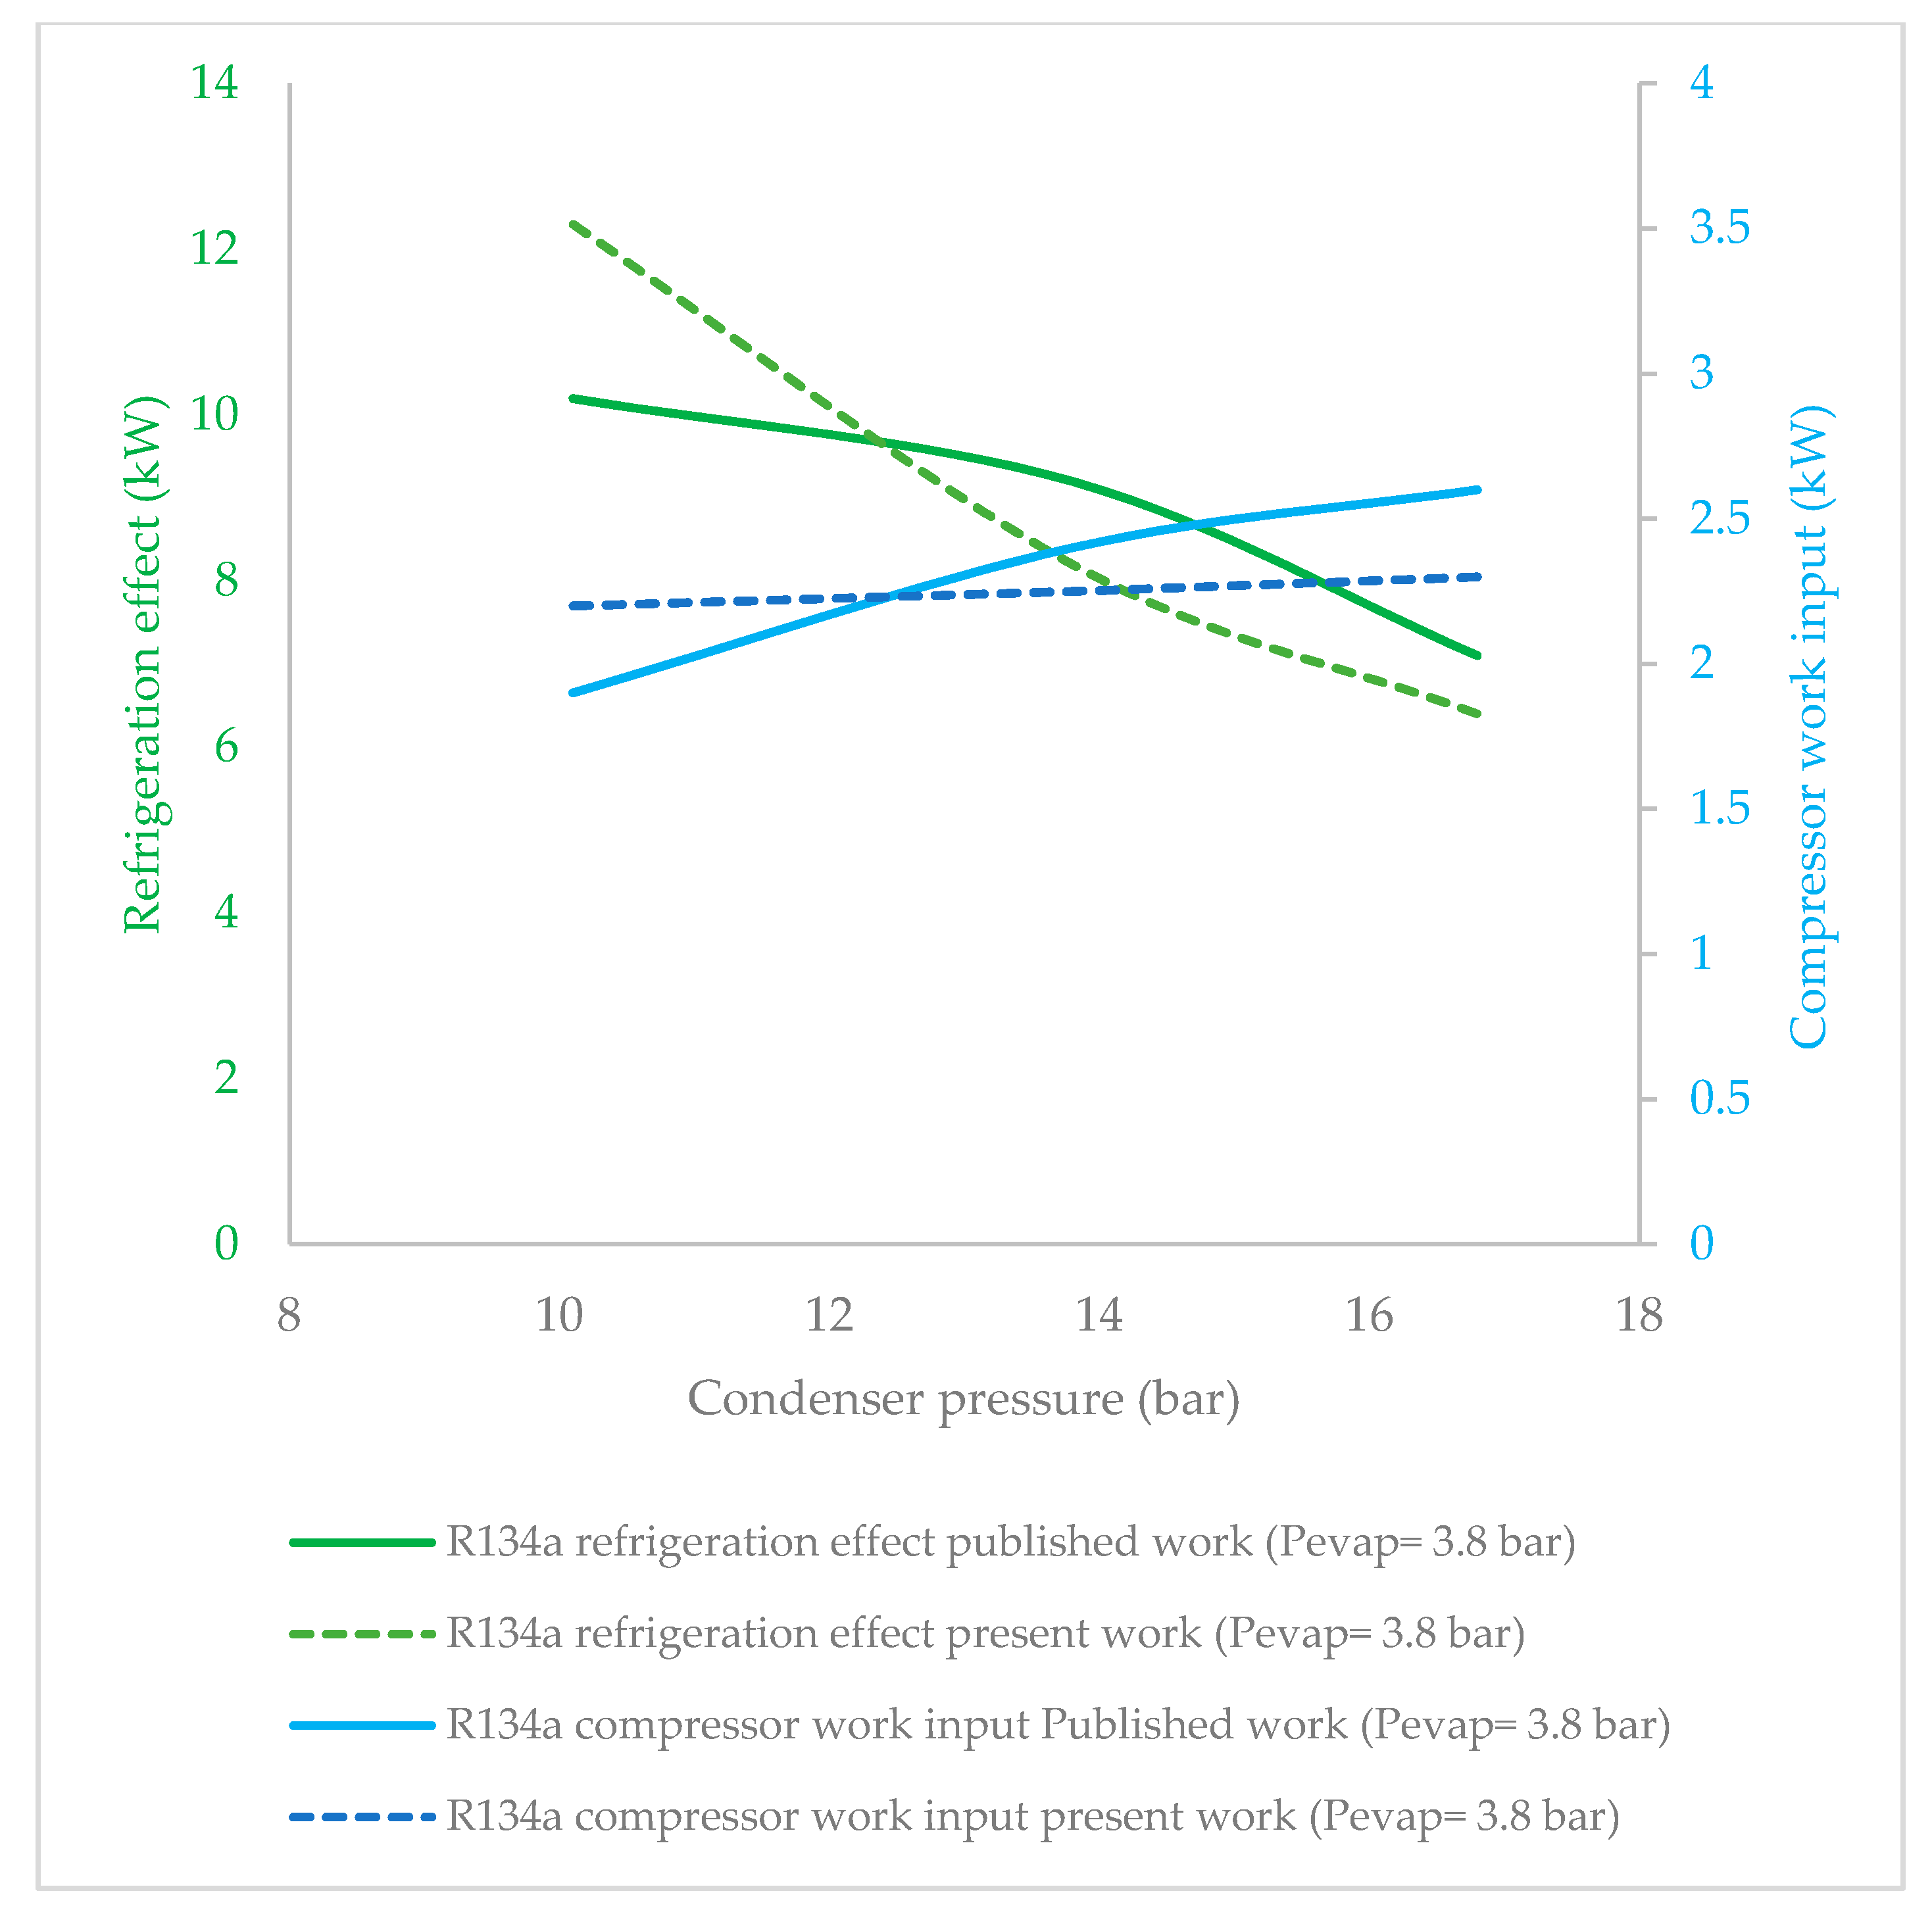
  • R134a clearly possessed the highest refrigeration effect, overall, at all condenser pressures. The second refrigerant that performed almost as well as R134a was R1234ze(Z), which is an HFO refrigerant. The refrigeration effect of R1234ze(Z) was less than that of R134a and greater than that of all of the other HFO refrigerants at all condenser pressures. R1233zd(E) fell midway between R1234ze(Z) and R365mfc. As condenser pressure was increased, the refrigeration effect decreased in general. The lowest decrease in refrigeration effect was observed in the case of R1234ze(Z), and the refrigeration effect of R365mfc decreased drastically at higher condenser pressures.
  • At a lower evaporator pressure, the highest refrigeration effect among the HFO refrigerants was observed for R1234ze(Z), followed by those of R1234yf and R1233zd(E). R365mfc had the lowest refrigeration effect among all refrigerants. This trend remained the same at a higher evaporator pressure. As evaporator pressure increased, the refrigeration effect of all refrigerants approached that of the reference refrigerant R134a. The refrigeration effect of R1234ze(Z) increased steadily, while it increased rapidly for R365mfc, though it lagged behind all refrigerants at all evaporator pressures.
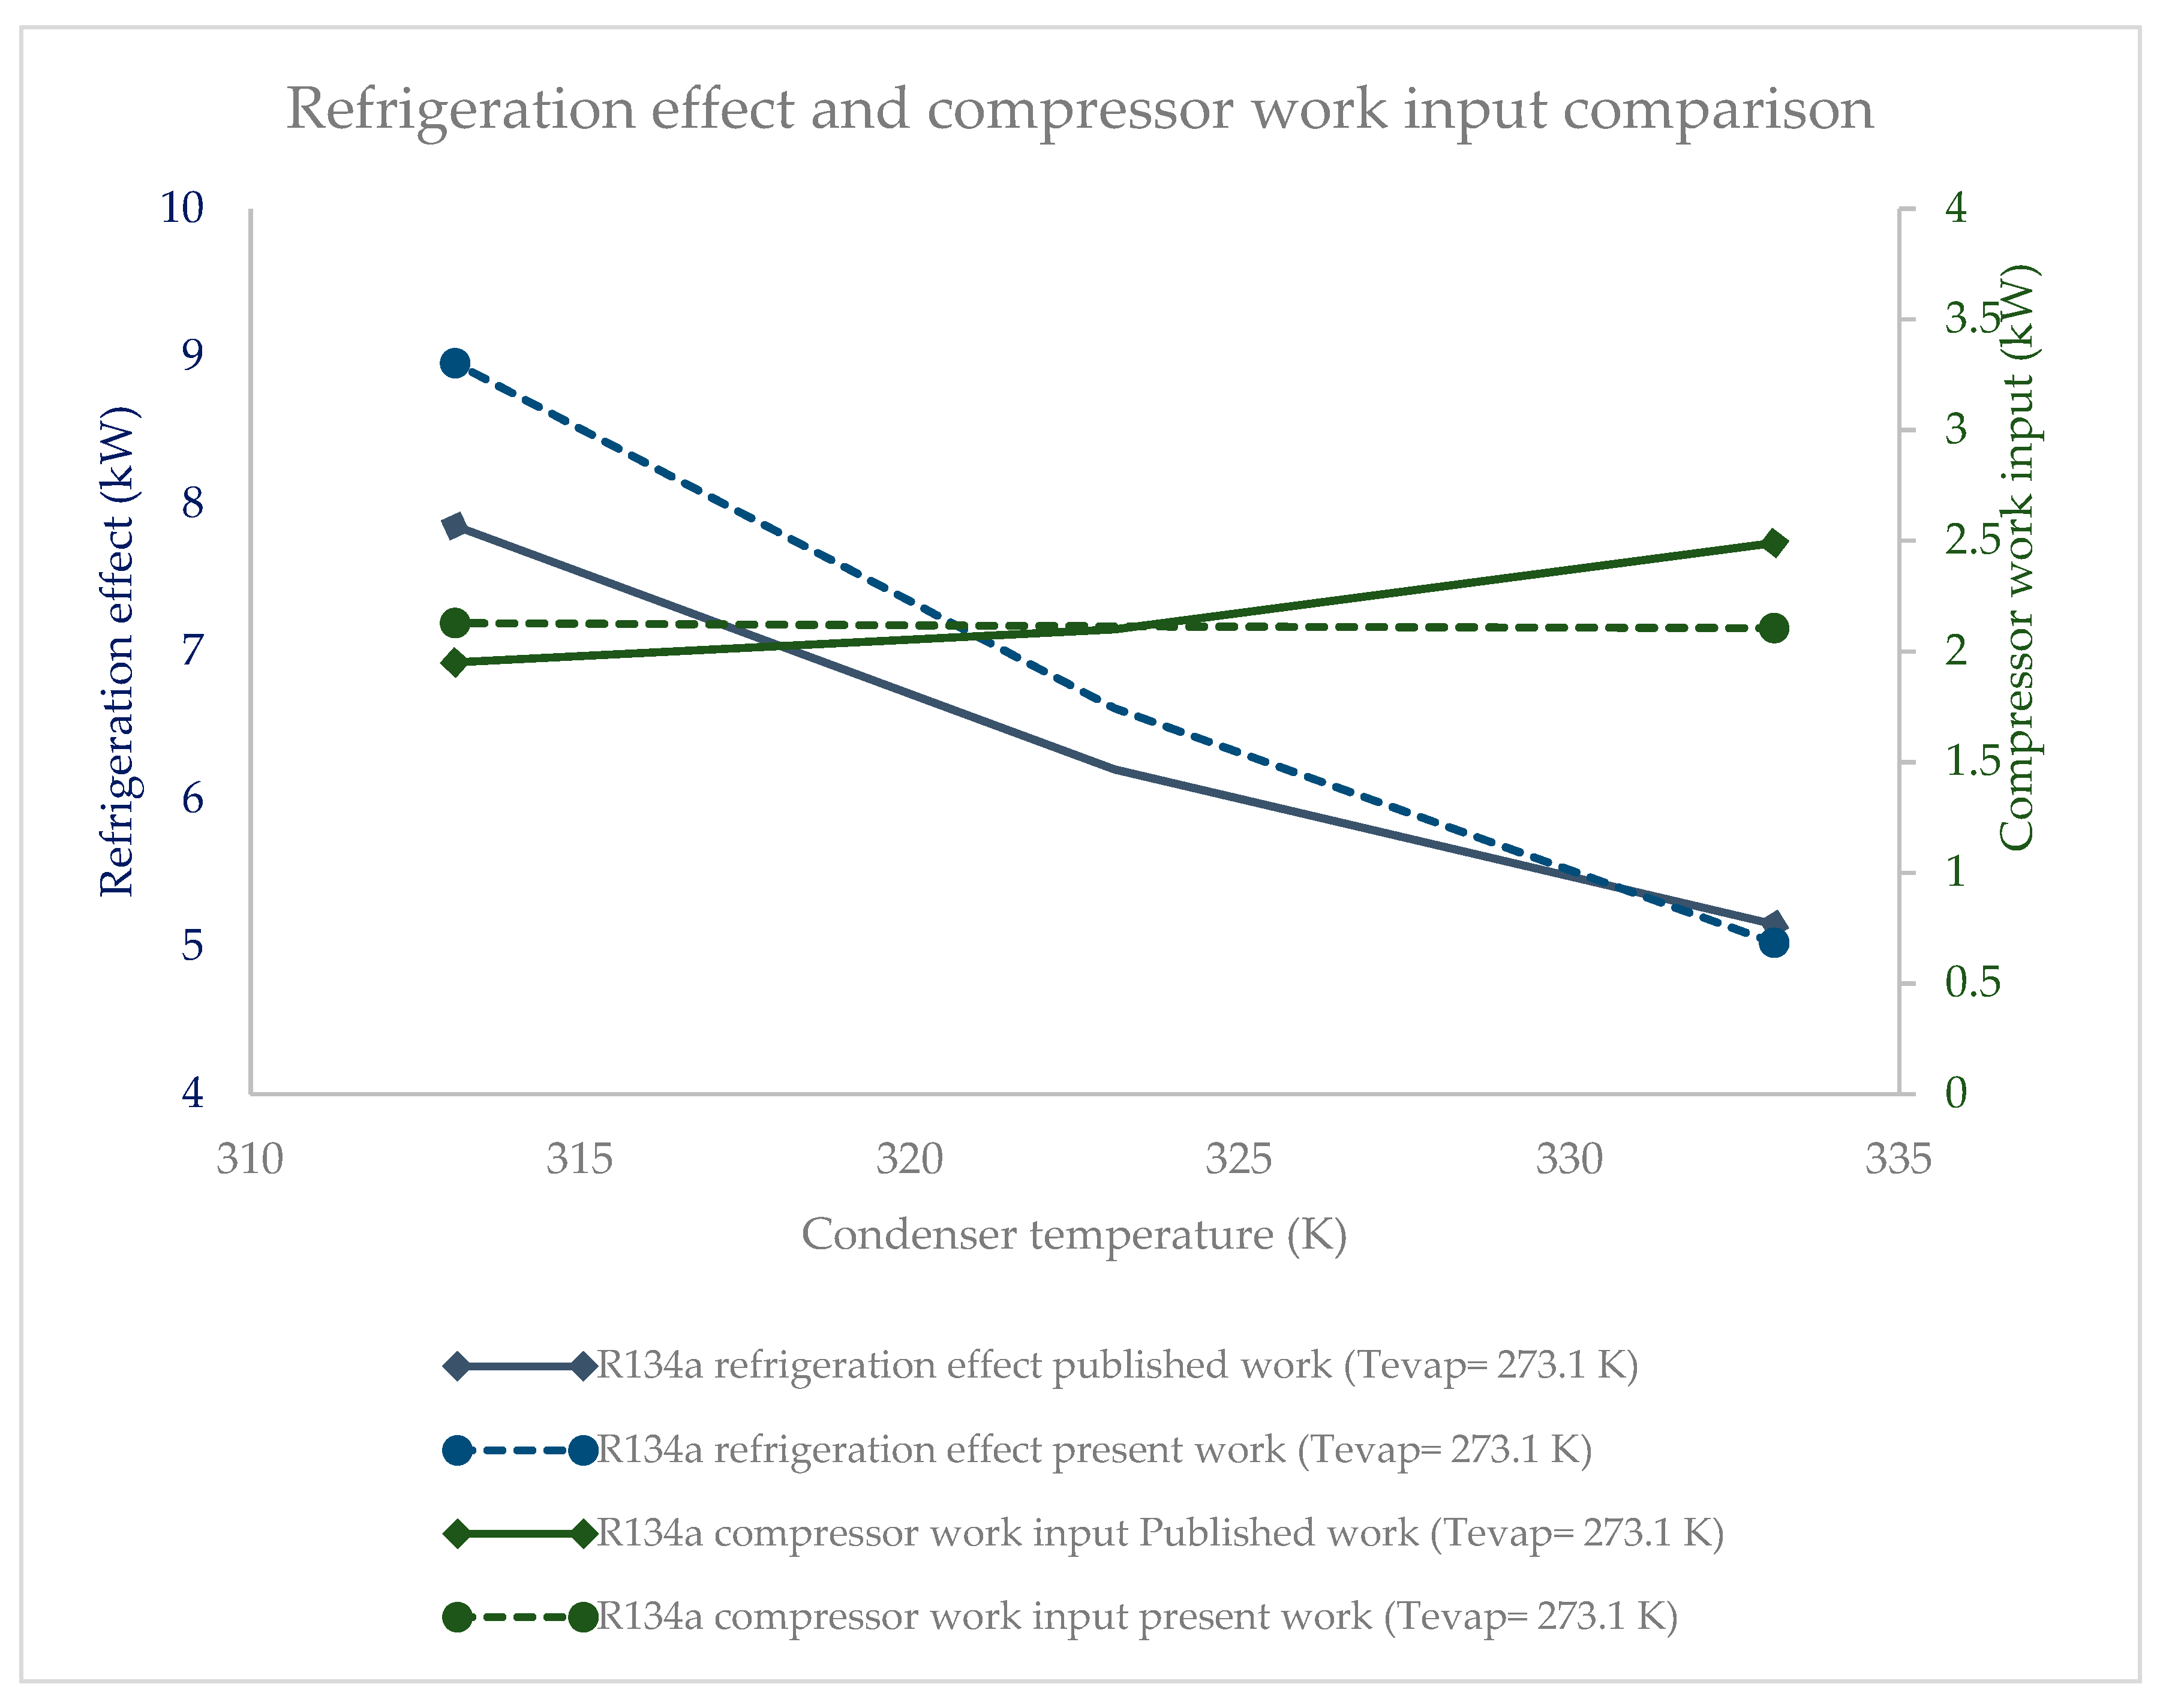
  • The compressor work input did not significantly vary against condenser pressure. The base refrigerant R134a clearly drew highest compressor work input at all condenser pressures, followed by R1234ze(Z), R134yf and R1233zd(E). The lowest power consumption among the HFO refrigerants was observed in the case of R365mfc. When condenser pressure was increased, the compressor work input increased and approached that of R134a.
  • The compressor work input was highest for R1234ze(Z) among the HFO refrigerants, followed by those of R1234yf R1233zd(E). R365mfc offered the lowest compressor work input among the HFO refrigerants, but its refrigeration effect was also the lowest of all. As the evaporator pressure was increased, the compressor work input of all refrigerants increased.
  • Overall, the COP is highest for R134a, and, among all the HFO refrigerants, the COP is highest for R1234ze(Z) and decreased steadily at higher condenser pressures. When the condenser pressure was increased, the COP decreased for all refrigerants in general. This decrease was quite slow for R1234ze(Z), and it was relatively rapid for R1233zd(E) and R1234yf. For R365mfc, the COP dropped drastically at higher condenser pressures.
  • The COP was highest for R1234ze(Z) among the HFO refrigerants, and lowest for R365mfc at all evaporator pressures. The COP of all refrigerants tended to increase when the evaporator pressure was increased. The COP of R365mfc increased rapidly but still lagged behind those of all other refrigerants at all evaporator pressures.
  • The VRC of R1234ze(Z) was highest at 6 bars of condenser pressure, the VRC of R1234yf and R1233zd(E) were nearly equal, and the lowest values were obtained in the case of R365mfc. As the condenser pressure was increased, the VRC decreases linearly. The decrease was lowest for R1234ze(Z) and the highest for R365mfc at higher condenser pressures.
  • R1234ze(Z) had the highest VRC among the HFO refrigerants at all evaporator pressures, followed by those of R1234yf, R1233zd(E) and R365mfc. Though R1234ze(Z) required a higher compressor work input, it also had higher refrigeration effects. The VRC of refrigerants increased rapidly as the evaporator pressure was increased. This increase was sharp for R365mfc and relatively slow for R1234yf and R1233zd(E).
From a previous discussion, it was clear that R1234ze(Z) has most appropriate thermodynamic characteristics. Its refrigeration capacity was the highest among the analyzed HFO refrigerants, and this value was 13.5% and 14.6% less than that of R134a at 9 and 12 bars of condenser pressure, respectively. Its compressor power input was 8.9% and 8.8% lower than that of R134a at 9 and 12 bars of condenser pressures, respectively, and its COP values were also comparable to that of R134a at just 5% and 6.5% less than that of R134a at 9 and 12 bars of condenser pressure, respectively. Therefore, R1234ze(Z) is the most suitable refrigerant to be used as a drop-in replacement of R134a in upcoming commercial refrigeration equipment.

Author Contributions

M.F. and A.H. conducted the numerical modelling and analyses, and they drafted the manuscript. M.N. did the correspondence. S.N. and M.U. added the literature section. S.R.N. and M.I. did the proofreading of the article. R.N. and A.R. did the analysis of refrigerants in comparison to the bench marked refrigerants. A.T., A.P., and J.M.A. did the final editing and proof read and helped in preparation of the revised manuscript. All authors have read and agreed to the published version of the manuscript.

Funding

This research received no external funding.

Conflicts of Interest

There are no conflicts of interest among any author for this manuscript.

Abbreviations

GWPGlobal warming potential
CFCsChlorofluorocarbons
HCFCsHydrochlorofluorocarbons
HFCsHydrofluorocarbons
HFOsHydrofluoroolefens
VCRCVapor compression refrigeration cycle
VRCVolumetric refrigeration capacity
EESEngineering equation solver
NBPNormal boiling point
ASH Reference state for ASHRAE
IIR International Institute of Refrigeration
COPCoefficient of performance
HVACHeating ventilation and air-conditioning system
List of symbols
ρDensity of refrigerant
ηIsentropic efficiency of compressor
QevapRefrigeration effect of evaporator
PcompCompressor power input
COPImprovement in coefficient of performance
Mass flow rate of refrigerant
hRefrigerant specific enthalpy
NCompressor speed
DcompCompressor displacement
PRefrigerant pressure
Additional subscripts
SIsentropic process
1, 2, 3, … State points on property diagram

References

  1. Usman, M.; Hayat, N. Lubrication, emissions, and performance analyses of LPG and petrol in a motorbike engine: A comparative study. J. Chin. Inst. Eng. 2020, 43, 47–57. [Google Scholar] [CrossRef]
  2. Farooq, M.; Saeed, M.; Imran, M.; Uddin, G.; Asim, M.; Bilal, H.; Younas, M.; Andresen, J.M. CO2 capture through electro-conductive adsorbent using physical adsorption system for sustainable development. Environ. Geochem. Health 2019, 1–9. [Google Scholar] [CrossRef] [PubMed]
  3. Kashif, M.; Awan, M.; Nawaz, S.; Amjad, M.; Talib, B.; Farooq, M.; Nizami, A.; Rehan, M. Untapped renewable energy potential of crop residues in Pakistan: Challenges and future directions. J. Environ. Manag. 2020, 256, 109924. [Google Scholar] [CrossRef] [PubMed]
  4. Abas, N.; Kalair, A.R.; Khan, N.; Haider, A.; Saleem, Z.; Saleem, M.S. Natural and synthetic refrigerants, global warming: A review. Renew. Sustain. Energy Rev. 2018, 90, 557–569. [Google Scholar] [CrossRef]
  5. Kharal, H.S.; Kamran, M.; Ullah, R.; Saleem, M.Z.; Alvi, M.J. Environment-Friendly and Efficient Gaseous Insulator as a Potential Alternative to SF6. Processes 2019, 7, 740. [Google Scholar] [CrossRef] [Green Version]
  6. Zhang, D.; Gao, Z. Improvement of Refrigeration Efficiency by Combining Reinforcement Learning with a Coarse Model. Processes 2019, 7, 967. [Google Scholar] [CrossRef] [Green Version]
  7. Usman, M.; Hayat, N. Use of CNG and Hi-octane gasoline in SI engine: A comparative study of performance, emission, and lubrication oil deterioration. Energy Sources Part A Recovery Util. Environ. Eff. 2019, 1–15. [Google Scholar] [CrossRef]
  8. The Effects of Climate Change; NASA: Washington, DC, USA. Available online: https://climate.nasa.gov/effects/ (accessed on 30 December 2019).
  9. ASHRAE. New Developments in Lower GWP Refrigerants (MENA)—HVACR Expo; ASHRAE: Dubai, UAE, 2018; Available online: https://www.hvacrexpodubai.com/media/1681/ashrae.pdf (accessed on 30 December 2019).
  10. Steffen, J.; Bernath, P.F.; Boone, C.D. Trends in halogen-containing molecules measured by the Atmospheric Chemistry Experiment (ACE) satellite. J. Quant. Spectrosc. Radiat. Transf. 2019, 238, 106619. [Google Scholar] [CrossRef]
  11. Protocol, M. Montreal Protocol on Substances that Deplete the Ozone Layer; US Government Printing Office: Washington, DC, USA, 1987; Volume 26, pp. 128–136.
  12. Nielsen, S.; Christensen, S.W.; Thorsen, R.S.; Elmegaard, B. Comparison of Heat Pump Design and Performance for Modern Modern Refrigerants. In Proceedings of the 13th IIR Gustav Lorentzen Conference on Natural Refrigerants (GL2018), Valencia, Spain, 18–20 June 2018; pp. 307–314. [Google Scholar]
  13. Reddy, V.S.; Panwar, N.; Kaushik, S.C. Exergetic analysis of a vapour compression refrigeration system with R134a, R143a, R152a, R404A, R407C, R410A, R502 and R507A. Clean Technol. Environ. Policy 2012, 14, 47–53. [Google Scholar] [CrossRef]
  14. Mussati, S.F.; Mansouri, S.S.; Gernaey, K.V.; Morosuk, T.; Mussati, M.C. Model-Based Cost Optimization of Double-Effect Water-Lithium Bromide Absorption Refrigeration Systems. Processes 2019, 7, 50. [Google Scholar] [CrossRef] [Green Version]
  15. Wang, Y.; Velswamy, K.; Huang, B. A long-short term memory recurrent neural network based reinforcement learning controller for office heating ventilation and air conditioning systems. Processes 2017, 5, 46. [Google Scholar] [CrossRef] [Green Version]
  16. James, M.; Calm, P.E. Refrigerant options for centrifugal chillers. In Proceedings of the 2004 International Workshop on Ozone Depleting Substance Institute Technologies Xian China, Xi’an, China, 17 September 2004. [Google Scholar]
  17. New Refrigerants Impact Standards and Codes; Carrier Engineering Newsletter; Volume 3. Issue 2. Available online: https://dms.hvacpartners.com/docs/1001/Public/0E/ENG_NEWS_3_2.pdf (accessed on 30 December 2019).
  18. Poole, J.E.; Powell, R. Non Ozone Depleting and Low Global Warming Potential Refrigerants for Low Temperature Refrigeration. U.S. Patent 9,023,231, 5 May 2015. [Google Scholar]
  19. Calm, J.M. The next generation of refrigerants—Historical review, considerations, and outlook. Int. J. Refrig. 2008, 31, 1123–1133. [Google Scholar] [CrossRef]
  20. Mota-Babiloni, A.; Navarro-Esbrí, J.; Barragán-Cervera, Á.; Molés, F.; Peris, B. Experimental study of an R1234ze (E)/R134a mixture (R450A) as R134a replacement. Int. J. Refrig. 2015, 51, 52–58. [Google Scholar] [CrossRef]
  21. The Kyoto Protocol and Greenhouse Gas Emissions; United Nations: Kyoto, Japan, 1999. Available online: https://www.aph.gov.au/Help/404?item=%2f...%2fhouse_of_representatives_committees&user=extranet%5cAnonymous&site=website (accessed on 30 December 2019).
  22. Alahmer, A.; Alsaqoor, S. Simulation and optimization of multi-split variable refrigerant flow systems. Ain Shams Eng. J. 2018, 9, 1705–1715. [Google Scholar] [CrossRef]
  23. Finally, a Replacement for R123? Available online: https://www.coolingpost.com/world-news/finally-a-replacement-for-r123/ (accessed on 30 December 2019).
  24. Environmental Protection Agency. Summary Guide to the HFC Phase Down. 2015. Available online: https://www.epa.ie/pubs/advice/air/ods/6%20%20IRL%20Summary%20Guide%20to%20the%20HFC%20Phase%20Down%20V1.0.pdf (accessed on 30 December 2019).
  25. Usman, M.; Farooq, M.; Naqvi, M.; Saleem, M.W.; Hussain, J.; Naqvi, S.R.; Jahangir, S.; Usama, J.; Muhammad, H.; Idrees, S.; et al. Use of Gasoline, LPG and LPG-HHO Blend in SI Engine: A Comparative Performance for Emission Control and Sustainable Environment. Processes 2020, 8, 74. [Google Scholar] [CrossRef] [Green Version]
  26. Lavrenchenko, G.K.; Ruvinskij, G.Y.; Iljushenko, S.V.; Kanaev, V.V. Thermophysical properties of refrigerant R134a. Int. J. Refrig. 1992, 15, 386–392. [Google Scholar] [CrossRef]
  27. Thermodynamic Properties of HCFC-123; SUVA 123 Refrigerant. Germany. Available online: https://www.chemours.com/Refrigerants/en_US/assets/downloads/h47753_hcfc123_thermo_prop_eng.pdf (accessed on 30 December 2019).
  28. Hulse, R.J.; Basu, R.S.; Singh, R.R.; Thomas, R.H. Physical properties of HCFO-1233zd (E). J. Chem. Eng. Data 2012, 57, 3581–3586. [Google Scholar] [CrossRef]
  29. Thermodynamic Properties of DuPont Opteon-yf SI Units; France, 2019. Available online: http://www.gasco-france.com/fichs/12683.pdf (accessed on 30 December 2019).
  30. Marrucho, I.M.; Oliveira, N.S.; Dohrn, R. Vapor-phase thermal conductivity, vapor pressure, and liquid density of R365mfc. J. Chem. Eng. Data 2002, 47, 554–558. [Google Scholar] [CrossRef]
  31. Solstice® ze Refrigerant (HFO-1234ze). Available online: https://www.honeywell-refrigerants.com/europe/product/solstice-1234ze/ (accessed on 30 December 2019).
  32. Qamar, A.; Farooq, M.; Amjad, M.; Bilal, H.; Sultan, M.M. Experimental Investigation of Heat Sink Configuration Effect on the COP of Thermoelectric Refrigeration System for Storage of Polio Vaccine. J. Faculty Eng. Technol. 2016, 23, 1–10. [Google Scholar]
  33. Eyerer, S.; Wieland, C.; Vandersickel, A.; Spliethoff, H. Experimental study of an ORC (Organic Rankine Cycle) and analysis of R1233zd-E as a drop-in replacement for R245fa for low temperature heat utilization. Energy 2016, 103, 660–671. [Google Scholar] [CrossRef]
  34. Gomaa, A. Performance characteristics of automotive air conditioning system with refrigerant R134a and its alternatives. Int. J. Energy Power Eng. 2015, 4, 168. [Google Scholar] [CrossRef] [Green Version]
  35. Mota-Babiloni, A.; Navarro-Esbrí, J.; Barragán, Á.; Molés, F.; Peris, B. Drop-in energy performance evaluation of R1234yf and R1234ze(E) in a vapor compression system as R134a replacements. Appl. Therm. Eng. 2014, 71, 259–265. [Google Scholar] [CrossRef] [Green Version]
  36. Aized, T.; Hamza, A. Thermodynamic Analysis of Various Refrigerants for Automotive Air Conditioning System. Arab. J. Sci. Eng. 2019, 44, 1697–1707. [Google Scholar] [CrossRef]
  37. Aprea, C.; Greco, A.; Maiorino, A.; Masselli, C.; Metallo, A. HFO1234ze as Drop-in Replacement for R134a in Domestic Refrigerators: An Environmental Impact Analysis. Energy Procedia 2016, 101, 964–971. [Google Scholar] [CrossRef]
  38. Bolaji, B.O.; Komolafe, O.D.; Ajayi, F.O. Performance Assessment of three Eco-Friendly Hydro-fluorocarbon and Hydrocarbon refrigerant mixtures as R22 alternatives in Refrigeration Systems. Middle East J. Sci. Res. 2015, 23, 1677–1684. [Google Scholar]
  39. McLinden, M.O.; Brown, J.S.; Brignoli, R.; Kazakov, A.F.; Domanski, P.A. Limited options for low-global-warming-potential refrigerants. Nat. Commun. 2017, 8, 14476. [Google Scholar] [CrossRef] [PubMed]
  40. Raveendran, P.S.; Sekhar, S.J. Energy and exergy analysis on hydrofluoroolefin/hydrofluorocarbon (HFO/HFC) refrigerant mixtures in low and medium temperature small-scale refrigeration systems. Proc. Inst. Mech. Eng. Part E J. Process Mech. Eng. 2019. [Google Scholar] [CrossRef]
  41. Sánchez, D.; Cabello, R.; Llopis, R.; Arauzo, I.; Catalán-Gil, J.; Torrella, E. Energy performance evaluation of R1234yf, R1234ze (E), R600a, R290 and R152a as low-GWP R134a alternatives. Int. J. Refrig. 2017, 74, 269–282. [Google Scholar] [CrossRef]
  42. Sethi, A.; Becerra, E.V.; Motta, S.Y. Low GWP R134a replacements for small refrigeration (plug-in) applications. Int. J. Refrig. 2016, 66, 64–72. [Google Scholar] [CrossRef]
  43. McLinden, M.O.; Kazakov, A.F.; Steven Brown, J.; Domanski, P.A. A thermodynamic analysis of refrigerants: Possibilities and tradeoffs for Low-GWP refrigerants. Int. J. Refrig. 2014, 38, 80–92. [Google Scholar] [CrossRef]
  44. Domanski, P.A.; Brignoli, R.; Brown, J.S.; Kazakov, A.F.; McLinden, M.O. Low-GWP refrigerants for medium and high-pressure applications. Int. J. Refrig. 2017, 84, 198–209. [Google Scholar] [CrossRef] [PubMed]
  45. Uddin, K.; Saha, B.B.; Thu, K.; Koyama, S. Low GWP Refrigerants for Energy Conservation and Environmental Sustainability. In Advances in Solar Energy Research; Tyagi, H., Agarwal, A.K., Chakraborty, P.R., Powar, S., Eds.; Springer: Singapore, 2019; pp. 485–517. [Google Scholar]
  46. ASHRAE. ANSI/ASHRAE Standard 34-2019, Designation and Safety Classification of Refrigerants; ASHRAE: Atlanta, GA, USA, 2019; Available online: https://www.ashrae.org/technical-resources/standards-and-guidelines/standards-addenda/addenda-to-standard-34-2019 (accessed on 30 December 2019).
  47. Shahzad, M.K.; Rehan, M.A.; Ali, M.; Mustafa, A.; Abbas, Z.; Mujtaba, M.; Akram, M.I.; Yousaf, M. Cooling Performance Assessment of a Slinky Closed Loop Lake Water Heat Pump System under the Climate Conditions of Pakistan. Processes 2019, 7, 553. [Google Scholar] [CrossRef] [Green Version]
  48. Moshfeghian, D.M. How to Estimate Compressor Efficiency? Available online: http://www.jmcampbell.com/tip-of-the-month/2015/07/how-to-estimate-compressor-efficiency/ (accessed on 30 December 2019).
  49. Imran, M.; Pambudi, N.A.; Farooq, M. Thermal and hydraulic optimization of plate heat exchanger using multi objective genetic algorithm. Case Stud. Therm. Eng. 2017, 10, 570–578. [Google Scholar] [CrossRef]
  50. Navarro-Esbrí, J.; Mendoza-Miranda, J.M.; Mota-Babiloni, A.; Barragán-Cervera, A.; Belman-Flores, J.M. Experimental analysis of R1234yf as a drop-in replacement for R134a in a vapor compression system. Int. J. Refrig. 2013, 36, 870–880. [Google Scholar] [CrossRef]
  51. Trott, A.R.; Welch, T. 3—Refrigerants. In Refrigeration and Air Conditioning, 3rd ed.; Trott, A.R., Welch, T., Eds.; Butterworth-Heinemann: Oxford, UK, 2000; pp. 28–35. [Google Scholar]
Figure 1. Vapor compression refrigeration cycle for R134a on P–h property diagram.
Processes 08 00187 g001
Figure 2. Comparison of the EES model for refrigeration effect and compressor work.
Processes 08 00187 g002
Figure 3. Error analysis of the results for the refrigeration effect and the compressor work input.
Processes 08 00187 g003
Figure 4. Comparison of a vapor compression refrigeration cycle (VCRC) on a p–h plot for (a) R365mfc and (b) R1233zd(E).
Processes 08 00187 g004
Figure 5. Comparison of VCRC on a p–h plot for (a) R1234yf and (b) R1234ze(Z).
Processes 08 00187 g005
Figure 6. (a) Refrigeration effect as a function of condenser pressure (evaporator pressure = 1.5 bar). (b) Refrigeration effect relative to R134a (%) (evaporator pressure = 1.5 bar).
Processes 08 00187 g006
Figure 7. (a) Refrigeration effect as a function of evaporator pressure (condenser pressure = 9 bar). (b) Refrigeration effect relative to R134a (condenser pressure = 9 bar).
Processes 08 00187 g007aProcesses 08 00187 g007b
Figure 8. (a) Compressor work input as a function of condenser pressure (evaporator pressure = 1.5 bar). (b) Compressor work input relative to R134a (%) (evaporator pressure = 1.5 bar).
Processes 08 00187 g008
Figure 9. (a) Compressor work input as a function of evaporator pressure (condenser pressure = 9 bar). (b) Compressor work input relative to R134a (%) (condenser pressure = 9 bar).
Processes 08 00187 g009
Figure 10. (a) Coefficient of performance (COP) as a function of condenser pressure (evaporator pressure = 1.5 bar). (b) COP relative to R134a (%) (evaporator pressure = 1.5 bar).
Processes 08 00187 g010
Figure 11. (a) COP as a function of evaporator pressure (condenser pressure = 9 bar). (b) COP relative to R134a (%) (condenser pressure = 9 bar).
Processes 08 00187 g011aProcesses 08 00187 g011b
Figure 12. (a) Volumetric refrigeration capacity (VRC) as a function of condenser pressure (evaporator pressure = 1.5 bar). (b) VRC relative to R134a (%) (evaporator pressure = 1.5 bar).
Processes 08 00187 g012
Figure 13. (a) VRC as a function of evaporator pressure (condenser pressure = 9 bar). (b) VRC relative to R134a (%) (condenser pressure = 9 bar).
Processes 08 00187 g013
Table 1. Thermo-physical properties of refrigerants.
Thermodynamic Properties of RefrigerantsRefrigerant CategoryMolar Mass (g/mol)Normal Boiling Point (NBP) (°C)Melting Point (°C)Vapor Pressure at 20 °C (kPa)Critical Temperature (°C)Global Warming Potential (GWP)
R134a [26]HFCs102.3−26.3−142.3571.7101 °C1320
R123 [27]HCFC152.9327.85−107258.5183.6877
R1233zd(E) [28]HCFO13019−107106.3165.7<5
R1234yf [29]HFO114.04−29.45−15059294.74
R365mfc [30]HFO14840<−2047187825
R1234ze(Z) [31]HFO114−19.0−156-1096
Table 2. Flammability and toxicity classifications of refrigerants [46].
Toxicity LevelNo Flame PropagationLower FlammabilityHigh Flammability
Low toxicityA1
R-22
R-134a
R-410A
R-404A
R1233zd (E)
R-407C
R/507A
R744 CO2
A2
R-152a
A2L *
R-32
R1234yf
R-1234ze(E)
A3
R-290 Propane
R-600a Isobutane
High toxicityB1
R-123
B2
B2L
R-717
Ammonia
B3

