Abstract
Radiofrequency (RF)-based monopolar (MM) and bipolar mode (BM) applicators are used to thermally create coagulation zones (CZs) in biological tissues with the aim of destroying surface tumors and minimizing blood losses in surgical resection. Both modes have disadvantages as regards safely and in obtaining a sufficiently deep coagulation zone (CZ). In this study, we compared both modes versus a switching monopolar mode (SMM) in which the role of the active electrode changes intermittently between the two electrodes of the applicator. In terms of clinical impact, the three modes can easily be selected by the surgeon according to the surgical maneuver. We used computational and experimental models to study the feasibility of working in MM, BM, and SMM and to compare their CZ characteristics. We focused exclusively on BM and SMM, since MM only creates small coagulation zones in the area between the electrodes. The results showed that SMM produces the deepest CZ between both electrodes (33% more than BM) and SMM did not stop the generator when an electrode lost contact with the tissue, as occurred in BM. Our findings suggest that the selective use of SMM and BM with a bipolar applicator offers greater advantages than using each type alone.
1. Introduction
Radiofrequency (RF) currents (500 kHz) are usually employed to create a coagulation zone (CZ) in biological tissues to destroy surface tumors [1] and minimize blood loss during RF-assisted surgical resection [2]. In both cases, the aim is to obtain sufficiently deep CZs to ensure either that the tumor is completely destroyed or that small-/medium-sized vessels are effectively sealed, respectively.
RF power is applied through at least two metal electrodes on the RF applicator in contact with the tissue. The behavior of the RF current varies according to the electrode position and dimensions of these electrodes. It can be applied in the monopolar (MM) or bipolar (BM) mode. With MM, the RF current flows between a small active electrode (<1 cm2) on the target zone and a large dispersive electrode (>50 cm2) on the patient’s back or thigh (Figure 1), so that the CZ is created exclusively around the active electrode, with extremely high current density.
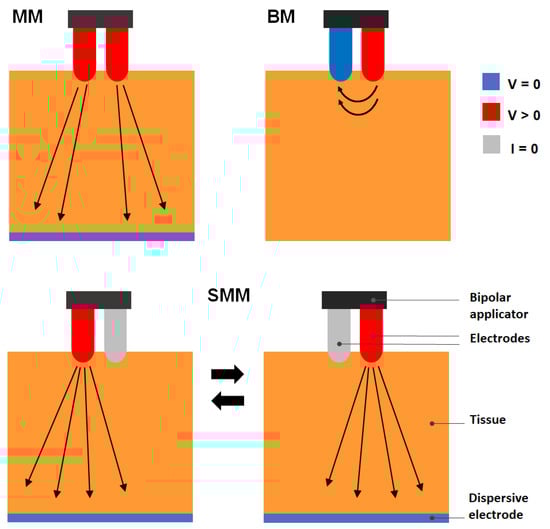
Figure 1.
Scheme of the radiofrequency (RF) application modes: monopolar mode (MM), bipolar mode (BM), and switching monopolar mode (SMM). Arrows indicate the direction of the current flow.
In BM, both electrodes have the same dimensions with an intervening electrical and thermal symmetry plane (both could hence be considered active electrodes, Figure 1) and the CZ is limited to the area between them.
Although the power delivery mode (monopolar or bipolar) and the applicator type (monopolar or bipolar) are really different features of an RF system, the applicator type usually coincides with the mode, i.e., MM employs a monopolar applicator (with a single active electrode), whereas BP employs a bipolar applicator (with two electrodes).
MM is generally able to create deeper CZs than BM, since it allows the current to penetrate deeper into the tissue. However, MM presents the following two drawbacks [3]: (1) the CZ can go beyond the target zone and produce unintentional thermal damage on adjacent tissue and (2) skin burns can be produced around the dispersive electrode with poor contact quality between electrode and skin. As BM does not have these drawbacks, it is inherently safer and therefore more usual in clinical practice. However, BM creates shallower CZs and requires both electrodes to be in contact with the tissue to ensure that the RF current flows through the closed circuit. Our aim was thus to explore a combined mode with the advantages of both modes, for which we considered a bipolar applicator with MM capability (e.g., to produce large CZs) or in BM in the opposite case. Our hypothesis was that the performance of a bipolar RF applicator would improve using it in a switching monopolar mode (SMM). In SMM, the role of active electrode changes alternately between the two electrodes of the bipolar RF applicator (Figure 1). In this regard, the interest is in a bipolar applicator that the surgeon can switch from one mode to other during the surgical procedure as required.
Our goal was to compare the three modes (MM, BM, and SMM) working in a bipolar applicator. For this, we used computational and experimental models in order to study the feasibility of the bipolar applicator working in the three modes and to compare the characteristics of the CZ obtained with them. We were especially interested in comparing the BM and the new SMM, since both could produce deeper CZs between the bipolar electrode tips than the MM. The comparison was aimed to assess if SMM allowed the following: (1) obtain a deeper coagulation zone in the intermediate space between the electrodes than BM and (2) correct the BM problem of stopping the current flow when one electrode was out of contact with the tissue surface, which often happens in minimally invasive procedures such as laparoscopy.
2. Computational Modeling
2.1. Model Geometry
The computational model mimicked the use of a bipolar RF applicator on a hepatic tissue surface. The bipolar RF applicator used in the study had a plastic handle and two metallic electrodes (Figure 2A). The electrodes were cylindrical in shape (1.5 mm radius and 20 mm long) topped with a spherical tip (Figure 2B). Both electrodes were internally cooled and the distance between their axes was 5 mm (2 mm distance between them). Cooled electrodes prevent the adjacent tissue from charring and produce larger lesion volumes than dry electrodes.
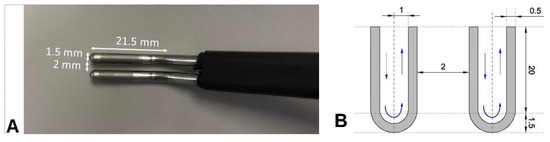
Figure 2.
(A) Bipolar RF applicator used to consider the geometry of the computational model. (B) Scheme of the electrodes’ tips included in the bipolar RF applicator of the left picture (in mm, out of scale).
The three-dimensional model included the tissue and both electrodes of the bipolar RF applicator. Since the volume presented a symmetry plane, we considered half of the entire geometry (see Figure 3A), so that the hepatic tissue was represented as a 12 × 12 × 16 cm3 block. These dimensions were chosen after conducting a convergence test to check that the boundary condition of the dispersive electrode did not affect the simulation results. The reference parameter for the convergence tests was the maximum temperature (Tmax) reached after 10 s at three points 1, 2, 5, 10, and 20 mm from the electrodes’ tip surface. The domain outer dimensions were initially those of the experimental setup, and we checked that an increase of 1 mm barely modified the value of Tmax (< 0.5%). We assumed an electrode penetration depth of 1 mm into the tissue.
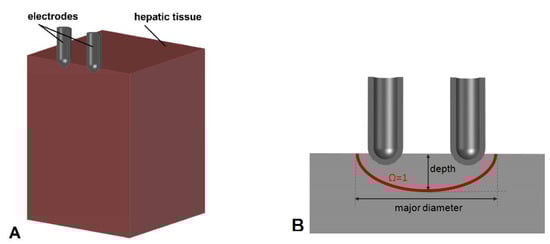
Figure 3.
A: Geometry and materials used in the study. B: Scheme of the intermediate space between the two applicator tips where the coagulation zone (CZ) (curve = 1) was expected. CZ depth was measured on the middle plane between the tips. CZ diameter was the longest distance between two points on a parallel plane to the upper tissue surface. Figures out of scale.
2.2. Governing Equations and Boundary and Initial Conditions
The model was based on a coupled electrical–thermal problem, which was solved numerically with COMSOL Multiphysics software (version 5.4, COMSOL, Burlington, MA, USA). The governing equation for the thermal problem was the Bioheat equation as follows:
where ρ is tissue density, c is specific heat, T is temperature, t is time, k is thermal conductivity, q is heat source produced by RF power, Qp is heat loss by blood perfusion, and Qm is the metabolic heat generation. This last term was not considered since it is negligible in radiofrequency ablation (RFA). As the effect of RF mode was not directly related to blood perfusion, we considered an ex vivo model in which Qp = 0. The heat source was that of RF power and was calculated from q = |E|2, where E is the electric field obtained from the electrical problem and is the electrical conductivity. Equation ∇·∇V = 0 was the governing equation for the electrical problem, V being the voltage. The electric field was calculated from E = −∇V. We used a quasi-static approach since the resistive current is much lower than the displacement current at RF (≈500 kHz) [4].
Table 1 shows the characteristics of materials used in the model [5,6,7]. We considered a temperature-dependent function for the electrical conductivity as follows:
where is the reference temperature at which the value of the electrical conductivity was measured. We adjusted the value of in order to match the initial values of the impedance between experimental and computer results (Table 1).

Table 1.
Characteristics of the materials used in the study [5,6,7].
Initial temperature was equal to room temperature during the experiments () and this same value was set at the outer boundaries of the tissue, except on its upper surface and the symmetry plane. A null thermal flux was set on the symmetry plane. A natural convection condition was modeled on the upper surface by means of Newton’s law of cooling as follows:
where is the normal vector to the surface and is the natural convection coefficient (10 W/K∙m2) [8]. The cooling effect produced by the liquid circulating inside the electrode was also modeled using Equation (2). As in this case the convection is forced, we used a thermal convection coefficient h with a value of 2887 W/K∙m2 and a coolant temperature (. This value was obtained taking into account electrode area and length and a flow rate of 45 mL/min. The values of and were those measured in the ex vivo experimentation (20 °C and 10 °C, respectively).
With respect to the electrical problem, zero current density was applied on the symmetry plane and on all the outer surfaces of the tissue, except on the bottom surface, whose condition depended on the mode. In fact, all the rest of the electrical conditions depended on the mode in the following way:
- BM: Zero voltage was set in one electrode tip and a value of V0 (V0 > 0) was set in the another. Zero current density was applied on the bottom tissue surface.
- MM: Both electrode tips were set at V0, and V = 0 was applied on the bottom tissue surface (considered as the dispersive electrode).
- SMM: Both electrode tips changed the conditions of V = V0 and zero current density with a switching frequency fS, while V = 0 was applied on the bottom tissue (dispersive electrode). The switching frequency fS was the time at which the active electrode role switched between the tips.
To assess thermal damage, we used the Arrhenius model [9] as follows:
where is the damage function, is the universal gas constant (8.1314 J/ K·mol), is a frequency factor (7.39 × 1039), and is the activation energy for the irreversible damage reaction (2.577 × 10⁵ J/mol). The value of = 1 corresponding to a 63% probability of cell death was used to define the coagulation zone [10].
2.3. Solver
We used the mesh generated by COMSOL, which took into account the physics and conditions of heat and electrical problems. The model mesh was heterogeneous, with a finer mesh size at the electrode–tissue interface, where the highest electrical and thermal gradients were expected. All the mesh elements used were tetrahedral with a maximum element size of 0.0144 m and a minimum element size of 0.00181 m. The mesh was verified by repeating the convergence test based on the analysis of Tmax used for the outer dimensions of the geometry. Starting from the initial mesh, we refined it using the automatic COMSOL “refine mesh”. The same convergence test was used for the time step. We used an adaptive scheme since we let the time-stepping method choose time steps freely.
2.4. Simulation Plan
The simulations ended at time tend, at which any point of the tissue reached 100 °C, since coagulation temperatures higher than 100 °C are not desired. At T > 100 °C, the water in the tissue vaporizes and gas is produced, which may escape to the surface causing audible steam pops that disrupt the tissue surface. Furthermore, if heating continues on dehydrated tissue, charring and arcing can occur. If at 16 s no point reached T = 100 °C, then tend = 16 s. Surgeons rarely make applications longer than this time at the same point.
We planned three sets of simulations to study different features of the modes:
- In the first set of simulations, as we were interested in the behavior of the different modes (BM, MM, and SMM) at different voltages, we simulated all the modes with values of V0 in the range 30–70 V in steps of 5 V. For the SMM mode, we assumed a frequency fS = 1 Hz, i.e., the active electrode switched applicator tips every second. The outcomes of the simulations were as follows: (1) temperature distributions in tissue, (2) tend value, (3) initial impedance and evolution, (4) CZ size. The electrical conductivity value was adjusted to match the initial computer impedance with that obtained in the experiments. CZ diameter and depth size were measured (see Figure 3B). As we were interested in the CZ between the electrodes, the depth of the CZ was measured in the middle plane between both tips.
- Once the maximum CZ voltage was obtained in the first set of simulations, we selected this voltage to run the second set of simulations. In this second set, we were interested in checking the behavior of the SMM for different frequencies and simulated fS between 1/8 and 4 Hz, i.e., changing the active electrode once every eight seconds and four times per second. In all the simulations the frequency was the double than in the previous one (starting with 1/8 Hz).
- The third set of simulations was run with the maximum CZ characteristics obtained in the previous set (voltage in the first and fS in the second). The third set compared the BM and SMM performance with different electrode–tissue penetration angles. This angle is usually varied in clinical practice to deal with irregular tissue shapes. We assumed a rotation of 10°, 20°, and 30° around the vertical electrode axis, as shown in Figure 4. These angles were chosen to ensure three different scenarios in which the last assumed that one of the tips was not in contact with the tissue.
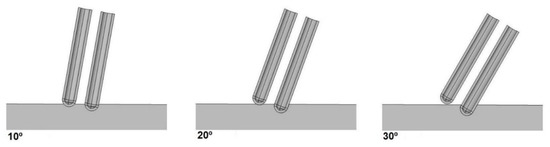 Figure 4. Three different angles of penetration considered for the geometry of the models used in the third set of simulations with rotation angles of 10°, 20°, and 30° with respect to the initial geometry.
3. Ex Vivo Experiments
The ex vivo experiments were aimed to do the following: (1) check the feasibility of a bipolar applicator in different modes, (2) adjust the electrical conductivity of the numerical model to compare the computational and experimental results, and (3) assess whether the results of the computational model were in agreement with the experiments.
The first step was to build the experimental setup and check the feasibility of operating the bipolar applicator in different models. The ex vivo model was based on cylindrical fragments of bovine liver inserted into a plastic container (12 cm diameter and 16 cm long) with a circular metal piece underneath acting as dispersive electrode (119 cm2 area). The penetration depth of the electrodes into the tissue was the same as that considered in the computer model, using the bipolar RF applicator shown in Figure 2 connected to an RF generator (Medtronic, Portsmouth, NH, USA). A saline flow rate of 45 mL/min was set to internally cool the electrodes at 10 °C. The experiments were conducted at room temperature (20 °C) and the tissue fragments were kept at this temperature during the tests.
We first conducted some preliminary experiments to match the electrical conductivity of the liver in the computational model. For this, we checked the impedance before the RF application and its evolution during operations. Impedance falls from its initial value until reaching a constant, or plateau, value. We applied a constant voltage and kept a constant pressure between the electrodes and the sample using an auxiliary support. This process was repeated three times in four different liver samples with all the modes (36 measurements in total). With the impedance and voltage values’ data from the experiments, we adjusted the electrical conductivity of the computer model to provide the same impedance behavior as the samples. We then proceeded with the simulations planned in the simulation plan.
After conducting all the computer simulations, we carried out a second set of experiments to determine whether the results provided by the computational model agreed with the experimental tests. RF currents were applied to the liver samples for the times considered in the first set of simulations for each ablation mode to compare the CZ geometry in the three modes. As in the computational results, CZ size was small in the times considered in the first set of simulations, which made visual observation difficult. For this reason, we also considered times of 30 and 120 s. The voltage value was different in each mode and was the same as those obtained in the computer results for maximum CZ. We repeated the experiment three times for every mode with three different fS (1/8, 1, and 4) in the case of SMM, for a total of 15 tests. After heating, each CZ was cross-sectioned and photographed. The CZ red zone major diameter and depth were measured in the intermediate space between the electrodes, as shown in Figure 3. We used the red zone of the CZ [11].
4. Results
4.1. Computational Results
4.1.1. First Set of Simulations: Optimum Voltage to Maximize the CZ
Table 2 shows the BM and SMM results obtained in the first set of simulations for five V0 values taking the simulation stop criterion (tend) into account. For each voltage, the table gives the tend value, the maximum temperature reached in the tissue, and the CZ dimensions at tend (according to Figure 3). The V0 values are the five consecutive values in the 30–70 V range, which include the voltage of the maximum CZ size (40 V in the bipolar case, and 45 V in the switching monopolar case) and also cases in which tend = 16 s and tend < 16 s.
Table 2.
Results obtained in the first set of simulations for bipolar and switching monopolar modes showing the level of voltage used, the tend and maximum temperature and stop time values, and the major CZ diameter and depth (measured according to Figure 3).
As shown in Table 2, the values of 40 and 45 V maximized the CZ dimensions in BM and SMM, respectively, and were thus considered the most favorable cases in each mode. Higher voltage values did not increase these dimensions, since the size depends not only on the applied voltage but also on the time of exposure to it. Comparing the results of the maximum CZ in both modes, the differences in the values of the largest diameter and the depth were 1.1 and 0.3 mm, respectively, indicating that the largest SMM diameter and depth were 41% and 25% higher than in BM.
Figure 5 shows the temperature distribution and the CZ boundary for BM and different values of applied voltage (30, 35, 40, 45, and 50 V). No CZ was obtained at 30 and 35 V for 16 s. At the other voltage values, the CZ was always in the space between the two electrodes, with the highest temperature reached on the surface. It can also be seen that the CZ notably increased between 35 and 40 V, after which it decreased, although more slowly. In all cases, symmetry was found with respect to the intermediate plane between the two electrodes in the temperature distribution and isosurface = 1.
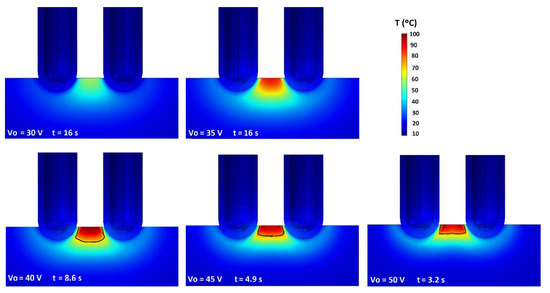
Figure 5.
Temperature distribution (°C) and isosurface = 1 (black line) for the BM in the symmetry plane of the geometry representing cases of V0 = 30 (t = 16 s), 35 (t = 16 s), 40 (t = 8.6 s), 45 (t = 4.9 s), and 50 V (t = 3.2 s), as selected in Table 2. The times in each graph are the times that satisfied the stop criterion.
Figure 6 give the same values as those in Figure 5 for SMM. Each graph represents a voltage selected for Table 2 (V0 = 40, 45, 50, 55, 60 V). At all voltages, the CZ was located in the intermediate zone between the electrodes. However, these zones were not symmetrical as in the bipolar mode, with symmetry variations according to the exposure time. In the cases of 40, 45, and 50 V with longer exposure times, the CZ was more symmetrical than for 55 or 60 V. It was also found that a greater volume of tissue achieved higher temperatures than in the bipolar case, since the entire zone around the electrodes was at temperatures higher than 50 °C.
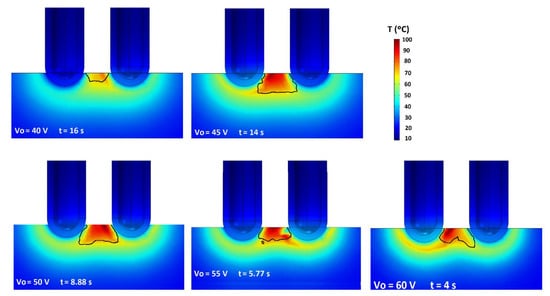
Figure 6.
Temperature distribution (°C) and isosurface = 1 (black line) for SMM in the symmetry plane of the geometry representing cases of V0 = 40 (t = 16 s), 45 (t = 14 s), 50 (t = 8.88 s), 55 (t = 5.77 s), and 60 V (t = 4 s), as selected in Table 2. The times in each graph are the times that satisfied the stop criterion.
In order to check the different MM behavior, Figure 7 is similar to Figure 5 and Figure 6. Each graph represents a voltage (V0 = 50, 55, 60, 65, 70 V). In MM, the CZ began to grow at the end of the electrode furthest from the other pole and increased towards the intermediate electrode space. In any of the cases considered, the CZ was located between the electrodes. This mode was therefore only taken into account to check its behavior, but not as an alternative to improve the bipolar mode in the RF applications considered.
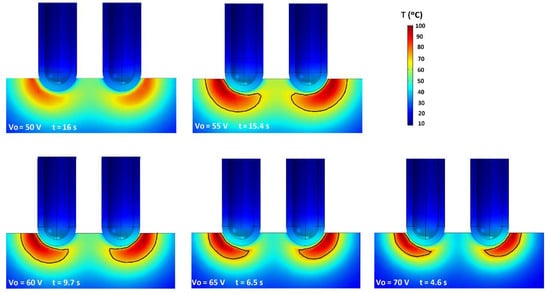
Figure 7.
Temperature distribution (°C) and isosurface = 1 (black line) for the MM in the symmetry plane of the geometry representing cases of V0 = 50 (t = 16 s), 55 (t = 15.4 s), 60 (t = 9.7 s), 65 (t = 6.5 s), and 70 V (t = 4.6 s). The times in each graph are the times that satisfied the stop criterion.
4.1.2. Second Set of Simulations: Optimum Switching Frequency to Maximize the CZ in SMM
In the second set of simulations, we were interested in checking the influence of the switching frequency fS on the CZ dimensions. Table 3 shows the tend value, the maximum temperature reached in the tissue, and the dimensions of the CZ at tend (according to Figure 3) at different frequencies in SMM, considering a voltage of 45 V in all cases. As can be seen, there were no differences in the tend value or in the maximum temperature reached in the tissue. The greatest differences were found in the major CZ diameter. The longer the switching time (fS = 1/4 and fS = 1/8), the greater the major diameter and the smaller the depth. For the purposes of the hepatic coagulation and surface ablation, we were interested in increasing the depth of the CZ. The most favorable cases were thus those of lower frequency values (fS = 1, fS = 2, and fS = 4) in which the depth of the CZ was almost the same. As only a slight increase in depth was observed with increased frequency, we found that the most favorable switching frequency was fS = 4. There were differences in CZ depth between the most favorable BM case (40 V) and SMM (45 V, fS = 4) of 33%. Figure 8 shows the temperature distribution and the isosurface = 1 in the symmetry plane of the geometry for SMM at 45 V. Each graph represents a frequency mentioned in Table 3 (fS = 4, 2, 1, 1/2, 1/4, 1/8). As can be seen, the CZ asymmetry detected in Figure 6 was most notable in cases of fS = 1/4 and fS = 1/8.
Table 3.
Results of the switching monopolar mode using 45 V for different switching frequency (fS) values.
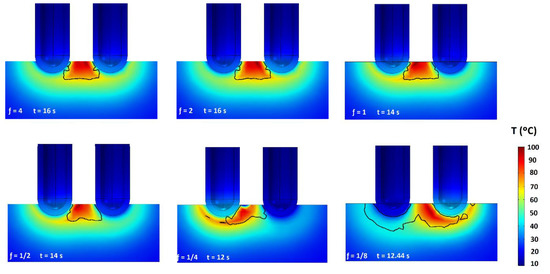
Figure 8.
Temperature distribution (°C) and isosurface = 1 (black line) for the SMM (45 V) in the symmetry plane of the geometry representing cases of fS = 4, 2, 1, 1/2, 1/4, and 1/8. The times in each graph are the times that satisfied the stop criterion.
4.1.3. Third Set of Simulations: Variations of the Electrode–Tissue Penetration Angle
The results of the third set of simulations are shown in Figure 9. The graphs again show the temperature distribution and isosurface = 1 in the symmetry plane. The columns give the mode (BM or SMM) and the rows indicate the electrode rotation angle (0°, 10°, 20°, or 30°). All the BM graphs were made at 40 V and for SMM we used 45 V and fS = 4. The same stop criterion was used as in the first set and the graphs indicate the time they were recorded. Both modes showed increased heating around the tip, which was losing contact. If a tip loses some contact, the temperature gradient rises around it and reduces the tend value. The extreme case was represented by a 30° rotation, i.e., when one of the tips lost all contact with the tissue. Both modes behaved differently in this extreme case; in BM there was no heating and hence no CZ, while in BM the current stopped flowing between the tips and no heat was applied as the electrical circuit was open. In SMM, heating only occurred around the tip in contact but the circuit remained closed. The CZ was greater in SMM than in BM at all the rotations, although with the increased rotation the CZ in SMM was more concentrated around the tip with less contact and no CZ in the inter-electrode space.
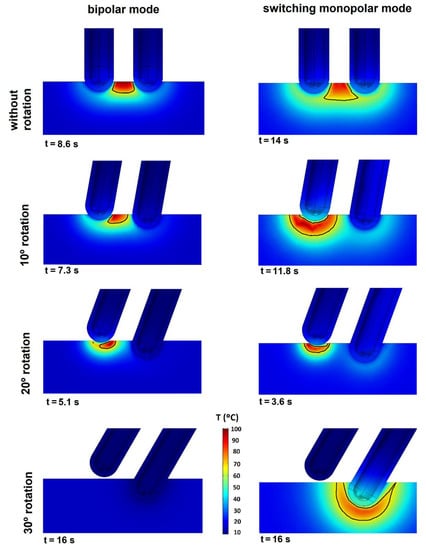
Figure 9.
Temperature distribution (°C) and isosurface Ω = 1 (black line) for the BM and SMM modes in the symmetry plane of the geometry using different RF applicator angles of penetration (0, 10, 20 and 30°). Voltage values of 40 and 45 V were used for BM and SMM, respectively. fS = 4 was used in SMM. The time is the tend value in each simulation.
4.2. Experimental Results
The initial values (Z0) and plateau (Zp) impedance values in each mode were the first experimental results. These values were as follows: Z0 = 630 ± 40 Ω and Zp = 480 ± 25 Ω in BM, Z0 = 455 ± 50 Ω and Zp = 300 ± 40 Ω in MM, and Z0 = 510 ± 35 Ω and Zp = 350 ± 25 Ω in SMM. The value of electrical conductivity of 0.25 S/m used in the computational model provided the best match with the experimental results. The initial and plateau impedances in the computational models were as follows: Z0 = 630 Ω and Zp = 500 Ω in BM, Z0 = 450 Ω and Zp = 320 Ω in MM, and Z0 = 517 Ω and Zp = 360 Ω in SMM. As the MM had the highest current flow, its impedance values were smaller, whereas the BM obtained the highest impedance. The SMM was an intermediate case.
We also assessed the level of agreement between the experimental and computational CZ spatial distribution. Figure 10 shows representative CZ distribution photos of the experimental setup. Figure 10A–C shows the distribution in the cross-sectional plane in BM (40 V, 120 s), MM (60 V, 30 s), and SMM (45 V, 120 s, fS = 4), respectively. Figure 10A,C shows that the CZ was mainly in the inter-electrode space. Figure 10B shows that the CZ started to appear around the electrodes and was smaller in the inter-electrode space. We chose the MM distribution at 30 s since it clearly showed the CZ growth direction. This effect was also seen on the tissue surface. Figure 10D,E shows the CZ spatial distribution on the surface for MM (60 V, 30 s) and SMM (45 V, 12 s, fS = 1/8), respectively. In MM (Figure 10D) the CZ formed a ring around the electrodes, but in SMM (Figure 10E) it was more restricted between the electrodes. Figure 10E was also chosen since it was made at a frequency of 1/8 and 12 s of RF application (with an electrode switch every eight seconds) and created an asymmetric CZ, while Figure 10F is the cross-sectioned CZ shown in Figure 10E.
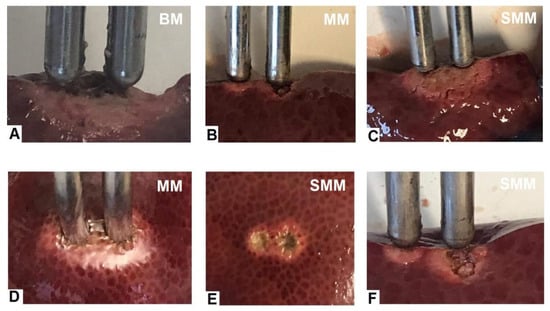
Figure 10.
(A–C) show the spatial CZ distribution in the cross-sectional plane in BM (40 V, 120 s), MM (60 V, 30 s), and SMM (45 V, 120 s, fS = 4), respectively. (D,E) show the CZ (surface view) for MM (60 V, 30 s) and SMM (45 V, 12 s, fS = 1/8), respectively. (F) is the cross-sectioned CZ shown in (E).
The experimental results also allowed us to compare CZ depth of the BM and SMM modes, which in all cases was greater in SMM, with an increase from 21% to 37% in the set of cases and a mean of 29%. We also checked that the bipolar applicator could work in the three different modes and changing between modes was quite simple.
5. Discussion
The results of this study will help to improve RF applicators and RF heating in the treatment of hepatic tumors. We believe them to be novel since as far as we know no studies are devoted to the question we proposed. Although we have found references with studies on switching modes [12,13,14], none of them were related to the superficial non-invasive application of RF currents (ablation of superficial tumors or coagulation previous to resection). In [12], the authors used rapid switching between three cluster electrodes for a period of 12 min at a switching frequency of 1 s. In [13], coagulation zones were also created by three monopolar RF electrodes in a triangular configuration for 12 min with a switching algorithm. The above two approaches were different since they used a cluster of electrodes, and not a bipolar electrode. They also used different application protocols (treatment time and power) and did not analyze the problem of the possible irregular support of the bipolar RF applicators, whereas we assessed the feasibility of a versatile bipolar RF applicator in BM or SMM.
The computational model allowed us to check the optimum switching voltage and frequency in order to obtain the CZ depth. The experimental setup showed the feasibility of implementing a bipolar applicator working in both modes, and the results of the experimental and computational models were found to be in agreement.
The new applicator is aimed to treat surface tumors and minimize blood losses during RF-assisted surgical resection. In this sense, this applicator is suitable for liver tissue and other perfused organs treated by RF such as muscle, kidney, or breast.
One of the limitations was that we could not compare the CZ obtained for times <16 s since the CZ obtained in these times was difficult to measure. This was a problem not only of visualization, but also of cutting the samples on the cross-sectional plane. However, the comparisons at longer times allowed us to assess the behavior of the different modes and check the feasibility of using bipolar applicators in different modes.
Our model considered only reversible changes with temperature. If irreversible changes were included (as done in [15,16]), the results could be different. The results could also be different when considering the characteristics of the tumor tissue. Despite this limitation, and taking into account our previous results [16], we do not think that these limitations affect the general conclusions of this study in terms of comparison between BM and SMM.
6. Conclusions
The study showed that the performance of a bipolar RF applicator could be improved by selecting BM and SMM as required in the intervention. SMM was able to create a deeper inter-electrode CZ than BM and to overcome the associated problem of loss of electrode contact.
Author Contributions
Methodology, J.J.P., E.B., and M.T.; software, J.Y., J.B., M.C.G.C., and M.T.; validation, J.B., J.J.P., and M.T.; formal analysis, E.B. and M.T.; investigation, E.B.; data curation, J.Y., J.J.P., E.B., and M.T.; writing—original draft preparation, M.T.; writing—review and editing, E.B.; supervision, E.B. and M.T.; funding acquisition, E.B. and M.T. All authors have read and agreed to the published version of the manuscript.
Funding
This research was funded by the Spanish Ministerio de Ciencia, Innovación y Universidades under the Programa Estatal de I+D+i Orientada a los Retos de la Sociedad, Grant No. RTI2018-094357-B-C21.
Conflicts of Interest
The authors declare no conflict of interest.
References
- Gnerlich, J.L.; Ritter, J.H.; Linehan, D.C.; Hawkins, W.G.; Strasberg, S.M. Saline-linked surface radiofrequency ablation: A safe and effective method of surface ablation of hepatic metastatic colorectal cancer. Ann. Surg. 2009, 250, 96–102. [Google Scholar] [CrossRef] [PubMed]
- Sakamoto, Y.; Yamamoto, J.; Kokudo, N.; Seki, M.; Kosuge, T.; Yamaguchi, T.; Muto, T.; Makuuchi, M. Bloodless liver resection using the monopolar floating ball plus LigaSure diathermy: Preliminary results of 16 liver resections. World J. Surg. 2004, 28, 166–172. [Google Scholar] [CrossRef] [PubMed]
- Wattiez, A.; Khandwala, S.; Bruhat, M.A. Electrosurgery in Operative Endoscopy; Wiley-Blackwell: Hoboken, NJ, USA, 1995. [Google Scholar]
- Doss, J.D. Calculation of electric fields in conductive media. Med. Phys. 1982, 9, 566–573. [Google Scholar] [CrossRef] [PubMed]
- Berjano, E.J.; Burdío, F.; Navarro, A.; Burdío, J.M.; Güemes, A.; Aldana, O.; Ros, P.; Sousa, R.; Lozano, R.; Tejero, E.; et al. Improved perfusion system for bipolar radiofrequency ablation of liver: Preliminary findings from a computer modeling study. Physiol. Meas. 2006, 27, N55–N66. [Google Scholar] [CrossRef] [PubMed]
- Duck, F. Physical Properties of Tissue-A Comprehensive Reference Book; Academic Press: New York, NY, USA, 1990. [Google Scholar]
- McGahan, J.P.; Loh, S.; Boschini, F.J.; Paoli, E.E.; Brock, J.M.; Monsky, W.L.; Li, C.-S. Maximizing parameters for tissue ablation by using an internally cooled electrode. Radiology 2010, 256, 397–405. [Google Scholar] [CrossRef] [PubMed]
- Cengel, Y.A. Transferencia de Calor, 3rd ed.; McGraw-Hill: Bogotá, Colombia, 2007. [Google Scholar]
- Chang, I.A. Considerations for Thermal Injury Analysis for RF Ablation Devices. Open Biomed. Eng. J. 2010, 4, 3–12. [Google Scholar] [CrossRef] [PubMed]
- Schutt, D.J.; Haemmerich, D. Effects of variation in perfusion rates and of perfusion models in computational models of radio frequency tumor ablation. Med. Phys. 2008, 35, 3462–3470. [Google Scholar] [CrossRef] [PubMed]
- Pérez, J.J.; Pérez-Cajaraville, J.J.; Muñoz, V.; Berjano, E. Computer modeling of electrical and thermal performance during bipolar pulsed radiofrequency for pain relief. Med. Phys. 2014, 41, 071708. [Google Scholar] [CrossRef] [PubMed]
- Haemmerich, D.; Lee, F.T.; Schutt, D.J.; Sampson, L.A.; Webster, J.G.; Fine, J.P.; Mahvi, D.M. Large-volume radiofrequency ablation of ex vivo bovine liver with multiple cooled cluster electrodes. Radiology 2005, 234, 563–568. [Google Scholar] [CrossRef] [PubMed]
- Brace, C.L.; Sampson, L.A.; Hinshaw, J.L.; Sandhu, N.; Lee, F.T. Radiofrequency ablation: Simultaneous application of multiple electrode via switching creates larger, more confluent ablations than sequential application in a large animal model. J. Vasc. Interv. Radiol. 2009, 20, 118–124. [Google Scholar] [CrossRef] [PubMed]
- Lee, J.M.; Lee, J.M.; Woo, S.; Hwang, E.J.; Hwang, I.; Choi, W.; Han, J.K.; Choi, B.I. Switching bipolar hepatic radiofrequency ablation using internally cooled wet electrodes: Comparison with consecutive monopolar and switching monopolar modes. Br. J. Radiol. 2015, 88, 20140468. [Google Scholar]
- Pop, M.; Davidson, S.R.H.; Gertner, M.; Jewett, M.A.S.; Sherar, M.D.; Kolios, M.C. A theoretical model for RF ablation of kidney tissue and its experimental validation. Lect. Notes Comput. Sci. 2010, 5958, 119–129. [Google Scholar]
- Castro-López, D.L.; Trujillo, M.; Berjano, E.; Romero-Mendez, R. Two-compartment mathematical modeling in RF tumor ablation: New insight when irreversible changes in electrical conductivity are considered. Math. Biosci. Eng. 2020, 17, 7980–7993. [Google Scholar] [CrossRef]


Publisher’s Note: MDPI stays neutral with regard to jurisdictional claims in published maps and institutional affiliations. |
© 2020 by the authors. Licensee MDPI, Basel, Switzerland. This article is an open access article distributed under the terms and conditions of the Creative Commons Attribution (CC BY) license (http://creativecommons.org/licenses/by/4.0/).