Article

Study on the Effects of Physical Properties of Tenera Palm Kernel during Drying and Its Moisture Sorption Isotherms

by
Mina Habibiasr
1,
Mohd Noriznan Mokhtar
1,*,
Mohd Nordin Ibrahim
1,
Khairul Faezah Md Yunos
1 and
Nuzul Amri Ibrahim
2
1
Department of Process and Food Engineering, Faculty of Engineering, Universiti Putra Malaysia, Serdang 43400, Selangor, Malaysia
2
Malaysian Palm Oil Board, Persiaran Institusi, Bandar Baru Bangi, Kajang 43000, Selangor, Malaysia
*
Author to whom correspondence should be addressed.
Processes 2020, 8(12), 1658; https://doi.org/10.3390/pr8121658
Submission received: 21 November 2020 / Revised: 6 December 2020 / Accepted: 7 December 2020 / Published: 16 December 2020
(This article belongs to the Section Food Process Engineering)

Abstract

:
A study on the effect of the physical properties and moisture sorption isotherm of palm kernels constitutes the critical criteria in evaluating the drying performance. The drying was evaluated as a function of moisture content (MC) in the range of 0.31–0.02 kg/kg (d.b.). Whereas, the equilibrium moisture content (EMC) of palm kernels (whole kernel and ground kernel) was determined experimentally using the standard gravimetric method at different temperatures (50 °C to 80 °C), over a range of relative humidity (RH) from 10% to 81%. Palm kernel length, width, and thickness decrease from 16.08 ± 2.09 mm to 14.17 ± 2.30 mm, 12.06 ± 1.40 mm to 11.24 ± 1.08 mm, and 10.01 ± 1.27 mm to 9.18 ± 1.04 mm, respectively, when MC decreased. Bulk density, surface area, and specific surface area decreased as the MC decreased, while porosity and true density were increased. EMC of palm kernels (whole kernel and ground kernel) decreased with an increase in temperature at constant RH. Modified Oswin and modified Halsey models were found to be the best for predicting desorption moisture isotherms for whole and ground palm kernel, respectively. Therefore, the study of the effect of drying on physical aspects as well as moisture sorption isotherms is important to further analyze the drying performance of Tenera palm kernel (e.g., equipment design and energy requirement).

1. Introduction

Oil Palm (Elaeis guineensis jacquin) is originated from Africa, and is monoecious (bears both male and female flowers), which has a capacity to achieve 30 m height. Oil palm tree will begin bearing fruits after about 2.5 years of planting in the field and the profit will be for as long as 20 years or more, thereby ensuring a consistent supply of its major product oil. Fruits are particularly fleshy, similar to small plums, length about 2–3 cm, elongated egg-shaped of reddish color. The palm fruit is formed in vast clusters of 16–26 kg each, called fresh fruit bunches (FFBs). Fruits constituted of a pericarp, the pulp, fibers and walnut. The walnut has a hard shell, which encompasses a kernel; the palm kernel oil is then extracted from the kernel [1]. Oil palm has become the most important commodity crop in Malaysia. Palm oil is used for various food and non-food applications.
Oil palm fruits contain about 45% palm kernels. On a dry basis, palm kernels contain about 50% oil. Palm kernel oil and palm oil differ greatly in their characteristics and properties even though they come from the same fruitlet [2]. Palm kernel oil is similar to coconut oil in composition, and these two oils are the only sources of lauric oil available to the world market [3]. Palm kernel oil is regarded as high-quality oil for food and non-food uses. For example, in food industries, it is used either alone or in blends with other oils for the manufacture of cocoa butter substitutes and other confectionery fats, biscuit dough, filling creams, cake icings, ice cream, sharp melting creaming, table margarine, and many other food products [4]. It is also used for non-edible purposes such as the formulations of soaps, cosmetics and lubricating oil.
Efficient processing and storage of palm kernel require that the moisture content (MC) be reduced to an appropriate level by drying. The drying process requires the knowledge of physical properties and moisture sorption isotherm. It is well known that when a hygroscopic material is placed in the air, it gains or loses moisture from or to the air until it comes into moisture equilibrium with the surrounding. The movement of water vapor from a hygroscopic material to the surrounding air depends on the MC and composition of the material, as well as the temperature and humidity of the surroundings [5]. The relationship between equilibrium moisture content (EMC) and relative humidity (RH) or water activity at constant temperature gives a moisture sorption isotherm when presented graphically. This isotherm curve can be obtained in one of two ways; adsorption and desorption. Since all the agricultural products are generally hygroscopic, it is important to determine their EMC for drying, storing, mixing, and packaging operations [6]. The moisture desorption isotherms can be used to predict the changes in food stability and to select appropriate packing materials and ingredients, as well as modeling the drying process for optimization of drying equipment design and energy required for drying [7,8,9,10].
Few researchers have studied moisture desorption isotherms of palm kernel. The Halsey and Henderson equations were well fitted by Ibrahim [11], while the cubic model gave the best description of the relationship between the ERH and EMC of the palm kernels [12]. The modified Henderson model was found to be the best model for predicting the EMC and RH of the palm kernel by Ajibola et al. [13]. The comparison between the previous studies shows important differences in the values of EMC; this difference might be as a result of differences in palm variety, the palm maturity, and the EMC determination method [14].
Although several data on the physical properties and EMC of palm kernel are available in the literature, there are not enough data published on the MC dependency and EMC of the Tenera variety of Malaysian palm kernel. Therefore, the objective of this study is to determine the moisture-dependent physical properties of Tenera variety of Malaysian palm kernel, namely, physical dimensions, shape, surface area, specific surface area, bulk density, true bulk density, and porosity in the moisture reduced from 0.31 to 0.02 kg/kg (d.b.) as well as EMC of palm kernel at different air temperatures and RH. The EMC experiment was repeated for ground kernel and its isotherm was compared with the whole kernel.

2. Materials and Methods

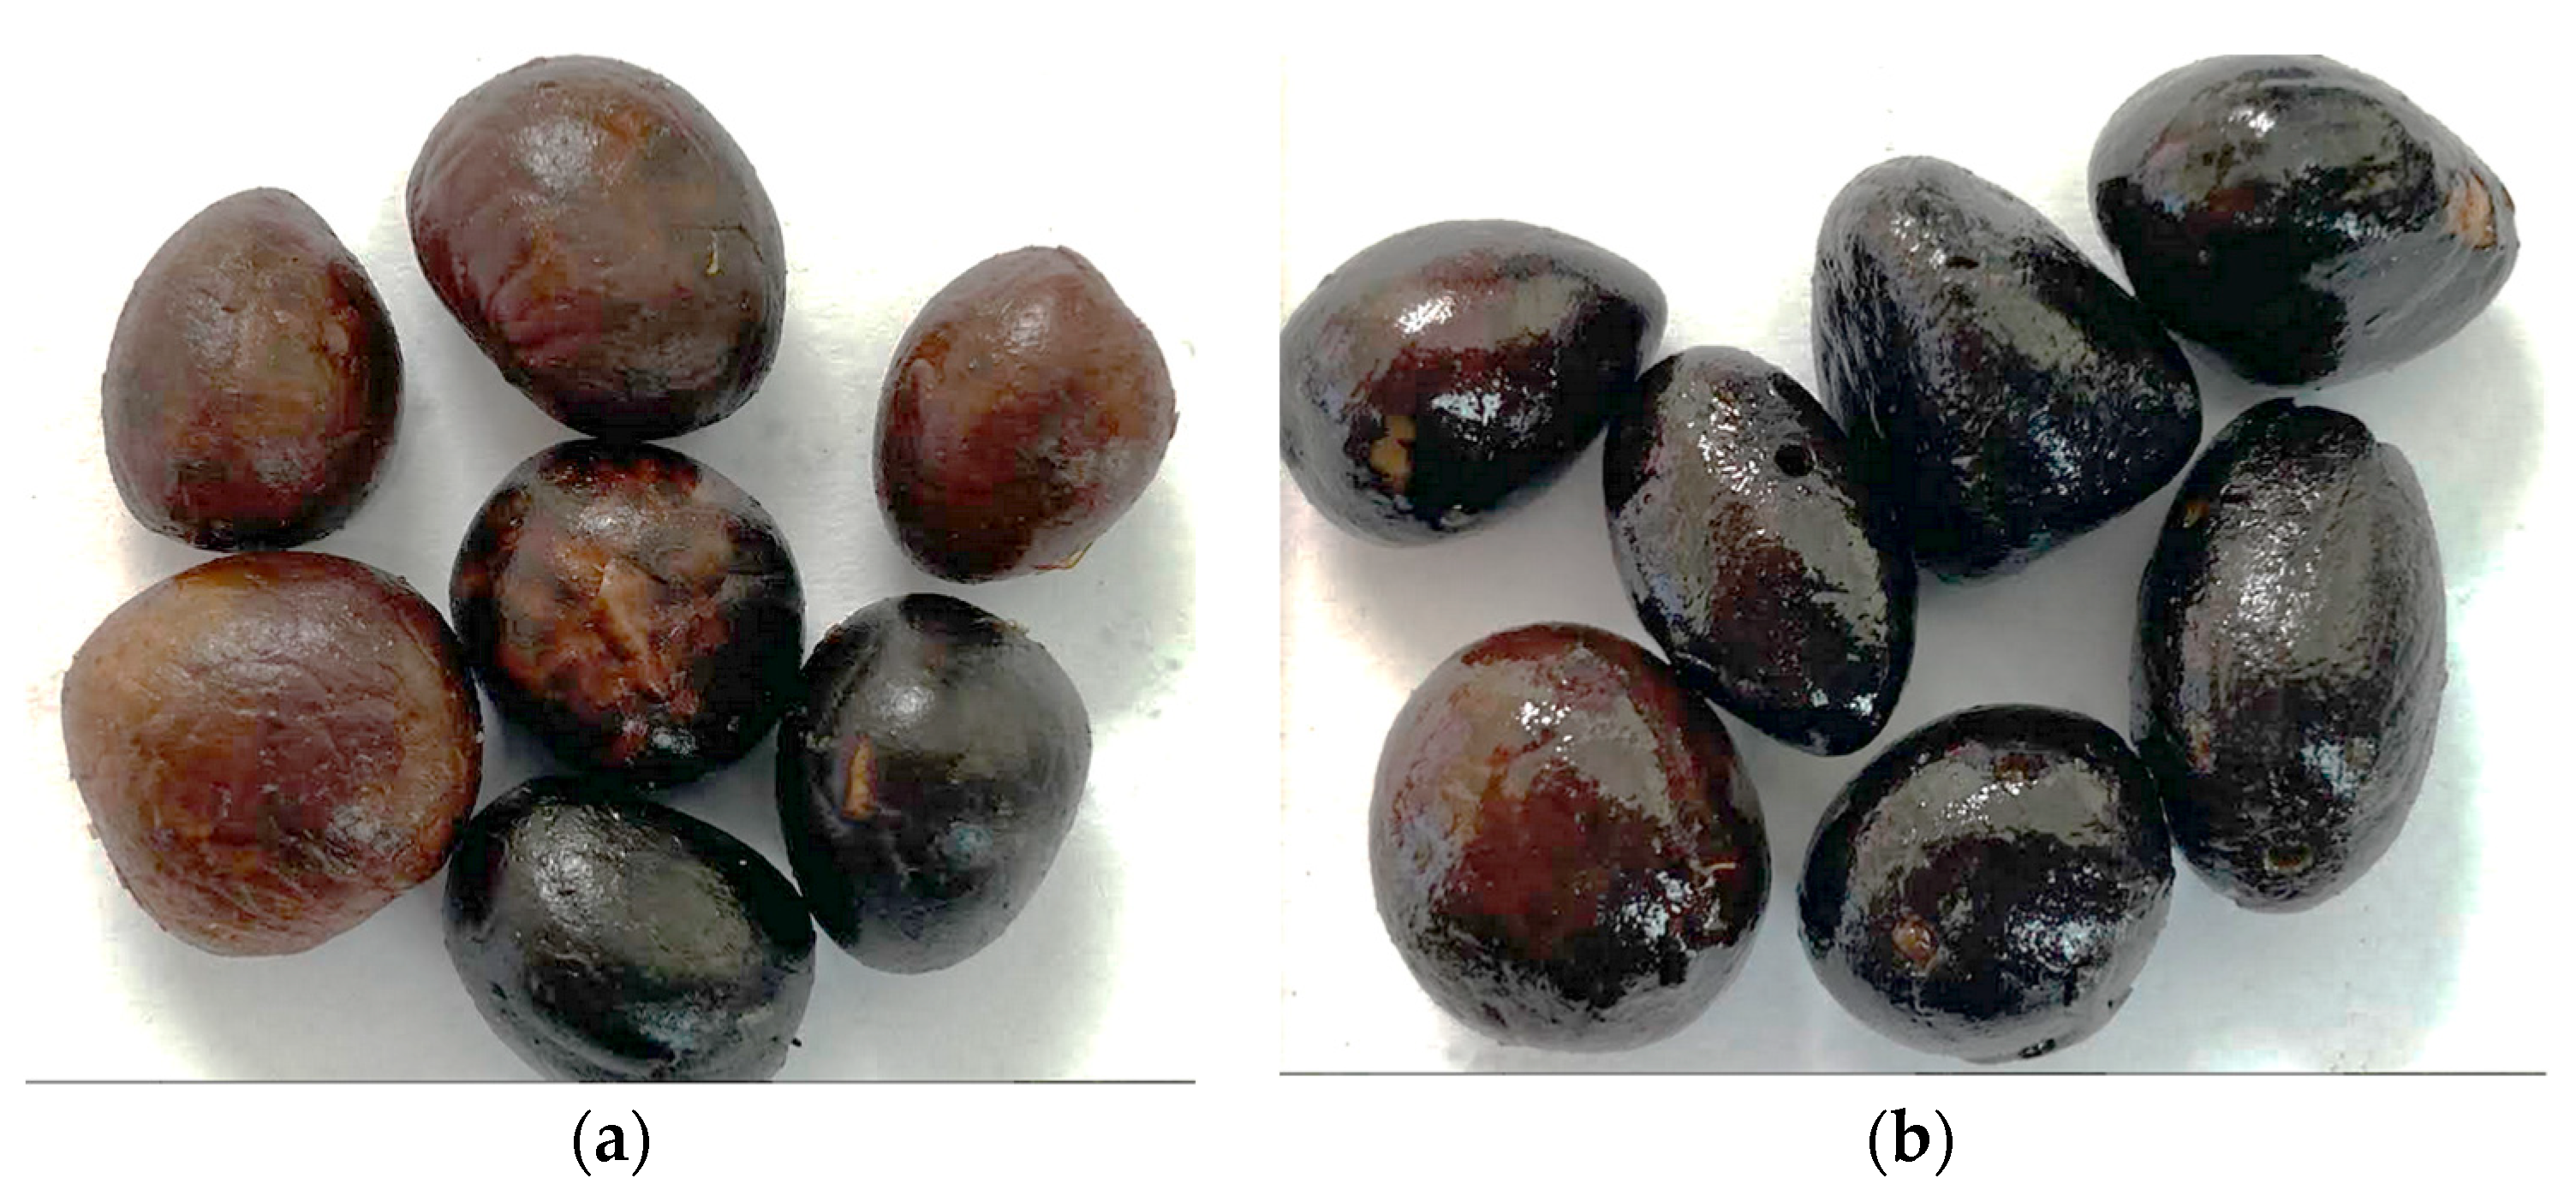
2.1. Sample Preparation

The palm kernels used for research were Tenera variety, which was obtained from a local palm oil mill at Carey Island, Malaysia. To prevent moisture loss during transportation, they were packed and sealed in plastic bags. The kernels were manually sieved and cleaned. The EMC experiment was conducted for both whole kernels and ground kernel. The ground kernel with an average size of 0.5–1 mm was obtained by using laboratory blender (WARING, Torrington, US). The initial and final moisture contents of the palm kernels were determined according to the standard of the Malaysian Palm Oil Board (MPOB) Test Method [15]. About 0.010 kg of sample was weighed on an aluminum petri dish and placed in an oven for 4 h at 103 °C. To calculate the MC of the samples, which was expressed as kg water/kg dry matter, the wet and dried weight were used as outlined in Equation (1). The MC measurement was carried in triplicates, and the average data were recorded.
M C = W i W f W f
where Wi is the initial sample weight (kg) and Wf is the final sample weight (kg).

2.2. Physical Properties of Palm Kernel

2.2.1. Size and Shape

The size of the palm kernel was measured according to Gbadam et al. [16]. Fifty palm kernels were selected randomly for measuring the axial physical characteristics. For each palm kernel, the three-dimensional measurement was performed, which is the length (L), width (W), and thickness (Th) using a vernier caliper reading with an accuracy of 0.01 mm. The palm kernel shape was expressed in terms of its sphericity index, which represents the shape characteristics of the palm kernel relative to that of a sphere of the same volume. The dimensions obtained for the kernel were used to calculate the sphericity index, as shown in Equations (2) and (3), respectively [17].
γ = G M D L
and
G M D = ( L × W × T h )   1 3
Here, γ is the sphericity index, GMD is the geometric mean diameter (mm), and L, W, Th, are the length, width, and thickness of the kernel (mm), respectively.

2.2.2. Surface Area and Specific Surface Area

The surface area (S) of palm kernel was calculated using GMD as shown in Equation (4) [18,19,20], whereas the specific surface area (Ss) is referred to as the palm kernel surface area per unit volume that exchanges energy and moisture with the air during the drying process [14]. According to Sirisomboon et al. [19], the Ss is defined to be the surface area of palm kernel multiplied by the number of kernels, divided by bulk volume. The Ss was simplified as in Equation (5) [19].
S = π × G M D 2
and
S s =   S × n V b
where S is the surface area (cm2) of palm kernel, π is a constant, 3.14, Ss is the specific surface area (cm2/cm3), n is the number of kernels, and Vb is the bulk volume of kernels (g/cm3).

2.2.3. Bulk Density, True Density, and Porosity

Bulk density was obtained via the Association of Official Analytical Chemists (AOAC) method [21], which is performed by filling a known bulk volume of palm kernels in a beaker, and the content was weighted. Bulk density was calculated by dividing total kernels mass with bulk volume, whereas true density is the individual material mass that was divided by its volume, and it was obtained using the liquid displacement method [17]. The volume of the individual palm kernel was determined by submerging it in toluene (C7H8). The toluene was used because it absorbs less water. The volume was calculated via the principle of buoyancy force, as shown in Equation (6).
V v = m t ρ t o
where Vv is the volume of single kernel (cm3), mt is the mass weighed of toluene (g), and ρto is the density of toluene (0.86 g/cm3). Then, the true density was calculated as:
ρ t = m u V v
where ρt is the true density of palm kernel (g/cm3) and mu (g) is the mass of single kernel.
The relationship between true density and bulk density has been frequently used to determine the total porosity of grains and seeds. Mohsenin [17] gives this relationship in Equation (8).
ε = ( 1 ρ b ρ t ) × 100
where ε is the total porosity (%), and ρb is the bulk density of palm kernel (g/cm3).

2.2.4. Scanning Electron Microscope (SEM)

The microstructures were visualized by SEM (S-3400N, Hitachi Science Systems Ltd., Tokyo, Japan) at different magnifications. The palm kernel surface images were acquired after gold metallization under vacuum condition before each analysis to increase their electrical conductivity using EMITECH K550 sputter coater (Ashford, Kent, UK).

2.3. Equilibrium Moisture Content

2.3.1. Experimental Procedure

The EMC experiment was conducted independently for the whole kernel and ground kernel by the static gravimetric method. This method consists of exposing the palm kernel to a controlled RH environment until equilibrium conditions are reached [22]. The saturated salt solution was used to maintain a fixed RH. Seven saturated salt solutions were prepared, corresponding to a wide range of RH from 10% to 81% and are listed in Table 1 [23].
For each experiment, three glass jars were used, which were all sealed and equipped with sample holders hanged above the saturated salt solution (Figure 1). Excess salt was consistently settled at the bottom of the jar to guarantee the saturation of the solution [24]. An appropriate amount of thymol (C10H14O) was equally added inside the jar at RH higher than 70% to prevent microbial growth [25]. About 15 g of palm kernel was used for each experiment. Weight losses in the samples in each jar were observed regularly. In order to prevent atmospheric moisture absorption and desorption during weighing, possible minimum time was used (less than one minute) [24]. After three consecutive measurements of the weight of each sample, the EMC was determined when the weight differences were about 0.001 g. The experiment was conducted over a period of 90 days, depending on oven temperature and RH inside the jar. The MC of the sample was determined using the MPOB Test Method [15], as mentioned earlier. EMC was reported by taking the mean of triplicate measurements.

2.3.2. Curve Fitting and Statistical Analysis

The data obtained from the EMC test were fitted to four different moisture sorption isotherm models tabulated in Table 2.
The parameters for selected mathematical equations were estimated using non-linear regression analysis by software (SAS 9.2). The evaluation of the numerous isotherm models according to their appropriateness in predicting the EMC of the samples based on the coefficient of determination (R2), adjusted R-squared, standard error of estimate (SEE), residual sum of square (RSS), chi-square (χ2) and residual plot. Higher R2 and adjusted R2 values and lower SEE, RSS, χ2 values imply better goodness of fit. Residuals are the differences between the experimental and predicted data. The plot of residuals against experimental value is also taken into account to evaluate the fitting of the different equations to experimental data. The acceptability of model dependents upon the residual values, if the values fall within a horizontal band centered around zero and display no systematic tendencies towards a clear pattern if the residual plot shows systematic distribution or clear pattern, then the model is considered unacceptable [30]. The SEE is defined as Equation (13):
S E E = ( Y m Y p ) 2 d f
The residual sum of square (RSS) is defined in Equation (14) as:
R S S = ( Y m Y p ) 2
where SEE is the standard error of estimate, RSS is the residual sum of square, Ym is the measured value, Yp is the value predicted by model, and df is the degree of freedom.

3. Results

3.1. Physical Properties

3.1.1. Size and Shape

Average values of the size dimensions of palm kernels at MC from 0.31 to 0.02 kg/kg (d.b.) are displayed in Table 3. The values of palm kernel L, W, and Th vary from 16.08 ± 2.09 mm to 14.17 ± 2.30 mm, 12.06 ± 1.40 mm to 11.24 ± 1.08 mm, and 10.01 ± 1.27 mm to 9.18 ± 1.04 mm, respectively. Loss of water and heating caused stresses in the cellular structure of the kernel leading to decrease in L, W, Th, and GMD [31]. Similar patterns were also reported for neem nut and soybean, respectively [32,33]. However, no effect of MC on dimensions of coffee was found by Chandrasekar and Viswanathan [34]. In bambara groundnuts, there was no appreciable dimensional change beyond 25% MC, while it decreased with the reduction in MC below 25% [35].
Palm kernel dimensions were employed to determine the GMD and consequently γ value. Grains and kernels are considered as spherical when the γ value is more than 70% [36]. In this work, the calculated mean value of palm kernel γ was 78%. Akubuo and Eje [37] reported γ value of 80%, 80%, and 60% for palm nut, palm kernel, and palm shell for Dura variety, respectively. γ values for Tenera variety of palm kernel by Akinoso and Raji [38] were reported as 88.6%, 77.4% and 87.6% at MC of 5%, 8%, and 11%, respectively; 68.5%, 70%, and 92.5% for fruit, nut and kernel, respectively, for Dura variety [39], and 80%, 70%, 85% correspondingly for Dura, Tenera and Pisifera variety [40]. The polynomial correlation between γ and MC of palm kernel is depicted in Figure 2. As can be seen, the γ of palm kernel increased when MC decreased from 0.31 to 0.09 kg/kg (d.b.) and then slightly decreased when MC decreased from 0.09 to 0.02 kg/kg (d.b.). Statistically, no significant difference (P > 0.05) was found in γ of palm kernel with the variation in MC. This could be due to the dimensional changes while MC reduced. A similar trend but at higher MC for pigeon pea was observed [41]. Increment in γ by decreasing of MC was also observed by Ezeoha and Akubuo [42] and Kibar and Öztürk [33] who found γ of palm kernel and soybean increased as the MC decreased. However, Altuntas [43] found the γ of the fenugreek seed decreased as the MC decreased, while Ozturk and Kara [44] found MC did not affect the γ of common beans. On the contrary, no clear trend on the MC effect on the γ of palm kernel was observed by Akinoso and Raji [38]. Equation (15) shows the correlation of sphericity of palm kernel at different moisture contents.
γ = −0.5916 MC2 + 0.1144 MC + 0.7982 (R² = 0.98)
where γ is the sphericity index and MC is the moisture content (kg/kg d.b.).

3.1.2. Surface Area and Specific Surface Area

The values of surface area (S) and specific surface area (Ss) were calculated, and their variations with MC were plotted in Figure 3a,b, respectively. As clearly observed, the S of the palm kernel decreased with the decrease in MC. Statistically, a significant difference (P < 0.05) was found for S of palm kernel with the variation in MC. The decrease in the values might be attributed to its dependence on the three principal dimensions of palm kernel [45]. One-way ANOVA indicated a significant difference (P < 0.05) in changes of Ss as a function of MC. The S and Ss of palm kernel changed from 5.21 to 4.01 cm2 and from 3.22 to 3.01 cm2/cm3, respectively, as the MC decreased from 0.31 to 0.02 kg/kg (d.b.). The S decreased while MC decreased, and that is due to the reduction in GMD. The Ss changed polynomially, and it decreased from 3.22 to 2.8 cm2/cm3 when MC reduced from 31% to 17% and then increased to 3.01 cm2/cm3 when MC reduced to 0.02 kg/kg. This is due to the weight changes of a single palm kernel. The weight of the palm kernel was highly reduced at lower MC. Similar results for the S of soybean, millet, pistachio, caper seeds, and maize kernels were obtained, respectively [33,46,47,48,49]. Hsu et al. [50], however, found the S of pistachios increased with decreasing MC. It was reported that Dura variety of palm kernel had higher S, 9.32 cm2 [39]. The differences between the current result and Davier [39] on the surface area of the palm kernel could be due to the different varieties. The relationship of S and Ss with MC of palm kernel can be expressed by Equations (16) and (17), respectively:
S = 24.51 MC2 − 5.013 MC + 4.20 (R2 = 0.89)
Ss = 16.08 MC2 + 4.84 MC + 3.12 (R2 = 0.93)
where S is the surface area (cm2), Ss is the specific surface area (cm2/cm3) and MC is the moisture content (kg/kg d.b.).

3.1.3. Bulk Density, True Density, and Porosity

Bulk density (ρb) is the ratio of the grain mass to its total volume (including free air space), while true density (ρt) is the ratio of the mass of the sample to its true volume [51]. The ρb of palm kernel varies between 584 and 630 kg/m3, and it significantly (P < 0.05) decreased with the decrease in MC, as shown in Figure 4a. Araújo et al. [52] also observed a similar trend for the bulk density of peanut grains, which values decreased when MC reduced along with the drying. These authors attributed this effect to a greater contraction inside the cotyledons in relation to its external dimensions shrinking to a lesser extent, thus forming empty spaces inside the grain. When there is less reduction in the volume of the product relative to the higher weight loss (due to water releasing) during drying, the ρb of the grains decreases [53]. In other words, drying will increase the ratio of air space volume to the solid volume within the system. This finding is similar to those of Chandrasekar and Viswanathan [34] for coffee; Paksoy and Aydin [54] for squash seeds; Altuntas and Erkol [55] for walnuts and De Souza Smaniotto et al. [53] for sunflower seeds, and in contrast to Baryeh [46] for millet and Martins et al. [56] for safflower grains who reported ρb increased with the decrease in MC.
According to Figure 4b, ρt of palm kernel slightly increased from 860 to 864 kg/m3 as MC decreased (P < 0.05). A similar pattern of increasing ρt was noted by Deshpande et al. [57] for soybean; green gram by Nimkar and Chattopadhyay [58]; hazelnuts by Aydin [59]; areca nut kernel by Kaleemullah and Gunasekar [60]; walnuts by Altuntas and Erkol [55]; sunflower seeds by De Souza Smaniotto et al. [53]. However, Paksoy and Aydin [54] and Baümler et al. [61] found that the ρt of squash and safflower seeds decreased as the MC decreased.
Ezeoha and Akubuo [42] reported that ρb and ρt values of an unknown variety of palm kernel ranged from 550.14 to 653.29 kg/m3 and 1000 to 1320 kg/m3, respectively. Additionally, it was reported ρb increased and ρt decreased with decreasing MC. Researchers reported average ρb values for palm kernel were computed to be 710.78 kg/m3 for Dura variety, 568.90–711.10 kg/m3 for Tenera variety and 568.90–608.05 kg/m3 for an unidentified variety [37,40,62,63,64]. The differences between current results and other results, as mentioned above, on ρb and ρt of palm kernel, could be due to the difference in a variety of palm kernel and measurement method of true density.
The relationship between ρb and ρt with a MC of palm kernel (Figure 4) can be expressed as Equations (18) and (19), respectively:
ρb = 161.62 MC + 583.15 (R2 = 0.99)
ρt = −13.79 MC + 864.48 (R2 = 0.97)
where ρb is the bulk density (kg/m3), ρt is the true density (kg/m3) and MC is the moisture content (kg/kg, d.b.).
The total porosity (ε) is the combination of free space among kernels and pore space within the kernel, and its effect with MC is presented in Figure 5. Therefore, as discussed earlier, ρb and ρt are influenced by variation in ε. This was also discussed by Kingsly et al. [65], the changes that occur in ρb and ρt as the moisture decreases affected by the level of increase in ε. In this work, the ε in palm kernel increased linearly with the decrease in MC during the drying (P < 0.05). Similar results were obtained from the studies conducted on the relationship between the MC and the ε for hemp seed [66], cactus pear [67], soybean [33], lablab purpureus sweet seeds [68], minor millets [69], and maize kernels [49]. Simonyan et al. [68] have explained that, as the material loses moisture, its volume decreases, decreasing the size and shape, which creates less intimate contact with each other, thereby increasing the pore space. However, Akar and Aydin [70] found the ε of gumbo fruit decreased with the reduction in MC, which is due to the increment of densities when MC reduced. The ε of unknown variety of palm kernel was reported 27.73% [39] and 38.2%–56.4% [42]. The ε value is often needed in airflow and heat flow studies such as the drying process. During the drying process, intracellular spaces (pores), previously occupied by water, were replaced either by air or compressed as a result of shrinkage. The ε of sample increases as the pores containing water is replaced with air. In addition, heat and mass transfer rate increase with an increase in average pore size [71]. The MC, as well as the ε of the palm kernel, was correlated as Equation (20):
ε = −19.87 MC + 32.548 (R2 = 0.99)
where ε is the total porosity (%), and MC is the moisture content (kg/kg, d.b.).

3.1.4. Morphology Structure

The drying has damaged the kernel tissue and resulted in visual fissures. In other words, during the drying, it is expected that the kernel cell started to swell, and the oil was easily detached from it. Therefore, the oilier surface was clearly observed after the drying (Figure 6). As MC reduced, more crack surface appeared (Figure 7a,b). This would influence the value of ε, as previously discussed. According to Figure 7c,d, the smoother SEM surface can be seen after the drying process; this is due to the oil that was being extracted.

3.2. Desorption Isotherms

Desorption isotherm study is very important in drying and storage of fruits, vegetables and grains. The desorption isotherm helps to decide the stability of food at particular MC in the given environment and to predict the shelf life of dried products due to their sensitivity to moisture changes.
Experimental desorption isotherms obtained for the whole kernel and ground kernel at temperatures ranging from 50 °C to 80 °C are presented in Figure 8. EMC corresponding to each RH shows the mean value of three replications. EMC of palm kernel decreased with an increase in the temperature at any RH. The decrease in EMC value with the increase in temperature at constant RH can be explained by the fact that the kinetic energy associated with water molecules that are present in palm kernel increases with an increase in temperature. This, in turn, resulted in decreasing attractive forces that promote the removal of water molecules; consequently, this leads to a decrease in EMC values with the increase in temperature at a given RH [72]. At constant temperature, EMC values increase with an increase in RH [72]. Several researchers have reported similar trends for tea and rice [30,73].

Fitting of Sorption Models

The model coefficients for the modified Chung–Pfost, modified Halsey, modified Oswin, and modified Henderson models with their statistic mean standard error of estimate (SEE), residual sum of square (RSS), chi-square (χ2), R2, and adjusted R2 are presented in Table 4 and Table 5 for whole and ground palm kernels, respectively. According to Table 4, almost all models were observed to be good to represent the experimental data since the overall adjusted R2 was above 0.87, SEE ranged from 2.59 to 2.67, RSS ranged from 20.26 to 21.39, and χ2 ranged from 0.77 to 0.82, respectively, except modified Chung–Pfost with adjusted R2 = 0.770.
Remarkably for the ground kernel (Table 5), all models were observed to be good since overall adjusted R2 ranged from 0.80 to 0.96, SEE ranged from 1.37 to 1.79, RSS ranged from 5.68 to 9.61, and χ2 ranged from 0.21 to 0.36. For the whole and ground kernel, the plot of residuals showed random distribution, displaying no typical systematic tendencies towards a clear pattern, which indicates all models are acceptable. Hence, based on statistical parameters and randomized residual, the modified Oswin model gives a better fit to the experimental data for whole palm kernel (highest adjusted R2 = 0.884 and lowest SEE = 2.59, RSS = 20.26 and χ2 = 0.77) and modified Halsey model gives the best fit to the experimental data for ground palm kernel (highest adjusted R2 = 0.964 and lowest SEE = 1.37, RSS = 5.68 and χ2 = 0.21).
The modified Oswin and modified Halsey models were further analyzed based on the residual plots. As a result, the residuals for both models are random in the pattern, as shown in Figure 9. Hence, the Oswin and modified Halsey are acceptable models that can be used in representing the sorption models for whole and ground Tenera palm kernel, respectively.
Therefore, Equations (21) and (22) present the modified Oswin and modified Halsey model for whole and ground palm kernel, respectively.
E M C = ( 4.94 + 0.00159 T ) [ ( R H ) 1 R H ] 1 / 2.51
E M C = [ l n ( R H ) e x p ( 3.58 0.0239   T ) ] 1 / 1.70
The desorption moisture content predicted by the modified Oswin and modified Halsey models as in Equations (21) and (22) for whole and ground palm kernel, respectively, are compared with the experimental values as shown in Figure 10. It can be seen from Figure 10a,b that there is good agreement between experimental and predicted values.
Limited information on the desorption isotherm of palm kernel is available in the literature. The comparison between the two previous studies [11,13] showed important differences in the values of EMC; this difference might be as a result of differences in palm variety, the palm maturity, and EMC determination method [14]. The comparison between desorption isotherm of palm kernels published by Somade [74] and Jiménez et al. [12] also showed important differences; Somade [74] obtained lower EMC values compared to Jiménez et al. [12], whereby the difference was about 1.8% for the 75% RH. Jiménez et al. [12] concluded that the observed differences in EMC values between the studies most likely were originated from the different genetic compositions of kernels used as well as the postharvest handling of the materials; another possible reason to explain these differences is the MC and RH determination techniques used, which were different in both studies.

4. Conclusions

Several physical properties of the Tenera palm kernel were determined in order to facilitate design of the specific equipment for harvesting, transporting, cleaning, packing, drying, storing, etc., processes. The study shows that the physical properties of the Tenera palm kernel, such as geometric mean diameter, bulk density, true density, surface area, specific surface area, total porosity, and morphology structures, changed after the drying process. Loss of water and heating caused stresses in the cellular structure of the kernel leading to a decrease in length, width, thickness, geometric and arithmetic diameter. Bulk density and surface area of the palm kernel decreased as the MC decreased, whereas porosity and true density increased as the MC decreased. Drying has damaged the kernel tissue and resulted in visual fissures, and the oilier surface was clearly observed after drying. Moisture sorption isotherms have a significant role to play in the prediction of the shelf life of dried products due to their sensitivity to moisture changes. Among the models tested, the modified Oswin model and modified Halsey model gave a better fit to the experimental data of whole and ground palm kernel, respectively.

Author Contributions

All authors contributed to the analysis of the results and to writing the manuscript. M.H. collected and analyzed data and wrote the first draft of the manuscript. M.N.M. supervised the research and provided feedback to the content and revised the final draft. M.N.I. funded and supervised the research. K.F.M.Y. and N.A.I. provided feedback. All authors have read and agreed to the published version of the manuscript.

Funding

This research received no external funding.

Acknowledgments

The authors would like to thank Sime Darby plantation in Carey Island, Selangor, Malaysia, for supplying the palm kernels used in this experiment and Anwar Fitrianto from the Department of Mathematics, Faculty of Science, Universiti Putra Malaysia, for his statistical insight.

Conflicts of Interest

The authors declare no conflict of interest.

References

  1. Macaire, W.H.; Bernard, T.; Noel, T.; Felicite, T.M.; Cesar, K.; Michel, L.; Jacques, F. Extraction of palm kernel oil in Cameroon: Effects of kernels drying on the oil quality. J. Food Technol. 2010, 8, 1–7. [Google Scholar] [CrossRef]
  2. Hassan, M.N.; Ab Rahman, N.N.; Ibrahim, M.H.; Omar, A.M. Simple fractionation through the supercritical carbon dioxide extraction of palm kernel oil. Sep. Purif. Technol. 2000, 19, 113–120. [Google Scholar] [CrossRef]
  3. Berger, K.G.; Andaner, W.T.; Applewhite, T.H. The Lauric Oils Medium Chain Fatty Acid Source; American Oil Chemists’ Society: Champaign, IL, USA, 1991. [Google Scholar]
  4. Pantzaris, T.P.; Ahmad, M.J. Properties and utilization of palm kernel oil. Palm Oil Dev. 2001, 35, 11–23. [Google Scholar]
  5. Panchariya, P.C.; Popovic, D.; Sharma, A.L. Modeling of desorption isotherm of black tea. Dry. Technol. 2001, 19, 1177–1188. [Google Scholar] [CrossRef]
  6. Chenarbon, H.A.; Minaei, S.; Bassiri, A.R.; Almassi, M.; Arabhosseini, A. Moisture desorption isotherms of St. John’s wort (Hypericum perforatum L.) leaves at three temperatures. J. Food Agric. Environ. 2010, 8, 188–191. [Google Scholar]
  7. Zhang, X.W.; Liu, X.; Gu, D.X.; Zhou, W.; Wang, R.L.; Liu, P. Desorption isotherms of some vegetables. J. Sci. Food Agric. 1996, 70, 303–306. [Google Scholar] [CrossRef]
  8. Ertugay, M.F.; Certel, M.; Gürses, A. Moisture adsorption isotherms of Tarhana at 25 C and 35 C and the investigation of fitness of various isotherm equations to moisture sorption data of Tarhana. J. Sci. Food Agric. 2000, 80, 2001–2004. [Google Scholar] [CrossRef]
  9. Jamali, A.; Kouhila, M.; Mohamed, L.A.; Jaouhari, J.T.; Idlimam, A.; Abdenouri, N. Sorption isotherms of Chenopodium ambrosioides leaves at three temperatures. J. Food Eng. 2006, 72, 77–84. [Google Scholar] [CrossRef]
  10. Al-Mahasneh, M.A.; Amer, M.B.; Rababah, T.M. Modeling moisture sorption isotherms in roasted green wheat using least square regression and neural-fuzzy techniques. Food Bioprod. Process. 2012, 90, 165–170. [Google Scholar] [CrossRef]
  11. Ibrahim, H. Drying of Oil Palm Kernels. Ph.D. Thesis, Universiti Kebangsaan Malaysia (UKM), Bangi, Malaysia, 1994. [Google Scholar]
  12. Jiménez, R.; Zeledón, M.; Alizaga, R. Relación de equilibrio entre el contenido de humedad de almendras de la palma aceitera (Elaeis guineensis) producida en Costa Rica y la humedad relativa del aire. ASD Oil Pap. 1995, 10, 16–26. [Google Scholar]
  13. Ajibola, O.O.; Aviara, N.A.; Abodunrin, V.K. Moisture sorption equilibrium and thermodynamic properties of palm kernel. Int. Agrophys. 2005, 19, 273. [Google Scholar]
  14. Brooker, D.B.; Bakker-Arkema, F.W.; Hall, C.W. Drying and Storage of Grains and Oilseeds; The Avi Publishing Company: Westport, CT, USA, 1992. [Google Scholar]
  15. Kuntom, A. MPOB Test Methods: A Compendium of Test on Palm Oil Products, Palm Kernel Products, Fatty Acids, Food Related Products and Others; Malaysian Palm Oil Board: Bandar Baru Bangi, Malaysia, 2005.
  16. Gbadam, E.K.; Anthony, S.; Asiam, E.K. The determination of some design parameters for palm nut crackers. Eur. J. Sci. Res. 2009, 38, 315–327. [Google Scholar]
  17. Mohsenin, N.N. Physical Properties of Plant and Animal Materials, 2nd ed.; Gordon and Breach Science Publishers: London, UK, 1986. [Google Scholar]
  18. Tunde-Akintunde, T.Y.; Akintunde, B.O. Some physical properties of sesame seed. Biosyst. Eng. 2004, 88, 127–129. [Google Scholar] [CrossRef]
  19. Sirisomboon, P.; Kitchaiya, P.; Pholpho, T.; Mahuttanyavanitch, W. Physical and mechanical properties of Jatropha curcas L. fruits, nuts and kernels. Biosyst. Eng. 2007, 97, 201–207. [Google Scholar] [CrossRef]
  20. Garnayak, D.K.; Pradhan, R.C.; Naik, S.N.; Bhatnagar, N. Moisture-dependent physical properties of jatropha seed (Jatropha curcas L.). Ind. Crops Prod. 2008, 27, 123–129. [Google Scholar] [CrossRef]
  21. AOAC. Official Methods of Analysis, 13th ed.; Association of Official Analytical Chemists, AOAC International: Rockville, MD, USA, 1980. [Google Scholar]
  22. Vasquez, V.R.; Braganza, A.; Coronella, C.J. Molecular thermodynamics modeling of equilibrium moisture in foods. J. Food Eng. 2011, 103, 103–114. [Google Scholar] [CrossRef]
  23. Greenspan, L. Humidity fixed points of binary saturated aqueous solutions. J. Res. Natl. Bur. Stand. 1977, 81, 89–96. [Google Scholar] [CrossRef]
  24. Quirijns, E.J.; van Boxtel, A.J.; van Loon, W.K.; van Straten, G. An improved experimental and regression methodology for sorption isotherms. J. Sci. Food Agric. 2005, 85, 175–185. [Google Scholar] [CrossRef]
  25. Hadjikinova, M.; Menkov, N.; Hadjikinov, D. Sorption characteristics of dietary hard candy. Czech J. Food Sci. 2003, 21, 97–99. [Google Scholar] [CrossRef] [Green Version]
  26. Thompson, T.L.; Peart, R.M.; Foster, G.H. Mathematical simulation of corn drying—A new model. Trans. ASAE 1968, 11, 582–586. [Google Scholar] [CrossRef]
  27. Chen, C. A Study of Equilibrium Relative Humidity for Yellow-Dent Corn Kernels. Ph.D. Thesis, University of Minnesota, Minneapolis, MN, USA, 1988. [Google Scholar]
  28. Iglesias, H.A.; Chirife, J. Prediction of the effect of temperature on water sorption isotherms of food material. Int. J. Food Sci. Tech. 1976, 11, 109–116. [Google Scholar] [CrossRef]
  29. Pfost, H.B.; Maurer, S.G.; Chung, D.S.; Milliken, G.A. Summarizing and reporting equilibrium moisture data for grains. ASAE 1976, 76, 3520. [Google Scholar]
  30. Ghodake, H.M.; Goswami, T.K.; Chakraverty, A. Moisture sorption isotherms, heat of sorption and vaporization of withered leaves, black and green tea. J. Food Eng. 2007, 78, 827–835. [Google Scholar] [CrossRef]
  31. Hafezi, N.; Sheikhdavoodi, M.J.; Sajadiye, S.M. The Effect of drying kinetic on shrinkage of potato slices. Int. J. Adv. Biol. Biomed. Res. 2014, 2, 2779–2782. [Google Scholar]
  32. Visvanathan, R.; Palanisamy, P.T.; Gothandapani, L.; Sreenarayanan, V.V. Physical properties of neem nut. J. Agric. Eng. Res. 1996, 63, 19–25. [Google Scholar] [CrossRef]
  33. Kibar, H.; Öztürk, T. Physical and mechanical properties of soybean. Int. Agrophys. 2008, 22, 239–244. [Google Scholar]
  34. Chandrasekar, V.; Viswanathan, R. Physical and thermal properties of coffee. J. Agric. Eng. Res. 1999, 73, 227–234. [Google Scholar] [CrossRef]
  35. Baryeh, E.A. Physical properties of bambara groundnuts. J. Food Eng. 2001, 47, 321–326. [Google Scholar] [CrossRef]
  36. Dutta, S.K.; Nema, V.K.; Bhardwaj, R.K. Physical properties of gram. J. Agric. Eng. Res. 1988, 39, 259–268. [Google Scholar] [CrossRef]
  37. Akubuo, C.O.; Eje, B.E. PH—Postharvest technology: Palm kernel and shell separator. Biosyst. Eng. 2002, 81, 193–199. [Google Scholar] [CrossRef]
  38. Akinoso, R.; Raji, A.O. Physical properties of fruit, nut and kernel of oil palm. Int. Agrophys. 2011, 25, 85–88. [Google Scholar]
  39. Davier, R.M. Physical and mechanical properties of palm fruit, kernel and nut. J. Agric. Technol. 2012, 8, 2147–2156. [Google Scholar]
  40. Gbadamosi, L. Some engineering properties of palm kernel seeds (PKS). J. Agric. Eng. Tech. 2006, 14, 58–66. [Google Scholar]
  41. Baryeh, E.A.; Mangope, B.K. Some physical properties of QP-38 variety pigeon pea. J. Food Eng. 2003, 56, 59–65. [Google Scholar] [CrossRef]
  42. Ezeoha, S.L.; Akubuo, C.O. Classification and engineering properties of unknown variety of oil palm kernel from Nigeria. IOSR J. Eng. 2014, 4, 51–58. [Google Scholar] [CrossRef]
  43. Altuntas, E.; Özgöz, E.; Taşer, Ö.F. Some physical properties of fenugreek (Trigonella foenum-graceum L.) seeds. J. Food Eng. 2005, 71, 37–43. [Google Scholar] [CrossRef]
  44. Ozturk, I.; Kara, M. Physico-chemical grain properties of new common bean cv. ‘Elkoca-05’. Sci. Res. Essays 2009, 4, 88–93. [Google Scholar]
  45. Kibar, H.; Öztürk, T.; Esen, E. The effect of moisture content on physical and mechanical properties of rice (Oryza sativa L.). Span. J. Agric. Res. 2010, 8, 741–749. [Google Scholar] [CrossRef] [Green Version]
  46. Baryeh, E.A. Physical properties of millet. J. Food Eng. 2002, 51, 39–46. [Google Scholar] [CrossRef]
  47. Dursun, E.; Dursun, I. Some physical properties of caper seed. Biosyst. Eng. 2005, 92, 237–245. [Google Scholar] [CrossRef]
  48. Razavi, S.M.; Emadzadeh, B.; Rafe, A.; Amini, A.M. The physical properties of pistachio nut and its kernel as a function of moisture content and variety: Part I. Geometrical properties. J. Food Eng. 2007, 81, 209–217. [Google Scholar] [CrossRef]
  49. Sangamithra, A.; John, S.G.; Sorna Prema, R.; Nandini, K.; Kannan, K.; Sasikala, S.; Suganya, P. Moisture dependent physical properties of maize kernels. Int. Food Res. J. 2016, 23, 109–115. [Google Scholar]
  50. Hsu, M.H.; Mannapperuma, J.D.; Singh, R.P. Physical and thermal properties of pistachios. J. Agric. Eng. Res. 1991, 49, 311–321. [Google Scholar] [CrossRef]
  51. Gupta, R.K.; Das, S.K. Physical properties of sunflower seeds. J. Agric. Eng. Res. 1997, 66, 1–8. [Google Scholar] [CrossRef]
  52. Araújo, W.D.; Goneli, A.L.; Souza, C.D.; Gonçalves, A.A.; Vilhasanti, H.C. Propriedades físicas dos grãos de amendoim durante a secagem. Rev. Bras. Eng. Agric. Am. 2014, 18, 279–286. [Google Scholar] [CrossRef]
  53. De Souza Smaniotto, T.A.; Resende, O.; de Sousa, K.A.; Campos, R.C.; Guimarães, D.N.; Rodrigues, G.B. Physical properties of sunflower seeds during drying. Semina Ciências Agrárias 2017, 38, 157–164. [Google Scholar] [CrossRef] [Green Version]
  54. Paksoy, M.; Aydin, C. Some physical properties of edible squash (Cucurbita pepo L.) seeds. J. Food Eng. 2004, 65, 225–231. [Google Scholar] [CrossRef]
  55. Altuntas, E.; Erkol, M. Physical properties of shelled and kernel walnuts as affected by the moisture content. Czech J. Food Sci. 2010, 28, 547–556. [Google Scholar] [CrossRef] [Green Version]
  56. Martins, E.A.; Goneli, A.L.; Hartmann Filho, C.P.; Mauad, M.; Siqueira, V.C.; Gonçalves, A.A. Physical properties of safflower grains. Part I: Geometric and gravimetric characteristics. Rev. Bras. Eng. Agric. Ambient. 2017, 21, 344–349. [Google Scholar] [CrossRef] [Green Version]
  57. Deshpande, S.D.; Bal, S.; Ojha, T.P. Physical properties of soybean. J. Agric. Eng. Res. 1993, 56, 89–98. [Google Scholar] [CrossRef]
  58. Nimkar, P.M.; Chattopadhyay, P.K. PH—Postharvest Technology: Some physical properties of green gram. J. Agric. Eng. Res. 2001, 80, 183–189. [Google Scholar] [CrossRef]
  59. Aydin, C. Ph—postharvest technology: Physical properties of hazel nuts. Biosyst. Eng. 2002, 82, 297–303. [Google Scholar] [CrossRef]
  60. Kaleemullah, S.; Gunasekar, J.J. PH—Postharvest Technology: Moisture-dependent physical properties of Arecanut kernels. Biosyst. Eng. 2002, 82, 331–338. [Google Scholar] [CrossRef]
  61. Baümler, E.; Cuniberti, A.; Nolasco, S.M.; Riccobene, I.C. Moisture dependent physical and compression properties of safflower seed. J. Food Eng. 2006, 72, 134–140. [Google Scholar] [CrossRef]
  62. Koya, O.A.; Idowu, A.; Faborode, M.O. Some properties of palm kernel and shell relevant in nut cracking and product separation. J. Agric. Eng. Tech. 2004, 12, 33–44. [Google Scholar]
  63. Mijinyawa, Y.; Omoikhoje, S. Determination of some physical properties of palm kernel. Proc. Niger. Inst. Agric. Eng. 2005, 27, 157–160. [Google Scholar]
  64. Ezeoha, S.L. Determination of Some Physical Properties of Palm Kernels Relevant in Rational Design of Processing and Storage Systems; Technical Paper Submitted in Fulfillment of the Requirement for the Course AGE: 702 (Special Problems in Agricultural Engineering); Department of Agricultural and Bioresources Engineering, University of Nigeria: Nsukka, Nigeria, 2011. [Google Scholar]
  65. Kingsly, A.R.P.; Singh, D.B.; Manikantan, M.R.; Jain, R.K. Moisture dependent physical properties of dried pomegranate seeds (Anardana). J. Food Eng. 2006, 75, 492–496. [Google Scholar] [CrossRef]
  66. Sacilik, K.; Öztürk, R.; Keskin, R. Some physical properties of hemp seed. Bios. Eng. 2003, 86, 191–198. [Google Scholar] [CrossRef]
  67. Kabas, O.; Ozmerzi, A.; Akinci, I. Physical properties of cactus pear (Opuntia ficus india L.) grown wild in Turkey. J. Food Eng. 2006, 73, 198–202. [Google Scholar] [CrossRef]
  68. Simonyan, K.J.; Yiljep, Y.D.; Oyatoyan, O.B.; Bawa, G.S. Effects of moisture content on some physical properties of Lablab purpureus (L.) sweet seeds. Agric. Eng. Int. CIGR J. 2009, 11, 1279. [Google Scholar]
  69. Balasubramanian, S.; Viswanathan, R. Influence of moisture content on physical properties of minor millets. Int. J. Food Sci. Technol. 2010, 47, 279–284. [Google Scholar] [CrossRef] [PubMed] [Green Version]
  70. Akar, R.; Aydin, C. Some physical properties of gumbo fruit varieties. J. Food Eng. 2005, 66, 387–393. [Google Scholar] [CrossRef]
  71. Aprajeeta, J.; Gopirajah, R.; Anandharamakrishnan, C. Shrinkage and porosity effects on heat and mass transfer during potato drying. J. Food Eng. 2015, 144, 119–128. [Google Scholar] [CrossRef]
  72. Gazor, H.R.; Chaji, H. Equilibrium moisture content and heat of desorption of saffron. Int. J. Food Sci. Technol. 2010, 45, 1703–1709. [Google Scholar] [CrossRef]
  73. Basunia, M.A.; Abe, T. Moisture desorption isotherms of medium-grain rough rice. J. Stored Prod. Res. 2001, 37, 205–219. [Google Scholar] [CrossRef]
  74. Somade, B. Moisture equilibrium of palm kernels. J. Sci. Food Agric. 1955, 6, 425–427. [Google Scholar] [CrossRef]
Figure 1. A sealed glass jar used in the experiments.
Processes 08 01658 g001
Figure 2. Sphericity index (γ) of palm kernel at different moisture contents.
Processes 08 01658 g002
Figure 3. (a) Surface area of palm kernel, (b) specific surface area of palm kernel at different moisture contents.
Processes 08 01658 g003
Figure 4. (a) Bulk density of palm kernel, (b) true density of palm kernel at different moisture contents.
Processes 08 01658 g004aProcesses 08 01658 g004b
Figure 5. Total porosity of palm kernel at different moisture contents.
Processes 08 01658 g005
Figure 6. Picture of palm kernel before ((a): 0.28 kg/kg) and after ((b): 0.07 kg/kg) the drying process at 80 °C.
Processes 08 01658 g006
Figure 7. SEM of the surface of palm kernel before and after the drying process at 80 °C (a) 0.28 kg/kg, ×12 SE, (b) 0.07 kg/kg, ×12 SE, (c) 0.28 kg/kg, ×100 SE, and (d) 0.07 kg/kg, ×100 SE.
Processes 08 01658 g007
Figure 8. Desorption isotherm of whole palm kernel (a) and ground palm kernel (b).
Processes 08 01658 g008
Figure 9. Residuals of predicated EMC for (a) whole kernel (modified Oswin model) and (b) ground kernel (modified Halsey model).
Processes 08 01658 g009
Figure 10. Experimental and predicted desorption isotherms for whole and ground palm kernel using modified Oswin model (a) and modified Halsey (b), respectively.
Processes 08 01658 g010
Table 1. Relative humidity (RH) of different saturated salt solutions at different temperatures.
Salt SolutionChemical FormulaRH (%)
50 °C60 °C70 °C80 °C
Lithium chlorideLiCl11.1010.9510.7510.51
Potassium fluorideKF20.8020.7721.7422.85
Magnesium chlorideMgCl230.5429.2627.7726.05
Sodium bromideNaBr50.9349.6649.7051.43
Sodium nitrateNaNO369.0467.3566.0462.22
Sodium chlorideNaCl74.4374.5075.0676.29
Potassium chlorideKCl81.2080.2579.4978.90
Table 2. Moisture sorption isotherm models.
Model Name ModelEquation No.Reference
Modified HendersonEMC = [ l n ( 1 R H ) a × ( T + b ) ] 1 / c (9)[26]
Modified OswinEMC = ( a + b × T ) × [ R H 1 R H ] 1 c (10)[27]
Modified HalseyEMC = [ l n ( R H ) e x p ( a + b × T ) ] 1 / c (11)[28]
Modified Chung–PfostEMC = ( 1 C ) × l n [ ( ( T + b ) a ) × l n ( R H ) ] (12)[29]
EMC is the equilibrium moisture content (kg/kg, d.b.), RH is relative humidity, T is the temperature (°C) and a, b, c are model constants (dimensionless).
Table 3. Dimensions of palm kernel at different moisture contents
MC
(kg/kg)
L
(mm)
W
(mm)
Th
(mm)
GMD
(mm)
0.31 ± 0.7616.08 a ± 2.0912.06 a ± 1.4010.01 a ± 1.2712.88 ± 1.33 a
0.28 ± 0.7816.63 a ± 2.1112.49 a ± 1.569.02 b ± 1.4212.07 ± 1.20 a
0.25 ± 1.4114.63 b ± 2.6711.55 b ± 1.529.21 b ± 1.2711.76 ± 1.23 b
0.20 ± 1.7714.58 b ± 2.6411.49 b ± 1.379.34 b ± 1.2111.56 ± 1.21 b
0.17 ± 1.3514.68 b ± 2.3911.45 b ± 1.529.34 b ± 1.2111.43 ± 1.28 b
0.09 ± 2.0114.22 b ± 2.0411.40 b ± 1.599.19 b ± 1.7511.43 ± 0.98 b
0.05 ± 0.5914.20 b ± 2.4411.37 b ± 1.089.18 b ± 1.3811.36 ± 1.26 b
0.02 ± 1.4214.17 b ± 2.3011.24 b ± 1.089.18 b ± 1.0411.31 ± 0.97 b
MC is the moisture content (kg/kg), L is length (mm), W is width (mm), Th is thickness (mm) and GMD is the geometric mean diameter (mm). For each MC, values are expressed as means ± standard deviation. Values in the same column having the same small letter are not significantly different by Least Significant Difference (LSD) tests at a confidence level of 95%.
Table 4. Model coefficients and statistical results for whole palm kernel.
Parameters Modified Modified Modified Modified
HendersonChung–PfostHalseyOswin
a6.70 × 10−86.08 × 1092.424.94
b5.34 × 1051.37 × 1098.4 × 10−41.59 × 10⁻³
c1.770.351.812.51
R20.980.8780.9770.978
Adjusted R20.880.770.8780.884
SEE2.672.652.662.59
RSS21.421.221.2520.26
χ20.820.8150.8170.77
Residual plotrandomrandomrandomrandom
a, b, c are model constants (dimensionless), R2 is coefficient of determination, SEE is standard error of estimate, RSS is residual sum of square and χ2 is chi-square.
Table 5. Model coefficients and statistical results for ground palm kernel.
Parameters Modified Modified Modified Modified
HendersonChung–PfostHalseyOswin
a0151.4563.588.31
b−19−26.031−0.024−0.061
c1.640.381.72.35
R20.990.9380.9920.991
Adjusted R20.940.80.9640.96
SEE1.711.791.371.45
RSS8.829.615.686.32
χ20.330.360.210.24
Residual plotrandomrandomrandomrandom
a, b, c are model constants (dimensionless), R2 is coefficient of determination, SEE is standard error of estimate, RSS is residual sum of square and χ2 is chi-square.
Publisher’s Note: MDPI stays neutral with regard to jurisdictional claims in published maps and institutional affiliations.

