Abstract
Polymerization is a typical exothermic reaction in the fine chemical industry, which is easy to cause thermal runaway. In order to lower the thermal runaway risk of polymerization, a microreactor was adopted in this study to carry out styrene thermal polymerization. The hydrodynamic model and the fluid–solid coupling model of thermal polymerization of styrene were combined by using the computation fluid dynamics (CFD) method to build a three-dimensional steady-state model of the batch and the microreactor and compare. The results indicated that the maximum temperature of the polymerization in the microreactor was only 150.23 °C, while in the batch reactor, it was up to 371.1 °C. Therefore, the reaction temperature in the microreactor could be controlled more effectively compared with that in the batch reactor. During the reaction process, jacket cooling may fail, which would lead to an adiabatic situation. According to the divergence criterion (DIV), the thermal runaway of the polymerization occurred in microreactors with different tube diameters under an adiabatic situation. Further, the diameter of the microreactor had a considerable effect on the distribution of the inside temperature field under normal jacket cooling. The maximum temperature difference in the microreactor with a diameter of 6 mm was controlled at 25.33 °C. However, the effects of the inlet velocity (0.001, 0.0015, 0.002, 0.0025, 0.003 m/s), jacket temperature (150, 170, 180, 190, 200 °C) and residence time (400, 500, 600, 750 s) were relatively small. In addition, the jacket temperature had significant effects on viscosity, while other conditions had little effect. The DIV criterion indicated that the styrene thermal polymerization reactions could be safely performed in the microreactor when the jacket was cooled normally.
1. Introduction
Chemical safety accidents have occurred frequently in the fields of petrochemical, pharmaceutical and plastic industries [1]. According to statistics, about 26% of chemical industry accidents were mainly caused by thermal runaway of reaction [2]. Reaction thermal runaway is that the reaction system enters the parameter sensitive region, and a small change of operating parameters will lead to an unstable state of the reaction systems [3]. The safety of polymerization, as a typical free radical reaction, is highly dependent on a reliable process control system due to its sensitivity of reaction rate to reaction temperature, material viscosity, and initiator concentration. In addition, local hot spots in the polymerization system could lead to uneven temperature distribution in reactors, which may further cause global thermal runaway. Among all the thermal runaway accidents, polymerization reaction thermal runaway accidents account for the highest proportion, about 48% [4]. Therefore, it was very important to ensure the safety of polymerization reaction at the source by using the principle of inherent safety [5]. In recent years, microreactors have been widely used in organic synthesis as a new type of process intensifier. Microreactors are generally understood as three-dimensional structures with extremely small internal dimensions between 10 and 100 μm (or 1000 μm) [6]. It shares the advantages of high heat transfer, mass transfer, high concentration/temperature gradient, and very large specific surface area [7,8]. These advantages enable microreactors to achieve isothermal operation of exothermic reactions [9]. In addition, the use of microreactors could help reduce the potential hazards of exothermic chemical reactions and toxicity of chemical substances due to their small volume [10]. Moreover, the increasing of the production scale can be easier achieved in microreactors than the traditional scale-up of batch reactors [11].
At present, cationic polymerization, anionic polymerization, free-radical polymerization and coordination polymerization have been carried out in microreactor [12]. Iwasaki et al. [13] combined eight microreactors to construct a methyl methacrylate free-radical polymerization micro-chemical pilot plant. The results showed that the polymer microreactor could be applied to relatively large-scale production. Méndez-Portillo et al. [14] studied the continuous free-radical polymerization of styrene in split-and-recombination (SAR) reactor and multilamination microreactor. The heat transfer coefficient of the SAR reactor and multilamination microreactor were 3.02 and 2.8 kW/(m2·k), respectively, and the mixing efficiency was up to 0.95. Yadav et al. [15] performed emulsion polymerization in a microreactor and determined that the emulsion had a considerable effect on the stability of the process operating conditions. Moreover, the microreactor exhibited a better emulsion mixing effect than the batch reactor. These results showed that the microreactors have the advantages of regulating the molecular weight distribution and improving the heat transfer performance, which makes the microreactor more attractive in industrial production. However, the thermal hazard of exothermic polymerization in microreactors has not been discussed.
The computational fluid dynamics (CFD) method was widely used to optimize the design of reactors and simulate reactions under harsh experimental conditions, which are difficult to be conducted in practice. For instance, CFD could simulate reactions under adiabatic conditions with extremely high reaction rates. The results can be served as a reference for process safety assessment. The local data of parameters, such as concentration and temperature, can be determined, and the mixing behavior of fluids in the reactor can be studied thoroughly. Mandal et al. [16] performed a numerical simulation of free-radical polymerization of styrene in a spiral tube microreactor; Their results were compared with that obtained in a straight tube microreactor of the same length under the same reaction conditions. It showed that the monomer conversion rate in the spiral tube microreactor was higher than that in the straight tube microreactor. Jiang et al. [17] established a batch reactor model, and the effects of cooling temperature, cooling flow rate and stirring speed on thermal runaway were discussed in detail. The temperature monitoring position and inhibitor injection position were optimized. Soleymani et al. [18]. Established a three-dimensional model to study the effects of different process parameters on flow dynamics and mixing efficiency. The simulation results indicated that the development of vortices was essential to achieve high mixing performances. Furthermore, the generation and development of vortices were closely related to the geometrical parameters of the mixer. These results indicated that CFD is an effective and reliable tool, which could be used for heat transfer, mass transfer, fluid flow, and reaction process analysis of polymerization in microreactors.
In the present study, a three-dimensional steady-state model of a batch reactor and that of a continuous flow microchannel reactor for thermal polymerization of styrene were established. The thermal runaway in a “millimeter” grade microreactor was studied, and the internal size of the microreactor was appropriately enlarged so that the results of the study were more suitable for industrial application and production. The reaction mechanism was introduced using user-defined functions (UDF) with the source terms of the component transport equations and the energy equations. The reaction kinetics of thermal polymerization of styrene was verified through a comparison of the simulation results with those in the literature. The risk of thermal runaway in microchannel reactors and batch reactors were discussed. The effects of wall insulation, inlet velocity, residence time, microreactor tube diameter and jacket temperature on the polymerization process were studied. A chaos criterion was included to provide early warning of a reaction runaway, which provides the basis for formulating the critical criterion of thermal runaway in a microreactor. The analysis of the thermal hazard of styrene thermal polymerization in the microreactor may be served as a reference for the design of the polymerization process and improve the reliability of microreactors in the production process.
2. Model Establishment
2.1. Modeling of the Batch Reactor
A computational fluid dynamics (CFD) model of thermal polymerization of styrene was established based on a 2L batch reactor (RC1e). The batch model was established (Figure 1), and the mesh was generation by using Ansys software.
Figure 1.
Physical model and grid division of the batch reactor.
Figure 1 illustrates the geometric model of the batch reactor. The total height of the reactor was 245 mm, the inner diameter was 115 mm, and the wall thickness was 5 mm, and the liquid level was 80.00 mm. The reactor was equipped with a four-blade propeller of 60 mm diameter, with 30° tilted blade impeller type. The reactor was divided into four parts, comprised of a form inside to outside, the stirring propeller, reaction fluid system, inner reactor wall, and outer cooling jacket. To ensure the accuracy of the numerical simulation, the reaction liquid system was assumed to be completely mixed during the simulation process, and the method of multiple reference frames (MRF) was used to solve the problem associated with using stirring blades. Several models were adopted, comprising the standard k-ε turbulence model, the enhanced wall model for the near-wall flow field. The fluid–solid coupling boundary conditions were used for the vessel wall, and adiabatic boundary conditions were used for the other walls. There was no internal heat source.
2.2. Modeling of Microreactor
Figure 2 illustrates the geometric model of the microreactor. In this study, the laminar flow model was adopted, and the fluid–solid coupling boundary condition was used for the wall of the microreactor, with no heat source inside. The microreactor model was established (Figure 2), and the mesh was generation by using Ansys software.
Figure 2.
Physical model and meshing of the microreactor.
3. Research Method
3.1. Governing Equation
3.1.1. Mass Conservation Equation
This equation can be expressed as follows:
where Sm is the quality source, which can be added through UDF.
The continuous equation can also be expressed as follows:
where u and v represent the velocity component values along the axial direction of the reactor (x-axial) and the radial direction of the reactor (r-axis), respectively [19].
3.1.2. Momentum Conservation Equation
This equation can be expressed as follows:
Defined as:
where p is the static pressure; u is the fluid velocity; τij is the stress tensor; ρ and μ are the density and dynamic viscosity of fluid; and gi and Fi are gravity and external volume force in the i direction, respectively [20].
3.1.3. Energy Conservation Equation
The energy equation solved by Fluent (Ansys Workbench, Inc) can be expressed as follows:
where T, Cp, and K represent temperature, specific heat capacity and fluid heat transfer coefficient, respectively. ST represents the source terms for chemical reaction heat and other volumetric heat sources [20].
3.1.4. Governing Equations and Source Terms
The continuity equation, momentum equation, energy equation and component transport equation of the thermally initiated polymerization of styrene can be expressed as follows:
where ϕ is the system variable; ρ is the fluid density; t is the time, Ui is the velocity in the x, y and z directions of the fluid; Γϕ is the generalized diffusion coefficient, and Sϕ is the source term.
The mechanism of the thermally initiated polymerization of styrene demonstrated by Hui et al. [21] was used. The mechanism involves chain initiation, chain transfer, and chain termination. The specific expressions are as follows:
Chain initiation:
Chain transfer:
Chain termination:
where, M, R, and P represent styrene, free radical and polystyrene, respectively; The subscripts r and s represent the length of the polymer chain. Kth, KP and Ktc represent the rate constants of three reactions.
The styrene polymerization rate RP can be expressed as follows:
During the thermally initiated polymerization of styrene, the styrene concentration [M] in the mixture is related to the styrene density ρ (wm is the mass fraction of styrene, and Mm is the relative molecular mass of styrene):
Therefore, the styrene polymerization rate can be expressed as follows [22]:
The rate constant is calculated by the Arrhenius equation:
where R is the molar gas constant, A is the pre-exponential factor, and E is the activation energy.
Table 1.
Kinetic parameters values for styrene polymerization (K = Ae−E/RT).
Furthermore, the computational process of CFD simulation software requires component transport equations and energy equation source terms. The source term of the component transport equation can be obtained as the following formula:
The source term in the energy equation can be obtained using the following formula:
where ΔH is the reaction enthalpy [25].
3.1.5. Material viscosity
The viscosity of the simulated mixture can be calculated as follows [22]:
where γ is the shear rate. The zero-shear viscosity μ0 of the reaction material is calculated as follows [26]:
where Mwp is the average molecular weight of the polymer, Wp is the mass fraction of the polymer in the mixture, and T is the reaction temperature.
The density of the mixture is based on the values reported by Soliman et al. [27]:
All parameters and equations were written as UDF and loaded into the CFD solver.
3.1.6. Reynolds Number
- The Reynolds number in a stirred reactor is as follows [28]:where N is the rotation speed of the stirring blade (rad/s), D is the diameter of the blade (m), μ is the viscosity of the material (Pa·s), and ρ is the density of the material (kg/m3). The flow of fluid was classified as laminar or turbulent according to the Reynolds number. In a stirred tank, a flow with a Reynolds number below 50 is laminar, that with a Reynolds number of 50–5000 is in the transition state, and that with a Reynolds number over 5000 is turbulent.
- The Reynolds number in the microfluid is as follows [29].where d is the inner diameter of the microchannel (mm), v is the average flow velocity of the fluid (m/s), ρ is the density of the fluid (kg/m3), and μ is the viscosity of the fluid (Pa·s). For a single flow, the flow pattern in the microreactor is dominated by laminar flow, which is converted into a turbulent flow at an Re value of approximately 2000 [30].
This study considered a styrene reaction temperature under 150 °C and a viscosity of 0.0002 Pa·s as the parameters [31]. The Reynolds number was then calculated to determine the fluid flow pattern in the reactor under different simulation conditions. The specific calculation results are displayed in Table 2. According to the Reynolds numbers, the fluid flow pattern in the batch reactor model was determined to be turbulent; thus, the standard k-ε turbulence model was selected. The fluid flow pattern in the microreactor was laminar; thus, the laminar flow model was selected.
Table 2.
Calculated Reynolds numbers and assessments of fluid morphology.
3.1.7. Model Selection
- (1)
- Batch reactor model selection
The fluid flow pattern was assessed on the basis of the Reynolds number. The flow pattern in the batch reactor was turbulent. Therefore, the standard k-epsilon viscous model was selected for the simulation calculation [32]. Fluid–solid conjugate heat transfer was included in the model. Boundary layer grid encryption must be performed on the fluid near the wall area to obtain an accurate solution, and enhanced wall functions were used. The fluid and solid areas were included in the calculation of the batch reactor model, and the fluid–solid coupling model had to be selected. Therefore, Enhanced Wall Functions was selected [32].
- (2)
- Microreactor model selection
The Reynolds number in the microreactor indicated that the fluid flow form was laminar flow. Therefore, the laminar viscous model was selected for the simulation calculation [33]; the laminar model is a low Reynolds number model, and thus, wall functions were not required. The fluid and solid areas were included in the calculation of the microreactor model, and the fluid–solid coupling model was selected.
3.2. Solution Parameter Setting
To effectively control the calculation process, the solver to be set in the controller, the content is as follows:
- (1)
- Choose a discrete format
The discretization settings of variables the simulation variables are presented in Table 3.
Table 3.
Discretization settings.
- (2)
- Set under-relaxation factor
The setting of the under-relaxation factors in the simulation are listed in Table 4.
Table 4.
Under-relaxation factor.
- (3)
- Set monitoring variables
To obtain the variables and flow field data in the calculation process, the monitoring parameters corresponding to the monitoring surface and point were created using a monitor function. Monitoring parameters included material volume average temperature, surface average temperature, surface maximum temperature, and material conversion rate.
- (4)
- Set initial conditions
A standard initialization approach was applied to initialize C8H8 at 1. The initial field temperature was also initialized at 150 °C.
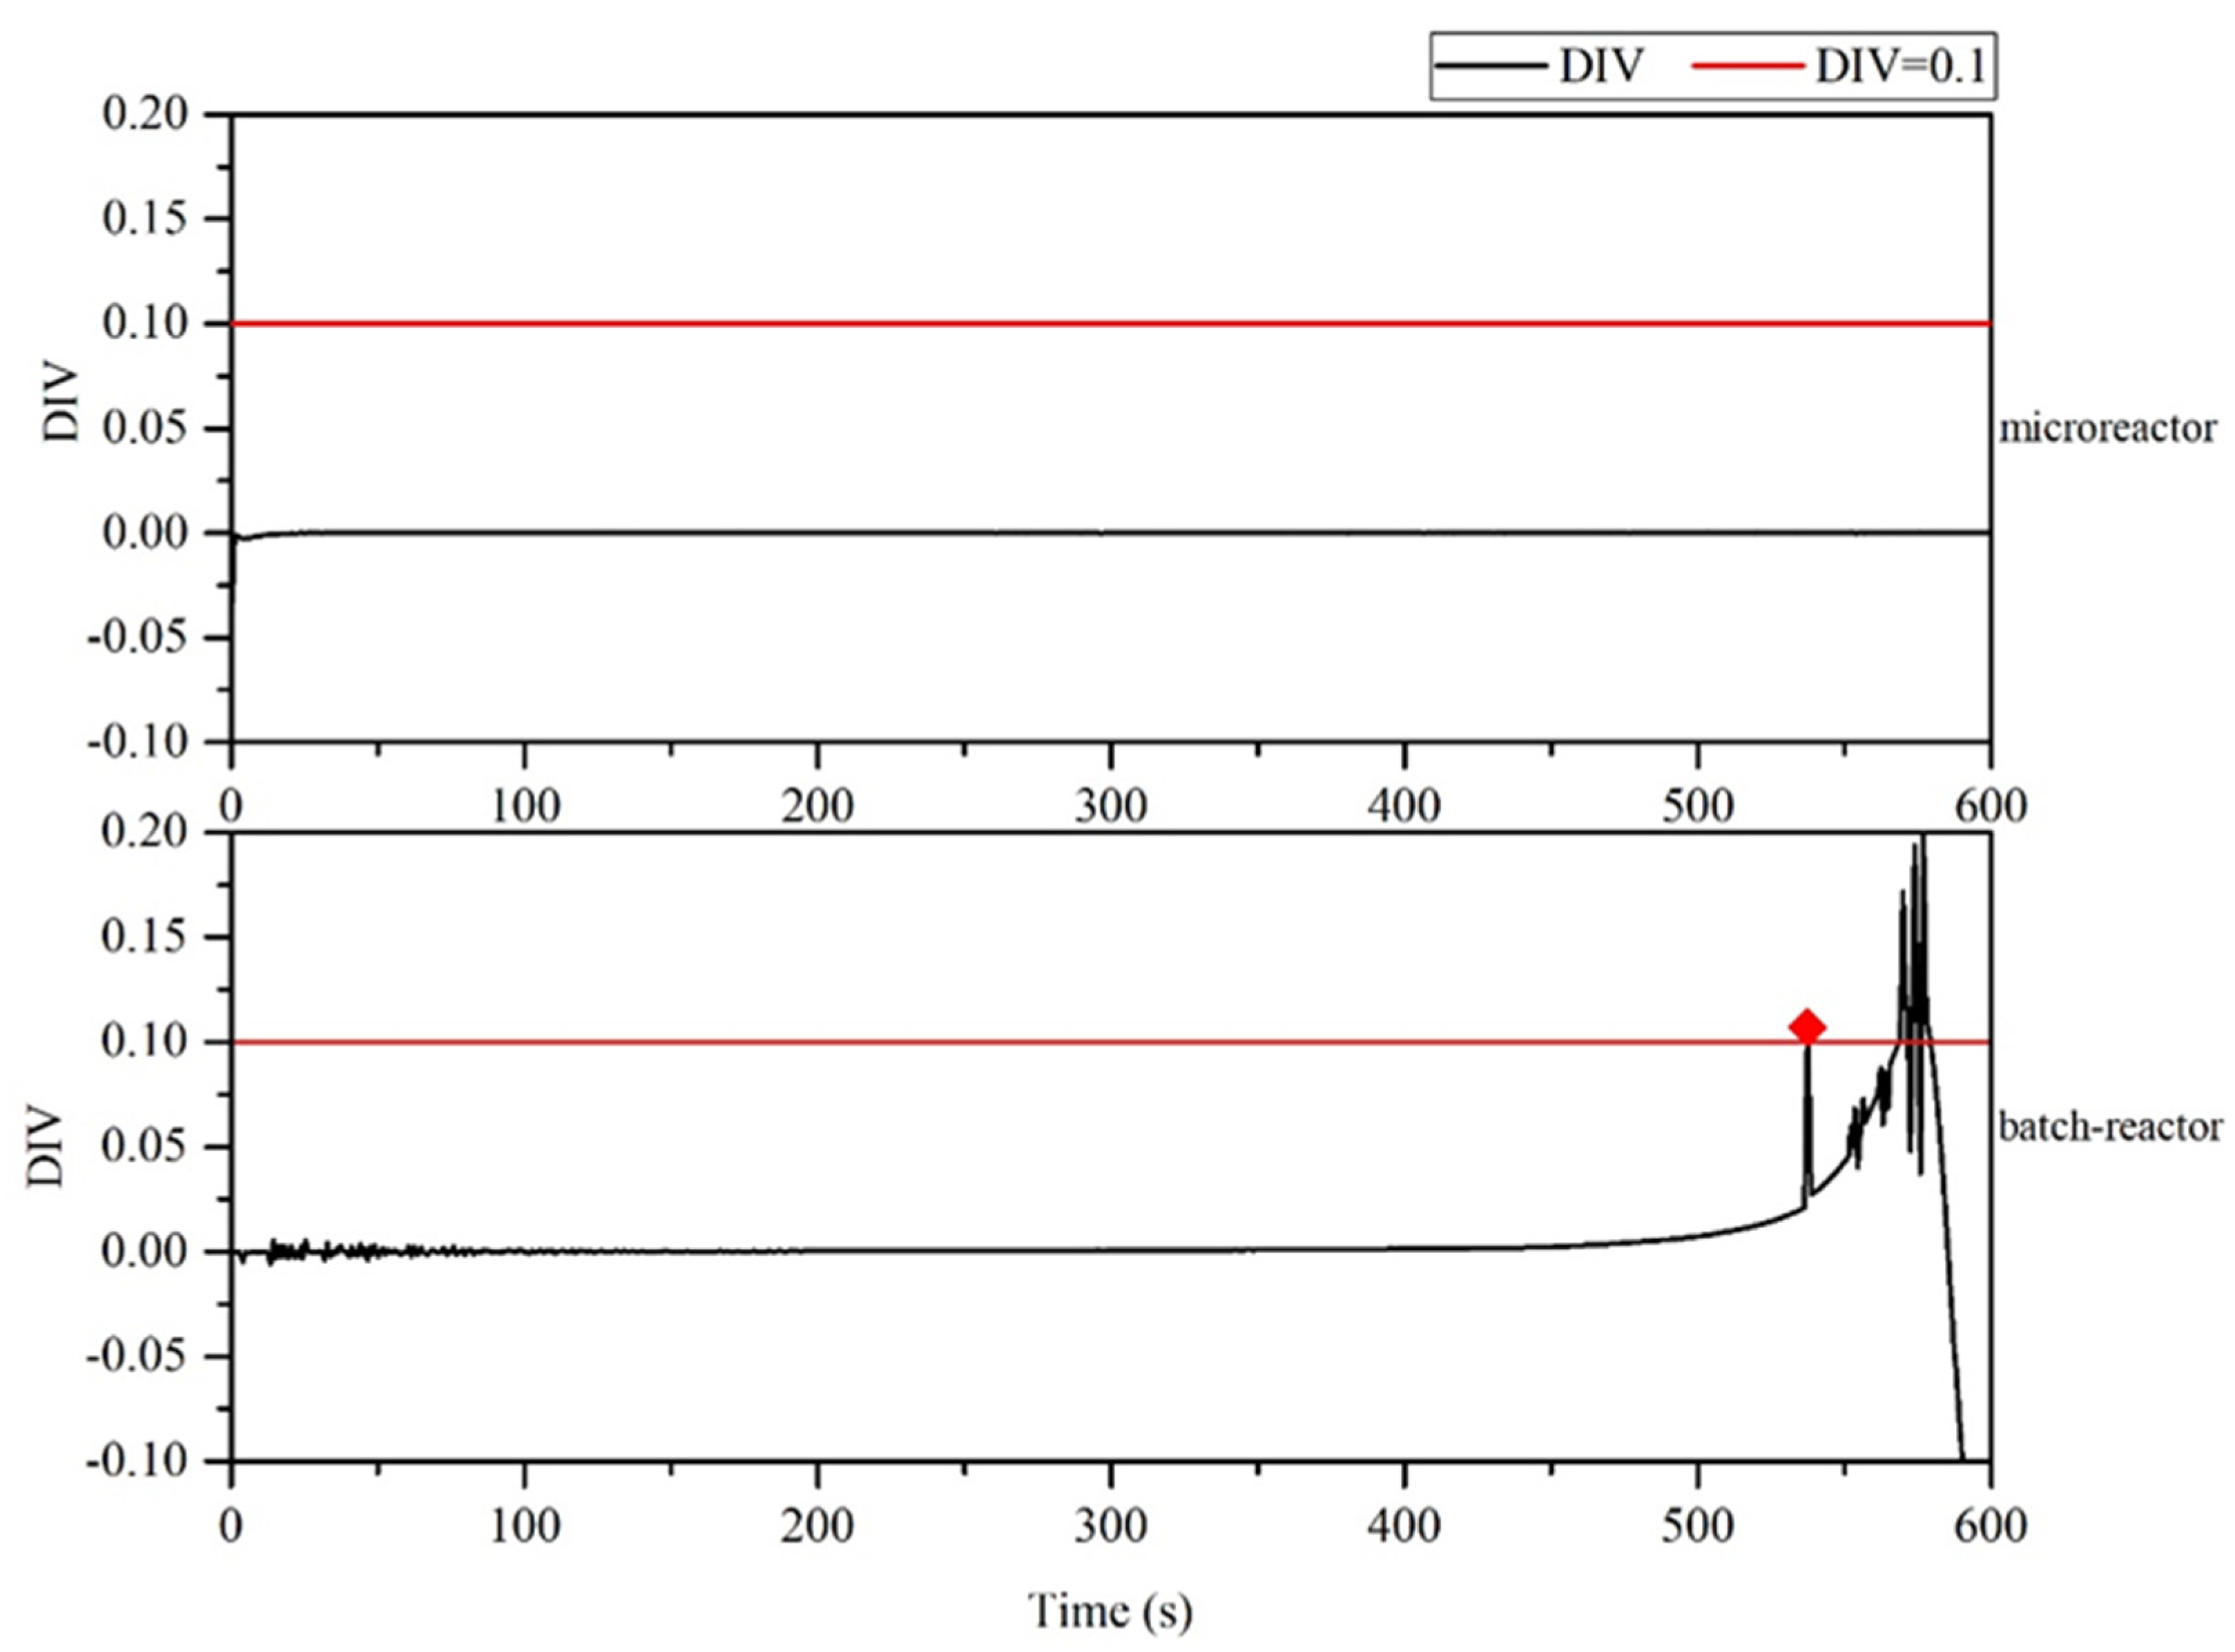
3.3. Critical Criterion for Thermal Runaway
Numerous scholars have evaluated the criteria of runaway reaction [33]. The Chaos divergence criterion was selected as the standard control warning to accurately judge whether a reaction is out of control. This method can be applied to perform online monitoring using temperature data in order to provide improved predictions of loss of control reactions [34,35,36]. Bosch et al. [37] defined the divergence criterion as the trace (J) of the Jacobian matrix:
where α is the conversion rate of the reactant, and T is the temperature of the reaction system (K).
A reaction is out of control when div > 0. If the position of the temperature monitor is properly set in the reactor to represent the overall temperature of the system, real-time monitoring by calculating the div value can be used to achieve the action of the control alarm.
3.4. Simulation Case
The microreactor size and the external jacket temperature could affect the distribution of the reactor temperature field and the conversion rate of styrene in the polymerization process (Table 5).
Table 5.
Summary of simulation conditions for the thermal polymerization of styrene.
4. Simulation Verification
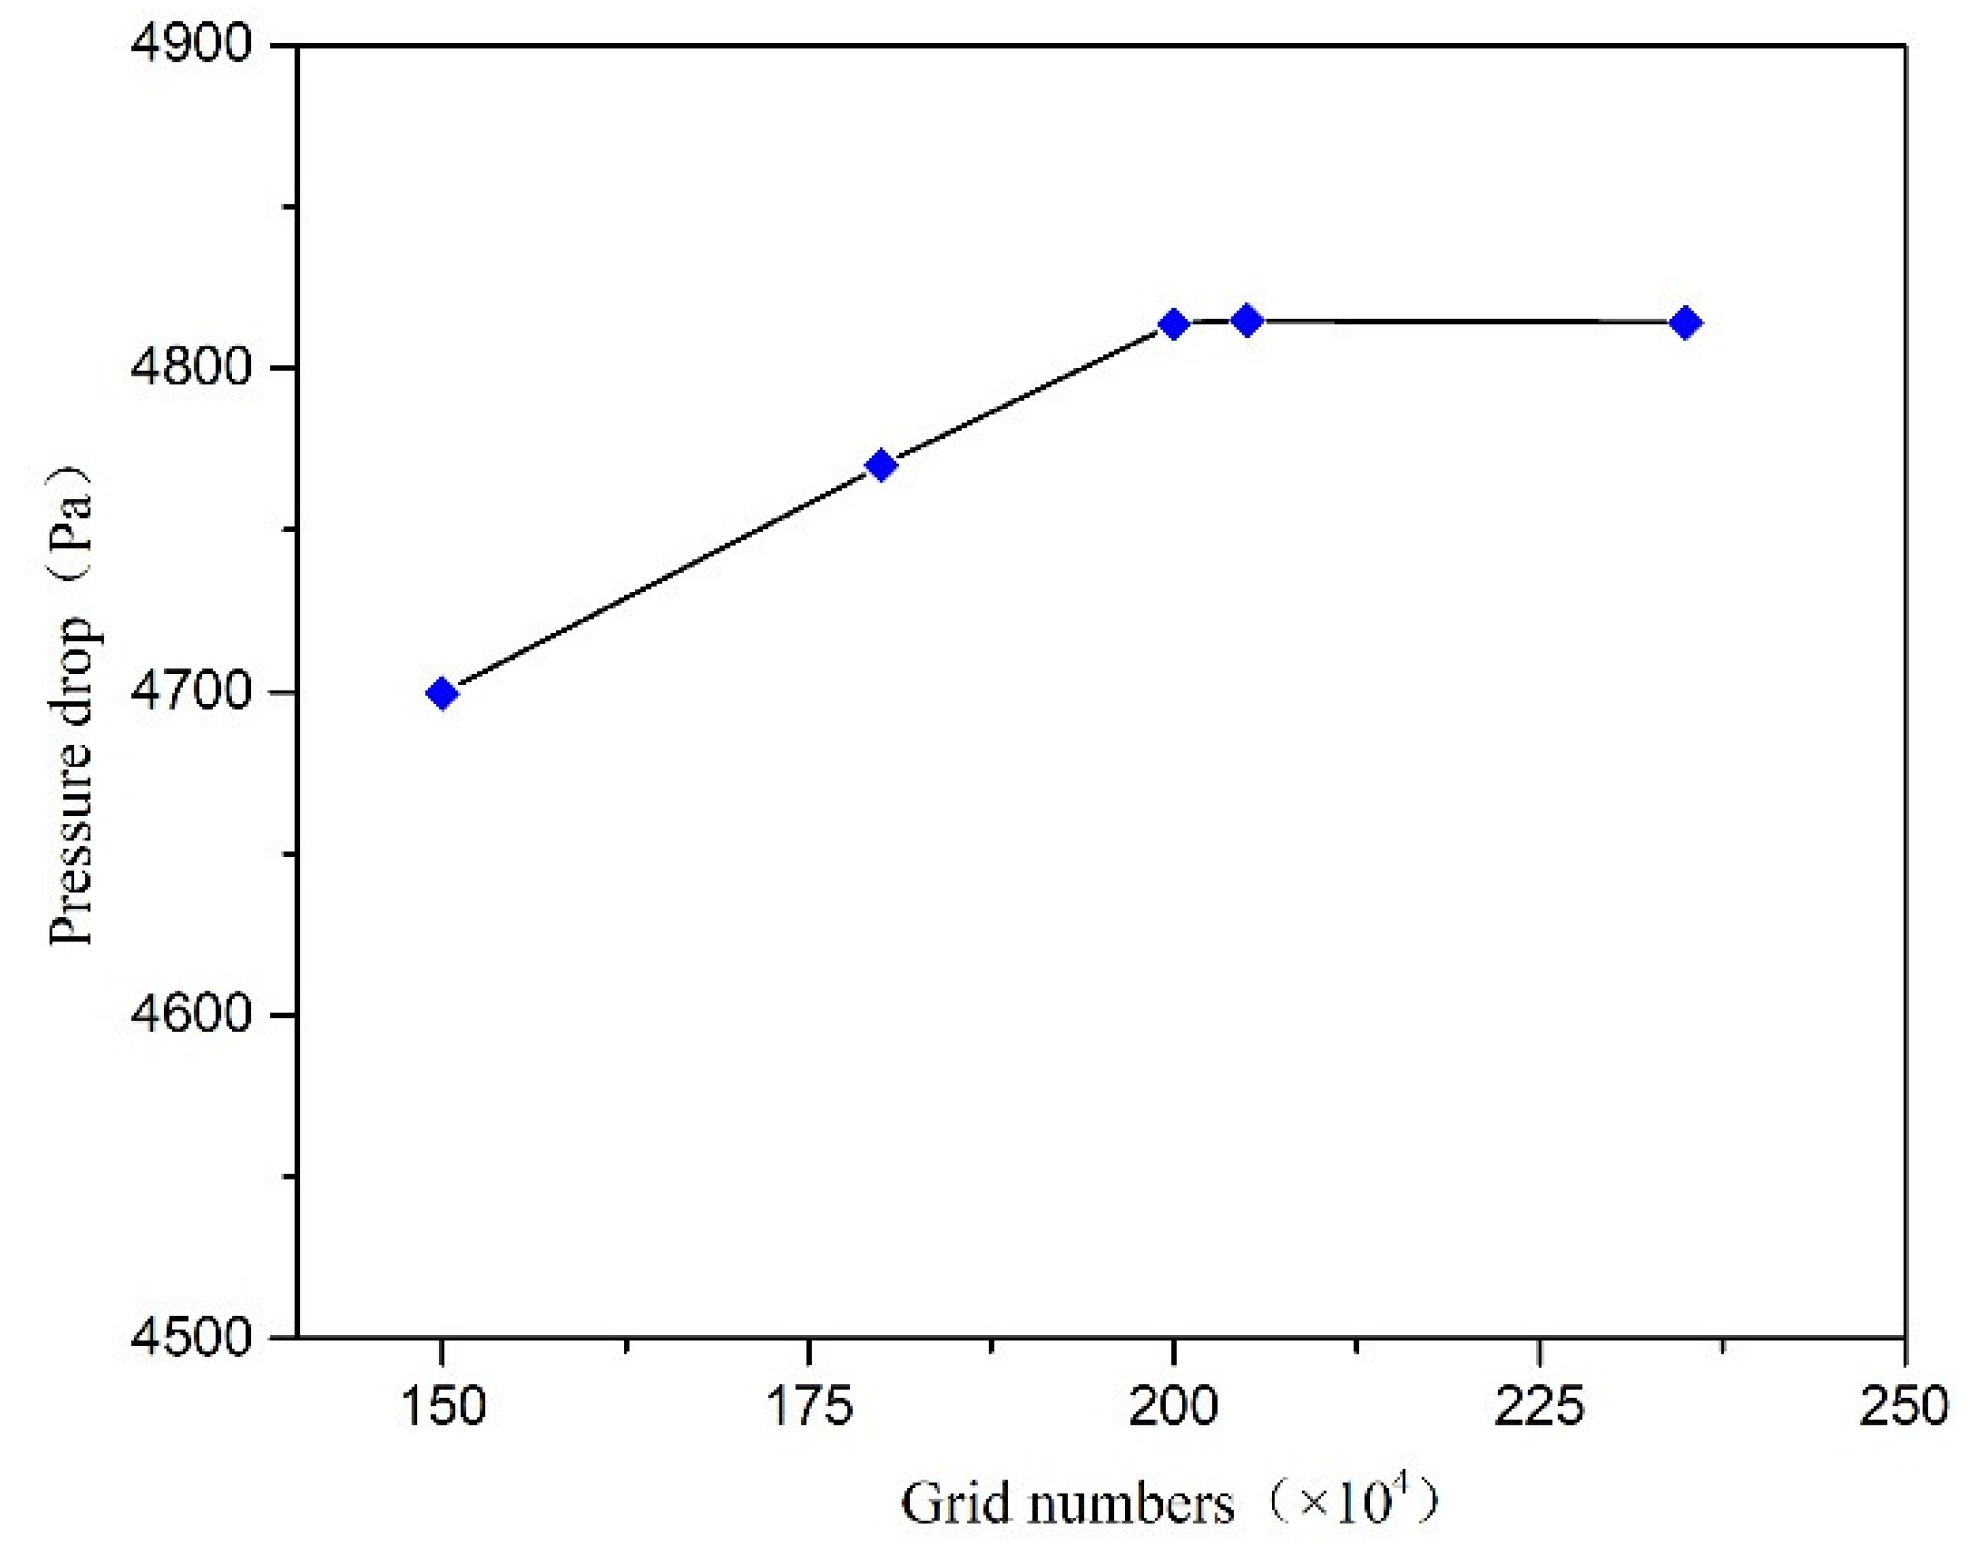
4.1. Grid Independence Verification
In this paper, the initial temperature of 150 °C, inlet velocity of 0.002 m/s, length of 800 mm, and microreactor diameter of 4 mm were selected for numerical simulation. There were corresponding evaluation standards for mesh quality in mesh software. The mesh size was reduced or enlarged by changing the average side length of the selected specific unit (face, body). Parameters such as heat transfer, velocity and pressure can be used to determine the mesh quality. In the study, the change of pressure was more obvious, and it was easier to judge the influence of grid quality on simulation results. Therefore, the effect of mesh density on inlet pressure was investigated. From Figure 3, when the grid number exceeds 2 × 10⁶, the pressure drop between the reactor inlet and outlet tends to be constant. Therefore, 2 × 10⁶ grid numbers were adopted by the subsequent simulations.
Figure 3.
The calculation results in different grids.
4.2. Validation of Models
Styrene thermal polymerization is a strongly exothermic reaction, which can be dangerous. Hungenberg et al. [38] compared the Hui–Hamielec, Weickert and Marten–Hamielec model and determined that these three models were consistent with the experimental results of thermal polymerization of styrene. Cui et al. [39] also conducted a study on styrene polymerization reaction in a batch reactor using a numerical simulation and compared the average temperature curve obtained from the CFD method with temperature curves predicted by the Hui–Hamielec, Weickert and Marten–Hamielec models. They demonstrated that the CFD model could be used to simulate the thermal polymerization of styrene. Figure 4 illustrates a comparison of the average temperature curve predicted by the CFD model established in this study with temperature curves predicted by the Hui–Hamielec, Weickerkt Marten–Hamielec and Cui models. The temperature was initialized at 150 °C. The time taken for the CFD model to rise 30 °C was compared with the contrast model. The comparison results indicated that the average temperature curve predicted by the CFD model established in this study was consistent with the temperature curves predicted by the other four models. Furthermore, the variation in the time interval for the temperature to rise by 30 °C was less than 15%. These findings indicate that the CFD model established in this study could be used for the simulation of styrene thermal polymerization.
Figure 4.
Predicted temperature curve of styrene polymerization, by the computation fluid dynamics (CFD) model and comparative model.
5. Calculation Results and Analysis
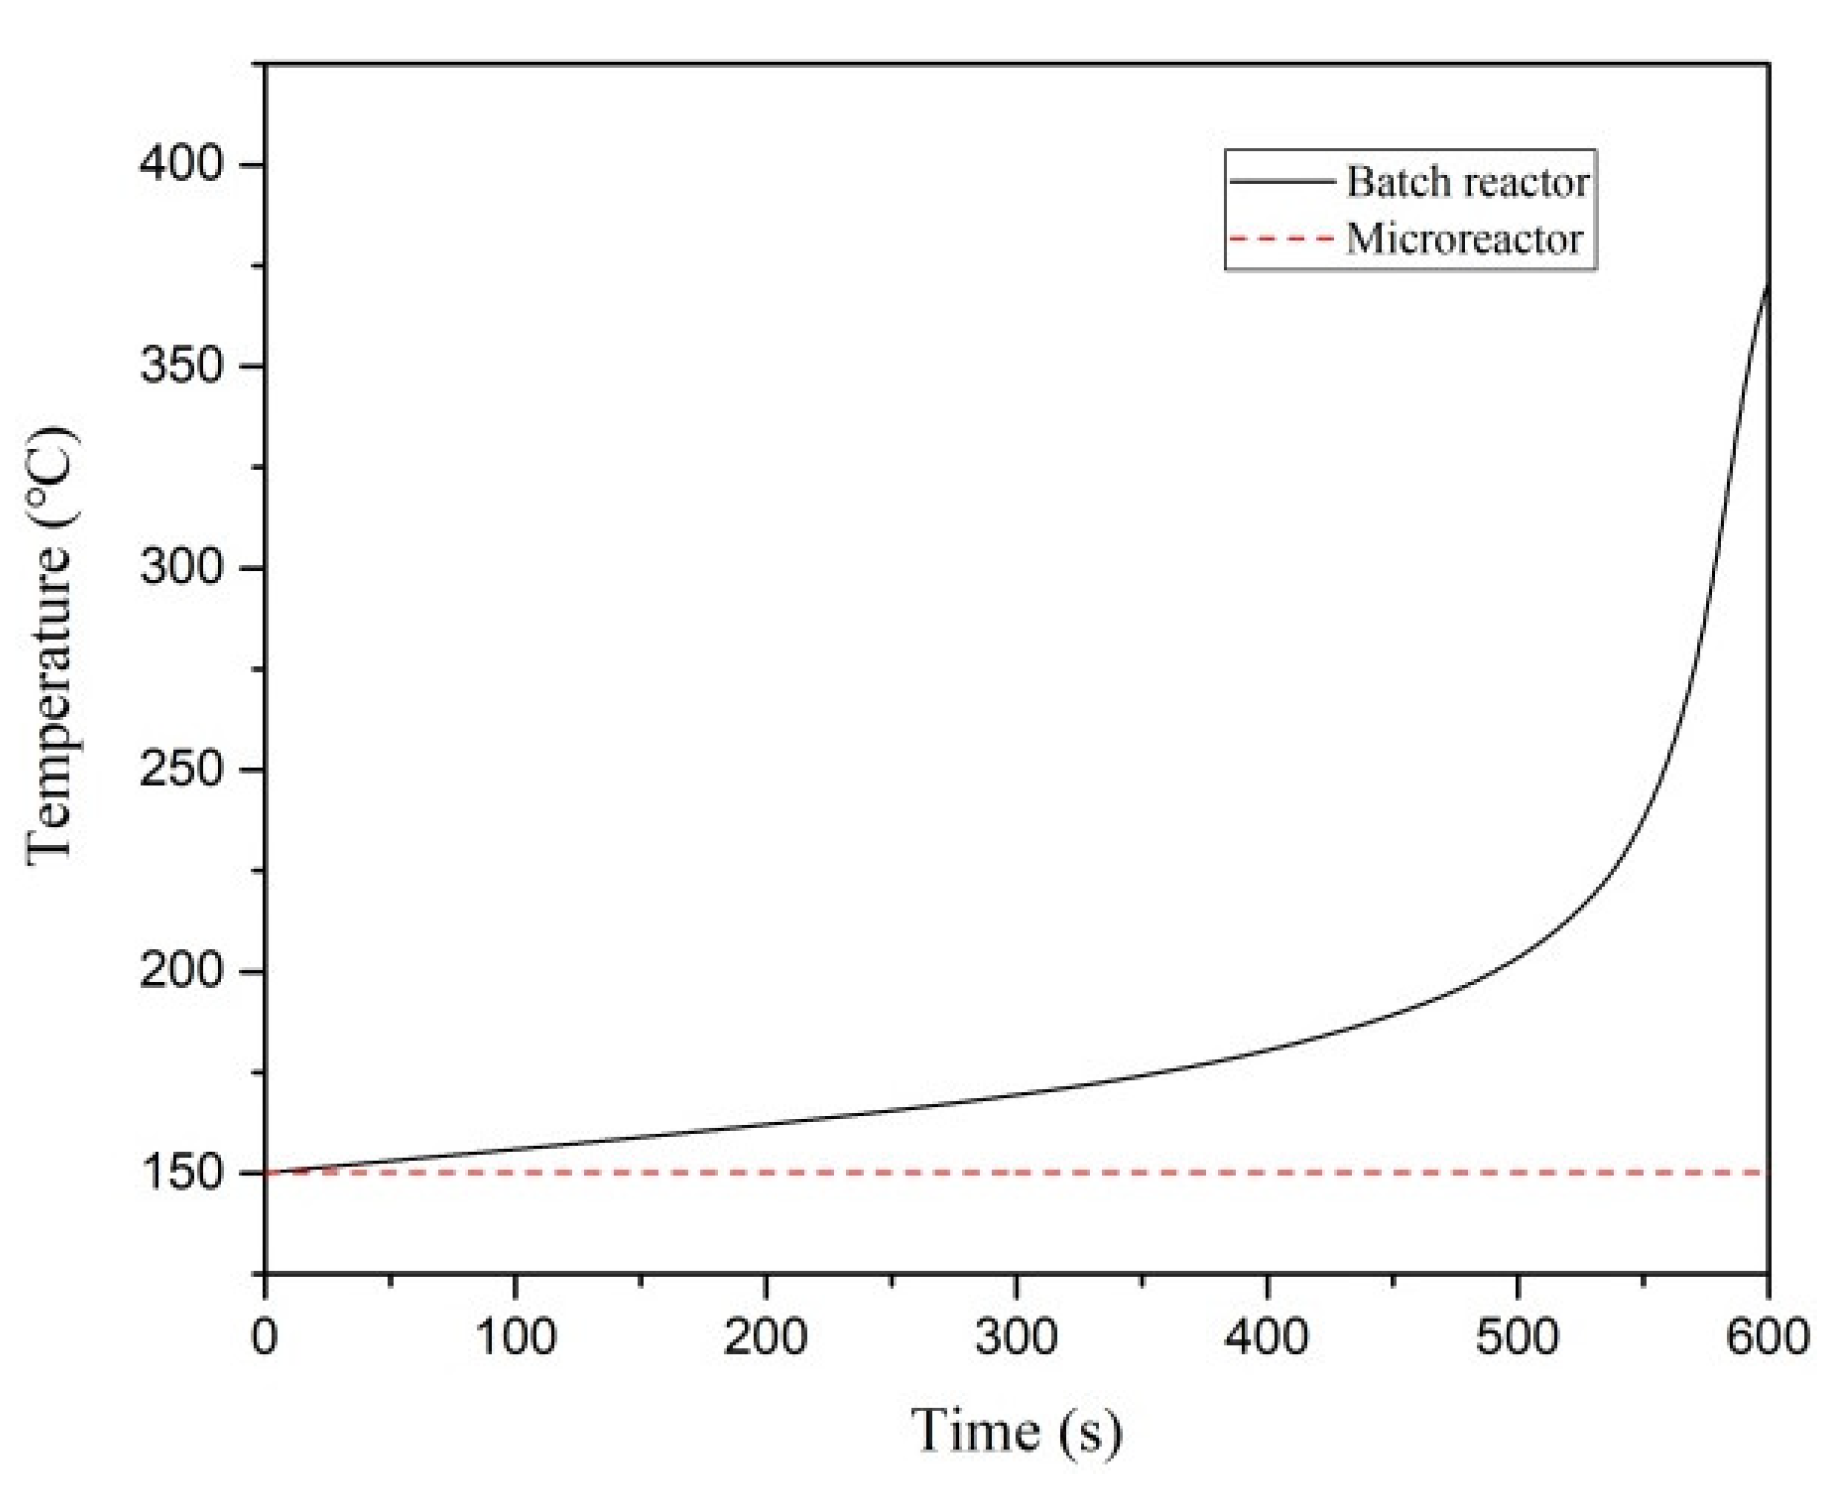
5.1. Compared with Batch Reactor
For the thermal polymerization of styrene, the initial temperature and jacket temperature of the batch reactor and the microreactor were 150 °C (the microreactor diameter was 1.8 mm, tube length was 1200 mm, and inlet velocity was 0.002 m/s). The thermal hazard of styrene polymerization was compared in the two reactors. As illustrated in Figure 5, the temperature inside the batch reactor increased from the initial temperature of 150 °C to 371.1 °C as the reaction progresses. The maximum temperature difference of 221.1 °C. In the microreactor, the reaction process led to a relatively small temperature gradient, with the highest temperature being 150.23 °C and a maximum temperature difference of 0.23 °C. To determine whether the polymerization reaction was out of control in two reactors, the divergence criterion (DIV) was calculated and used as the evaluation criterion. Because of errors in the monitoring process and to avoid false alarms, DIV = 0.1 was set as the critical alarm point for thermal runaway. As illustrated in Figure 6, the first intersection of the critical line and the divergence curve is the critical alarm point at which thermal runaway may occur. Therefore, the batch reaction began to spiral out of control at 537.5 s, whereas the microreactor reaction process did not spiral out of control.
Figure 5.
Temperature–time curves of the batch reactor and microreactor.
Figure 6.
Divergence criterion (DIV) diagram of temperature monitoring in the batch reactor and microreactor.
The study indicated that the microreactors displayed superior control of the thermal polymerization of styrene than did the batch reactor under the same working conditions, which reduced the risk of runaway reactions.
5.2. Effect of Adiabatic Conditions
The simulation conditions are outlined as follows: initial temperature 150 °C; length 800 mm; inlet velocity 0.002 m/s, and microreactor diameters 1.8, 4 and 6 mm.
Figure 7 illustrates the axial section of the microreactor at tube diameters of 1.8, 4 and 6 mm under adiabatic conditions. The thermal polymerization of styrene was performed in the microreactor. Heat transfer could not be effectively executed because of a cooling failure of the external jacket. As the reaction progresses, the heat generated by the reaction accumulates and moves towards the exit, resulting in a sharp rise in the temperature of the exit section, leading to thermal runaway. Figure 8 illustrates the temperature distribution curve of the central axis of the microreactor at tube diameters of 1.8, 4 and 6 mm under adiabatic conditions. As indicated by the curve, the outlet sections of these three microreactors had the highest temperature, and the temperature at outlet sections with diameters of 1.8, 4 and 6 mm reached 675.94, 410.83 and 415.82 °C, respectively. Under the adiabatic condition, the occurrence of local high-temperature regions also accelerated the reaction rate and improved the conversion rate of styrene. The conversion rates of styrene at the outlet sections with diameters of 1.8, 4 and 6 mm were 0.96, 0.88 and 0.92, respectively, which are very favorable (Figure 9). The DIV criterion was adopted to determine whether the reaction was out of control, as displayed in Figure 10. Because of errors in the monitoring process, and to avoid false alarms, DIV = 0.1 was set as the critical alarm point for thermal runaway. The polymerization reaction of the microreactor at a tube diameter of 1.8 mm was determined to be out of control at 340 s, that of the microreactor at a tube diameter of 4 mm was out of control at 348 s, and that of the microreactor at a tube diameter of 6 mm was out of control at 348.3 s.
Figure 7.
Temperature distribution cloud diagram of the axial section of the microreactor at different tube diameters under adiabatic conditions.
Figure 8.
Temperature distribution curve of the central axis under adiabatic conditions.
Figure 9.
Polymer conversion rate curves under adiabatic conditions.
Figure 10.
DIV diagram of temperature monitoring under adiabatic conditions.
The external jacket of the microreactor can enhance heat transfer and effectively control the reaction temperature. When the microreactor jacket cooling fails, the heat in the microreactor cannot be removed, causing the microreactor to enter a nearly adiabatic state due to rapid heat accumulation, which then causes thermal runaway.
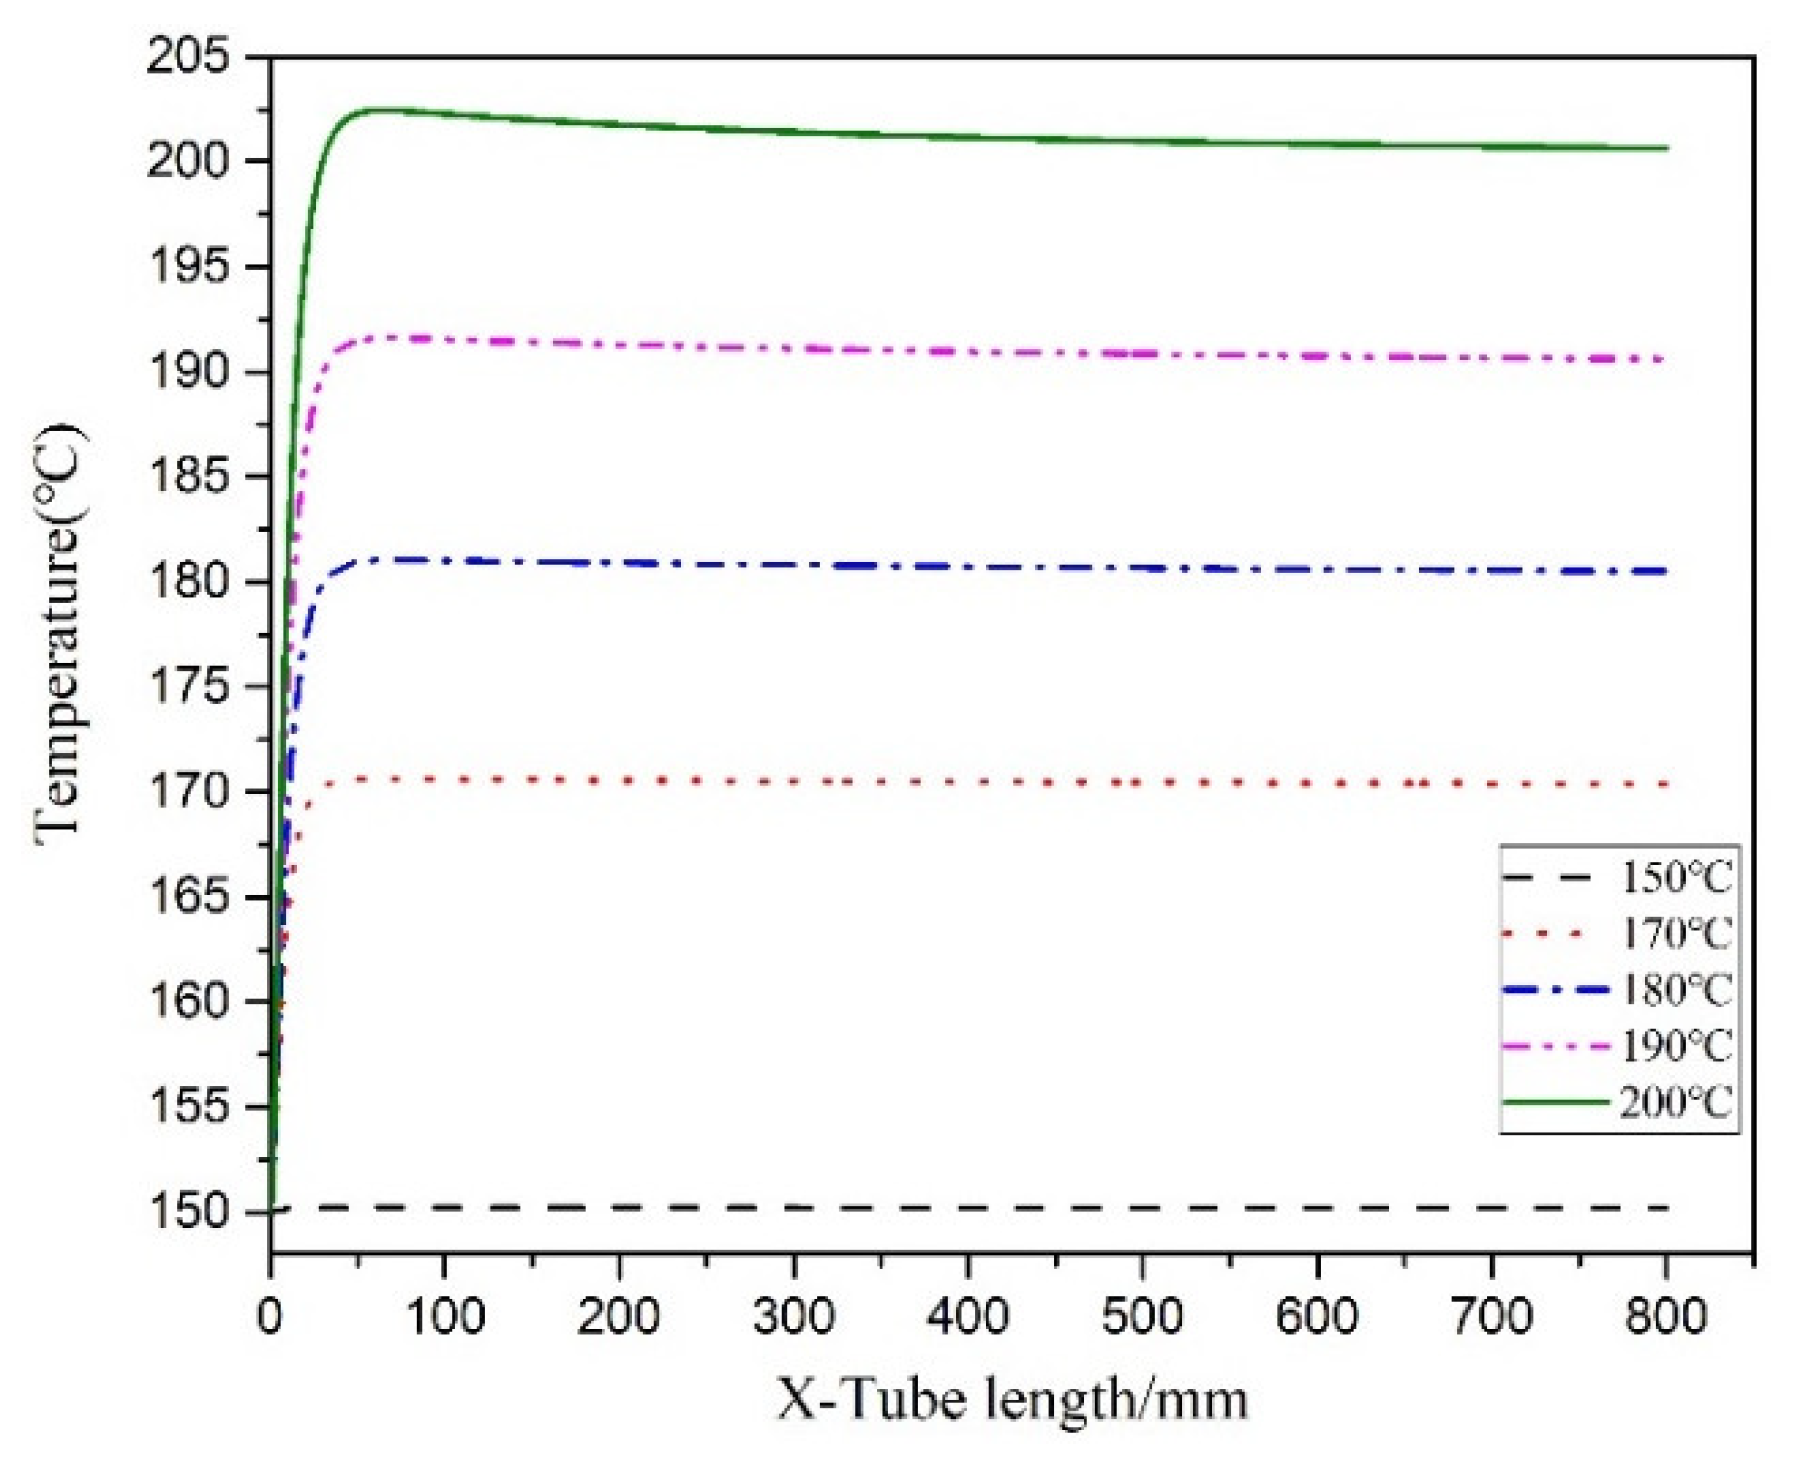
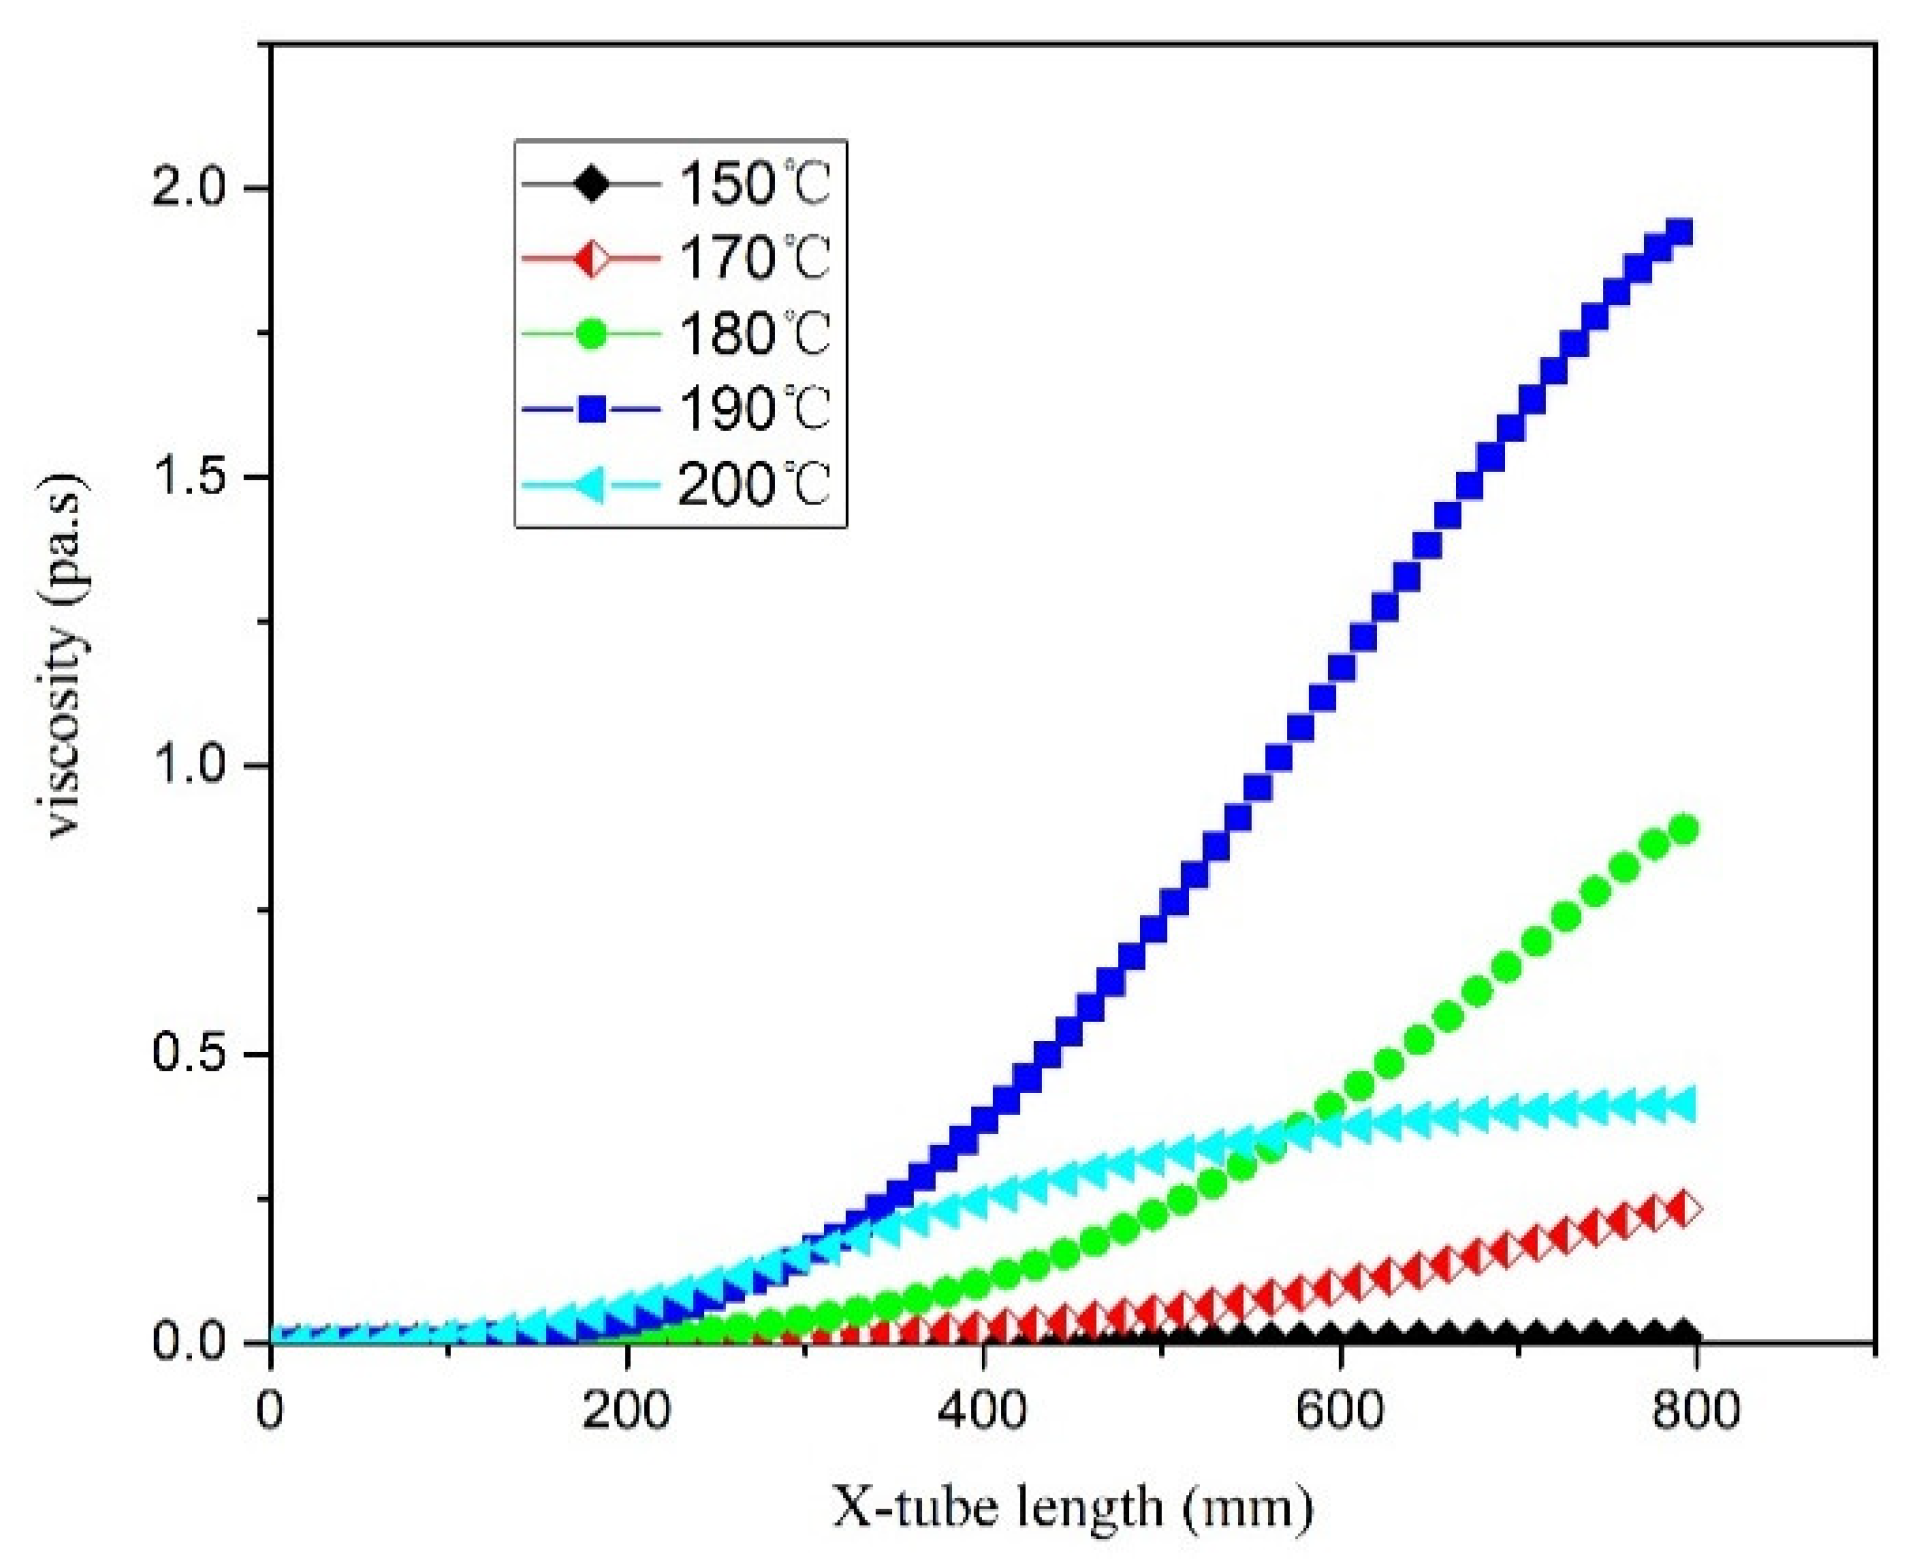
5.3. Effect of Jacket Temperature
The simulation conditions are outlined as follows: tube diameter of 1.8 mm, length of 800 mm, inlet velocity of 0.002 m/s, and initial temperature of 150 °C, under constant temperature.
Figure 11 illustrates the temperature distribution cloud diagram of the axial section of the microreactor at 150, 170, 180, 190 and 200 °C. The findings were compared with the temperature distribution cloud diagram in Figure 7 under adiabatic conditions. Under normal conditions, the jacket could rapidly remove the heat generated in the reaction process to ensure that the temperature in the microreactor could be controlled within a certain range without local high-temperature. Thus, making the temperature field in the microreactor more uniform and reducing the risk of thermal runaway. Figure 12 illustrates the temperature distribution along the central axis in the microreactor at five different jacket temperatures. A temperature interval was observed between the initial temperature at the inlet section and the jacket temperature. This indicates that the reaction material rapidly exchanges heat with the external jacket upon entering the microreactor. Thus, the temperature of the reaction system rises rapidly and approaches the jacket temperature. Regardless of the heating phase due to heat exchange, the temperature curve obtained for the microreactor was determined to be very flat. The jacket outside the reactor controlled the temperature of the reaction system. When the jacket temperature increased, the temperature of the reaction system also increased, which accelerated the reaction rate and increased the conversion rate of styrene. When the jacket temperature was 200 °C, the conversion rate of styrene reached 0.42, compared with jacket temperature was 150 °C under the condition of increased by 0.347 (See Figure 13). As illustrated in Figure 14 higher jacket temperatures were, associated with higher temperature differences in the microreactor. When the jacket temperature was 200 °C, the maximum temperature difference in the microreactor was 2.45 °C. Therefore, selecting the correct jacket temperature is critical for avoiding runaway reactions.
Figure 11.
Temperature distribution cloud diagram of the axial section of the microreactor at different jacket temperatures.
Figure 12.
Temperature curves of the central axis at different jacket temperatures.
Figure 13.
Polymer conversion rate curves at different jacket temperatures.
Figure 14.
Temperature difference in the microreactor at different jacket temperatures.
The viscosity changed with different jacket temperature are shown in Figure 15. It could be found that the viscosity of the system has a maximum value at a certain temperature, which was due to the influence of two factors. On the one hand, as the reaction temperature rises, the conversion rate of the system increases and the viscosity increases. On the other hand, the viscosity decreases with the increase of temperature, and the two compete to produce the extreme value. When the jacket temperature was 200 °C, the viscosity of the reaction system decreases on the contrary. This is because 200 °C is a cut-off point, which is different from the formula used to calculate the viscosity when the jacket temperature is 150–190 °C [40]. Therefore, when the reaction temperature exceeded the temperature corresponding to the viscosity maximum, increasing the reaction temperature can reduce the viscosity of the reaction system, which was beneficial to the flow and heat transfer of the reaction system.
Figure 15.
Viscosity curve in the microreactor at different jacket temperatures.
The DIV criterion was used for assessments at microreactor with 150, 170, 180, 190 and 200 °C (Figure 16). The derived DIV values for the microreactor are shown in Figure 16. These five temperatures for thermal polymerization of styrene did not lead to out of control and can thus be considered safe options for polymerization.
Figure 16.
DIV diagram of temperature monitoring in the microreactor at different jacket temperatures.
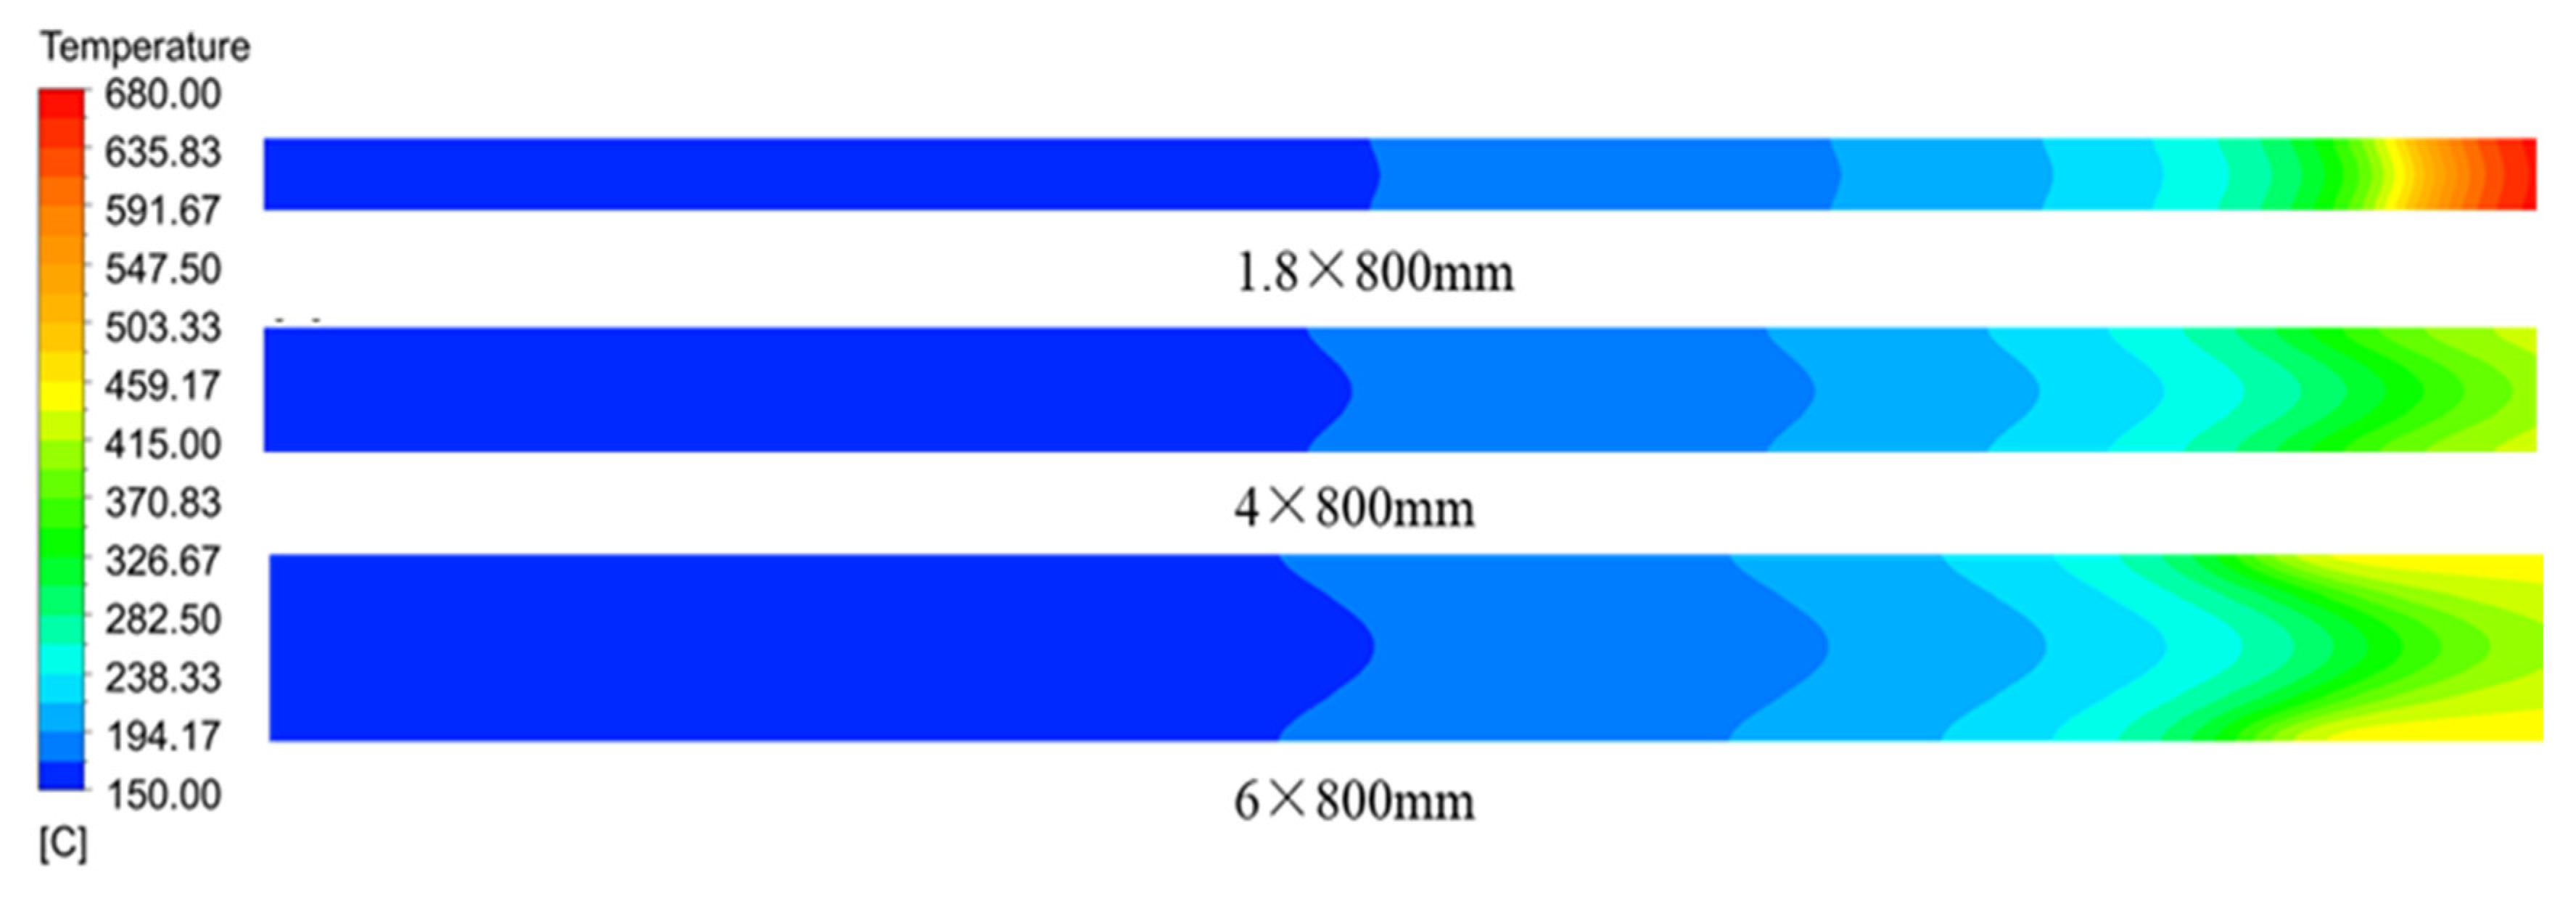
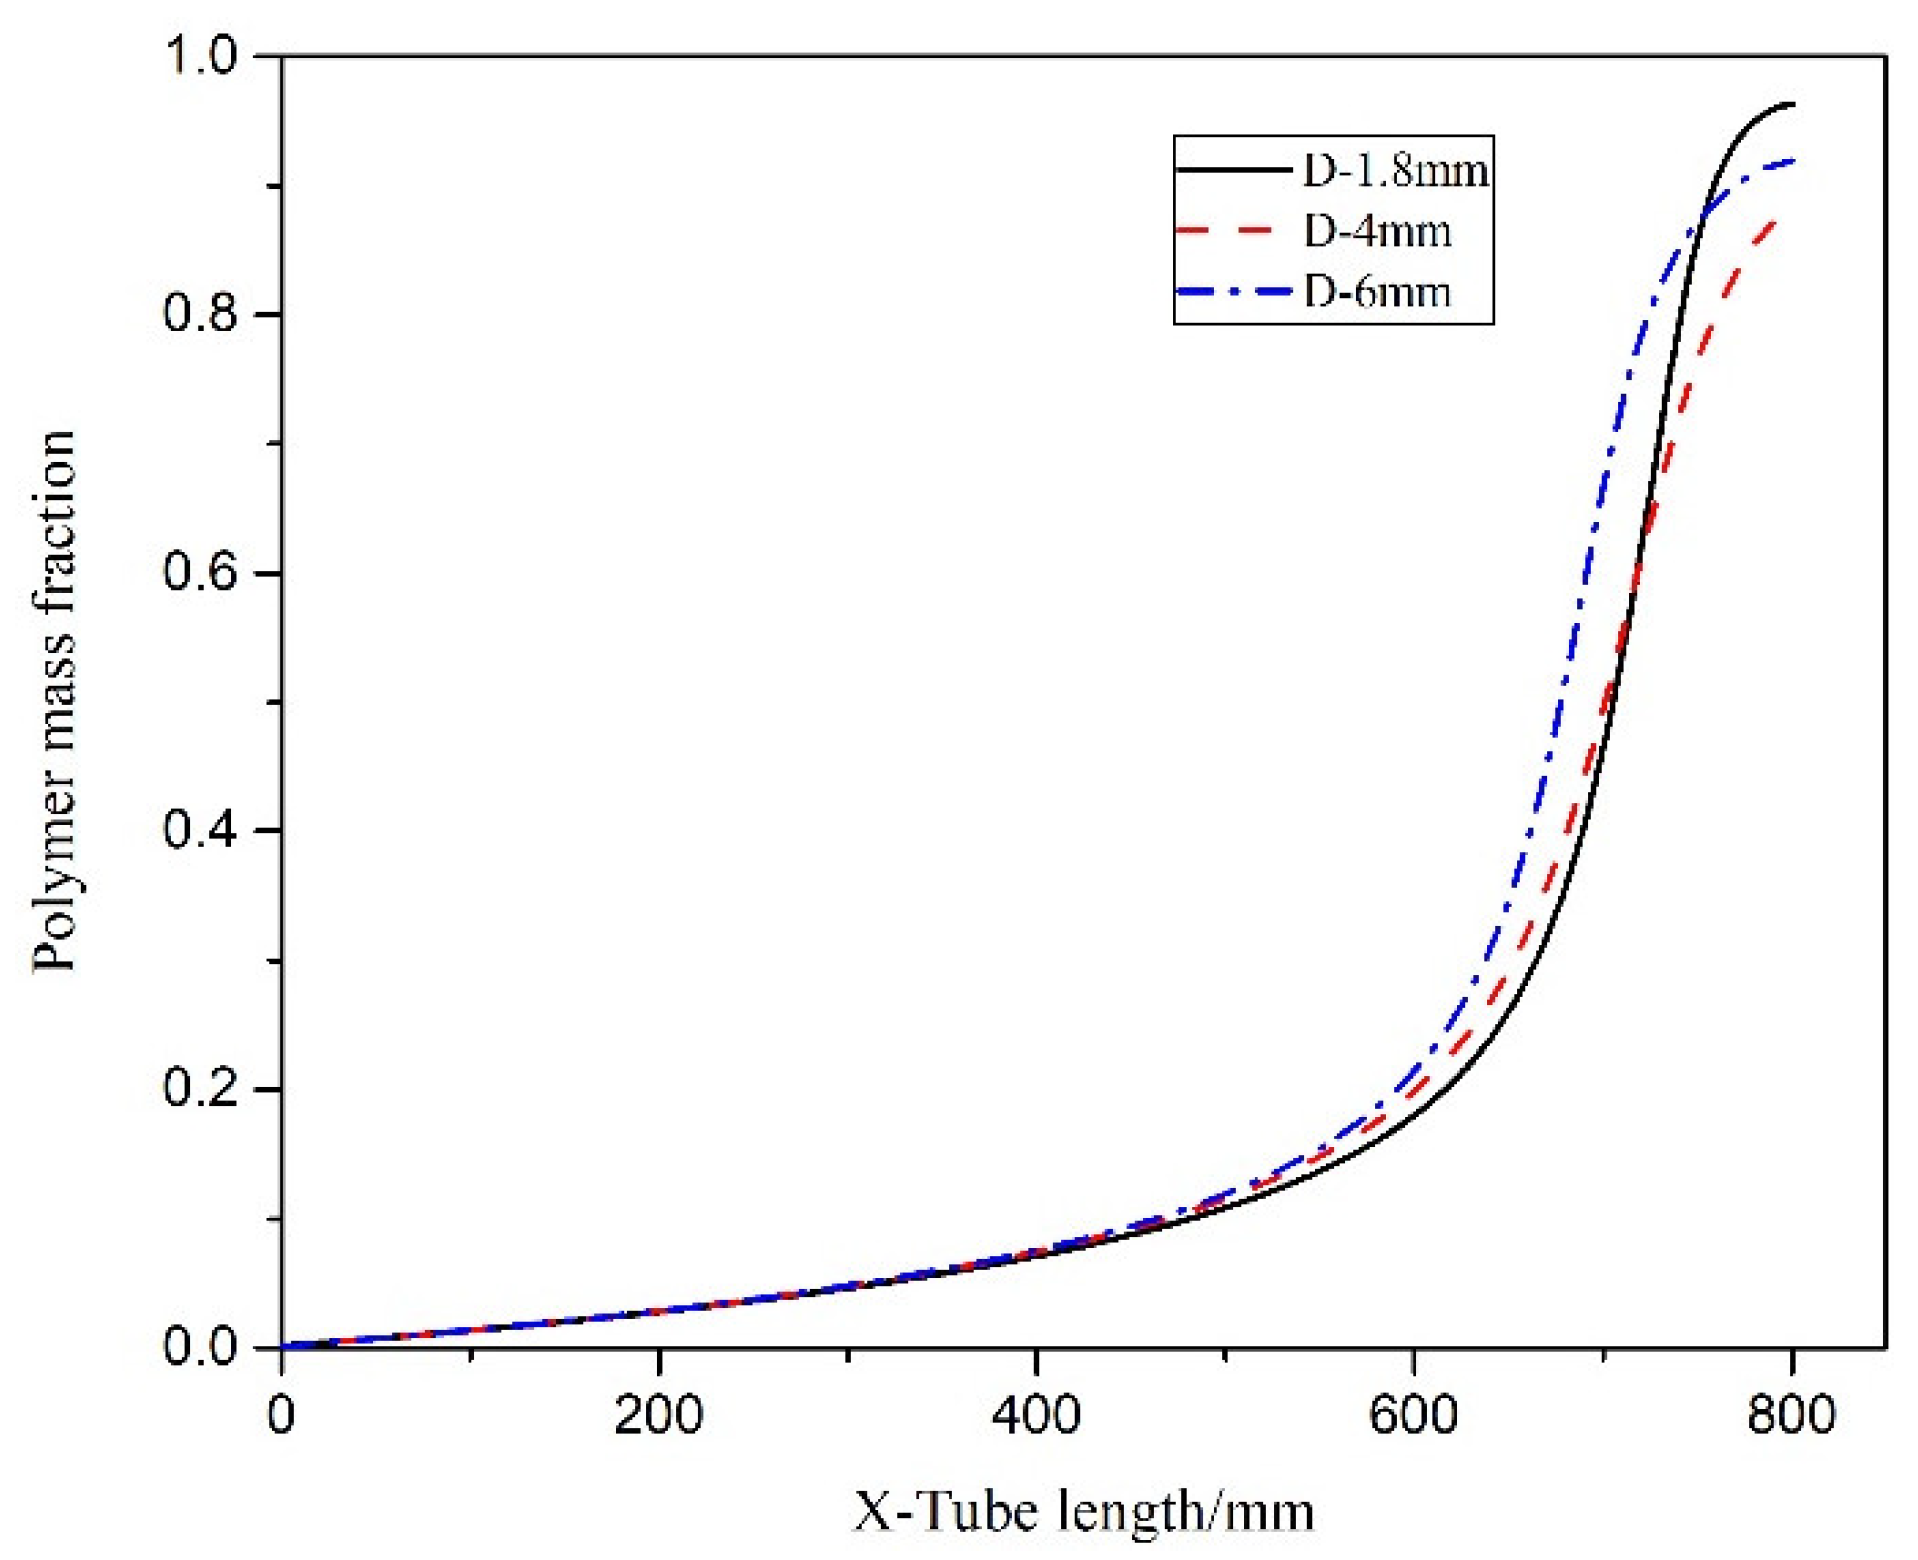
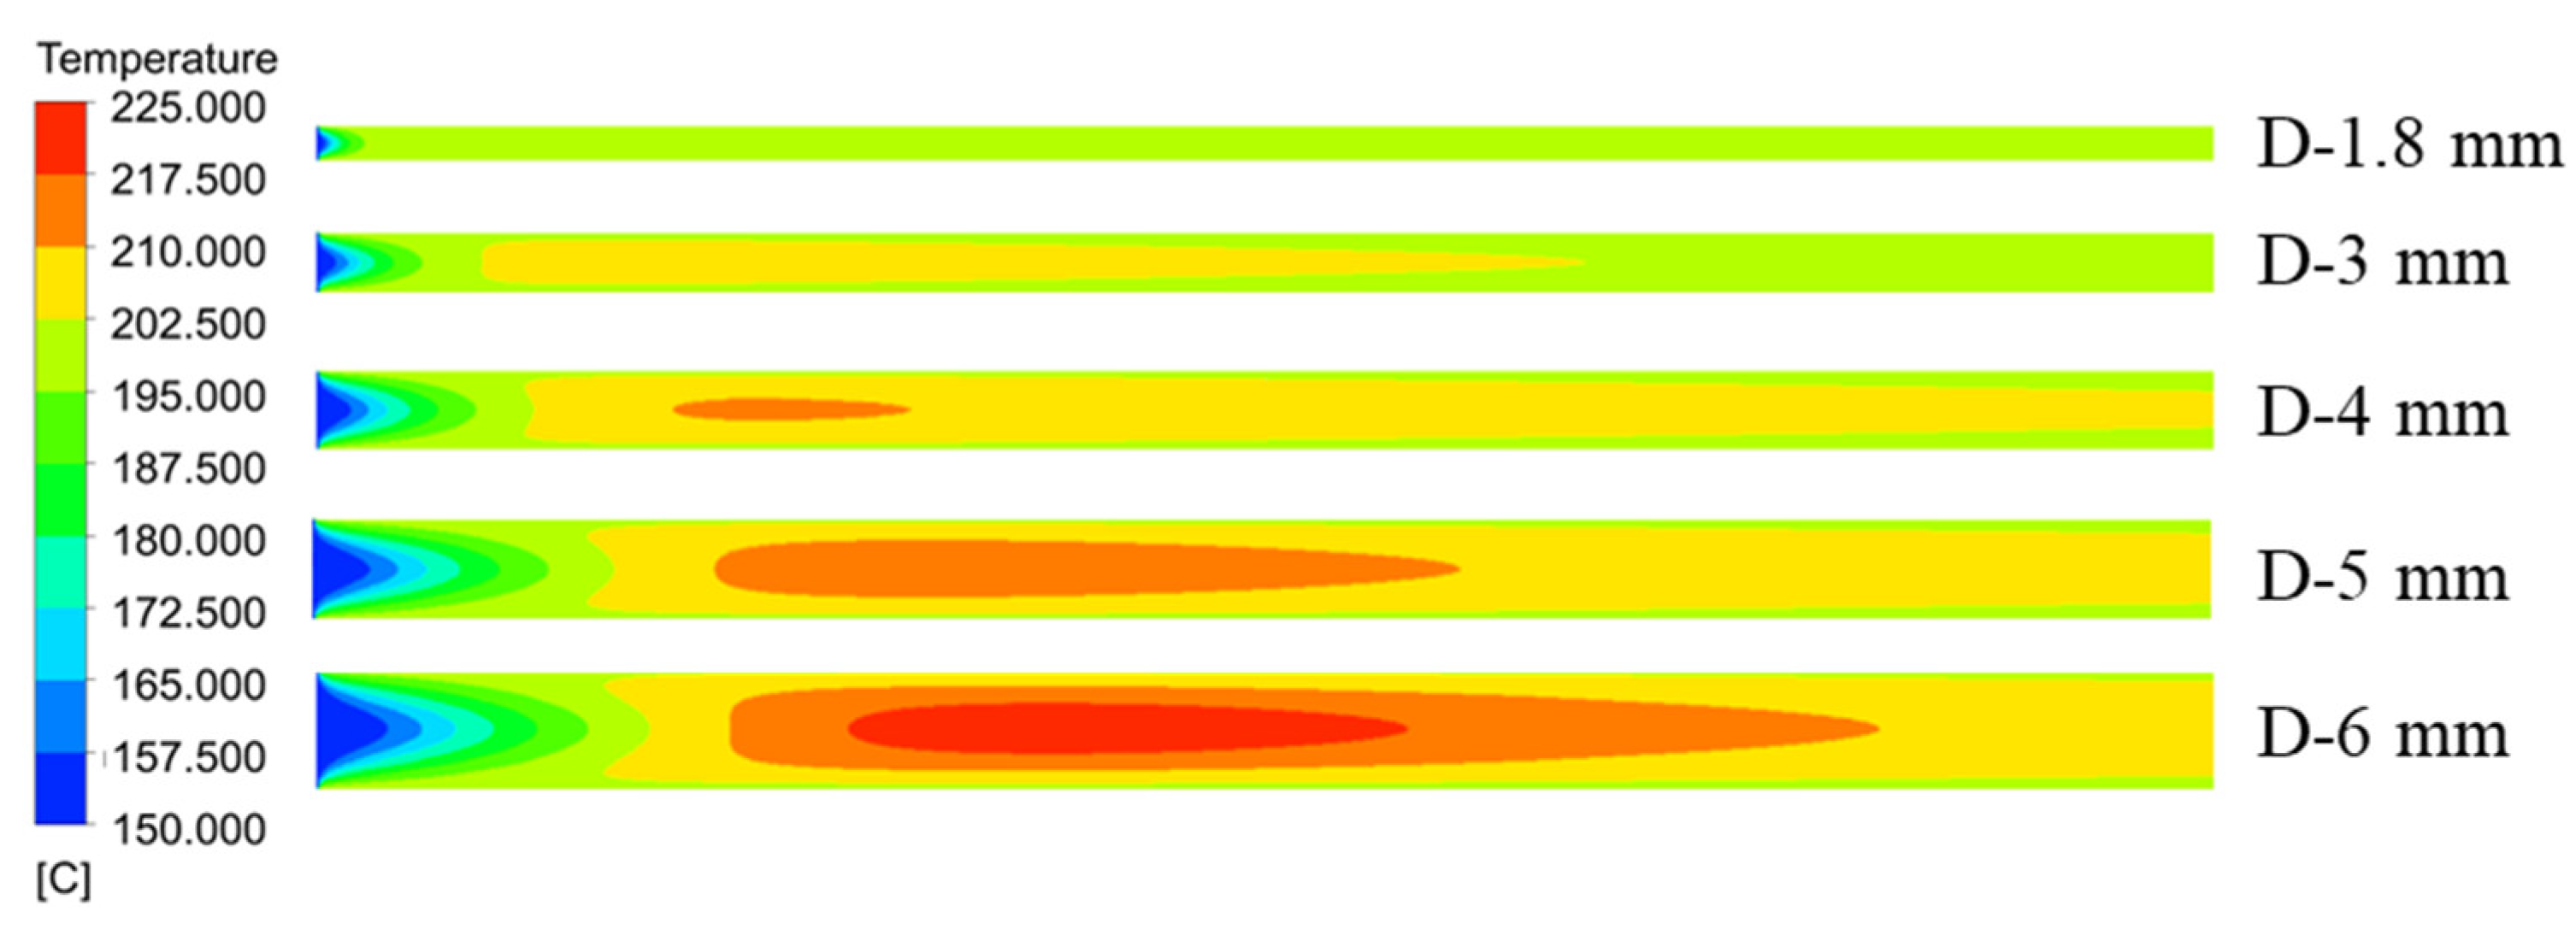
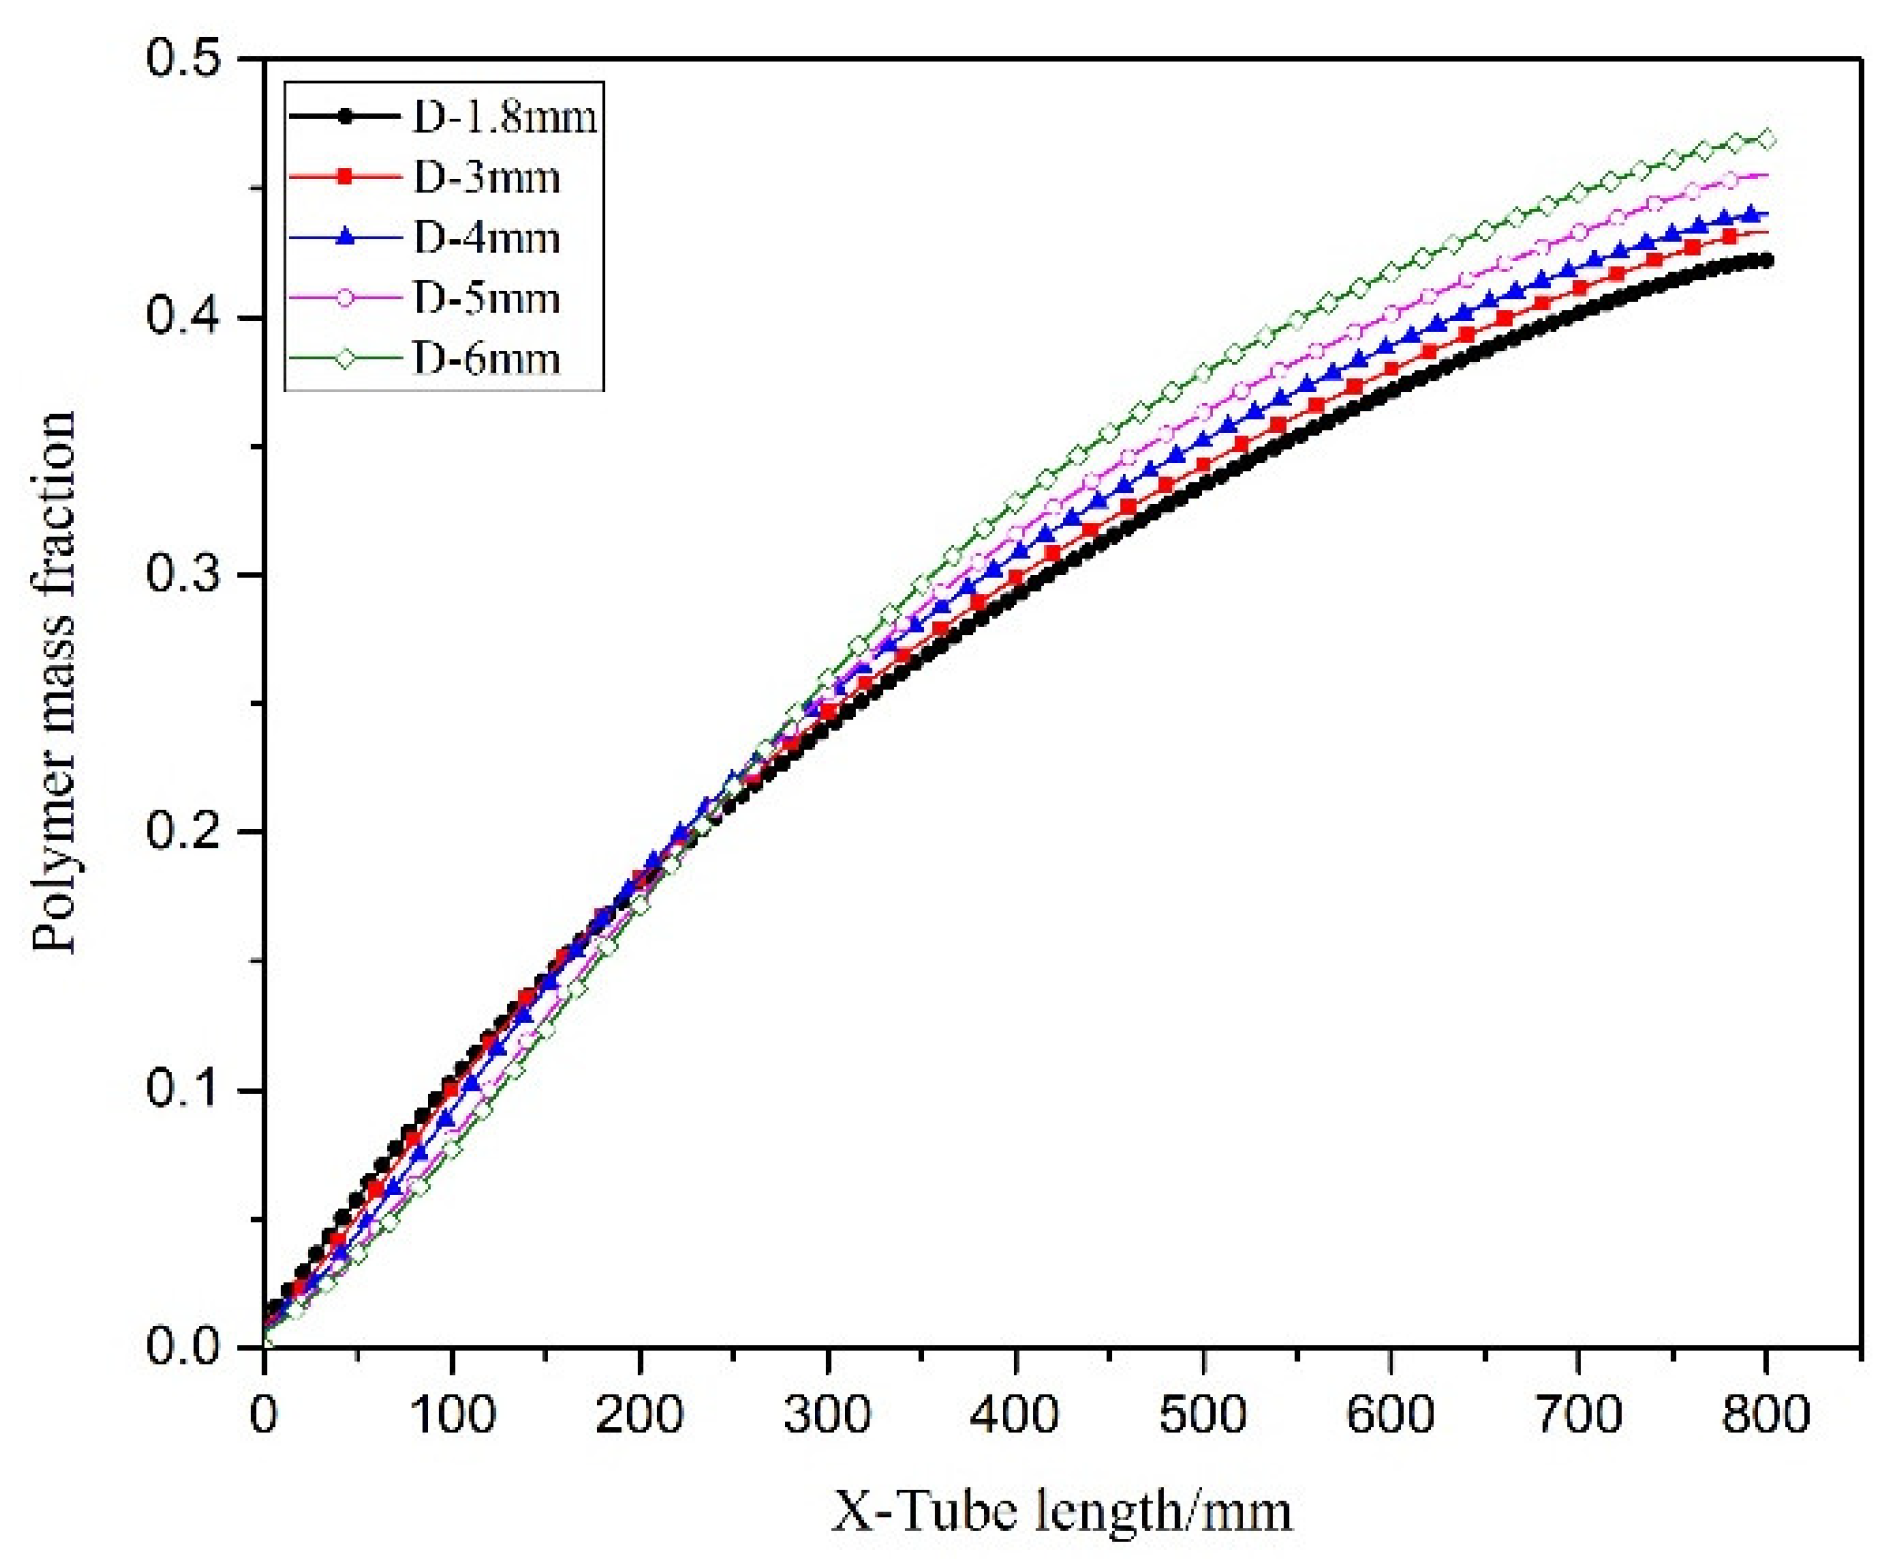
5.4. Effect of Tube Diameter
The simulation conditions are outlined as follows: length 800 mm, inlet velocity 0.002 m/s, an initial temperature of 150 °C, and jacketed temperature 200 °C.
Figure 17 illustrated the temperature distribution of the axial section of the microreactor at different tube diameters. As depicted by the cloud image demonstrates as the tube diameter increased, the temperature distribution in the reactor changed. When the tube diameter was less than 4 mm, the temperature field inside the microreactor was relatively uniform. When the tube diameter was greater than 4 mm, the temperature gradient in the reactor started to increase. A tube diameter of 6 mm induced high-temperature regions in the microreactor. As illustrated in Figure 18, the temperature fluctuation in the microreactor gradually increased as the tube diameter increased. The corresponding conversion rate also increased, as displayed in Figure 19. Larger tube diameters resulted in larger temperature differences in the reactor. The time required to heat the reaction system to the jacket temperature in the microreactors with the tube diameters of 1.8 and 6 mm was 1.5 and 69.5 s, respectively. The maximum temperature difference was 25.33 °C, which could lead to a high risk for hot spots and subsequent runaway reactions (Figure 18).
Figure 17.
Temperature distribution cloud diagram of the axial section of the microreactor at different tube diameters.
Figure 18.
Temperature curve of the central axis in microreactors with different tube diameters.
Figure 19.
Polymer curves of conversion rate in microreactors with different tube diameters.
The diameter of the microreactor tube was determined to be closely related to the heat transfer capacity of the reactor, which increases as the diameter decreased. Therefore, in the inlet section of the microreactor, a larger tube diameter was associated with a reduced heat exchange capacity and a slower rise in the reaction system temperature to the jacket temperature. Figure 20 illustrated the variation curve of system viscosity in microreactors with different pipe diameters. In a certain condition, with the increase of the diameter of the reactor pipe, the viscosity of the reaction system increased gradually and also reached the maximum value. The reason is the same as that in Section 5.3.
Figure 20.
Viscosity curve in microreactor at different pipe diameters.
According to the results obtained using the DIV criterion, reactions for the thermal polymerization of styrene could not run out in the microreactors with tube diameters of 1.8, 3, 4, 5 and 6 mm. Therefore, the microreactors were in a safe state (Figure 21). The larger the microreaction tube size, the greater the possibility of a loss of control.
Figure 21.
DIV diagram of temperature monitoring in microreactor under different pipe diameters.
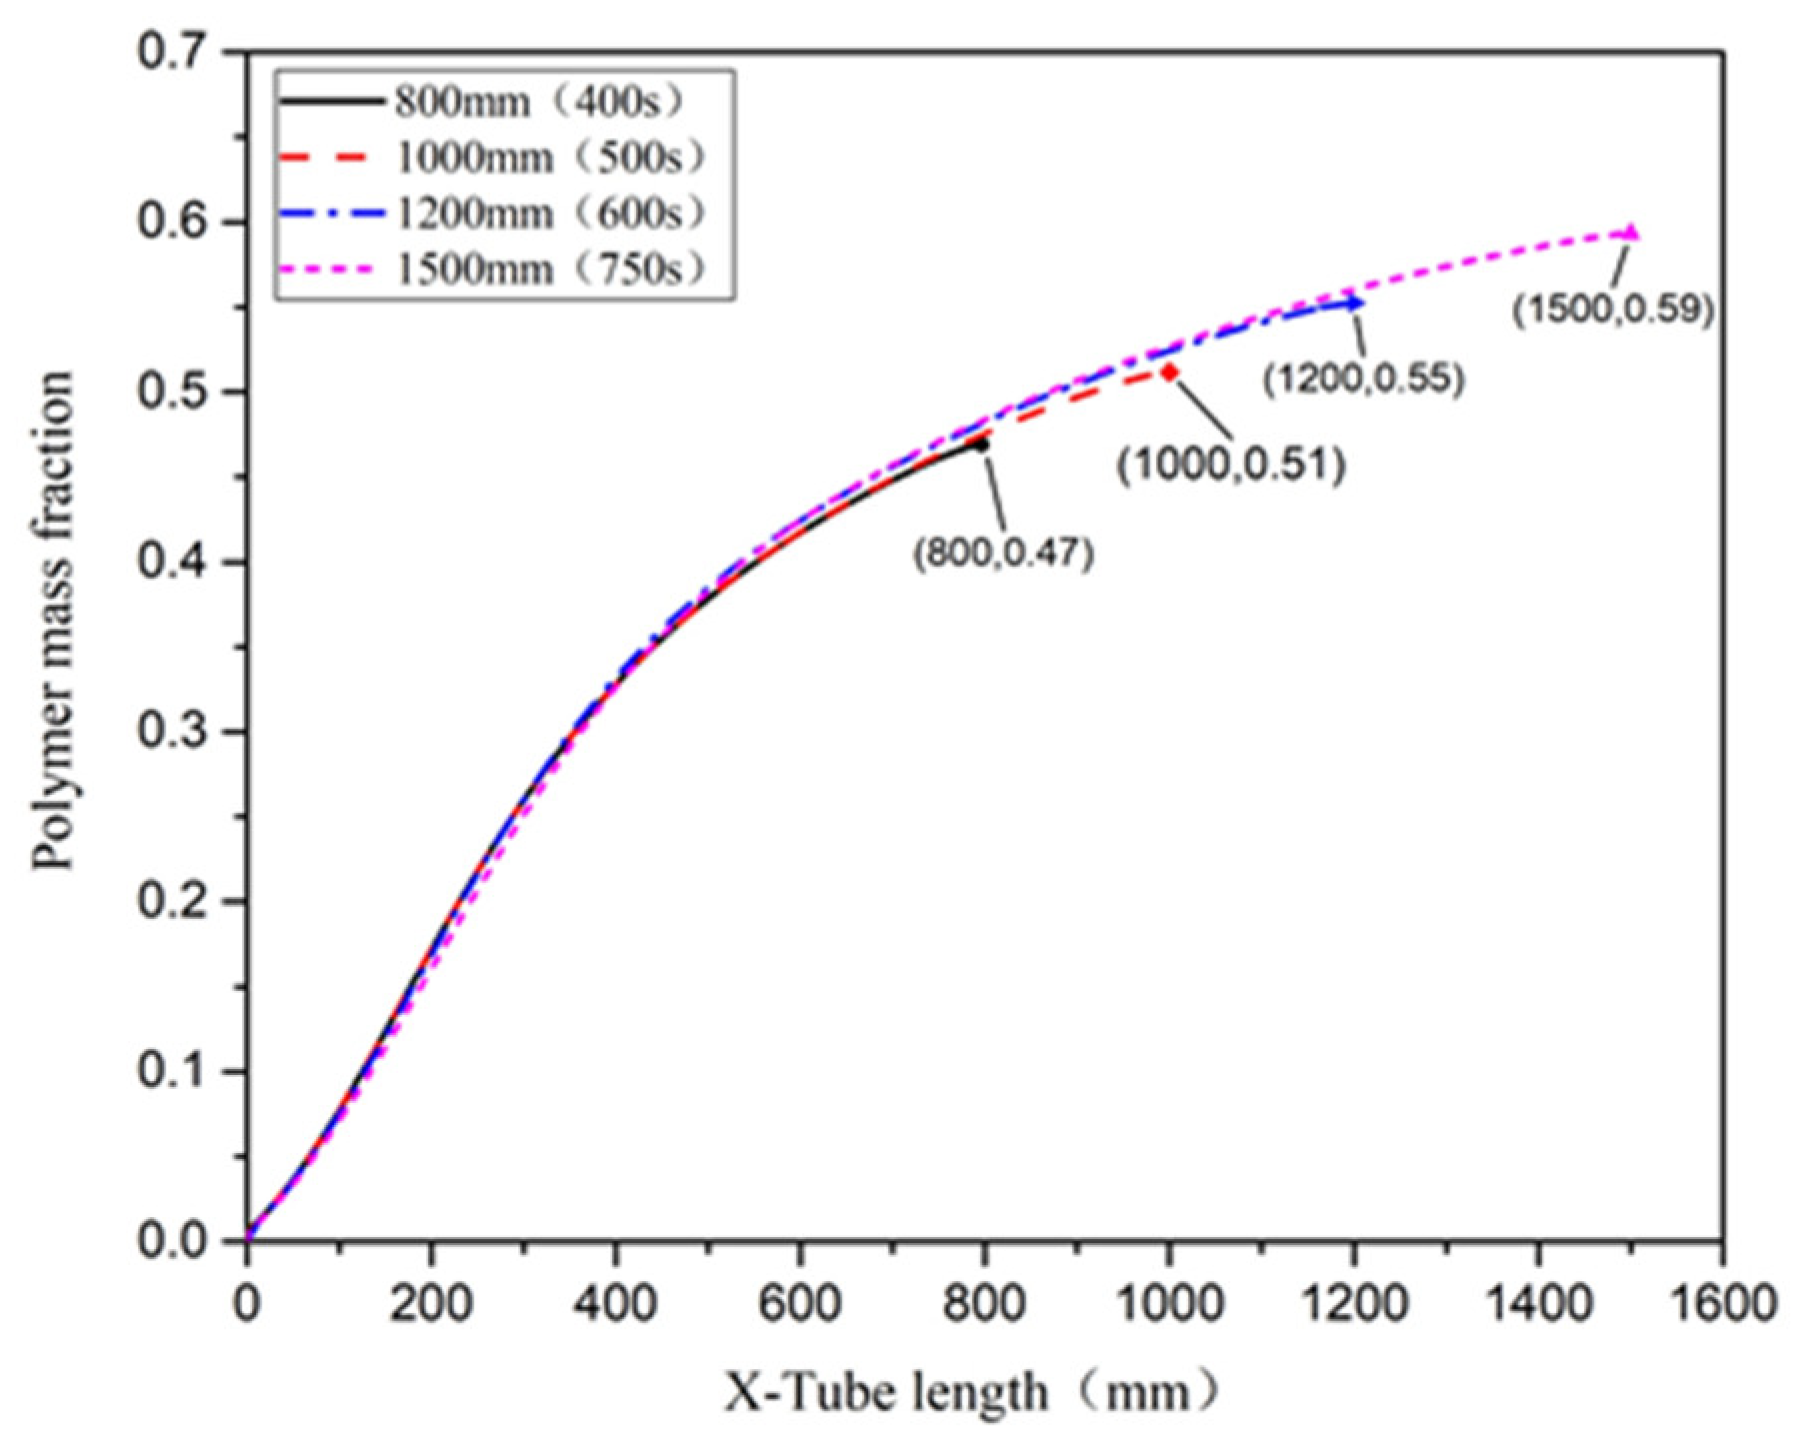
5.5. Effect of Residence Time
The simulation conditions are outlined as follows: diameter 6 mm, inlet velocity 0.002 m/s, an initial temperature of 150 °C, and jacket temperature 200 °C.
Changing the tube length principally affected the residence time. The distribution of temperature in the microreactor was assessed using a local cloud map in the simulation (Figure 22). The cloud map revealed that the temperature distribution in the microreactors was relatively uniform at different residence times, and the temperature gradients did not differ significantly. Figure 23 illustrates the temperature curve on the microreactor axis, which could be used to describe the actual temperature at a certain point in the reaction process. As illustrated in Figure 23, the temperature difference in the reactor when the residence time was 400 s and 500 s could be controlled at 22.3 °C. The temperature difference in the reactor at residence times of 600 s was controlled at 25.3 °C. At a residence time of 750 s, the temperature difference was controlled at 25.8 °C. In the microreactor, the temperature at a residence time of 750 s was higher than that at 400 s and 500 s, but only by 3.5 °C. The temperature at a residence time of 750 s was higher than those at 600 s, but only by 0.3 °C. The conversion rate of styrene increased gradually as the residence time of the reactors increased. As displayed in Figure 24, the conversion rate of styrene at the residence time of 400 s was 0.47. With an increase in the reactor residence time increased from 400 s to 750 s, the conversion rate of styrene in the reactor increased by 0.12 to 0.59. It could be seen from Figure 25 that the viscosity of the whole reaction system does not change significantly with the increase of the residence time.
Figure 22.
Cloud diagram of temperature distribution in the axial section of the microreactor at different tube lengths.
Figure 23.
Temperature curve of the central axis of microreactors with different residence times.
Figure 24.
Polymer conversion of styrene in a microreactor at different residence times.
Figure 25.
Viscosity curve in microreactor at different residence times.
The DIV criterion was used to assess the thermal polymerization reaction of styrene in the microreactor at a residence time of 400, 500, 600 and 750 s, and the results indicated that none of the residence times would result in a runaway event; thus, the polymerization reaction could be performed safely, as illustrated in Figure 26.
Figure 26.
DIV diagram of temperature monitoring in microreactor under different residence times.
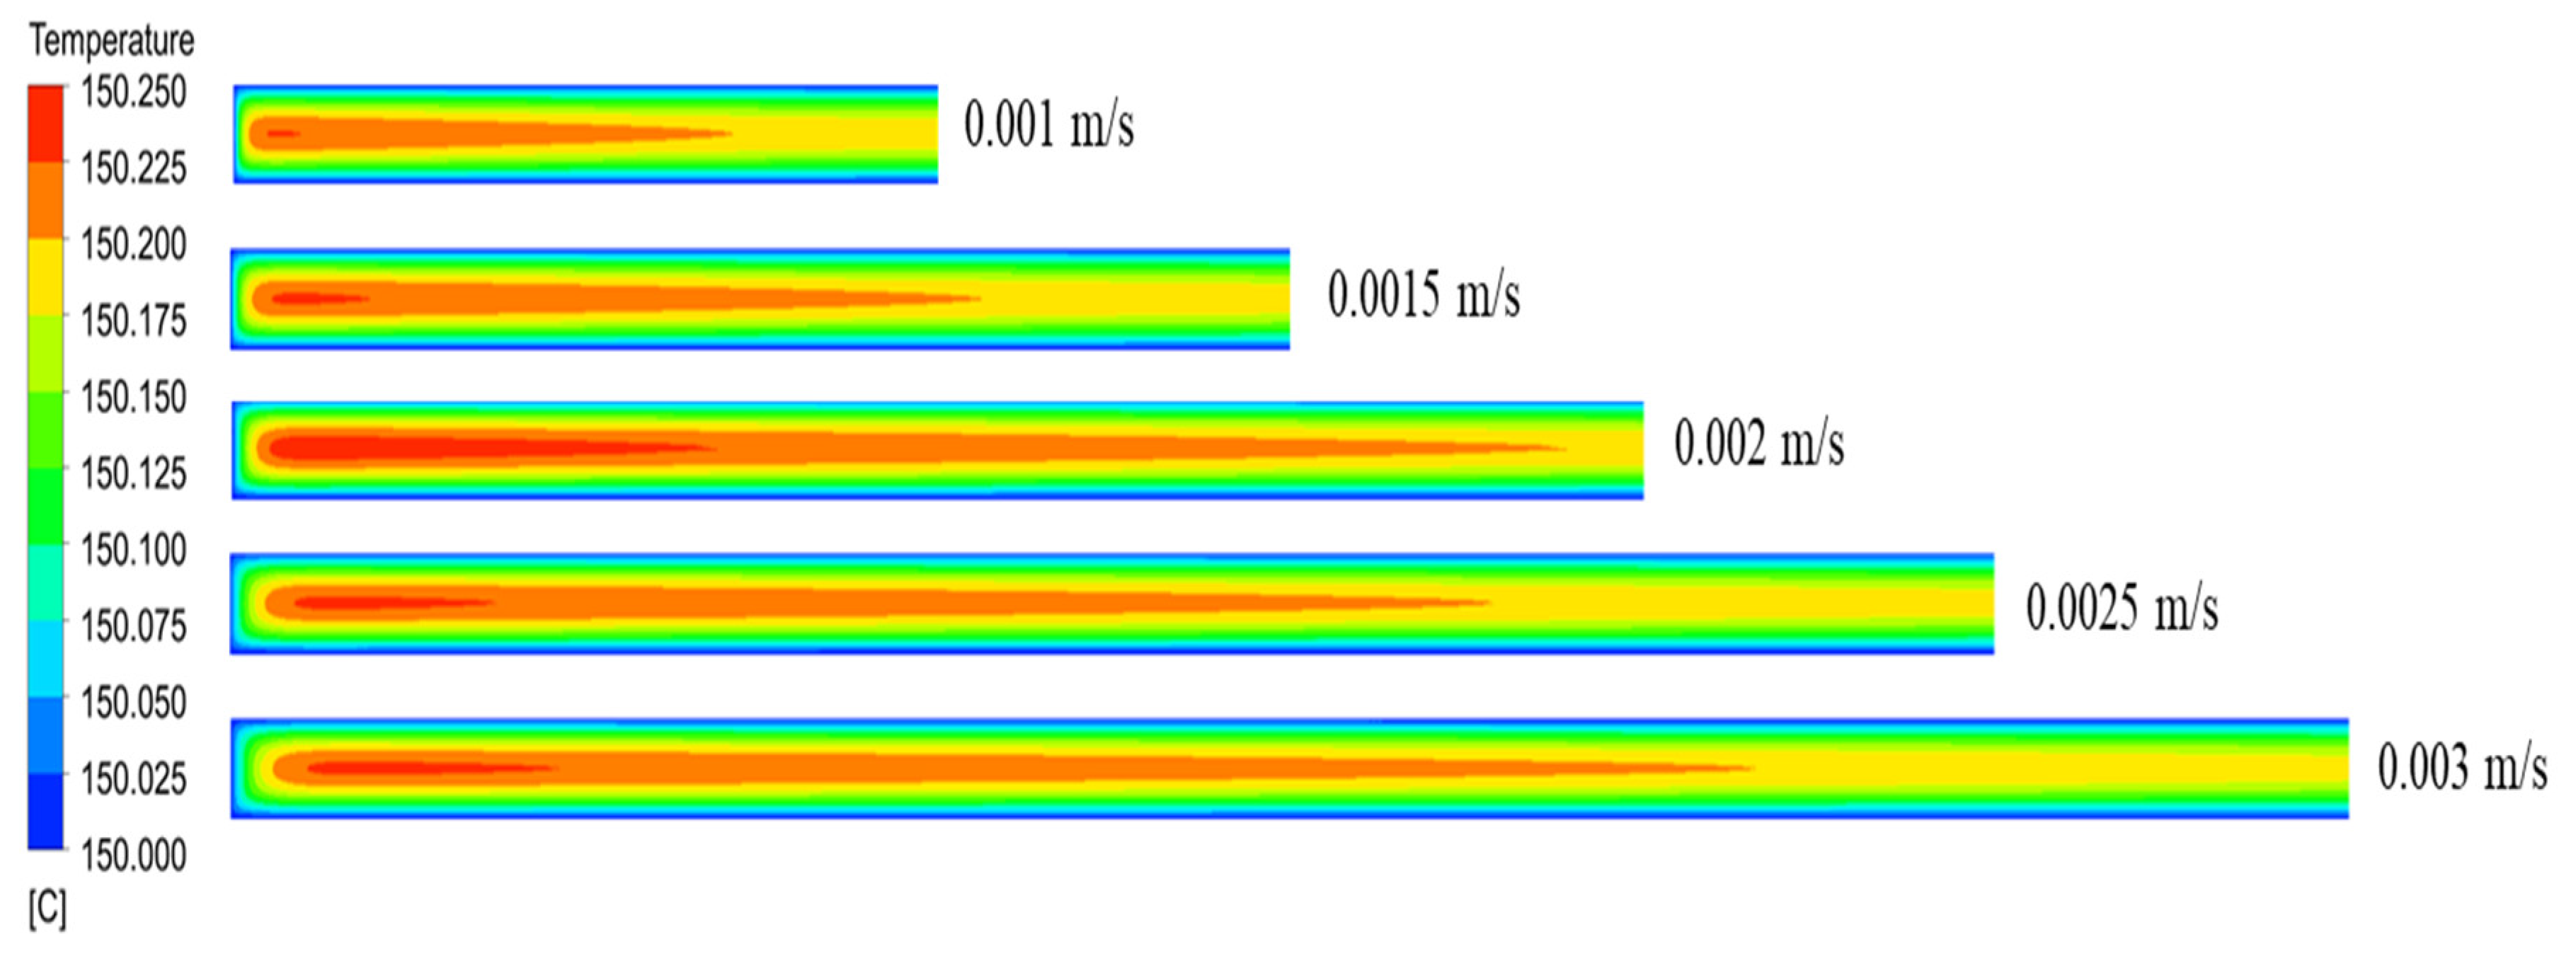
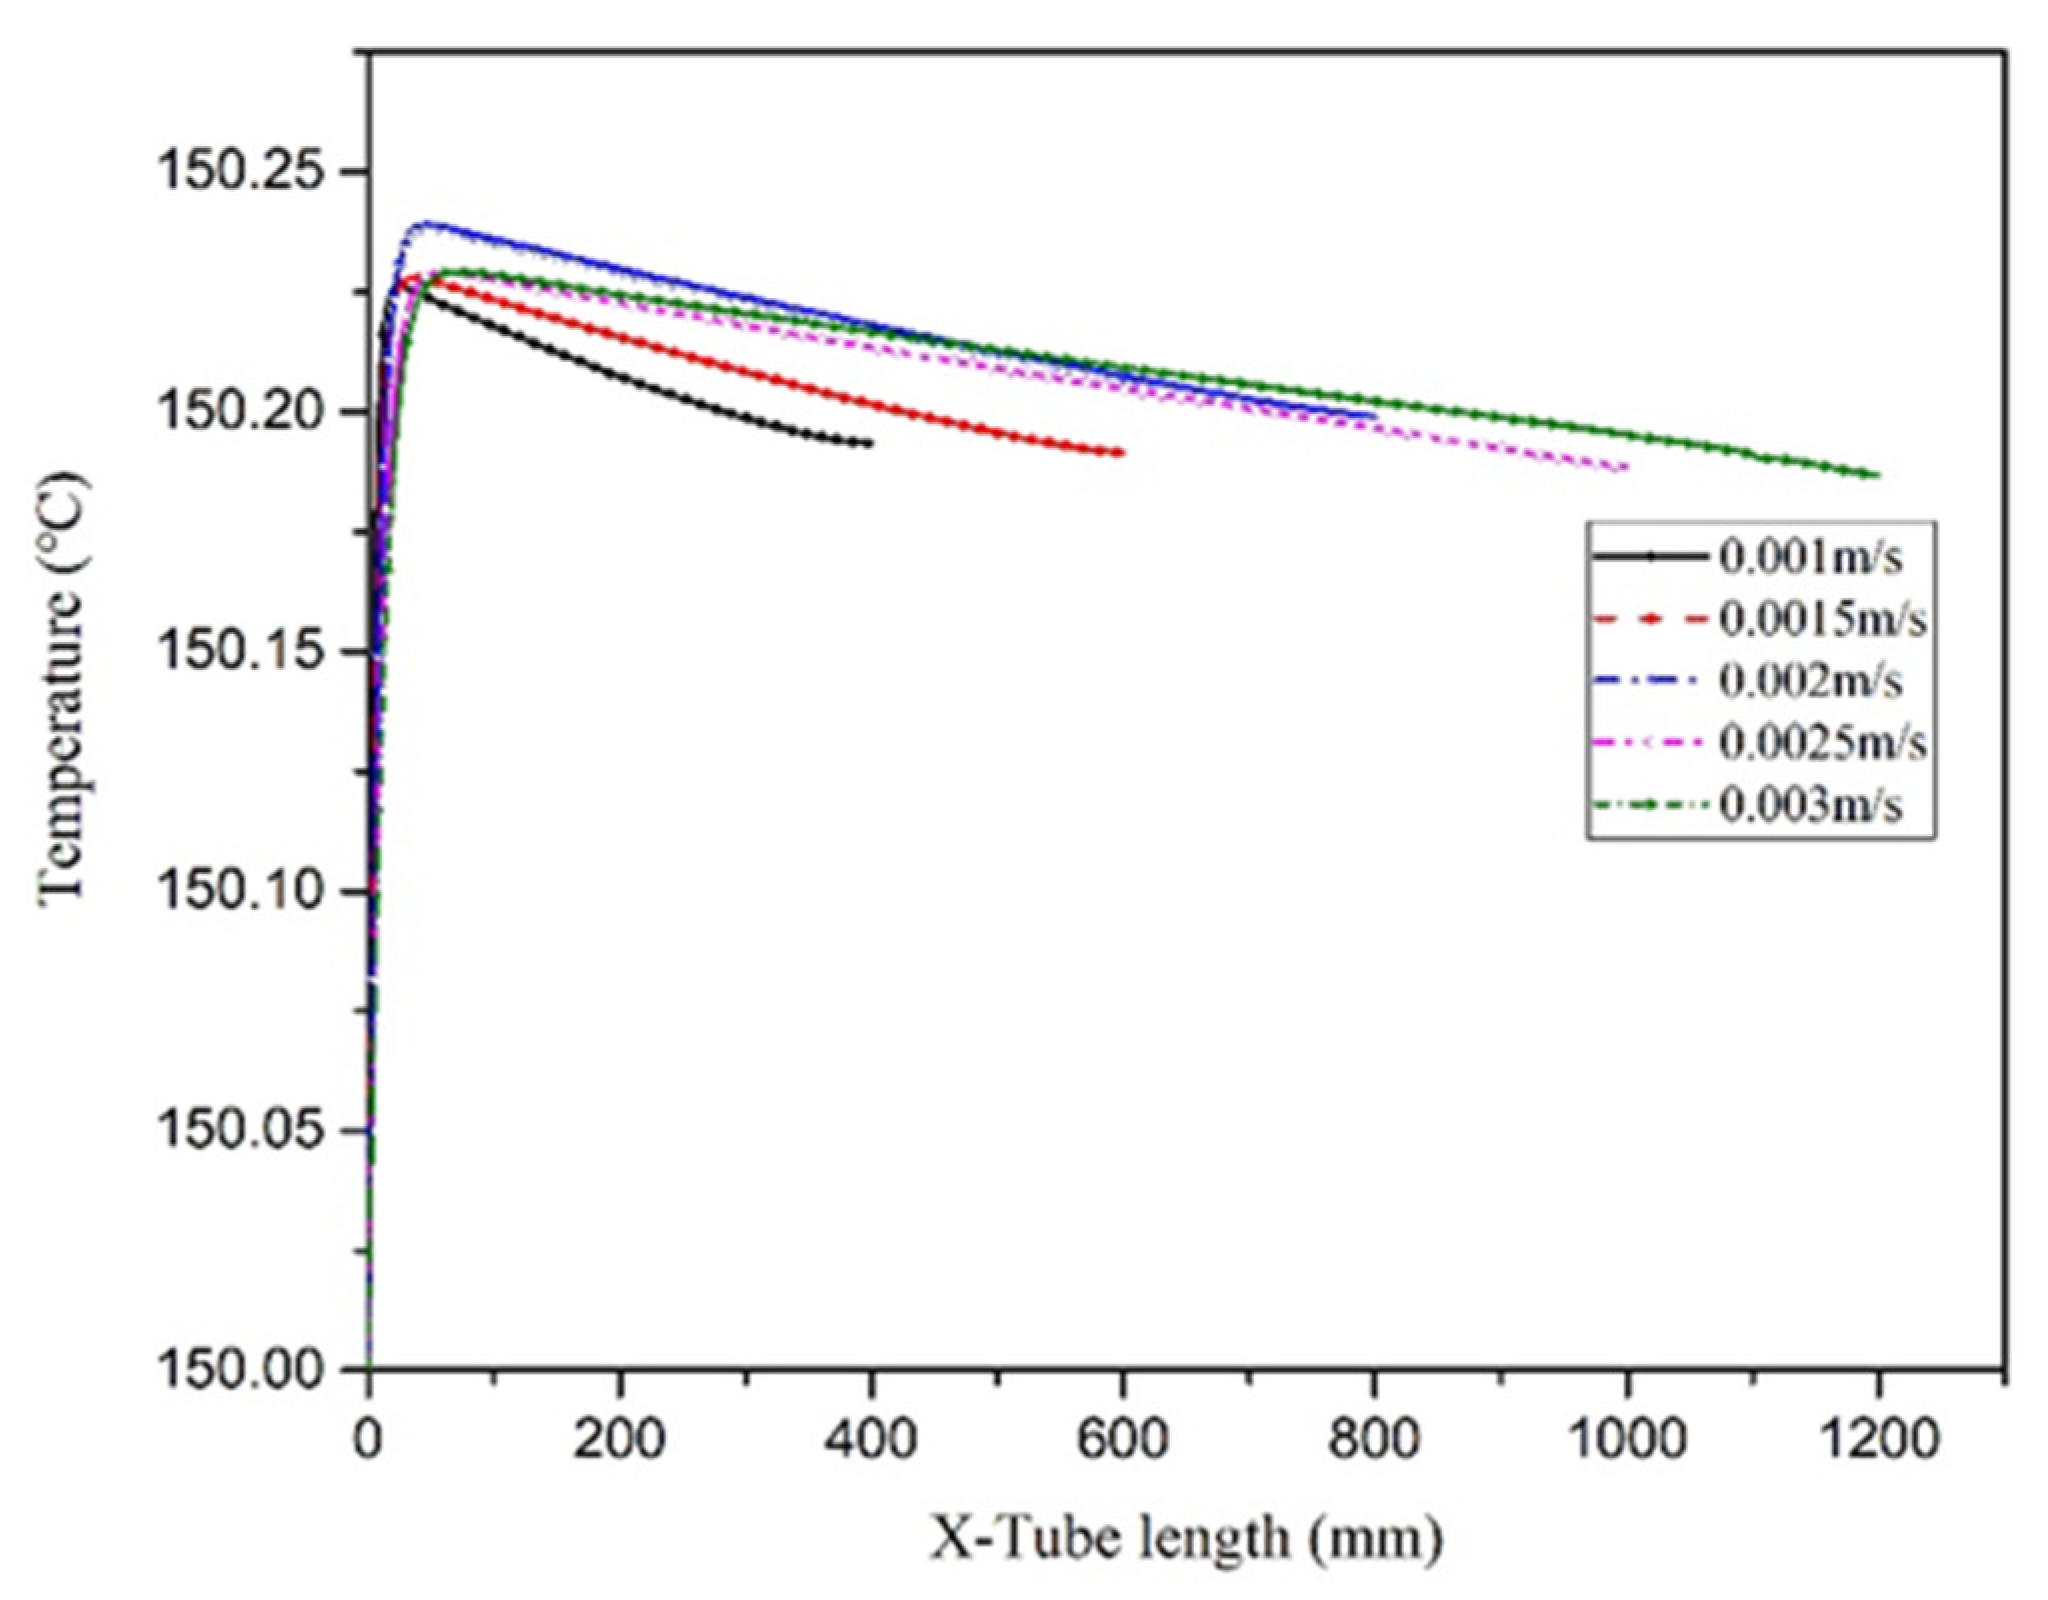
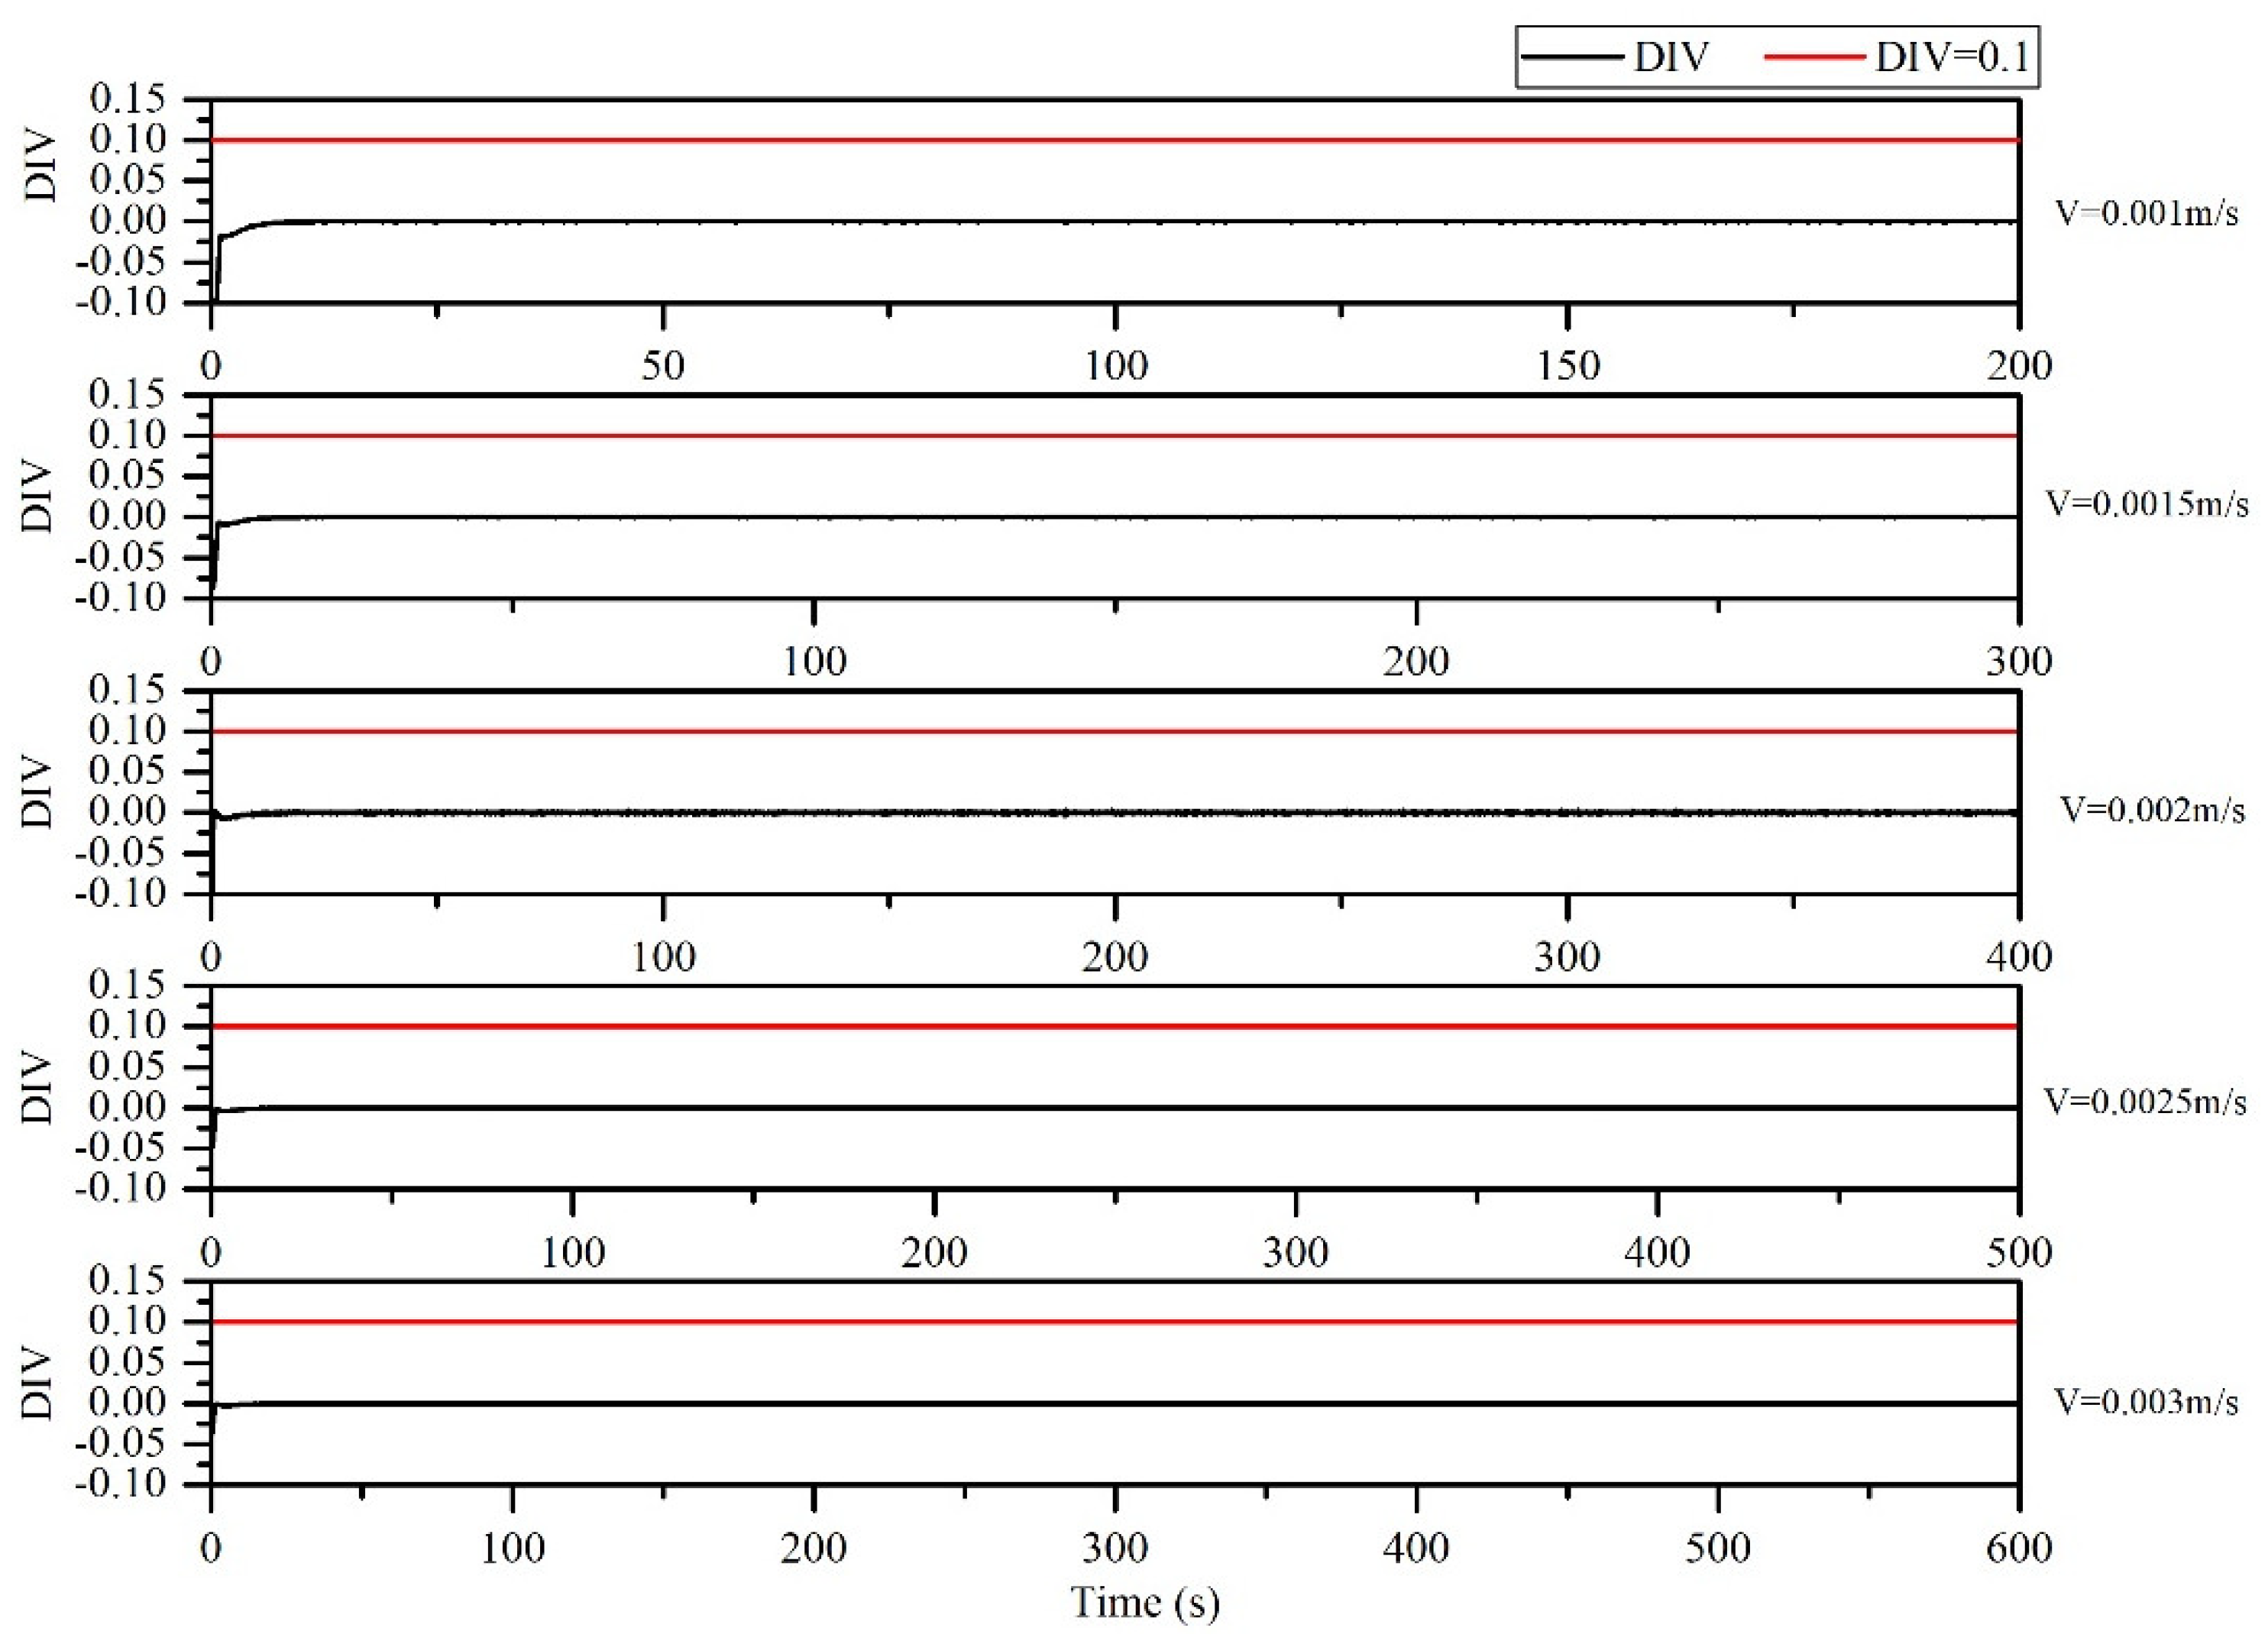
5.6. Effect of Inlet Velocity
The simulation conditions are outlined as follows: diameter 1.8 mm, an initial temperature of 150 °C, jacket temperature 150 °C, reactor length 800 mm.
To ensure that the effects of the inlet flow rate on the temperature field distribution in the microreactor were studied under the same residence time conditions. The length of the microreactor was changed to ensure the same residence time. The temperature distribution cloud map (Figure 27) revealed that because the microreactor had a small tube diameter and could effectively conduct heat transfer, the temperature distribution in the microreactor was relatively uniform when the same residence time was uniform. As illustrated in Figure 28, the temperature difference inside the reactor was relatively small. The inlet flow rate of 0.002 m/s was associated with the largest temperature difference inside the reactor, which was only 0.24 °C. The temperature difference between the interior of the microreactor and the jacket was small, with no local hot spots formed. As illustrated in Figure 29, with the increase of inlet velocity, the viscosity of the system also increased gradually. Due to the low viscosity of the system, it had little influence on the flow and heat transfer of the reaction system.
Figure 27.
Cloud diagram of temperature distribution in the axial section of the microreactor at different inlet flow rates.
Figure 28.
Temperature curves of the central axis at different inlet flow rates.
Figure 29.
Viscosity curve in microreactor at different inlet velocities.
According to the DIV criterion, the inlet flow rates of 0.001, 0.0015, 0.002, 0.0025 and 0.003 m/s in the microreactor would not cause the reaction to spiral out of control (Figure 30). The change in the inlet flow rate did not affect the thermal hazard of the thermal polymerization of styrene in the microreactor.
Figure 30.
DIV diagram of temperature monitoring in microreactor under different inlet flow rates.
6. Conclusions
1. The CFD model established in this study could accurately predict the exothermic behavior of a microreactor, which could be helpful in improving the essential safety design of reactors and provide a reference for assessing the risk of loss of control in microreactors;
2. The established CFD coupling model was applied to a batch polymerization reactor and microreactor. The thermal polymerization of styrene in the reactor was simulated to obtain the temperature, conversion rate and other data. The results demonstrate that the thermal polymerization of styrene in the reactor was out of control at 537.5 s, but the thermal polymerization of styrene in the microreactor operated smoothly without loss of control. The microreactor may have superior control of the polymerization reaction compared with the batch reactor;
3. Based on the simulation calculation of the viscosity in the microreactor, it was found that the jacket temperature had a great influence on the viscosity of the system. When the jacket temperature was greater than 190 °C, the viscosity of the system could be reduced, which could effectively improve the flow and heat transfer; The inlet velocity, residence time and pipe diameter had little influence on viscosity;
4. The combination of the DIV criterion and CFD coupling model could be used as an accurate warning of loss of control, which can provide a reference for the design optimization of microreactors. According to the divergence criterion (DIV), when the microreactor jacket cooling failed, the thermal runaway of the polymerization occurred for microreactors with different tube diameters. When the jacket cooling was normal, the diameter of the microreactor had a significant influence on the distribution of the inside temperature field. When the microreactor tube diameter was 6 mm, the temperature difference in the microreactor reached 25.33 °C, and the local high-temperature could cause the thermal runaway. The microreactor tube diameter size could also affect the conversion of styrene. According to the DIV criteria, factors such as jacket temperature (150, 170, 180, 190, 200 °C), residence time (400, 500, 600, 750 s), and inlet flow (0.001, 0.015, 0.002, 0.025, 0.003 m/s) rate had little effect on the thermal hazard of styrene thermal polymerization in the microreactor and would not cause thermal runaway. Although microreactors have more advantages than other reactors, factors such as jacket cooling failure and tube diameter are associated with thermal safety problems. Therefore, identifying the optimal structure and operation parameters of the microreactors is critical.
Author Contributions
Conceptualization, L.N. and J.J.; methodology, L.N. and K.Z.; software, J.W. and J.C.; validation, J.W. and L.N.; formal analysis, J.W. and L.N.; investigation, J.W. and L.N.; resources, L.N. and J.J.; data curation, J.W. and L.N.; writing—original draft preparation, J.W.; writing—review and editing, L.N. and J.J.; visualization, J.W. and J.C.; supervision, L.N. and J.J.; project administration, L.N. and J.J.; funding acquisition, L.N.; All authors have read and agreed to the published version of the manuscript.
Funding
The authors are grateful for the support given by the National Natural Science Foundation of China (No. 51904157, 21436006), Natural Science Foundation of Jiangsu Province (NO. BK20171004), and China Postdoctoral Science Foundation (NO. 2018M642239).
Conflicts of Interest
The authors declare no conflict of interest
Nomenclature
| Sm | Quality source |
| τij | Stress tensor |
| Cp | Specific heat capacity, J·g−1k−1 |
| Φ | System variable |
| Ρ | Density, kg·m−3 |
| Ui | Fluid velocity along x, y, and z directions, m/s |
| ГΦ | Diffusion coefficient |
| SΦ | Source term |
| Kth Kp Ktc | Reaction constant |
| Φ | Conversion rate |
| Ath Ap Atc | Pre-exponential factor, m3·kmol−1 s−1 |
| Eth Ep Etc | Activation energy, J·mol−1 |
| Wm | Mass fraction |
| Mn | Molecular mass |
| R R˙ RP | Molar gas constantFree radicalThe styrene polymerization rate |
| ΔH | Reaction enthalpy |
| Μ | Dynamic viscosity, Pa·s |
| Γ | Shear rate |
| μ0 | Zero shear viscosity |
| Mwp | Average molecular weight |
| T | Time |
| [M] | Styrene concentration |
| Wp | Polymer mass fraction |
| Re | Reynolds number, |
| N | Rotation speed of the stirring blade, rad/s |
| K | Fluid heat transfer coefficient |
References
- Ni, L.; Cui, J.W.; Jiang, J.C.; Pan, Y.; Wu, H.; Shu, C.M.; Wang, Z.R.; Mou, S.J.; Shi, N. Runaway inhibition of styrene polymerization: A simulation study by chaos divergence theory. Process. Saf. Environ. 2020, 135, 294–300. [Google Scholar] [CrossRef]
- Balasubramanian, S.G.; Louvar, J.F. Study of major accidents and lessons learned. Process. Saf. Prog. 2002, 21, 237–244. [Google Scholar] [CrossRef]
- Luo, K.M.; Chang, J.G.; Lin, S.H.; Chang, C.T.; Yeh, T.F.; Hu, K.H.; Kao, C.S. The criterion of critical runaway and stable temperatures in cumene hydroperoxide reaction. J. Loss Prevent. Proc. 2001, 14, 229–239. [Google Scholar] [CrossRef]
- Kim, J.Y.; Laurence, R.L. The mixing effect on the free radical MMA solution polymerization. Korean J. Chem. Eng. 1998, 15, 273–286. [Google Scholar] [CrossRef]
- Luo, G.S.; Wang, K.; Wang, P.J.; Lü, Y.C. Advances in polymer synthesis in microreactors. CIESC J. 2014, 65, 2563–2573. (In Chinese) [Google Scholar]
- Wilms, D.; Klos, J.; Frey, H. Microstructured reactors for polymer synthesis: A renaissance of continuous flow processes for tailor-made macromolecules? Macromol. Chem. Phys. 2008, 209, 343–356. [Google Scholar] [CrossRef]
- Larry, L.; Werner, G.K. Optimization of on-line peptide mapping by capillary zone electrophoresis. Anal. Chem. 1994, 66, 4400–4407. [Google Scholar]
- Sato, K.; Tokeshi, M.; Kitamori, T.; Sawada, T. Integration of Flow Injection Analysis and Zeptomole-Level Detection of the Fe(II)-o-Phenanthroline Complex. Anal. Sci. 1999, 15, 641–645. [Google Scholar] [CrossRef][Green Version]
- Zhao, Y.C.; Chen, G.W.; Yuan, Q. Liquid-liquid two-phase mass transfer in the T-junction microchannels. AICHE J. 2007, 53, 3042–3053. [Google Scholar] [CrossRef]
- Choe, J.; Kwon, Y.; Kim, Y.; Song, H.S.; Song, K.H. Micromixer as a Continuous Flow Reactor for the Synthesis of a Pharmaceutical Intermediate. Korean. J. Chem. Eng. 2003, 20, 268–272. [Google Scholar] [CrossRef]
- Akkarawatkhoositha, N.; Srichaib, A.; Kaewchadac, A.; Ngamcharussrivichaid, C.; Jareea, A. Evaluation on safety and energy requirement of biodiesel production: Conventional system and microreactors. Process. Saf. Environ. 2019, 132, 294–302. [Google Scholar] [CrossRef]
- Nagaki, A.; Yoshida, J. Controlled polymerization in flow microreactor systems. In Controlled Polymerization and Polymeric Structures; Springer: Cham, Switzerland, 2012; Volume 259, pp. 1–50. [Google Scholar]
- Iwasaki, T.; Kawano, N.; Yoshina, J.I. Radical Polymerization Using Microflow System: Numbering-up of Microreactors and Continuous Operation. Org. Process. Res. Dev. 2006, 10, 1126–1131. [Google Scholar] [CrossRef]
- Méndez-Portillo, L.S.; Dubois, C.; Tanguy, P.A. Free-radical polymerization of styrene using a split-and-recombination (SAR) and multilamination microreactors. Chem. Eng. J. 2014, 256, 212–221. [Google Scholar] [CrossRef]
- Yadav, A.K.; Cal, J.C.D.L.; Barandiaran, M.J. Feasibility of Tubular Microreactors for Emulsion Polymerization. Macromol. React. Eng. 2011, 5, 69–77. [Google Scholar] [CrossRef]
- Mandal, M.M.; Serra, C.; Hoarau, Y.; Nigam, K.D.P. Numerical modeling of poly - styrene synthesis in coiled flow inverter. Microfluid. Nanofluid. 2011, 10, 415–423. [Google Scholar] [CrossRef]
- Jiang, J.C.; Wu, H.; Ni, L.; Zhou, M.Y. CFD simulation to study batch reactor thermal runaway behavior based on esterification reaction. Process. Saf. Environ. 2018, 120, 87–96. [Google Scholar] [CrossRef]
- Solevmani, A.; Kolehmainen, E.; Tueunen, I. Numerical and experimental investigations of liquid mixing in T-type micromixers. Chem. Eng. J. 2011, 135, S219–S228. [Google Scholar] [CrossRef]
- Wendt, J.F. Computational Fluid Dynamics; Springer: Berlin/Heidelberg, Germany, 1992. [Google Scholar]
- Zhang, J.; Ma, Y.Y.; Dong, Z.; Wang, S.Y.; Chen, L.P.; Chen, W.H. Numerical simulation to study and optimize the significant hidden temperature gradients in adiabatic tests. J. Therm. Anal. Calorim. 2020, 20, 1–7. [Google Scholar] [CrossRef]
- Hui, A.W.; Hamielec, A.E. Thermal polymerization of styrene at high conversions and temperatures. An experimental study. J. Appl. Polym. Sci. 1972, 16, 749–769. [Google Scholar] [CrossRef]
- Patel, H.; Ein-Mozaffari, F.; Dhib, R. CFD analysis of mixing in thermal polymerization of styrene. Comput. Chem. Eng. 2010, 34, 421–429. [Google Scholar] [CrossRef]
- Gao, J.; Penlidis, A. A comprehensive simulator/database package for reviewing free-radical homopolymerizations. J. Macromol. Sci. C 1996, 36, 199–404. [Google Scholar] [CrossRef]
- Villalobos, M.A.; Hamielec, A.E.; Wood, P.E. Bulk and suspension polymeri—Zation of styrene in the presence of n-pentane. An evaluation of monofunctional and bifunctional initiation. J. Appl. Polym. Sci. 1993, 50, 327–343. [Google Scholar] [CrossRef]
- Dhib, R.; Gao, J.; Penlidis, A. Simulation of free radical bulk/solution homopoly-merization using Mono-and Bi-functional initiators. Polym. React. Eng. 2000, 8, 299–464. [Google Scholar] [CrossRef]
- Kim, D.M.; Nauman, E.B. Simulation viscosity of polystyrene at conditions applicable to commercial manufacturing processes. J. Chem. Eng. Data. 1992, 37, 427–432. [Google Scholar] [CrossRef]
- Soliman, M.A.; Aljarboa, T.; Alahmad, M. Simulation of bulk free radical polymerization of styrene in tubular reactors. J. Polym. Eng. Sci. 1994, 34, 1464–1470. [Google Scholar] [CrossRef]
- Jiang, J.J.; Yang, J.Z.; Jiang, J.C.; Pan, Y.; Yu, Y.; Zhou, D. Numerical simulation of thermal runaway and inhibition process on the thermal polymerization of styrene. J. Loss. Prevent. Proc. 2016, 44, 465–473. [Google Scholar] [CrossRef]
- Kim, S. The effect of header shapes on the flow distribution in a manifold for electronic packaging applications. Int. Commun. Heat. Mass. 1995, 22, 329–341. [Google Scholar] [CrossRef]
- Mala, G.H.; Li, D.Q. Flow characteristics of water in microtubes. Int. J. Heat. Fluid. Fl. 1999, 20, 142–148. [Google Scholar] [CrossRef]
- Lyondell Chemical Company. Product Safety Bulletin Styrene Monomer; Lyondell Chemical Company: Houston, TX, USA, 2007; pp. 6–7. [Google Scholar]
- Launder, B.E.; Spalding, D.B. The numerical computation of turbulent flows. Comput. Method. Appl. M 1974, 3, 269–289. [Google Scholar] [CrossRef]
- Morbidelli, M.; Varma, A. A generalized criterion for parametric sensitivity: Application to a pseudohomogeneous tubular reactor with consecutive or parallel reactions. Chem. Eng. Sci. 1989, 44, 1675–1696. [Google Scholar] [CrossRef]
- Strozzi, F.; Zaldivar, J.M.; Kronberg, A.E.; Westerterp, K.P. On-line runaway detection in batch reactors using chaos theory techniques. AICHE J. 1999, 45, 2429–2443. [Google Scholar] [CrossRef]
- Strozzi, F.; Zaldivar, J.M. Ageneral method for assessing the thermal stability of batch chemical reactors by sensitivity calculation based on lyapunov exponents. Chem. Eng. Sci. 1994, 49, 2681–2688. [Google Scholar] [CrossRef]
- Strozzi, F.; Alós, M.A.; Zaldívar, J.M. A method for assessing thermal stability of batch reactors by sensitive calculation based on lyapunov exponents: Experimental verification. Chem. Eng. Sci. 1994, 49, 5549–5561. [Google Scholar] [CrossRef]
- Bosch, J.; Kerr, D.C.; Snee, T.J.; Strozzi, F.; Zaldivar, J.M. Runaway Detection in a Pilot-Plant Facility. Ind. Eng. Chem. Res. 2004, 43, 7019–7024. [Google Scholar] [CrossRef]
- Hungenberg, K.D.; Nieken, U.; Zollner, K.; Gao, J.; Szekely, A. Modeling safety aspects of styrene polymerization process. Ind. Eng. Chem. Res. 2005, 44, 2518–2524. [Google Scholar] [CrossRef]
- Cui, J.W.; Ni, L.; Jiang, J.C.; Pan, Y.; Wu, H.; Chen, Q. Computational Fluid Dynamics Simulation of Thermal Runaway Reaction of Styrene Polymerization. Org. Process. Res. Dev. 2019, 23, 389–396. [Google Scholar] [CrossRef]
- Padideh, G.M.; Mohammad, S.; Hossein, A. Simulation Optimization & Control of Styrene Bulk Polymerization in a Tubular Reaction. Iran. J. Chem. Chem. Eng. 2013, 32, 69–79. [Google Scholar]
Publisher’s Note: MDPI stays neutral with regard to jurisdictional claims in published maps and institutional affiliations. |
© 2020 by the authors. Licensee MDPI, Basel, Switzerland. This article is an open access article distributed under the terms and conditions of the Creative Commons Attribution (CC BY) license (http://creativecommons.org/licenses/by/4.0/).