Article

Sorption of Organic Pollutants onto Soils: Surface Diffusion Mechanism of Congo Red Azo Dye

by
Camelia Smaranda Bețianu
1,
Petronela Cozma
1,
Mihaela Roșca
1,
Elena-Diana Comăniță Ungureanu
1,
Ioan Mămăligă
2 and
Maria Gavrilescu
1,3,*
1
Department of Environmental Engineering and Management, “Cristofor Simionescu” Faculty of Chemical Engineering and Environmental Protection, “Gheorghe Asachi” Technical University of Iasi, 73 Prof. D. Mangeron Blvd., 700050 Iaşi, Romania
2
Department of Chemical Engineering, “Cristofor Simionescu” Faculty of Chemical Engineering and Environmental Protection, “Gheorghe Asachi” Technical University of Iasi, 73 Prof. D. Mangeron Blvd., 700050 Iaşi, Romania
3
Academy of Romanian Scientists, 3 Ilfov Street, 050044 Bucharest, Romania
*
Author to whom correspondence should be addressed.
Processes 2020, 8(12), 1639; https://doi.org/10.3390/pr8121639
Submission received: 10 November 2020 / Revised: 4 December 2020 / Accepted: 6 December 2020 / Published: 11 December 2020

Abstract

:
For the protection of human and ecological receptors from the effects of soil pollution with chemical compounds, we need to know the behavior and transport of pollutants in soil. This work investigated the Congo red (CR) acid dye sorption on three natural soils collected from central and northeastern regions of Romania, symbolized as IS-65, IS-T, and MH-13. To define the mechanism of sorption and identify the rate governing step, various diffusion models such as Weber–Morris intraparticle diffusion, Boyd, film and pores diffusion, and mass transfer analysis have been verified. The intraparticle diffusion analysis of Congo red sorption onto soils has been described by a multi-linear plots, showing that the sorption process takes place by surface sorption and intraparticle diffusion in macro, meso, and micropores. The values of intraparticle diffusion coefficient kid increased with any rise of the initial concentration of pollutant. The results show that the values of pore diffusion coefficient (Dp) and film diffusion coefficient (Df) are found to be from 10−8 to 10−10 cm2 s−1, indicating that film diffusion influences the sorption rate limiting step. The intraparticle diffusion analysis shows that the plots did not pass through the origin and have two distinct parts, confirming that intraparticle diffusion is not the single determining mechanism involved in the sorption of Congo red on soils IS-65, IS-T, and MH-13. The results revealed that the sorption process has a complex nature, since both external diffusion and internal diffusion are involved in the sorption of CR from solution onto the investigated soils.

1. Introduction

Soil pollution and land degradation are emerging issues with consequences at local, regional and global scale [1,2,3]. The main phenomena involved in soil and land degradation are erosion, chemical contamination, loss of soil’s organic matter, nutrient imbalance, salinization, surface sealing, loss of soil biodiversity, acidification, compaction, and waterlogging [4,5,6]. It is estimated that 1.9 billion hectares of land are affected globally [2]. At a European level, the European Environment Agency [7] predicted that around 3 million sites in the EU Member States are affected by industrial activities, and on significant surfaces (250,000 sites) the urgent application of land remediation technologies is required. Additionally, the number of recorded polluted sites is expected to increase by 50% until 2025 if no important changes in legislation and behavior are made [7].
Generally, soil and land degradation occur through physical, chemical, and biological processes [8,9]. Thus, soil degradation involves a decrease in soil quality, by weakening critical functions in the transport of energy and substances, and ecosystem services, which represents a major issue in terms of agricultural productivity and sustainability [4,10].
As an effect of contamination, the affected soils can generate a substantial environmental risk for different ecosystems as they are important sources of pollution, which may generate toxicologic effects to ecological receptors and to human health [11,12,13,14]. Chemically degraded soils are characterized by the presence of large amounts of toxic chemicals, and the most common soil pollutants are represented by chlorinated hydrocarbons (CHCs), polycyclic aromatic hydrocarbons (PAHs), phenols, pesticides, mineral oils, cyanides, heavy metals, BTEX (benzene, toluene, ethyl benzene, and xylene), pharmaceutical and personal care products, phthalic acid esters (PAE), radionuclides and others [9,14,15,16,17].
Congo red (CR) has been used as model contaminant in the present study, considering the large amount of azo dyes which are widely applied in the paper and pulp, textiles, leather, cosmetics, and plastic industries. Around 70% of the total consumption of dyes is represented by azo dye compounds [18,19]. Azo dyes contain at least one double bond (-N = N-), but may contain even more groups as mono-azo, di-azo, tri-azo, poly-azo. The azo group is generally attached to a benzene or naphthenic ring or may be attached to heterocyclic aromatic structures or aliphatic groups. In terms of chemical structure, dyes present a high stability at the molecules, which are synthesized to resist light, chemical, and biological decomposition and other means of exposure [20,21]. Additionally, some studies [18] have reported that azo dyes are able to alter the physical and chemical properties of soil, deteriorating water quality and generating harm to flora and fauna.
The transport of pollutants dissolved in the soil matrix can occur through three processes: advection, dispersion, and diffusion. Advection involves transport in the direction of flow and is correlated with the average fluid velocity. It is a passive form of transport because the contaminant is moving along with the transporting fluid. The diffusion process is the process in which pollutants move under the influence of kinetic energy in the direction of the concentration gradient [22].
Sorption/desorption is one of the most significant processes involved in the fate of pollutants in the soil matrix related to the mobility, transport, accumulation, bioavailability, and toxicity of organic contaminants. The mechanisms and extent of sorption are influenced by the concentration, structure, and the physical and chemical properties of the pollutants and soil components [3,23]. The most relevant contaminant properties that influence the sorption process are: molecular structure, type and number of functional groups, the polarity of molecule, molecular shape and size, charge distribution, hydrophobicity or lipophilicity, pH, redox potential, and the ionic or nonionic nature of the adsorbed compound [24]. Generally, the sorption process has a complex nature and can be described by the following consecutive steps: transport in the bulk of the solution, diffusion of solute in the liquid film surrounding the soil particle, and particle diffusion in the liquid contained in the solid pores and in sorbate along the pore walls.
The evaluation of the mechanisms and significance of the sorption processes of organic contaminants onto different soils represents an essential element for the comprehension of their behavior and fate in the soil matrix, and for evaluating their effects on the environment in order to identify the available alternatives for soil remediation. The aim of this work was to analyze the sorption kinetic mechanism of Congo red dye in the surface horizons of three different categories of soils sampled from central and northeastern Romania. In order to determine the rate limiting step, the experimental data obtained during the sorption of CR azo dye experiments were analyzed by applying the Weber–Morris model, the Boyd model, the film diffusion and the pores diffusion, and mass transfer analysis.

2. Experimental

2.1. Materials

Congo red (CR) [1-naphthalene sulfonic acid, 3,3′-(4,4′-biphenylenebis(azo))bis(4-amino)disodium salt], an anionic diazo dye with the chemical formula C32H22N6Na2O6S2 and a molecular weight of 696.66 g mol−1, was used as a model pollutant. Figure 1 provides the chemical structure of Congo red. All reagents were of analytical grade, being used without further purification, and were purchased from Merck and Sigma-Aldrich (München, Germany). A stock solution of 1000 mg L−1 of Congo red was prepared and then the work solutions were obtained by its dilution.

2.2. Soil Characterization

The study areas are located in the northeastern and central part of Romania and soil samples were sampled from surface horizon:
  • 0–25 cm, periurban soil sampled from Iași city, denoted as the IS-T sample (northeastern Romania);
  • 0–25 cm, suburban soil sampled from Dancu village near the Iaşi area, denoted as the IS-65 sample (northeastern Romania);
  • subsurface soil profile (20–40 cm), sampled from Harghita county, denoted as the MH-13 sample (central Romania).
The collected soil samples were classified in compliance with the Romanian System of Soil Taxonomy [25]. Triplicate samples of air-dried soil particle <0.02 mm in diameter were analyzed according to the standard methods [26]. In order to identify the most relevant physical and chemical properties, soil samples were analyzed by applying standard conventional procedures [27,28,29]. For further analysis, the disintegration of the soil conglomerates was performed by treatment with concentrated HClO4 and HNO3 in two stages, on a sand bath at 400–450 °C. SiO2 from the primary minerals was determined from the insoluble residue, while the other elements were determined in solution. The soils’ pH values were determined by the potentiometric method, using a multimeter Corning Pinnacle Model 555 and calomel–pH electrodes couple. The redox potential was determined by the direct method with a couple of platinum–calomel electrodes [27]. The chemical and mineralogical composition of soil samples were analyzed through X-ray diffraction using a diffractometer (Phillips) with CuKα radiation (scan range of 2θ from 5° to 60°, step size 0.02°) from standard powder samples, IR spectrometry (Bio-Rad IR spectrometer, KBr pellet technique, Hercules, CA, USA), optical microscopy (MEYJ optic microscope), thermal analysis (Netzsch TG 209 thermo-balance, Pt crucible), Raman spectrometry (LabRAM INV-Horiba Jobin Yvon), and chemical analysis. SiO2 was determined differentially: firstly, the silica from the parent material (crystalline) was determined by gravimetric determination after the differentiated solubilization of the other compounds, then, amorphous silica (pedogenetic) was determined by flame atomic absorption spectrometry (AAS Vario 6 FL) in solution (spectral buffer: CsCl 1% solution). The minor elements (Cd, Cr, Pb, As, Ni, Zn, Mn, Co) were determined by flame absorption spectrometry and UV-VIS spectrophotometry after the samples were preconcentrated by extraction. Sulfur was determined after complete mineralization to SO42−, followed by the determination of the SO42− anion by the potentiometric method.
The fractionation of soluble organic compounds from soil samples (1–3 g of soil) was performed by extraction with dichloroethane/methanol (1:2) followed by gas chromatography determination. The extracts were passed through a chromatographic column by successive elutions, and four fractions were separated. The first elution was performed with 20 mL of n-hexane, and hydrocarbons and organic compounds with sulfur were separated. The second elution was performed with n-hexane/toluene in a ratio of 4:1, and ethers and esters ceridic and sterols were separated. For the third elution, a mixture of 30 mL of n-hexane/ethyl acetate in a ratio of 35:2 was used and alkenonic compounds were separated. For the last elution, a 30 mL mixture of n-hexane/ethyl acetate 4:1 was used, and n-alcohols, n-acids, and steroidal alcohols were separated.
The organic compounds of the first 3 fractions were determined by direct analysis, and from fraction 4, they were determined by derivatization with bis-(trimethylsilyl)-trifluoroacetamide in dichloroethane, at 70 °C for 2 h in a nitrogen atmosphere [30,31]. The identification and assay of organic compounds from the extracted fractions were carried out by GC-FID chromatography (Hewlett–Packard 5972, Hewlett-Packard Company, Wilmington, CA, SUA), using a silica column deactivated with n-hexane (10 g; 70–320 mesh) and the following working conditions: capillary HP-1 60 m, 0.32 mm, 0.25 u; carrier gas: H2: thermal regime: in the range of 25–140 °C heating speed 10 °C/min, and in the range of 140–300 °C heating speed 5 °C/min.
For the determination of the humic substances (humic acid, fulvic acid, and humin), 1.5 g of the sample was used, and the free organic compounds were removed by successive extractions with a mixture of toluene and ethyl alcohol 1:1 (10 mL/extraction). The separated solid phase was washed with absolute methyl alcohol and dried at 50 °C, and then refluxed for 1 h with 50 mL HCl. The remaining solid phase was separated and then washed with absolute methyl alcohol and dried at 50 °C. The sample was then extracted with a mixture of 0.1 M Na2P2O7 and 0.1 M NaOH. After the extraction, the final solid residue was centrifuged at 7000 rpm for 30 min and the humic compounds were determined by potentiometric titration [26,32].
Nitrogen adsorption-desorption isotherms were carried out on a Quantachrome Autosorb automated gas sorption system instrument (Quantachrome, Boynton Beach, FL, USA) at 77 K after the sample was degassed at 80 °C under vacuum conditions for 6 h. The specific surface area (SSA) of the soils was measured using the Brunauer–Emmet–Teller (BET) method, and the Barrett–Joyner–Halenda (BJH) method was applied to determine the pore diameter and pore volume.
Soil morphological features and elemental analysis quantification were carried out by Scanning Electron Microscopy and Energy Dispersive X-ray system (SEM/EDX). The soil samples were fixed on copper supports, then the microphotographs were recorded using an ESEM (Quanta 200, FEI Company, Hillsboro, OR, USA) at an accelerating voltage of 15 kV with secondary electrons, in low vacuum conditions (LV).

2.3. Sorption Studies

Batch mode experiments were carried out to assess the sorption process. A volume of 50 mL of Congo red (CR) solution with a known initial concentration ranging from 10 to 100 mg L−1 was added to a predetermined mass of soil, and the mixture was continuously agitated by a thermostatic shaker (IKA KS 4000 IC Control, IKA-Werke GmbH & Co.KG, Staufen, Germany) at 150 rpm for a predetermined time. The experiments were carried out at 20 °C and natural pH of azo dye solution. After the sorption process, the liquid phase was separated from the soil particle by centrifugation (2800 RCF), and the concentration of CR was analyzed using a UV–VIS Spectrophotometer (PG Instruments Ltd., Leicestershire, UK). The absorbance was spectrophotometrically determined at the maximum wavelength for CR (497.5 nm). The kinetics of sorption was determined by analyzing the sorptive uptake of the dye from the aqueous solution at various intervals. All experiments were carried out in duplicate. The OriginLab 8 software tool was used for the experimental data fitting.
The amount of dye sorbed on soil (qt in mg/g) was calculated using Equation (1):
q t = ( C 0 C t ) V m
where qt is the sorption capacity (mg g−1), C0 and Ct represent the initial and final concentrations of pollutants (mg L−1), V is the solution volume (L), and m represents the mass of soil (g).
To optimize the experimental data, the root mean square error (RMSE) was used for measuring the difference between two sets of values (experimental and predicted data). The RMSE is the square root of the mean of the square of all error and was calculated using Equation (2):
R M S E = 1 n i = n n x i x ^ i 2   n
where n represents the number of data points, xi represents predicted values, and x ^ i represents actual values.

3. Results and Discussions

3.1. Soil Characterization

Some general characteristics of the analyzed soil samples are presented in Table 1. The results obtained from the chemical–mineralogical analysis of IS-65, IS-T, and MH-13 soils are presented in Table 2. From the chemical–mineralogical analysis, it was found that the major component of the three soils is represented by clay minerals (32.53% for IS-65 soil, 47.62% for IS-T soil, 43.38% for MH-13 soil), followed by silica (5.57% for IS-65 soil, 11.06% for IS-T soil, 7.86% for MH-13 soil), iron oxides and hydroxides (6.65% for IS-65 soil, 3.54% for IS-T soil, 5.65% for MH-13 soil), organic matter (3.37% for IS-65 soil; 7.19% for IS-T soil, 33.91% for MH-13 soil), and other elements (carbonates and other minerals). The results obtained from the elementary chemical analysis of IS-65, IS-T, and MH-13 soils are presented in Table 3. The standard error of measurements ranged between 2.6 and 6.9.
The analysis of the resulting data shows that silica is over 50% of the composition of all three soils, followed by aluminum oxides, calcium oxides, potassium oxides, and iron oxides. Elemental analysis revealed the presence of heavy metals (Zn, Pb, Cr, Cu) in the soils IS-65 and IS-T, with Zn and Pb having the highest weight at 57.55 μg/g and 93.74 μg/g, and 10.59 μg/g and 78.05 μg/g, respectively.

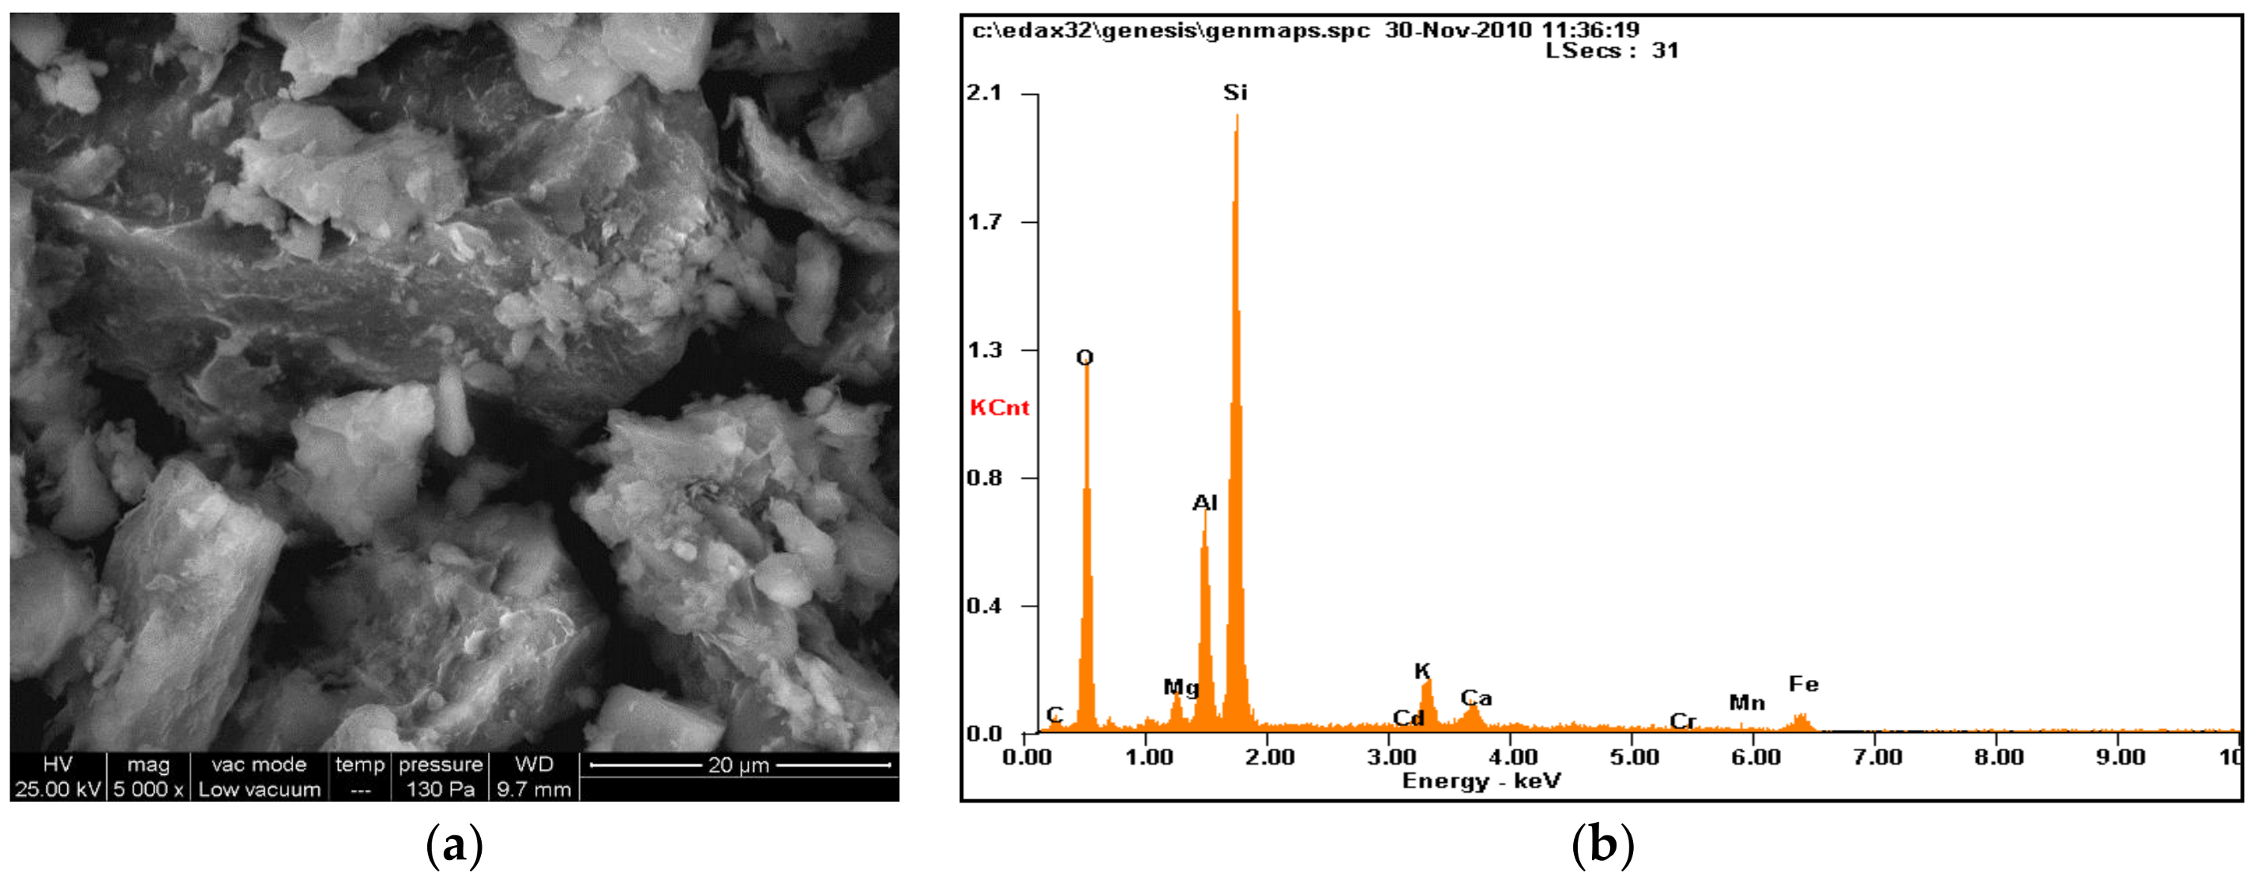
3.2. Surface Characterization

Table 4 summarizes the values of BET surface area, total solids, pore volume and pore diameter resulting from nitrogen adsorption isotherms for soils. As can be observed, the BET values ranged between 19.66 m2 g−1 and 29.36 m2 g−1, increasing in the following order: MH-13 < IS-T < IS-65. Surface area and total pore volume did not show high values; the higher surface area is 29.36 m2 g−1 for the soil IS-65.
In order to determine the particle pore size distribution, the Barrett–Joyner–Halenda (BJH) method has been applied. The surface corresponding to pores with a diameter between 2 and 50 nm, which corresponds to mesopores, represents 60.9% of the surface for IS-65 soil (862 m2/g), 65.6% for IS-T soil (473 m2/g), and 59.8% of the total soil surface for MH-13 (394 m2/g) (Figure 2). The surface area corresponding to the macropore domain for diameters larger than 50 nm is extremely small compared to the surface area of the micro and mesopores. Thus, for IS-T soil, the surface of macropores is 127 m2/g, representing 17% of the total surface, while for MH-13 it is 107 m2/g, representing 16.31% of the total surface. The IS-65 soil has the smallest surface of macropores at 111.5 m2/g, which represents 7.87% of the total surface.
The SEM micrographs and corresponding EDS spectrum were performed for all samples, and one typical microphotograph at 20 μm and spectrum of soil are given in Figure 3b, Figure 4b and Figure 5b. The SEM images are presented in Figure 3a, Figure 4a and Figure 5a, which illustrate the solid flakes of the soil particles. The morphology of the samples shows a relatively dense, homogeneous internal structure in the form of conglomerate particles, characterized by layered hexagonal and pseudohexagonal crystalline structures, a texture typical of clay minerals. Generally, the edges of the crystallites are oblique, but smaller units with irregular edges can also be observed.

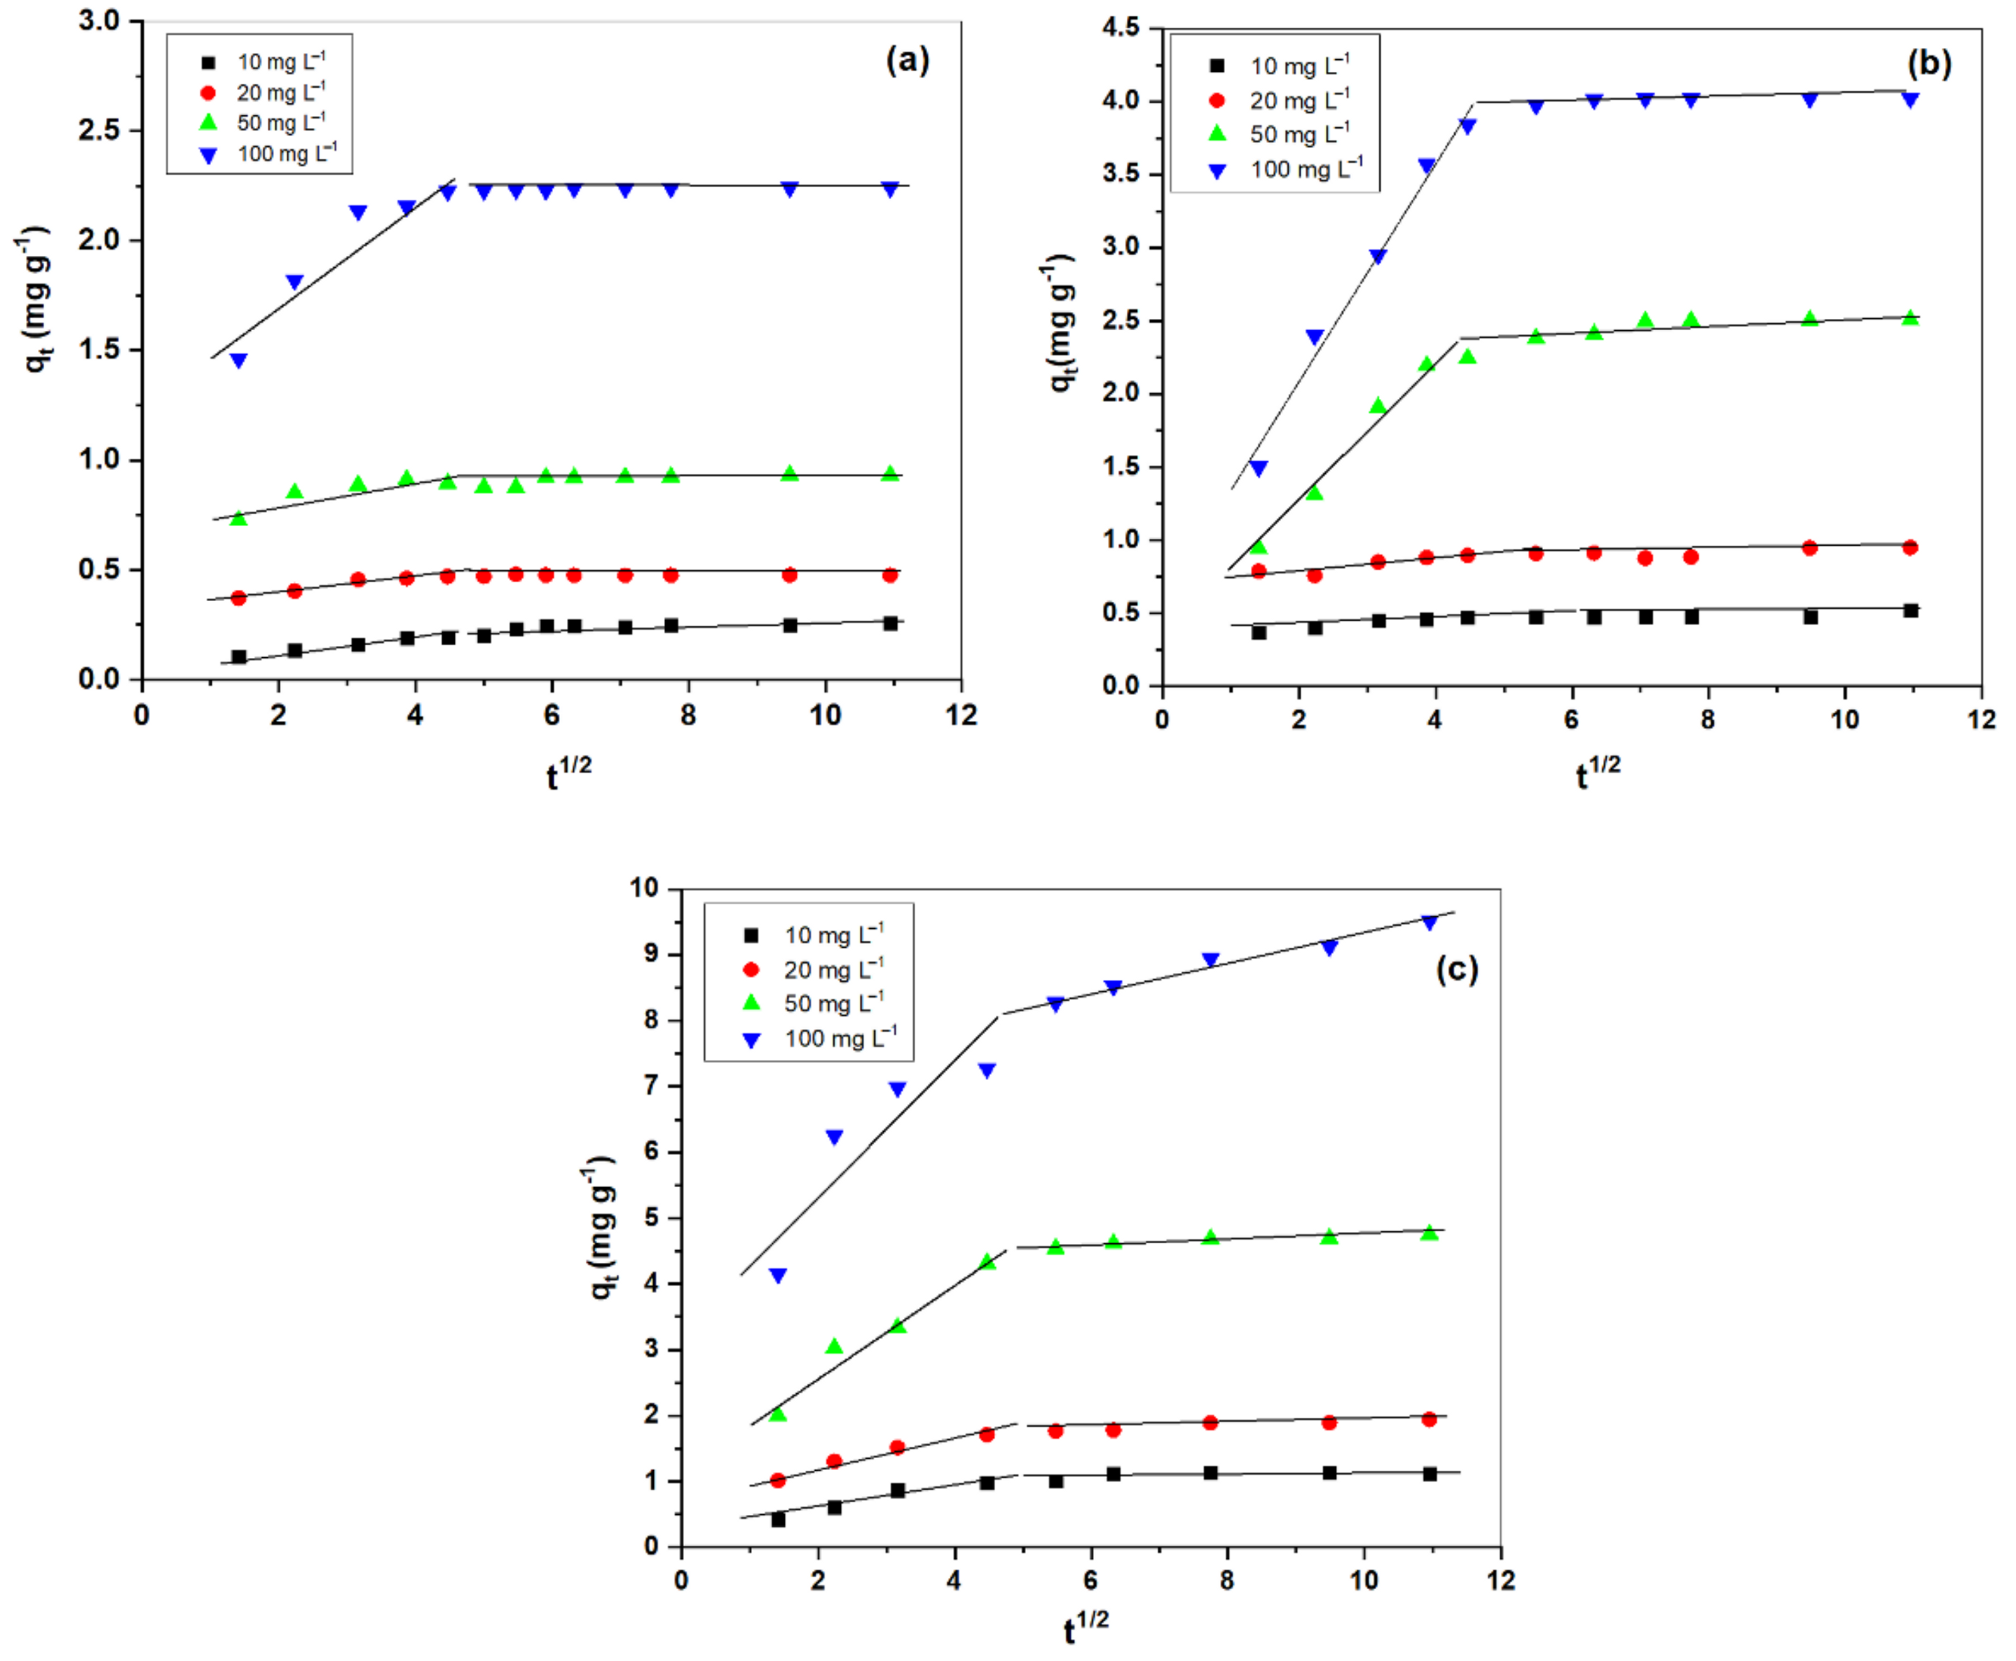
3.3. Diffusion Studies

According to Ho et al. [35], the mechanism of sorption process can be explained by the following stages:
  • Diffusion of sorbate from the bulk inside the initial phase to the interface by transport in solution;
  • Diffusion through the external liquid boundary layer (film diffusion);
  • Diffusion inside the particle pores and the penetration of the solid along the pore walls (pore diffusion);
  • Sorption and desorption inside the particles, on the internal surface.
These mechanisms can be involved in determining the rate of pollutant uptake in soil particles. The transport of the sorbate inside each phase is determined by a concentration gradient at the interface, generated by the absence of the equilibrium between the phases. In experimental conditions in batch mode, the mass transport from the liquid phase to the external surface of the solid takes place rapidly. The stage of the transport of molecules from the solution to the external film surrounding the soil particle is usually neglected. The last step, sorption, is usually rapid and, consequently, is not considered the rate controlling step in the sorption process [36,37]. Generally, film diffusion and pore diffusion can govern the sorption mechanisms, since the mass transport (external and/or internal) of sorbate within the solid phase takes place slowly. The rate of the sorption processes can be determined through external diffusion, internal diffusion or by both types of diffusion. The external diffusion influences the transport of dissolved chemical species from the solution to the interface liquid phase. The internal diffusion controls the transfer of dissolved species from the external surface of the sorbent to the internal surface of the solid [38].
In systems characterized by low sorbate concentration, low speed of homogenization, and small particle diameter, the boundary layer diffusion can be the rate governing step of the adsorption process. However, intraparticle diffusion can represent the rate controlling step of the sorption process in systems characterized by high concentrations of pollutant, a high rate of homogenization, and large sizes of solid particles [37]. If the external transport is more intense than the internal transport, then the limiting rate is determined by the intraparticle diffusion. If the external transport is lower than the internal transport, then the speed of the process is governed by film diffusion, while in the situation where the two processes have a relatively equal influence, the transport of the sorbate at the interface does not have a significant influence, and the formation of the liquid film layer around the sorbent particles is due to a corresponding concentration gradient [39].
Generally, the sorption processes have a complex nature, in which both surface sorption and intraparticle diffusion may occur. In order to determine the rate limiting step, the experimental data obtained at the sorption of CR azo dye on the soils were analyzed by applying the Weber–Morris model, the Boyd model, the film diffusion and the pores diffusion, and mass transfer analysis.

3.3.1. Intraparticle Diffusion

This model can be used to find whether external transport or intraparticle transport governs the rate of sorption processes. The analysis of intraparticle diffusion resistance affecting the sorption of CR in the selected soils was performed by the Weber–Morris model. The effect of intraparticle diffusion resistance on sorption can be determined by Equation (3):
q t = k i d t 1 / 2 + C
where kid is the intraparticle diffusion rate constant (mg g−1 min−1/2) and C (g g−1) is a constant correlated with diffusion resistance (calculated as the intercept of first order equation) [40].
The plots of the amount of CR sorbed qt (mg g−1) on soils IS-65, IS-T, and MH-13, versus the square root of the time, are depicted in Figure 6. The intraparticle diffusion analysis of the sorption of Congo red onto soils shows that the plots are not linear and have two distinct domains. The first domain is between the time intervals of 2 min and 20 min and may represent the diffusion into macropores (stage I). The second part of the slope describes the final equilibrium stage when the intraparticle diffusion (stage II) starts to be lower and level out as the extremely low dye concentration remains in solution or maximum sorption uptake is obtained. Generally, the q versus t1/2 plot presents a multilinearity, this indicates that both, external mass transfer and intraparticle diffusion have been involved in different phases of the sorption process [41,42,43].
Dye ions tend to aggregate in aqueous solutions and, due to this phenomenon, the sorption process of dyes occurs in the mesopores. Additionally, CR has a negatively charged molecule (pH > 5) and a relatively large molecular weight. The high rate of sorption kinetics in the first stage are influenced by the presence of mesopores in the soil particles, and mesopores generally exert a greater influence than the negative charge of the soil particles [44]. Moreover, the plot did not pass through the origin, possibly due to the difference between the rate of mass transfer in the first and final stages of CR sorption on the studied soils. Furthermore, the deviation of the plots from the origin indicates that other processes are involved in CR sorption on soil [44].
The values of intraparticle diffusion constants for these two stages, kid1 and kid2 (mg g−1min−0.5), are listed in Table 5. It can be observed that the values of intraparticle diffusion coefficient kid1 generally increased with the initial concentration of pollutant from 10 to 100 mg L−1, which means that the sorption rate is governed by the diffusion of the dye within the pores of the soil. In concordance with this result, it can be concluded that the boundary layer effect is substantial at a higher initial concentration of CR.
The results show an increase in kid1 values in the following order: IS-65 > IS-T > MH-13. The resulting values of the intercept C increase as follows: 0.055 to 1.116 mg g−1 for the soil IS-65; 0.330 to 0.558 mg g−1 for IS-T, and 0.192 to 3.498 mg g−1 for MH-13, when Ci is increased from 10 to 100 mgL−1. This behavior indicates that the resistance to mass transfer of the boundary layer intensifies significantly with the increase in pollutant initial concentration in this range. The lower value of kid,2 than kid,1 depicted in Table 5 confirms that, when CR diffuses into the soil pores, the diffusion resistance increases, which leads to a reduction in the diffusion rate.
The correlation coefficients (R2) of the intraparticle diffusion model have values ranging from 0.774 to 0.987. These values suggest that the process is more complex and that some other mechanisms along with intraparticle diffusion are involved in CR sorption on the studied soils [45,46,47]. The sorption of the dye on the three tested soils could not be described by a simple surface mechanism, and the sorption on the external surface was probably followed by diffusion of molecules inside the pores. The same conclusion can be drawn by analyzing the graph regarding intraparticle diffusion that reveals, by its double nature, the presence of both diffusion processes.
By comparing the experimental results, it was found that the three types of soils have different behavior during sorption processes, under the same experimental conditions. The results listed in Table 5 show that the maximum sorption capacity was obtained for the MH-13 sample, followed by the soil IS-T and then IS-65. These results can be explained by the difference in mineralogical composition, especially clay minerals and organic matter content: IS-65 contains 32.5% clay minerals, 3.37% organic matter; IS-T contains 47.62% clay minerals, 7.19% organic matter; MH-13 contains 43.38% clay minerals, of which a significant percentage, of 18.52%, is represented by amorphous matter, and 29.40% organic matter. Taking into account these results, it can be appreciated that the sorption of the CR dye is strongly influenced by the quantity of organic matter in the soil composition. It is known [24] that soil clay minerals, metal oxides, carbonates, and other minerals which present a large surface area and high charge density are largely involved in the immobilization/accumulation of organic compounds by surface and interlayer adsorption. However, the highest values for qe were registered for soil MH-13, which contains the lowest percentage of clay minerals, but the uptake capacity is influenced by the presence of allophano–humic complexes. The X-ray diffraction spectra, depicted in Figure 7, highlight the formation of allophano–humic complexes after the sorption of the pollutant, which probably play a key role in the uptake of CR in the MH-13 soil.

3.3.2. Diffusion Model

To determine if diffusion inside the pores is the rate limiting step, the experimental data were fitted using the Boyd diffusion model (Equation (4)), which is appropriate for evaluating the adsorption mechanisms [46,47,48].
F = 1 6 π 2 exp ( B t ) ,
where F represents the fractional attainment of equilibrium at different times t, and Bt represents a function of parameter F, which is described by Equation (5):
F = q t q e ,
where qt and qe are the quantity of pollutant absorbed (mg g−1) at time t and at equilibrium tf.
Replacing Equation (5) in Equation (4), the kinetic expression becomes as given by Equation (6) [49,50]:
B t = 0.4977 ln 1 q t q e
The graph of Bt versus time, which is depicted in Figure 8a–c, confirms that for soils IS-65 and IS-T, film diffusion or external mass transfer is the major dominating factor in the first stage of the process because the lines do not intersect the origin and data are nonlinear [37,46,51,52]. While for soil MH-13 (50 mg L−1, 100 mg L−1 CR), the values of intercept (−0.24) confirm that external mass transfer is the controlling step in the first stage of the process. When the amount of organic molecules that reach the surface of soil particles increases above a certain limit, the sorption process begins to be controlled by intraparticle diffusion mechanisms. Such results have been reported in the sorption of organic pollutants such as Quinoline Yellow on agricultural waste and ash [53].

3.3.3. External Diffusion Model

The effective diffusion coefficient Def (cm2/s) has been determined with Equation (7):
Def = 2/r2
where r represents the soil particle radius (mm), which is assumed to be spherical.
The results (Table 5) show that soil IS-T recorded the highest values of the effective diffusion coefficient, in the range of concentration 10 to 100 mg L−1. Def coefficient values increase with CR concentration for IS-65 soil, while for IS-T and MH-13 soils, a declining trend can be noticed when the pollutant concentration increases. A higher pollutant concentration can lead to a reduction in diffusion into the boundary layer and intensify the diffusion into the solid particles. According to [54], if Def values are in the range of 10−10 to 10−11 (cm2 s−1), the intraparticle diffusion or pore diffusion is the governing step of the process.
The Def values are between 10−6 and 10−7 cm2 s−1 (Table 6), showing that the intraparticle diffusion was not the only rate controlling step of the process [55]. Additionally, the interactions of sorbent with sorbate, together with factors such as the soil properties, pore size distribution, electronic field, the interaction of van der Waals forces type, and the characteristics of ++the surface, can influence the diffusion process and affect the Def value [49,56]. The soil pores have different sizes along their length. According to the values of the diffusion coefficient, the mesopores seem to hold most of the pores of all the soils, and this information correlates with the data presented in Figure 2. The highest values of the effective diffusion coefficient (in order of 10−6) were obtained for soil IS-T, which are particularly correlated with the highest percentage of mesopores.

3.3.4. Film and Pores Diffusion

For identifying the process that governs the CR sorption onto different types of soil, the diffusion coefficients were calculated using the previous results provided by the pseudo-I order kinetic model. Assuming a spherical soil particle geometry, the overall rate constant of the process is linked to the pore diffusion coefficient (Dp) by Equation (8).
t 1 / 2 = 0.03 r 2 D p
or with the film diffusion coefficient (Df), expressed by Equation (9):
t 1 / 2 = 0.28 r δ C s D f C e
Equations (8) and (9) are known as the half-time equations, where r is the radius of the soil particle (cm), δ represents the thickness of the liquid film adjacent to particles (cm), Dp and Df are the diffusion coefficients in pores and in film, respectively (cm2 s−1), and Cs and Ce represent the concentrations of CR on the sorbent and in the liquid phase (mg g−1 and mg L−1), respectively. Using the values of the kinetic constant kL and adopting the film thickness of 10−3 cm [57], pore diffusion coefficients (Dp), film diffusion coefficients (Df), and time half change (t1/2) were calculated. The obtained results are listed in Table 7.
According to [48,58], if film diffusion is the rate limiting step, the film diffusion coefficient, Df, should have values in the range of 10−6 to 10−8 cm2 s−1. If diffusion into the pores is the rate limiting step of the process, then the pore diffusion coefficient, Dp, should have values in the range of 10−11 to 10−13 cm2 s−1. However, other authors [59] suggest that, if Dp values are in the order of 10−10 cm s−1, then the adsorption process is governed by pore diffusion.
In this study, the values of Dp and Df are found to be of the order of 10−8 to 10−10 cm2 s−1. For the sorption of CR into IS-T soil, the Df values are in the order of 10−8 cm2 s−1, and they increase from 1.565 × 10⁻⁸ to 7.752 × 10⁻⁸ cm2 s−1 with the increase in initial concentration, showing that film diffusion is the rate limiting step. These results correspond to a total volume of pores of 4.805 × 10⁻² cm3/g, and the highest percentage of mesopores (65.6%). On the other hand, the obtained values of Dp, (in the concentration range between 20 and 100 mg L−1) for soil MH-13 suggest that pore diffusion is the rate limiting step. These results highlight that the mechanism of the sorption/retention of Congo red azo dye on the three selected natural soils is rather complex, with both film diffusion and pore diffusion being involved in determining the process rate.

3.3.5. Mass Transfer Analysis

A mechanistic approach implies the assessment of the role of the bulk transport and diffusion phenomenon to the sorption process. Mass transfer analysis for the uptake of CR from solutions on different types of soil was carried out using the mass transfer equation expressed by Equation (10):
C 0 C t = D e K 0 t ,
where C0 represents the initial concentration of the pollutant in solution (mg L−1), Ct represents the concentration at time t (mg L−1), D is a correlation parameter, K0 is the sorption constant associated with the mass transfer coefficient, and K0 = KM, where KM is a coefficient related to the mass of sorbent (g). In the linearized form, Equation (10) is like Equation (11):
ln ( C o C t ) = ln D + K o t ,
From the linear plot of ln(CoCt) versus time, the constants lnD and Ko were determined and the results are presented in Table 8. It was found that the values of lnD, which is a measure of the ratio of the apparent partition of CR ions between the aqueous phase and the solid phase, increase with the pollutant concentration. At high concentrations, the dye molecules are transported from the solution to the active centers of the soil particles. This behavior can be observed for all types of analyzed soils, with the highest values of the lnD coefficient being recorded for the IS-T soil. The K0 mass transfer coefficient increases slightly when dye concentration in the solution is increasing in the range of 20–100 mgL−1. The mass transfer constant values are of 10−3 order of magnitude, and these results are similar to those obtained for the adsorption of other dye ions [37]. However, the highest K0 values were found for the soils IS-65 and MH-13, at the lowest concentration of CR, respectively 10 mg L−1. The decline of the mass transfer coefficient with an increase of dye concentration can be attributed to the competition between the larger number of CR molecules for the available sites for adsorption.

4. Conclusions

To explain and understand the sorption behavior of organic pollutants on soil, it is necessary to achieve a better understanding of the adsorption mechanism. In this regard, the main purpose of this study was to assess the sorption mechanism involved in the uptake of Congo red azo dye onto three different soils. Generally, the sorption process has a complex nature and can be designated by the following consecutive steps: transport in the bulk of the solution, diffusion of solute across the liquid film surrounding the soil particles, and particle diffusion in the liquid contained in the pores and in soil along the walls of the pores. The sorption process can be governed by one or more steps, such as the film or external diffusion, pore diffusion, surface diffusion, and sorption on the pore surface, or a combination of these.
The values of Df confirm that film diffusion was the rate limiting step for the sorption of CR into IS-T soil when the Df values are of 10−8 cm2 s−1 order, and enlarged with the increase in initial pollutant concentration. However, for the soil MH-13, the resulting values of Dp suggest that pore diffusion is the rate governing step, possibly due to the lower surface area. The results highlight that the mechanism of the sorption of Congo red azo dye on the three selected natural soils is quite complex, with both film diffusion and pore diffusion being involved in the process. These results can be explained by the difference in the mineralogical composition of soils, especially clay minerals and organic matter contents.
The intraparticle diffusion analysis of the sorption of Congo red onto soils shows that the plots are nonlinear and presents two distinct stages. This multilinearity emphasizes that both mechanisms, external mass transfer and intraparticle diffusion there are involved in the different stages of sorption.
The data achieved in this work support the assumption that the sorption of CR onto all studied soils is a complex process, and more than one process is involved in the rate limiting step. Moreover, the rate of the adsorption process is governed by both types of diffusion—external diffusion and internal diffusion.

Author Contributions

Conceptualization, M.G., I.M., and C.S.B.; Methodology, C.S.B., P.C. and M.R.; Formal Analysis, C.S.B., E.-D.C.U., and M.R.; Writing—Original Draft Preparation, C.S.B., M.R., P.C.; Writing—Review and Editing, C.S.B., P.C., E.-D.C.U.; Supervision, M.G., I.M.; Funding Acquisition, M.G. All authors have read and agreed to the published version of the manuscript.

Funding

This work was supported by a grant from the Romanian National Authority for Scientific Research, CNCS-UEFISCDI, project number PN-III-P4-ID-PCE-2016–0683, Contract no. 65/2017, and a grant from the Romanian Ministry of Education and Research, CCCDI-UEFISCDI, project number PN-III-P2-2.1-PED-2019-5239, Contract no. 269PED/2020, within PNCDI III.

Conflicts of Interest

The authors declare no conflict of interest. The funders had no role in the design of the study; in the collection, analyses, or interpretation of data; in the writing of the manuscript, or in the decision to publish the results.

References

  1. Bajocco, S.; De Angelis, A.; Perini, L.; Ferrara, A.; Salvati, L. The impact of land use/land cover changes on land degradation dynamics: A Mediterranean case study. Environ. Manag. 2012, 49, 980–989. [Google Scholar] [CrossRef] [PubMed]
  2. Naseer, A.; Pandey, P. Assessment and monitoring of land degradation using geospatial technology in Bathinda district, Punjab, India. Solid Earth 2018, 9, 75–90. [Google Scholar] [CrossRef]
  3. Tetteh, R.N. Chemical soil degradation as a result of contamination: A review. J. Soil Sci. Environ. Manag. 2015, 6, 301–308. [Google Scholar] [CrossRef]
  4. FAO. Status of the World’s Soil Resources—Technical Summary. 2015. Available online: http://www.fao.org/3/i5199e/i5199e.pdf (accessed on 20 September 2020).
  5. Niculiță, M.; Bălan, M.G.; Andrei, A.; Rusu, E. Digital soil mapping in a mountainous area with mixed land use (Humor catchment—Eastern Carpathians, Romania) using soil-landscape systems, fuzzy logic and environmental covariates. Environ. Eng. Manag. J. 2019, 18, 479–489. [Google Scholar] [CrossRef]
  6. Prince, S.; Von Maltitz, G.; Zhang, F. Status and trends of land degradation and restoration and associated changes in biodiversity and ecosystem functions. In The IPBES Assessment Report on Land Degradation and Restoration; Montanarella, L., Scholes, R., Brainich, A., Eds.; Secretariat of the Intergovernmental Science-Policy Platform on Biodiversity and Ecosystem Services: Bonn, Germany, 2018; pp. 221–338. [Google Scholar] [CrossRef]
  7. EEA. The State of Soil in Europe A Contribution of the JRC to the EEA Environment State and Outlook Report—SOER; Publications Office of the European Union: Luxembourg, 2012. [Google Scholar] [CrossRef]
  8. Coman, A.M.; Lacatusu, G.; Macsim, A.M.; Lazar, G. Assessment of soil erosion using Fournier indexes to estimate rainfall erosivity. Environ. Eng. Manag. J. 2019, 18, 1739–1745. [Google Scholar] [CrossRef]
  9. Panagos, P.; Van Liedekerke, M.; Yigini, Y.; Montanarella, L. Contaminated sites in Europe: Review of the current situation based on data collected through an European Network. J. Environ. Public Health 2013. [Google Scholar] [CrossRef]
  10. Gomiero, T. Soil degradation, land scarcity and food security: Reviewing a complex challenge. Sustainability 2016, 8, 281. [Google Scholar] [CrossRef] [Green Version]
  11. Bünemann, E.K.; Bongiorno, G.; Baic, Z.; Creamer, R.E.; de Deyn, G.; de Goede, R.; Fleskens, L.; Geissen, V.; Kuyper, T.W.; Mäder, P.; et al. Soil quality—A critical review. Soil Biol. Biochem. 2018, 120, 105–125. [Google Scholar] [CrossRef]
  12. Galli, E.; Muzzini, V.G.; Finizio, A.; Fumagalli, P.; Grenni, P.; Caracciolo, A.B.; Rauseo, J.; Patrolecco, L. Ecotoxicity of foaming agent conditioned soils tested on two terrestrial organisms. Environ. Eng. Manag. J. 2019, 18, 1703–1710. [Google Scholar] [CrossRef]
  13. Gavrilescu, M. Fate of pesticides in the environment and its bioremediation. Eng. Life Sci. 2005, 5, 497–526. [Google Scholar] [CrossRef]
  14. Rodríguez-Eugenio, N.; McLaughlin, M.; Pennock, D. Soil Pollution: A Hidden Reality; Food and Agriculture Organization of the United Nations: Rome, Italy, 2018; Available online: http://www.fao.org/3/I9183EN/i9183en.pdf (accessed on 20 September 2020).
  15. Căliman, F.A.; Robu, B.; Smaranda, C.; Pavel, V.L.; Gavrilescu, M. Soil and groundwater cleanup: Benefits and limits of emerging technologies. Clean Technol. Environ. Policy 2011, 13, 241–268. [Google Scholar] [CrossRef]
  16. Sparks, D.L. (Ed.) Environmental soil chemistry: An overview. In Environmental Soil Chemistry, 2nd ed.; Academic Press: San Diego, CA, USA, 2002; pp. 1–42. [Google Scholar] [CrossRef]
  17. Srivastava, M.; Srivastava, A.; Yadav, A.; Rawat, V. Source and control of hydrocarbon pollution. In Hydrocarbon Pollution and Its Effect on the Environment; Ince, M., Ince, O.M., Eds.; Intech: Rijeka, Croatia, 2019; pp. 1–21. [Google Scholar] [CrossRef] [Green Version]
  18. Hassaan, M.A.; Nemr, A.E. Health and environmental impacts of dyes: Mini review. Am. J. Environ. Sci. 2017, 3, 64–67. [Google Scholar] [CrossRef]
  19. Singh, L.; Singh, V.P. Decolourization of azo (acid red) and anthraquinonic (basic blue) dyes by the fungus Aspergillus Flavus. Int. J. Med. Eng. Inform. 2017, 3, 1–5. [Google Scholar] [CrossRef] [Green Version]
  20. Jamee, R.; Siddique, R. Biodegradation of synthetic dyes of textile effluent by microorganisms: An environmentally and economically sustainable approach. Eur. J. Microbiol. Immunol. 2019, 9, 114–118. [Google Scholar] [CrossRef] [PubMed]
  21. Raval, N.P.; Shah, P.U.; Shah, N.K. Adsorptive amputation of hazardous azo dye Congo red from wastewater: A critical review. Environ. Sci. Pollut. Res. 2016, 23, 14810–14853. [Google Scholar] [CrossRef]
  22. Durães, N.; Novo, L.A.B.; Candeias, C.; Ferreirada da Silva, E. Distribution, transport and fate of pollutants. In Soil Pollution: From Monitoring to Remediation; Duarte, A.C., Cachada, A., Rocha-Santos, T., Eds.; Academic Press: New York, NY, USA, 2018; pp. 29–57. [Google Scholar] [CrossRef]
  23. Smaranda, C.; Gavrilescu, M.; Bulgariu, D. Studies on sorption of Congo Red from aqueous solution onto soil. Int. J. Environ. Res. 2011, 5, 177–188. [Google Scholar] [CrossRef]
  24. Loffredo, E.; Senesi, N. Fate of anthropogenic organic pollutants in soils with emphasis on adsorption/desorption processes of endocrine disruptor compounds. Pure Appl. Chem. 2006, 78, 947–961. [Google Scholar] [CrossRef]
  25. Florea, N.; Munteanu, I.; Băcăinţan, N.; Bălăceanu, V.; Cârstea, S. Romanian Soil Taxonomy System: SRTS; Estfalia Publishing House: Bucureşti, Romania, 2003. (In Romanian) [Google Scholar]
  26. Pansu, M.; Gautheyrou, J. Handbook of Soil Analysis Mineralogical, Organic and Inorganic Methods; Springer: Berlin/Heidelberg, Germany; New York, NY, USA, 2006. [Google Scholar]
  27. Bulgariu, D.; Rusu, C.; Breabăn, I.G.; Bulgariu, L.; Aştefanei, D. Instrumental Methods of Analysis in Geosciences; Sampling Demiurg Publishing House: Iaşi, Romania, 2005; Volume I. (In Romanian) [Google Scholar]
  28. Adriano, D.C. Trace Elements in Terrestrial Environments: Biogeochemistry, Bioavailability, and Risks of Metals, 2nd ed.; Springer: New York, NY, USA, 2001. [Google Scholar] [CrossRef]
  29. Kabata-Pendias, A.; Mukherjee, A.B. Trace Elements from Soil to Human; Springer: Berlin/Heidelberg, Germany, 2007. [Google Scholar] [CrossRef]
  30. Schnitzer, M.; Schuppli, P. Method for the sequential extraction of organic matter from soil and soil fractions. Soil Sci. Soc. Am. J. 1989, 53, 1418–1424. [Google Scholar] [CrossRef]
  31. Swift, R.S. Organic matter characterization. In Methods of Soil Analysis. Part 3. Chemical Methods; Sparks, D.S., Page, A.L., Helmke, P.A., Loeppert, R.H., Soltanpour, P.N., Tabatabai, M.A., Johnston, C.T., Sumner, M.E., Eds.; Soil Science Society of America: Madison, WI, USA, 1996; pp. 1018–1020. [Google Scholar] [CrossRef]
  32. Stevenson, F.J. Humus Chemistry; Wiley: New York, NY, USA, 1982. [Google Scholar]
  33. Smaranda, C.; Bulgariu, D.; Măluţan, T.; Gavrilescu, M. The evaluation of factors affecting sorption of pentachlorophenol in soil. Sci. Pap. Agron. Ser. 2014, 57, 133–138. [Google Scholar]
  34. Smaranda, C.; Popescu, M.-C.; Bulgariu, D.; Măluţan, T.; Gavrilescu, M. Adsorption of organic pollutants onto a Romanian soil: Column dynamics and transport. Process Saf. Environ. Prot. 2017, 108, 108–120. [Google Scholar] [CrossRef]
  35. Ho, Y.S.; Ng, J.C.Y.; McKay, G. Kinetics of pollutant sorption by biosorbents: Review separation and purification methods. Sep. Purif. Technol. 2000, 29, 189–232. [Google Scholar] [CrossRef]
  36. Choy, K.K.H.; Ko, D.C.K.; Cheung, C.W.; Porter, J.F.; McKay, G. Film and intraparticle mass transfer during the adsorption of metal ions onto bone char. J. Colloid Interface Sci. 2004, 271, 284–295. [Google Scholar] [CrossRef] [PubMed]
  37. Hameed, B.H.; El-Khaiary, M.I. Sorption kinetics and isotherm studies of a cationic dye using agricultural waste: Broad bean peels. J. Hazard. Mater. 2008, 154, 639–648. [Google Scholar] [CrossRef] [PubMed]
  38. Karthikeyan, S.; Sivakumar, B.; Sivakumar, N. Film and pore diffusion modeling for adsorption of reactive red 2 from aqueous solution on to activated carbon prepared from bio-diesel industrial waste. J. Chem. 2010, 7, 175–184. [Google Scholar] [CrossRef]
  39. Sahmounea, M.N.; Ouazene, N. Mass-transfer processes in the adsorption of cationic dye by sawdust. Environ. Prog. Sustain. Energy 2012, 31, 597–603. [Google Scholar] [CrossRef]
  40. Vimonses, V.; Lei, S.; Jin, B.; Chow, C.W.K.; Saint, C. Adsorption of Congo red by three Australian kaolins. Appl. Clay Sci. 2009, 43, 465–472. [Google Scholar] [CrossRef]
  41. Coşkun, Y.İ.; Aksuner, N.; Yanik, J. Sandpaper wastes as adsorbent for the removal of brilliant green and malachite green dye. Acta Chim. Slov. 2019, 66, 402–413. [Google Scholar] [CrossRef]
  42. Lian, L.; Guo, L.; Guo, C. Adsorption of Congo red from aqueous solutions onto Ca-bentonite. J. Hazard. Mater. 2009, 161, 126–131. [Google Scholar] [CrossRef]
  43. Litefti, K.; Freire, M.S.; Stitou, M.; González-Álvarez, J. Adsorption of an anionic dye (Congo red) from aqueous solutions by pine bark. Sci. Rep. 2019, 9, 16530. [Google Scholar] [CrossRef] [Green Version]
  44. Mall, I.D.; Srivastava, V.C.; Agarwal, N.K.; Mishra, I.M. Removal of Congo red from aqueous solution by bagasse fly ash and activated carbon: Kinetic study and equilibrium isotherm analyses. Chemosphere 2005, 61, 492–501. [Google Scholar] [CrossRef]
  45. Ayoob, S.; Gupta, A.K.; Bhakat, P.B.; Bhat, V.T. Investigations on the kinetics and mechanisms of sorptive removal of fluoride from water using alumina cement granules. Chem. Eng. J. 2008, 140, 6–14. [Google Scholar] [CrossRef]
  46. Periyaraman, P.M.; Karan, S.; Ponnusamy, S.K.; Vaidyanathan, V.; Vasanthakumar, S.; Dhanasekaran, A.; Subramanian, S. Adsorption of an anionic dye onto native and chemically modified agricultural waste. Environ. Eng. Manag. J. 2019, 18, 257–270. [Google Scholar] [CrossRef]
  47. Smaranda, C.; Bulgariu, D.; Gavrilescu, M. Equilibrium and kinetic studies on acid dye adsorption onto soils from Iasi area. Environ. Eng. Manag. J. 2010, 9, 57–66. [Google Scholar] [CrossRef]
  48. Maiyalagan, T.; Karthikeyan, S. Film-pore diffusion modeling for sorption of azo dye on to exfoliated graphitic nanoplatelets. Indian J. Chem. Technol. 2013, 20, 7–14. Available online: http://nopr.niscair.res.in/bitstream/123456789/15857/1/IJCT%2020%281%29%207-14.pdf (accessed on 10 May 2020).
  49. Naiya, T.K.; Bhattacharya, A.K.; Das, S.K. Adsorption of Cd(II) and Pb(II) from aqueous solutions on activated alumina. J. Colloid Interface Sci. 2009, 333, 14–26. [Google Scholar] [CrossRef]
  50. Viegas, R.M.C.; Campinas, M.; Costa, H.; Rosa, M.J. How do the HSDM and Boyd’s model compare for estimating intraparticle diffusion coefficients in adsorption processes. Adsorption 2014, 20, 737–746. [Google Scholar] [CrossRef]
  51. Li, D.; Yan, J.; Liu, Z.; Liu, Z. Adsorption kinetic studies for removal of methylene blue using activated carbon prepared from sugar beet pulp. Int. J. Environ. Sci. Technol. 2016, 13, 1815–1822. [Google Scholar] [CrossRef] [Green Version]
  52. Zhu, W.; Liu, J.; Li, M. Fundamental studies of novel zwitterionic hybrid membranes: Kinetic model and mechanism insights into strontium removal. Sci. World J. 2014. [Google Scholar] [CrossRef]
  53. Gupta, V.K.; Mittal, A.; Gajbe, V. Adsorption and desorption studies of a water soluble dye, Quinoline Yellow, using waste materials. J. Colloid Interface Sci. 2005, 284, 89–98. [Google Scholar] [CrossRef]
  54. Banerjee, S.; Chattopadhyaya, M.C. Adsorption characteristics for the removal of a toxic dye, tartrazine from aqueous solutions by a low cost agricultural by-product. Arab. J. Chem. 2017, 10, S1629–S1638. [Google Scholar] [CrossRef] [Green Version]
  55. Podder, M.S.; Majumder, C.B. Biosorption of As(III) and As(V) on the surface of TW/MnFe2O4 composite from wastewater: Kinetics, mechanistic and thermodynamics. J. Appl. Water Eng. Res. 2017, 7, 2689–2715. [Google Scholar] [CrossRef] [Green Version]
  56. Gedamy, Y.R. Successive consecutive removal of some heavy metals from groundwater of the quaternary aquifer in El-Minya governorate using rice straw. J. Appl. Sci. 2013, 9, 4299–4317. Available online: http://www.aensiweb.com/old/jasr/jasr/2013/4299-4317.pdf (accessed on 20 May 2020).
  57. Ejikeme, P.M.; Okoye, A.I.; Onukwul, O.D. Kinetics and isotherm studies of Cu2+ and Pb2+ ions removal from simulated waste water by Gambeya albida seed shell activated carbon. Afr. Rev. Phys. 2011, 6, 143–152. Available online: http://lamp.ictp.it/index.php/aphysrev/article/view/451/208 (accessed on 25 May 2020).
  58. Shanthi, P.; Tamilarasan, G.; Anitha, K.; Karthikeyan, S. Film and pore diffusion modeling for adsorption of Reactive Red-4 onto Sterculia quadrifida seed shell waste as activated carbon. Rasayan J. Chem. 2014, 7, 229–240. Available online: https://rasayanjournal.co.in/vol-7/issue_3/4_%20Vol.7_3_,%20229-240,%20%202014,%20RJC-1150.pdf (accessed on 29 May 2020).
  59. Gupta, G.S.; Prasad, G.; Panday, K.K.; Singh, V.N. Removal of chrome dye from aqueous solutions by fly ash. Water Air Soil Pollut. 1988, 37, 13–24. [Google Scholar] [CrossRef]
Figure 1. The molecular structure of Congo red dye.
Processes 08 01639 g001
Figure 2. Percentage distribution of surface pores in the range of micro, meso, and macro for IS-65, IS-T, and MH-13 soils.
Processes 08 01639 g002
Figure 3. Scanning electron micrograph of IS-65 soil particle at 20 μm (a) and corresponding EDS spectrum (b).
Processes 08 01639 g003
Figure 4. Scanning electron micrograph of IS-T soil particle at 20 μm (a) and corresponding EDS spectrum (b).
Processes 08 01639 g004
Figure 5. Scanning electron micrograph of MH-13 soil particle at 20 μm (a) and corresponding EDS spectrum (b).
Processes 08 01639 g005
Figure 6. Plots of intraparticle Weber–Morris diffusion model for Congo red sorption on soil (a) IS-65, (b) IS-T, (c) MH-13.
Processes 08 01639 g006
Figure 7. X-ray diffraction spectra for soil sample MH-13 before (a) and after (b) CR sorption, (*) clay–humic complexes; (**) allophano–humic complexes.
Processes 08 01639 g007
Figure 8. Boyd model applied for the sorption of Congo red on soil (a) IS-65, (b) IS-T, (c) MH-13.
Processes 08 01639 g008
Table 1. Characteristics of soil samples [33,34].
Sample CharacteristicsIS-65IS-TMH-13
AreaDancu village-Iaşi (IS) countyTudor Vladimirescu-Iaşi (IS) cityHarghita Mountains (MH)/Orientals Carpathian (1370 m altitude)
Sampling depth (cm)0–250–2520–40
Soil type/subtype *Cernisoil/cambic chernozem Protisoil/Entiantrosoil urbic associated with aluviosol molic-gleic/pelicAndosoil cambic-histic
Soil horizon *Am/BvApk/Bvk2Aou
Soil utilizationAgricultural soil (crop—Medicago sativa)Green area (ruderal plant—Gramineae)Coniferous forest
Anthropic soil transformationWeakIntenseVery weak
Pollution degree **Non-pollutedWeak to mediumNon-polluted
pH7.115.886.38
Eh535.21580.13611.81
CTSC25.6310.6115.74
* According to [27]. ** According to [28,29]. Eh—redox potential (mV). CTSC—total cation exchange capacity (meq/100 g soil). Part of this Table was reproduced from [33] with the permission of the Publishing House of the University of Agriculture and Veterinary Medicine, Iasi, Romania.
Table 2. Chemical–mineralogical composition of soil samples (% w/w) * [33,34].
Chemical–Mineralogical CompositionIS-65IS-TMH-13
Clay minerals
(%, w/w)
Smectite 13.8515.296.33
Illite4.209.878.86
Kaolinite12.6619.209.67
Amorphous1.813.2418.52
Total32.5347.6243.38
Carbonates
(%, w/w)
Crystalline1.753.173.38
Amorphous0.401.730.71
Total2.154.914.10
Iron oxides and oxihydroxides
(%, w/w)
Crystalline4.251.501.61
Amorphous2.392.044.03
Total6.653.545.65
Silica (SiO2)
(%. w/w)
Crystalline3.416.644.96
Amorphous2.154.422.89
Total5.5711.067.86
Other minerals ** (%, w/w)6.086.137.36
Organic matter
(%. w/w)
Humic substancesHumic acids2.323.1920.21
Fulvic acids0.251.727.75
Humin0.150.421.43
Total2.745.3329.40
Others non-humic
organic compounds #
0.631.864.51
Total3.377.1933.91
Undecomposed vegetal matter % (w/w)0.480.730.12
Coarse fraction *** % (w/w)0.211.510.03
* Reported at raw soil sample. ** Sulfates, phosphates, heavy minerals and relicts (from parent material). # Organic compound unbound to hummus substances. *** Granulometric fraction Φ > 2.00 mm (raw fraction; includes fragments of unmodified minerals and rocks parental). Part of this Table was reproduced from [33] with the permission of the Publishing House of the University of Agriculture and Veterinary Medicine, Iasi, Romania.
Table 3. Elemental composition of soil samples.
Chemical CompositionIS-65IS-TMH-13
Major elements (%)
SiO259.6753.9552.06
Al2O320.6320.2129.15
Fe2O31.172.855.98
TiO20.10.060.03
Na2O2.251.691.24
K2O3.414.202.27
MgO1.131.261.61
CaO4.848.062.97
P2O50.190.371.08
SO30.210.220.34
CO22.944.832.28
96.5497.7098.81
Minor elements (μg/g)
Cd0.061.130.01
Cr *6.4417.020.02
Pb10.5978.050.14
As0.831.370.17
Zn57.5593.740.54
Cu20.1548.260.05
Mn72.03217.850.18
* Total concentration. Part of this Table was reproduced from [33] with the permission of the Publishing House of the University of Agriculture and Veterinary Medicine, Iasi, Romania.
Table 4. Soil porosity characteristics [33].
BET ParametersIS-65IS-TMH-13
BET surface area (m2/g)29.3626.2619.66
Total pore volume (cm3/g)4.329 × 10−24.805 × 10−25.174 × 10⁻²
Average pore diameter (Å)58.9873.17105.5
Micro-pore volume (cm3 /g)3.996 × 10−33.087 × 10−32.353 × 10⁻³
Micro-pore surface area (m2/g)9.1467.0154.671
External surface area (m2/g)20.2219.2514.99
Part of this Table was reproduced from [33] with the permission of the Publishing House of the University of Agriculture and Veterinary Medicine, Iasi, Romania.
Table 5. The values of intraparticle diffusion coefficients.
Kinetic Model ParametersInitial Concentration of CR (mg L−1)
IS-65IS-TMH-13
102050100102050100102050100
Experimentalqexp0.25650.47560.93232.24150.52310.95132.50754.02151.12301.94444.75579.5171
Intraparticle diffusion model Weber–MorrisC (mg/g)0.05500.3180.65081.11670.33060.70210.34180.55840.19290.76071.16463.4983
kid1 (mg/g min1/2)0.03900.03390.07220.29100.03340.04410.45550.75740.18800.22180.71160.9461
R20.98700.95060.87440.92210.92710.88550.96470.98380.94360.96000.95980.8763
RMSD0.06430.00370.00510.00980.4090.00990.04240.00310.07380.04240.07870.8151
kid2 (mg/g min1/2)0.00820.00050.00080.00240.00680.01000.02180.00570.01430.03260.03410.2162
C (mg/g)0.17700.47070.8552.2110.33060.334180.55840.70210.99101.59484.38597.1475
RMSD228.8418.28930.00130.11100.02850.23720.21410.23720.04890.00910.00890.0893
Table 6. Effective diffusion coefficients (Def) of Congo red sorption on tested soil, for different initial concentrations of CR.
Type of SoilCR Concentration (mg L−1)Def (cm2 s−1)
IS-65101.293 × 10−7
203.722 × 10⁻⁷
502.548 × 10⁻⁷
1005.094 × 10−7
IS-T108.270 × 10−6
206.727 × 10⁻⁶
508.904 × 10⁻⁶
1004.573 × 10−6
MH-13101.678 × 10−7
201.509 × 10⁻⁷
501.767 × 10⁻⁷
1001.015 × 10−7
Table 7. Pore diffusion (Dp) and film diffusion (Df) coefficients for CR sorption on soils.
SoilCR (mg L−1)t½ (s)Dp (cm2 s−1)Df (cm2 s−1)
IS-6510987.8587.592 × 10−103.282 × 10⁻¹⁰
20632.0491.186 × 10−95.522 × 10⁻¹⁰
50679.5561.103 × 10−94.424 × 10⁻¹⁰
100461.0731.626 × 10−91.002 × 10⁻⁹
IS-T102376.5041.136 × 10−81.565 × 10⁻⁸
201026.8842.629 × 10−81.164 × 10⁻⁸
50531.1475.083 × 10−83.521 × 10⁻⁸
100365.7767.381 × 10−87.752 × 10⁻⁸
MH-1310529.7941.415 × 10−93.532 × 10⁻⁸
201103.1526.798 × 10−101.044 × 10⁻⁹
50852.2308.800 × 10−103.688 × 10⁻⁹
1001311.9505.716 × 10−103.522 × 10⁻⁹
Table 8. Mass transfer coefficients.
SoilCR Concentration (mg L−1)lnDK0 (min−1)
IS-65101.1600.0058
202.1670.0011
502.8340.0011
1003.6770.0017
IS-T102.1440.0018
202.8080.0013
503.4990.005
1004.0090.004
MH-13101.9580.005
202.6300.003
503.5140.004
1001.7180.006
Publisher’s Note: MDPI stays neutral with regard to jurisdictional claims in published maps and institutional affiliations.

