Article

Neural Modelling of APS Thermal Spray Process Parameters for Optimizing the Hardness, Porosity and Cavitation Erosion Resistance of Al2O3-13 wt% TiO2 Coatings

1
Department of Materials Engineering, Faculty of Mechanical Engineering, Lublin University of Technology, Nadbystrzycka 36D, 20-618 Lublin, Poland
2
Faculty of Mechanical Engineering, Wrocław University of Science and Technology, 5 Łukasiewicza Street, 50-371 Wrocław, Poland
3
Institute of Mechanical Engineering, Warsaw University of Life Sciences, Nowoursynowska 164, 02-787 Warsaw, Poland
*
Authors to whom correspondence should be addressed.
Processes 2020, 8(12), 1544; https://doi.org/10.3390/pr8121544
Submission received: 3 November 2020 / Revised: 22 November 2020 / Accepted: 24 November 2020 / Published: 26 November 2020
(This article belongs to the Section Materials Processes)

Abstract

:
The study aims to elaborate a neural model and algorithm for optimizing hardness and porosity of coatings and thus ensure that they have superior cavitation erosion resistance. Al2O3-13 wt% TiO2 ceramic coatings were deposited onto 316L stainless steel by atmospheric plasma spray (ASP). The coatings were prepared with different values of two spray process parameters: the stand-off distance and torch velocity. Microstructure, porosity and microhardness of the coatings were examined. Cavitation erosion tests were conducted in compliance with the ASTM G32 standard. Artificial neural networks (ANN) were employed to elaborate the model, and the multi-objectives genetic algorithm (MOGA) was used to optimize both properties and cavitation erosion resistance of the coatings. Results were analyzed with MATLAB software by Neural Network Toolbox and Global Optimization Toolbox. The fusion of artificial intelligence methods (ANN + MOGA) is essential for future selection of thermal spray process parameters, especially for the design of ceramic coatings with specified functional properties. Selection of these parameters is a multicriteria decision problem. The proposed method made it possible to find a Pareto front, i.e., trade-offs between several conflicting objectives—maximizing the hardness and cavitation erosion resistance of Al2O3-13 wt% TiO2 coatings and, at the same time, minimizing their porosity.

1. Introduction

Thermal spraying (TS) is an important technology used in the field of surface engineering. It is used to apply coatings to different types of materials (metals, ceramics, cermet). New methods and materials have been studied, improved and developed for over a century [1,2,3]. Among other methods, plasma spraying, or more precisely, atmospheric plasma spraying (APS), is the most widely used TS technique owing to its numerous advantages such as good adhesion strength, high plasma jet temperature and relatively high deposition rate [1]. The quality and properties of coatings depend to different degrees upon APS process parameters. For a more effective development of coatings, it is necessary to understand the underlying physical processes and correlations between process parameters and coating characteristics [4,5]. Among others, the most important parameters include electrical power, spray distance and torch velocity [6,7,8]. A detailed description of APS as well as additional information about this technique can be found, e.g., in [9,10].
Simulations are a popular method of in-depth analysis of engineering processes. However, to carry out a simulation, one needs a model of the analyzed process. Two main groups of models can be distinguished in modelling: physical models and those based on parametric identification. Physical models, so-called white box models, use the laws of physics to describe particular phenomena. These models are also referred to as analogue models [11,12]. They consider the energy balance, flows of heat and mass transfer as well as mutual interactions among them. Such models require a large number of parameters to be considered. An example of using white box models in APS modelling is given in [4]. For a modelling approach it is, therefore, reasonable to reduce the number down to a few parameters. This condition is satisfied by parametric models, also known as black box models [13]. The most popular tool for black box modelling is the artificial neural network (ANN). Such models describe the mathematical relationship between input and output signals. Unlike white box models, they are built on the basis of experimental data rather than the laws of physics. An extensive description of APS neural modelling is presented in [5].
There is a continual demand for optimization of spray parameters to ensure the required functional properties of fabricated coatings, particularly their resistance to different deterioration processes such as abrasion, corrosion or erosion. Although there are many studies on wear processes occurring in APS coatings, the problem of cavitation erosion (CE) has not been exhaustively investigated. Few definitions of this phenomenon are available, under which CE is described as a process of material degradation due to harmful fluid action initiated by pressure fluctuations in the liquid. When the liquid pressure drops, the vapor can grow, and as the pressure increases, the vapor bubbles implode. The resulting emission of shock waves and liquid-jet cause degradation of a solid material. Although the deterioration of materials is primarily mechanical in nature, it can be substantially accelerated by the presence of corrosion [14,15], solid particles [16,17,18] or both [16,19,20]. Furthermore, there is a wide choice of cavitation erosion resistance (CER) evaluation methods available in the literature. They pertain to the use of either standard test rigs under ASTM G32 (vibratory apparatus) [21,22] and ASTM G134 (cavitating liquid jet) [23,24], or non-standard solutions such as rotation discs and cavitation tunnel rigs [25,26,27]. However, the determination of complete cavitation curves by laboratory testing is usually very time-consuming. Therefore, various attempts have been made to shorten the testing time or reduce the number of test samples. For example, the process of CER estimation can be simplified by limiting the analysis to the incubation stage of erosion [28,29,30,31]. Overall, there is a demand for correlating the mechanical and functional properties of engineering materials with their CER. Different methods are employed to this end, starting from simple comparative analyses [32,33,34] and regression methods [4,35,36] to artificial neural networks [37,38]. Although comparative analyses into the relationship between plasma spray parameters and CER are reported in the literature [39,40], to our knowledge, no study to date has utilized the ANN to predict the CER of APS thermally sprayed coatings. Therefore, not only does this study investigate the relationship between spray process parameters and coating material properties, but it also makes use of ANN to preliminarily optimize the APS process parameters in order to obtain superior CER of the deposited ceramic coatings. Moreover, few studies have undertaken modelling of the CER of Al2O3-13 wt% TiO2 ceramic coatings.
This study is a novel attempt at optimizing atmospheric plasma spray parameters for Al2O3-13 wt% TiO2 ceramic coatings to ensure that they have the required functional properties, namely porosity and hardness. Particularly, in this study, we propose a new model and optimization procedure for spray parameters selection to obtain coatings with superior cavitation erosion resistance.
The relationship between technological parameters and properties and cavitation wear resistance of coatings is a complex problem, one that requires the use of non-linear models such as neural networks. The properties of thermally sprayed coatings are interdependent. Results of our previous studies, e.g., on Al2O3-13 wt% TiO2 ceramic coatings, show that while these coatings have low hardness, they also present high porosity and thus are more prone to cavitation damage. For this reason, when searching for optimal technological parameters to ensure required functional properties, a multi-criteria optimization algorithm should be used.
This work is a continuation of our previous studies on the optimization of structural materials and ceramic coatings to obtain the required functional properties [38,40,41]. According to the literature of the subject and authors of previous studies, to guarantee the superior resistance to CE of thermally deposited coatings, both high hardness and low porosity are required. These factors are beneficial for improving the APS coating’s uniformity and toughness and consequently facilitates the cavitation erosion resistance. This research proposes a model and optimization procedure for selecting spray parameters, ensuring coatings with specified functional properties (i.e., maximum hardness and cavitation erosion resistance and minimal porosity at the same time). Calculations made in this work use the results obtained in our previous study [40] on APS Al2O3-13 wt% TiO2 coatings.
The main goal of this study is to elaborate a neural model and algorithm for optimizing the porosity and hardness of Al2O3-13 wt% TiO2 coatings, and to thus ensure that they have superior cavitation erosion resistance. The original ANN procedure is essential for future selection of thermal spray process parameters, especially for the design of ceramic coatings with specified functional properties.

2. Materials and Methods

2.1. Atmospheric Plasma Spray Process Parameters

In this study Al2O3-13 wt% TiO2 ceramic coatings were deposited onto stainless steel grade AISI 316L by atmospheric plasma spray. The coatings were fabricated using different values of selected APS process parameters, namely the stand-off distance (h) and torch velocity (V) (see Table 1). As it was mentioned in the introduction, these are key parameters with respect to functional properties. To ensure reliable results, the plan of experiment was based on the 2k + 1 type design of experiment (DoE), according to [42]. The samples were 25 mm in diameter and 2 mm in thickness. The APS process was performed with a SG100 plasma torch (Praxair, Indianapolis, IN, USA) that was mounted on a 6-axis industrial robot, Fanuc 2000 IA. Two gases were used in plasma spraying: argon (to ignite the arc) and hydrogen (to improve electrical power of the arc). The deposition process was robotized to control all essential parameters and to ensure repeatability.

2.2. Investigation into the Functional Properties of Al2O3-13 wt% TiO2 Coatings

The hardness H (HV0.1) and porosity P (%) of the coatings were evaluated according to the procedures described in our previous papers [43,44,45], while the obtained results were discussed in detail in [40]. Cavitation erosion resistance (CER) tests were conducted according to the ASTM G32 standard [46] using the vibratory test rig described in [32,40]. Briefly, the CER tests were performed by the stationary specimen method, where cavitation was generated between the vibrating horn tip and the mounted sample surface. The gap between the horn tip and specimen surface was set equal to 1 mm. Submerged in distilled water, the horn tip vibrated with an amplitude of 50 µm and a frequency of 20 kHz. During the stated time intervals, the samples were weighed with an accuracy of 0.1 mg to estimate the material mass loss. Each sample test time lasted for 4 h. The experiments were conducted on the as-sprayed surfaces of Al2O3-13 wt% TiO2 coatings. The coatings had a roughness of Sa = 5.4–6.2 µm. The cavitation test was repeated three times for every coating deposited with the specified spray parameters, as given in Table 1. Although detailed CER results were reported in our previous study [40], this work presents original erosion rate vs. time curves, and the mean depth of erosion (MDE) was utilized for ANN modelling. The cavitation-worn specimens were compared with the undamaged surfaces by scanning electron microscopy in SEM-BSD mode.

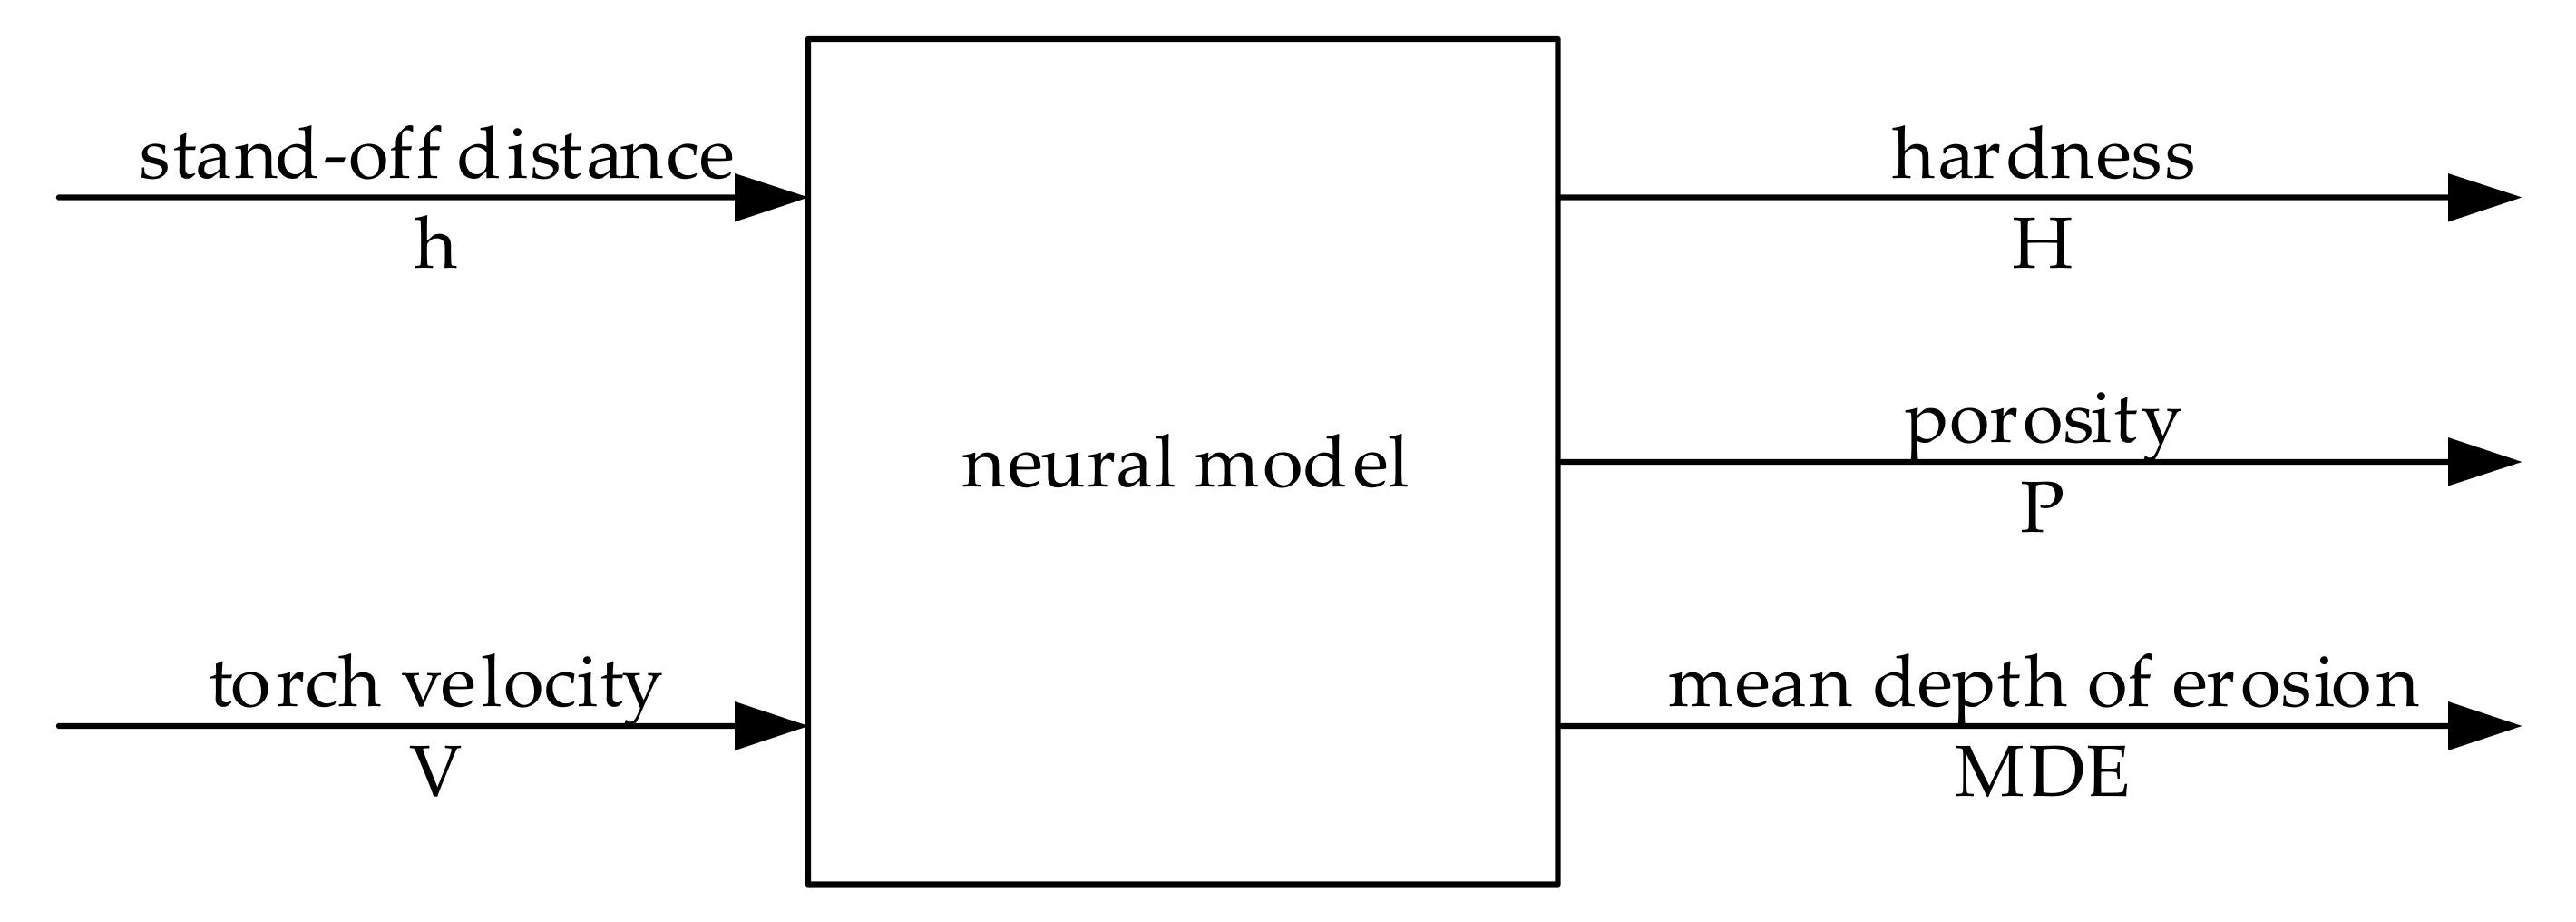
2.3. Modeling and Optimization Procedures—Artificial Neural Network (ANN) and Multi-Objective Genetic Algorithm (MOGA)

The neural model was developed using the Neural Network Toolbox in the MATLAB environment (2017a, MathWorks, Natick, MA, USA). A block diagram of the model is shown in Figure 1. In the model, we considered 2 input signals, i.e., the stand-off distance h (mm) and torch velocity V (mm∙s−1), and 3 output signals, i.e., the hardness (H; HV0.1), porosity (P) in percentage and mean depth of erosion (MDE) in µm.
The neural model has a layered structure and consists of an input layer, a hidden layer and an output layer. Each layer is assigned a specific number of neurons. For example, the model marked as 2-5-3 stands for a network with 2 input neurons, 5 hidden neurons and 3 output neurons. The number of signals used in modelling determines the number of input and output neurons. The selected number of hidden neurons is the decision-making parameter. In our study, we selected the number of hidden neurons in an experimental way by assessing the performance of networks with different structures. Details of this analysis are described in the Results and Discussion section. We applied a hyperbolic tangent activation function for the hidden layer and a linear activation function for the output layer. We used the Levenberg-Marquardt backpropagation algorithm to train the network. The maximum number of epochs to train the network was set equal to 40. Since our dataset was limited to n = 5 samples only, we decided to perform k-fold cross validation. We assumed that k = n = 5, so it was a type of the so-called leave-one-out cross validation [47]. According to the k-fold cross validation procedure, we divided the data set into 5 sub-sets, each of which consisted of 4 learning samples and 1 testing sample, which was different each time. Then the average model performance was calculated across all the sub-sets.
We used normalized root mean square error NRMSE (which is informally known as fit—and this name is used throughout the manuscript) as a model performance evaluation index. The model describes this phenomenon in a more detailed way if the fit value is higher. The fit index is calculated according to Equation (1)
fit = 1 | | y y ^ | | 2 | | y y ¯ | | 2 · 100 %
where y is the output signal (measured), y ^ is the predicted output signal and y ¯ is the mean output signal (measured).
Next, we used the neural model to find optimal APS thermal spray parameters. The process was optimized using a multi-objective genetic algorithm implemented in the Global Optimization Toolbox. The vector of decision variables x is described by Equation (2)
x = h , V T
The selection of these parameters is a multicriteria decision problem. The proposed method made it possible to find a Pareto front, i.e., a trade-off between several conflicting objectives; in this particular case it maximized the hardness and cavitation erosion resistance of the analyzed coatings and, at the same time, minimized their porosity. Our goal was to find the vector x*, which is described by Equation (3)
x * = h * , V * T ,
which would satisfy the inequality constraints according to Equations (4,5)
80 h 100
300 V 500
and would optimize the complex objective vector function J, which is given by Equation (6)
J x = max H x , min P x , min MDE x T
The set of x* forms the Pareto front if there exists no vector x that satisfies the constraints noted as Equations (4,5) and at the same time optimizes each element of the objective vector function given by Equation (6). The main MOGA parameters were as follows: the number of generations = 200; population size = 50; selection type = tournament; crossover probability = 0.8.

3. Results and Discussion

3.1. Properties and Cavitation Erosion Damage of the Coatings

Surface morphology and cross-sectional microstructure of the Al2O3-13 wt% TiO2 ceramic coatings are shown in Figure 2, while their hardness and porosity results are given in Table 2. CER results of the specimens are summarized in Figure 3, while cavitation-damaged surfaces are shown in Figure 4. The microstructure and as-sprayed surface morphology of the fabricated APS coatings is typical of thermally sprayed coatings [48,49,50]. An analysis of the images in Figure 2a,c clearly shows the presence of lamellar splats, porosity, unmelted feedstock powder particles of a semi-spherical shape and cracks in the ceramic lamellas. Every splat consisted of columnar crystals, which is characteristic of APS deposited ceramics [40,51,52]. The coating adhered well to the substrate, and continuous bonding between the stainless substrate and ceramic coatings was visible. The results demonstrated that the coating porosity and hardness depend on the applied process parameters. According to our previous study [40], the decrease in hardness results from a less compact microstructure and lower degree of well molten particles. The hardness of the coatings was in range of 885–1235 HV0.1 (see Table 2), while their porosity ranged from 5.59 to 2.3%. It can be concluded that the coatings were characterized by a relatively dense microstructure (see the cross sections in Figure 2b,d), which proves that the spray process parameters were selected and set in a proper range.
The quantitative cavitation results demonstrated that the highest CER was shown by the AT13-3 specimens (see Figure 3), which obtained the lowest erosion rate and MDE. According to our previous study [40], the AT13-3 coating presented a slightly higher mass loss than the stainless steel grade AISI 304, and their overall CER estimated by MDE was inferior to the reference steel. Moreover, the cavitation erosion periods obtained for ceramic coatings differed from those usually reported for the metallic materials. The damage process of all coatings was characterized by the maximal initial wear rate that decelerated after 10 min of testing. After approximately 2 h of testing, the wear rate decreased at a constant rate (see Figure 3a). On the contrary, bulk metal alloys presented the incubation, acceleration, deceleration and terminal periods of cavitation erosion [30]. On the other hand, during the initial stage of alumina–titania coating erosion, high material loss was noted; thus, the incubation period of erosion could be neglected. Moreover, in the further stages, the erosion rate rapidly decreased and then continuously slowed until the end of the test time.
The initial high wear rate of the coating material resulted from the “cleaning effect”, which relied on the removal of loose material, surface non-uniformities, material discontinuities (e.g., partly melted particles) and the spallation of splat-edges. This effect can be observed not only for ceramic coatings but also for HVOF (High Velocity Oxygen Fuel) nickel- and cobalt-based coatings and cold-sprayed MMC [32,43]. The lowest erosion rate was observed for the AT13-3 coating (see Figure 3a) and resulted from the low porosity of the coating and was a result of the following spraying parameters: h = 90 mm and V = 400 m/s (see Table 2). Material discontinuities such as pores acted as the centers of material removal. High resistance to cavitation erosion materials should present uniform microstructure with minimal porosity. Nonuniformities such as pores, act as an erosion center that can start and accelerate material deterioration. The applied plasma spraying parameters do not affect the cavitation erosion mechanism. The erosion process was dominated by the removal of fragmented splats progressing into more deeply located lamellas and was accompanied by pit formation (see Figure 4a,b). The presence of structural non-uniformities in the coatings accelerated the wear process and material removal, ending up with crater formation and exposition of the stainless steel substrate. The cavitation erosion behavior of all deposited specimens relied on brittle fractures propagating through the columnar structure of the lamellas (see Figure 4c,d). Although in the previously mentioned work [40] the relationship between spray parameters and cavitation erosion indicators could not be calculated mathematically, this study used the ANN to solve this problem.

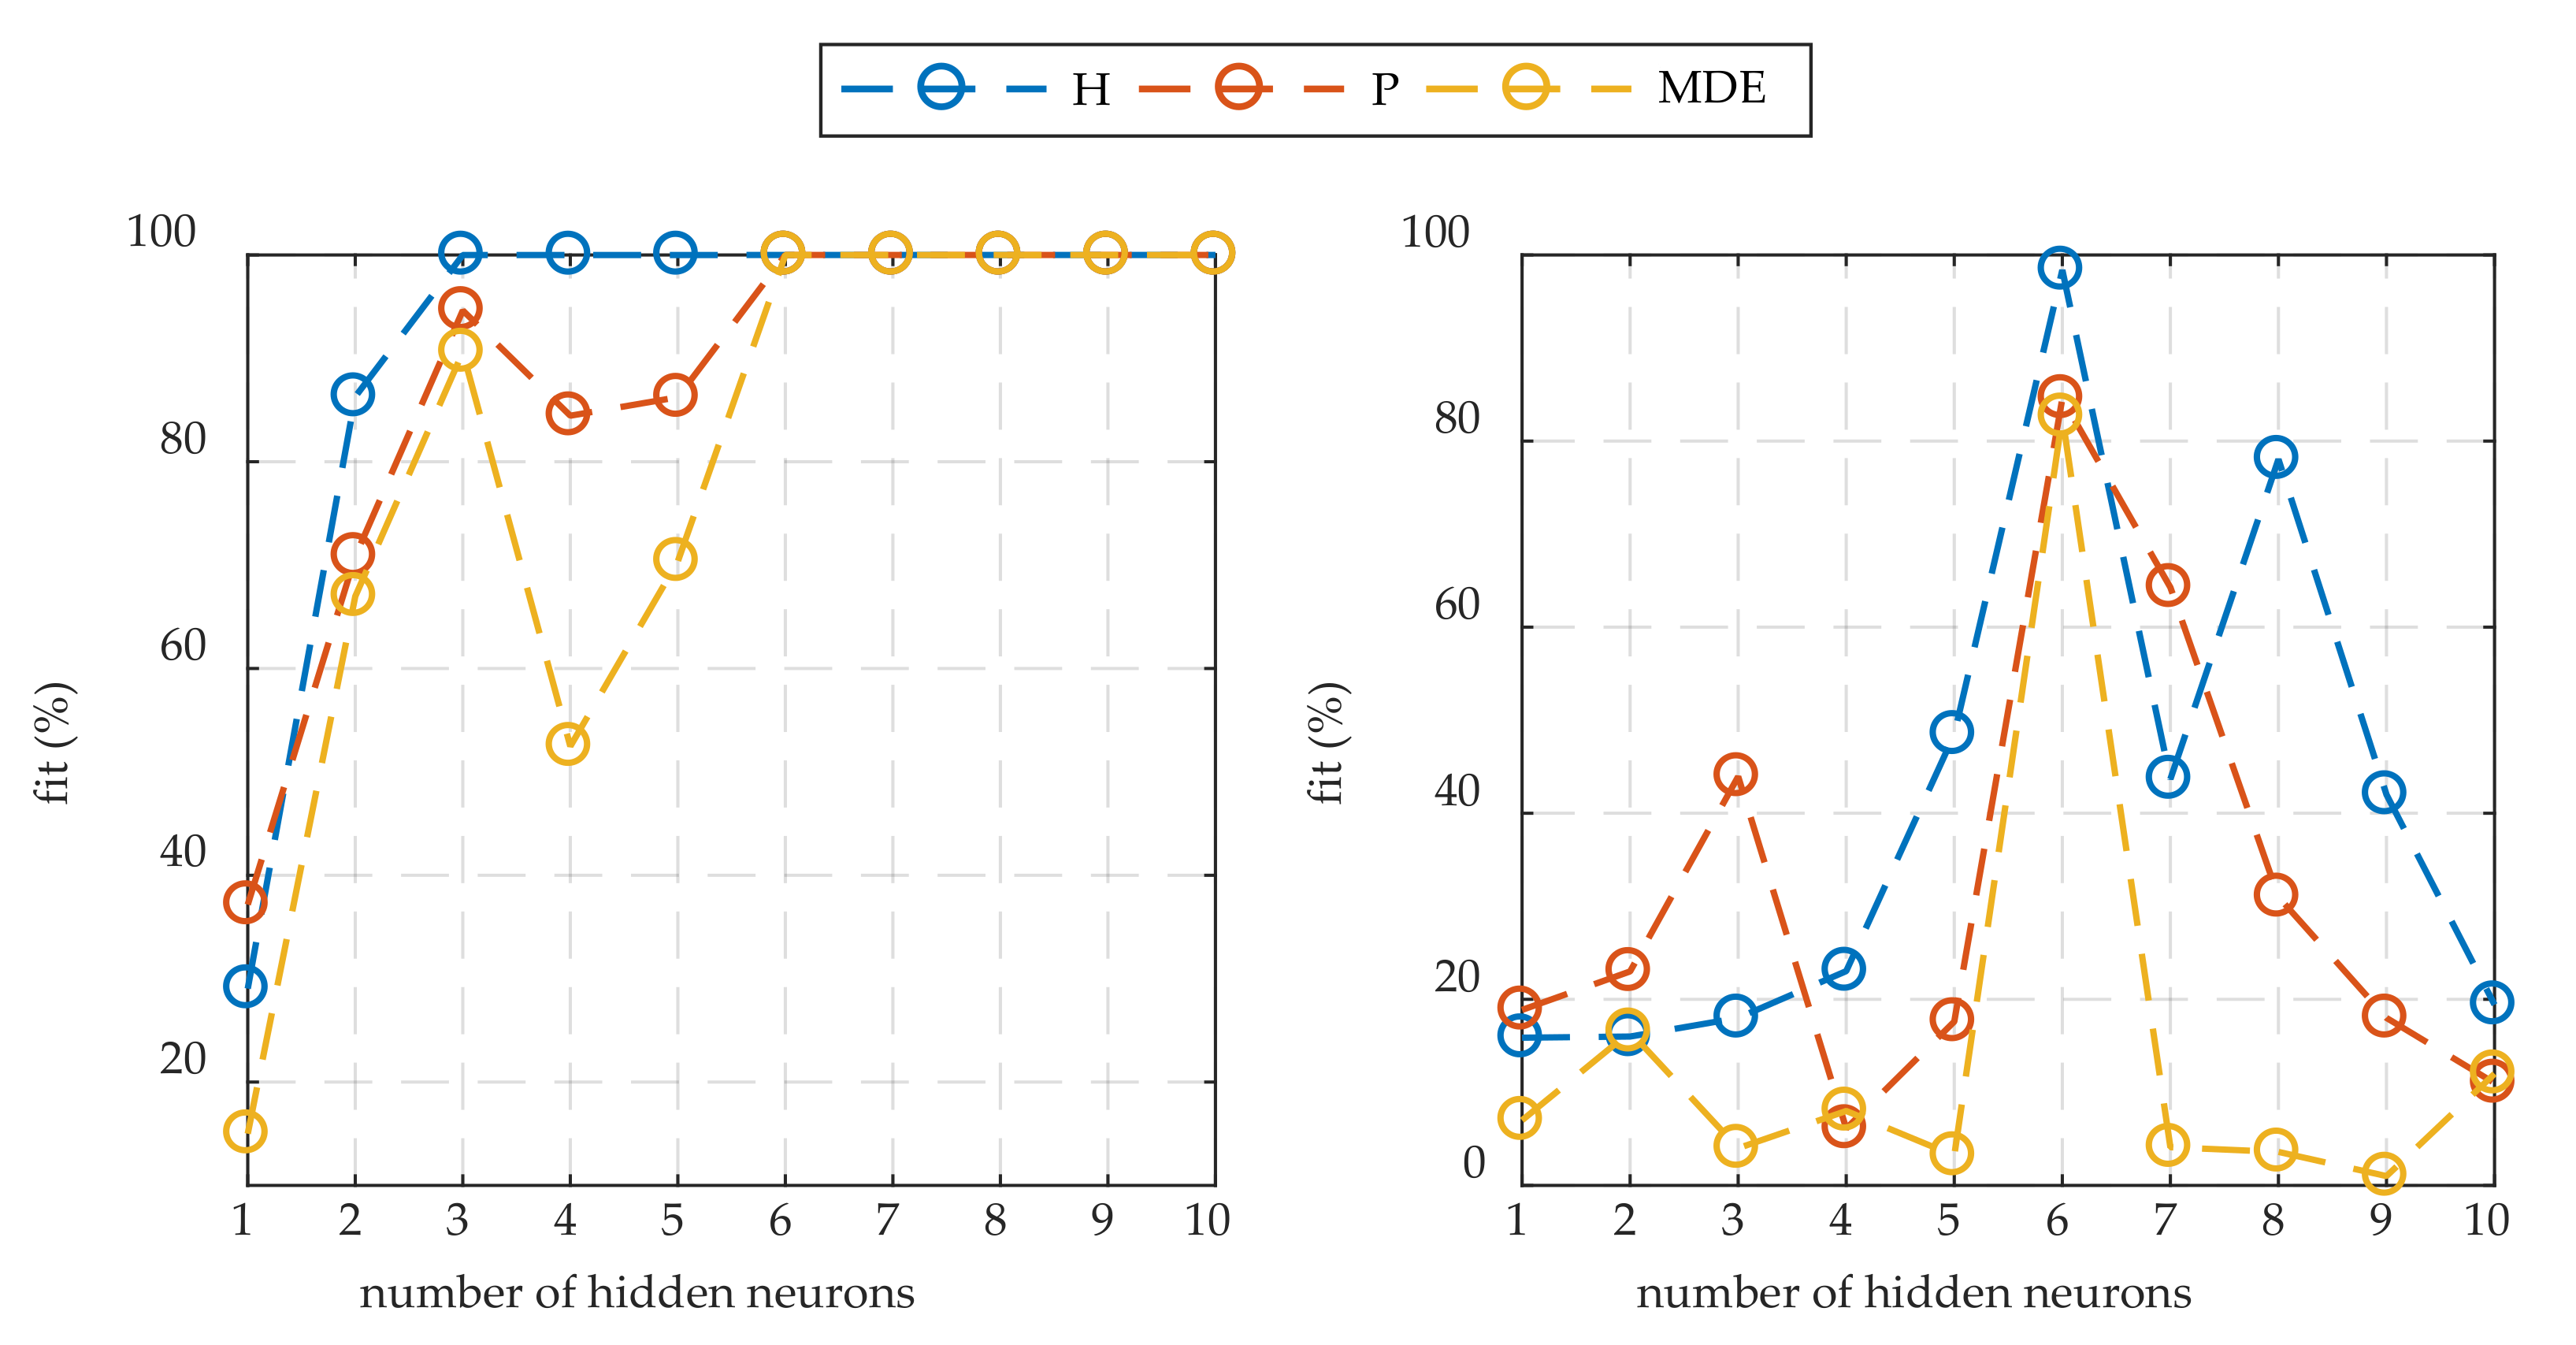
3.2. Model Development and Process Optimization

Figure 5 shows the variations in the fit index depending on the number of neurons in the hidden layer. The fit index was calculated separately for every output network. Considering the learning dataset, it can be seen that the network with six or more hidden neurons perfectly matched the measurement data. In the case of the testing dataset, the results were more complicated. On the whole, the network had the best fit to the hardness (H) and the worst fit to the mean depth of erosion (MDE). Taking into account the results for both the learning and testing datasets, we chose the network with the structure 2-6-3, i.e., with six neurons in the hidden layer. Table 3 shows the fit index values for the selected network.
As far as we know, no previous research has investigated the use of ANNs in modelling the hardness, porosity and cavitation wear of APS thermally sprayed coatings. It is, therefore, difficult to provide a basis for comparison with our modelling results. Under the adopted modelling procedure, obtained results indicate that the model yielded acceptable accuracy [47]. Then, we investigated the response of the ANN model to various input signal values. The stand-off distance h was changed in the range of 80–100 mm with a step of 1 mm, while the velocity torch ranged from 300 to 500 mm∙s−1 and was changed with a step of 10 mm∙s−1. Figure 6, Figure 7 and Figure 8 show simulation results.
An analysis of the data in Figure 6, Figure 7 and Figure 8 demonstrates it is difficult to determine manually the values of the stand-off distance h and torch velocity V that will yield the optimal value of the objective function J, which is described by Equation (6). Using MOGA, we found a set of h and V that forms a Pareto front (see Figure 9). The Pareto front is a popular tool for solving various multi-objective optimization problems; it has also been successfully used for optimizing coating structure [53,54]. For clarity, the optimal solutions are shown as contour plots (see Figure 10, Figure 11 and Figure 12) and are listed in Table 4. Out of all Pareto optimal solutions, the highest hardness and, at the same time, the lowest mean depth of erosion (i.e., 1377 HV0.1 and 10.1 µm, respectively) were obtained with h = 86.9 mm, V = 304 mm∙s−1 and h = 87.3 mm, V = 304 mm∙s−1; while the lowest porosity of 2.28% could be observed with h = 80 mm, V = 371 mm∙s−1 and h = 80.4 mm, V = 357 mm∙s−1. Summing up, the proposed procedure is essential for future selection of thermal spray process parameters, especially for the design of ceramic coatings with specified functional properties.

4. Conclusions

This study proposed the original neural model and algorithm for optimizing atmospheric plasma spray (APS) process parameters to obtain Al2O3-13 wt% TiO2 ceramic coatings with the required minimal porosity and maximum hardness, and thus with the highest cavitation erosion resistance (CER). The results of the study lead to the following conclusions:
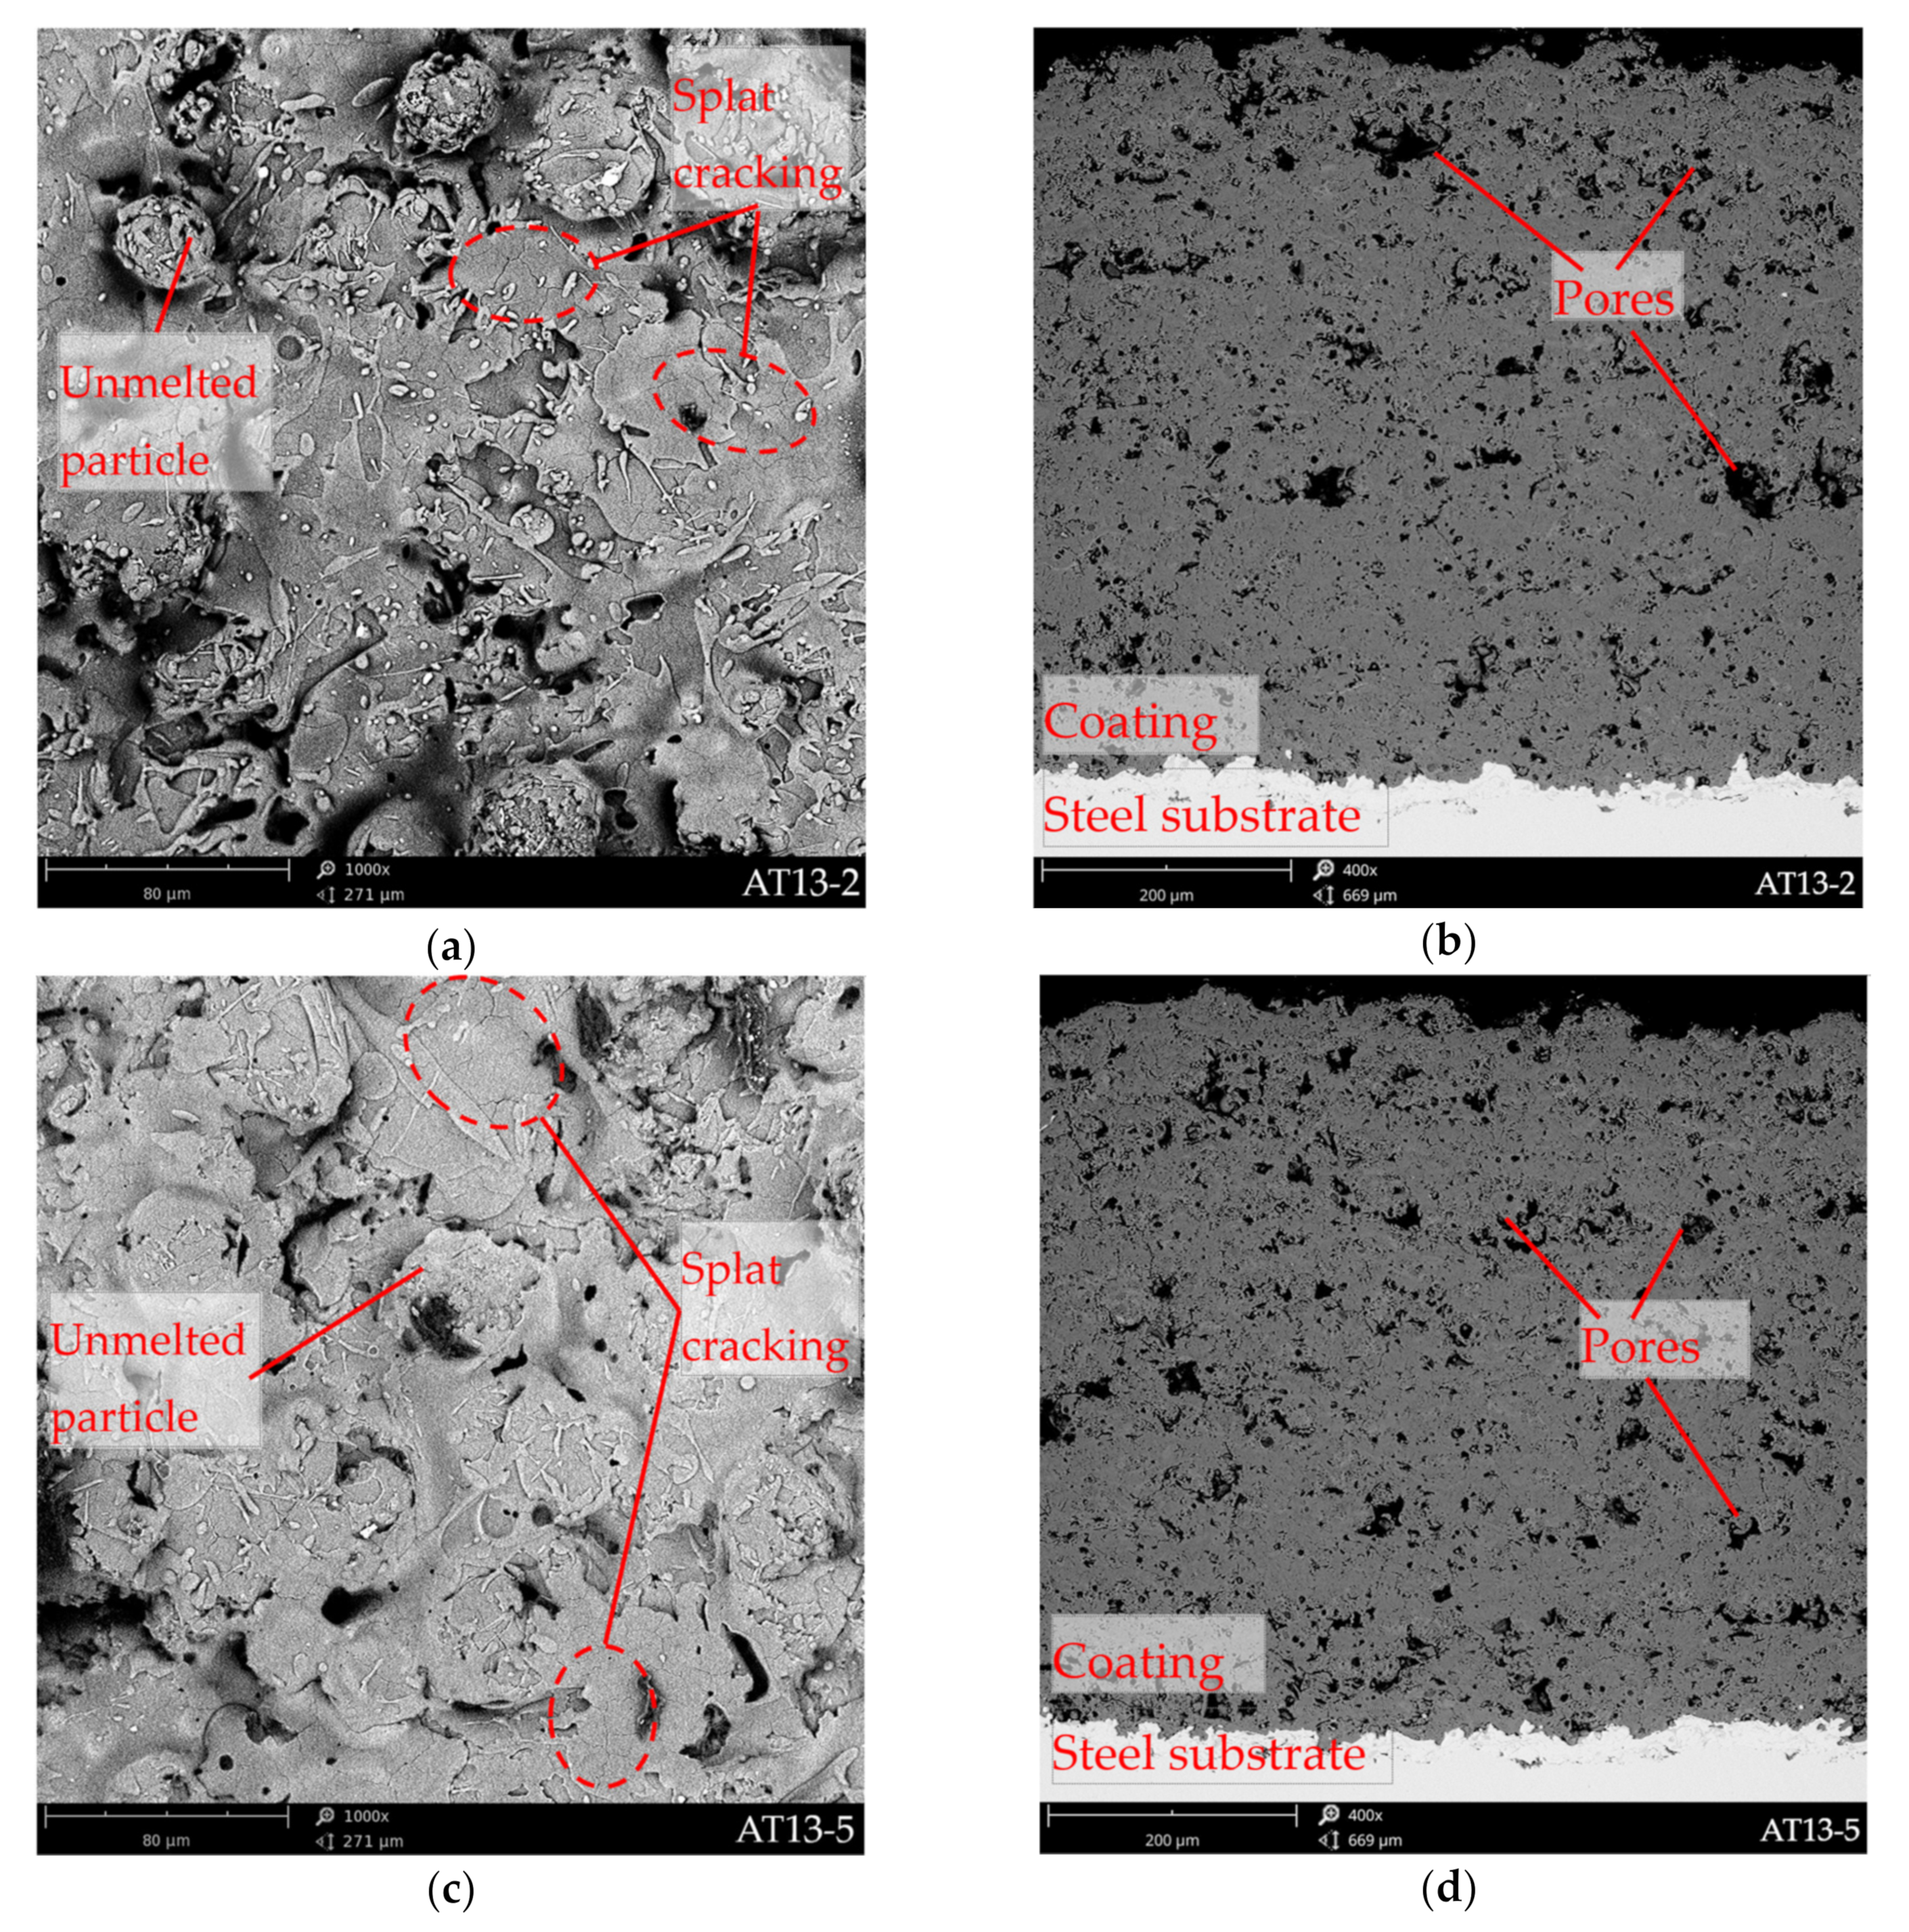
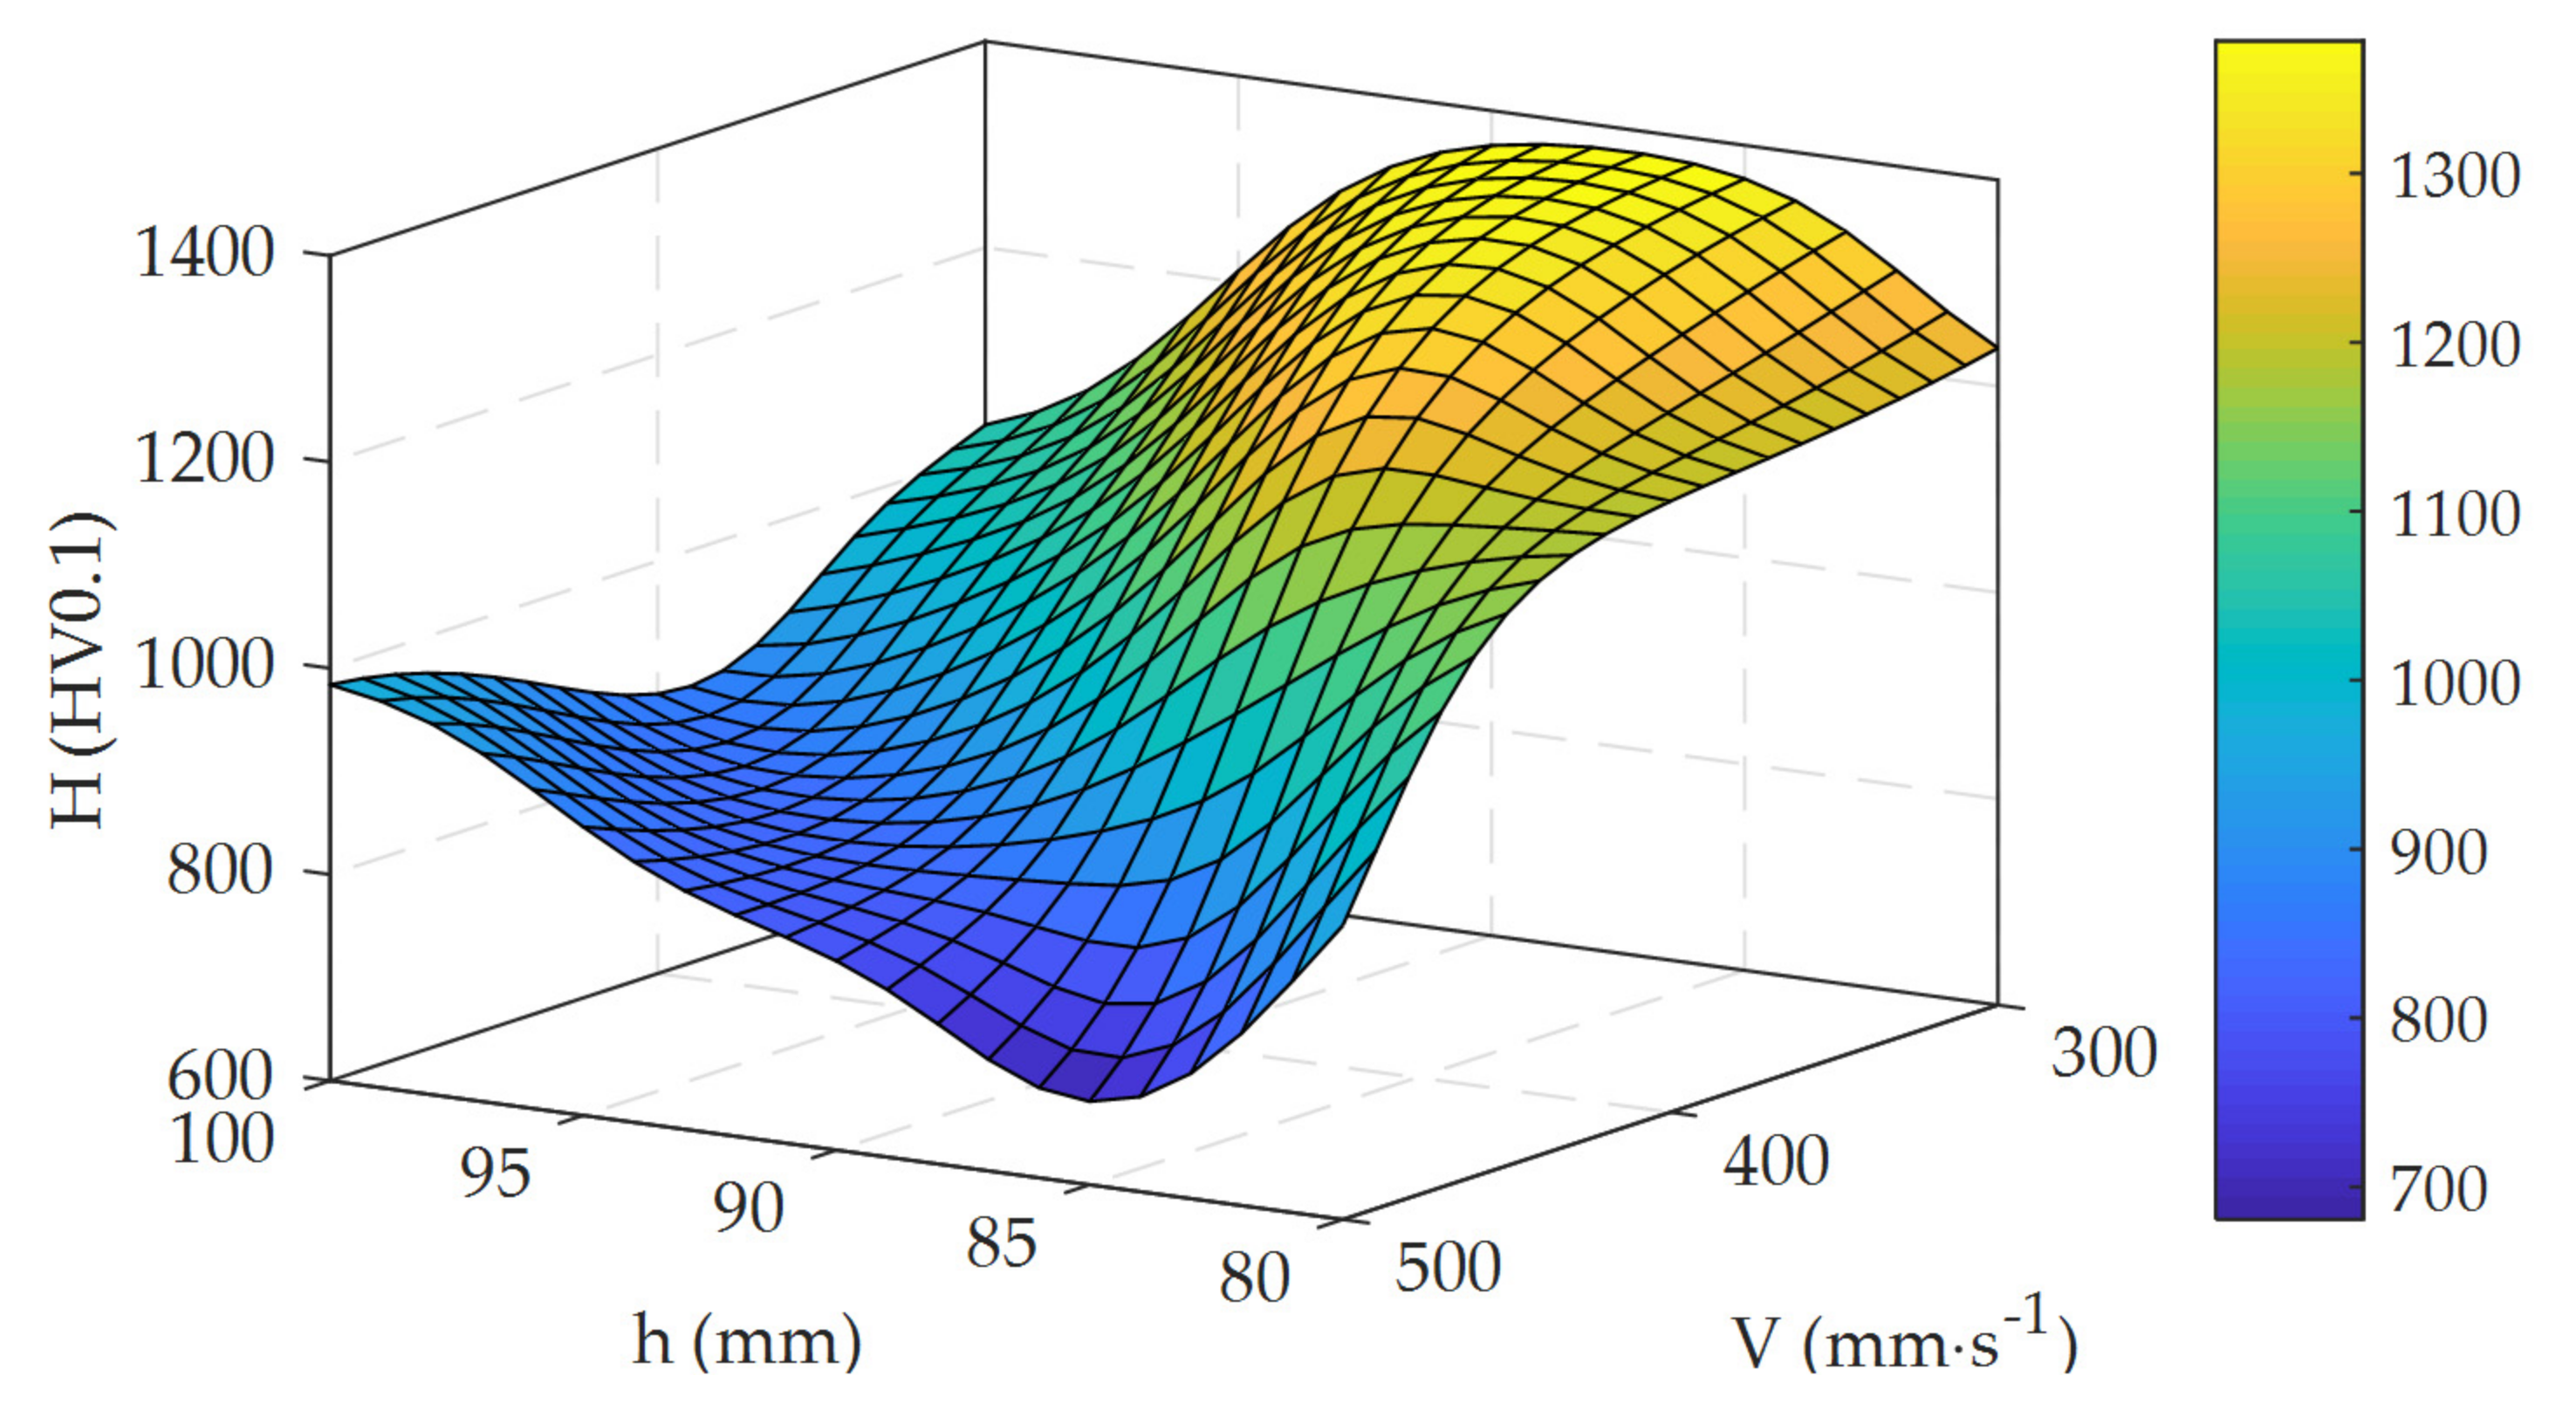
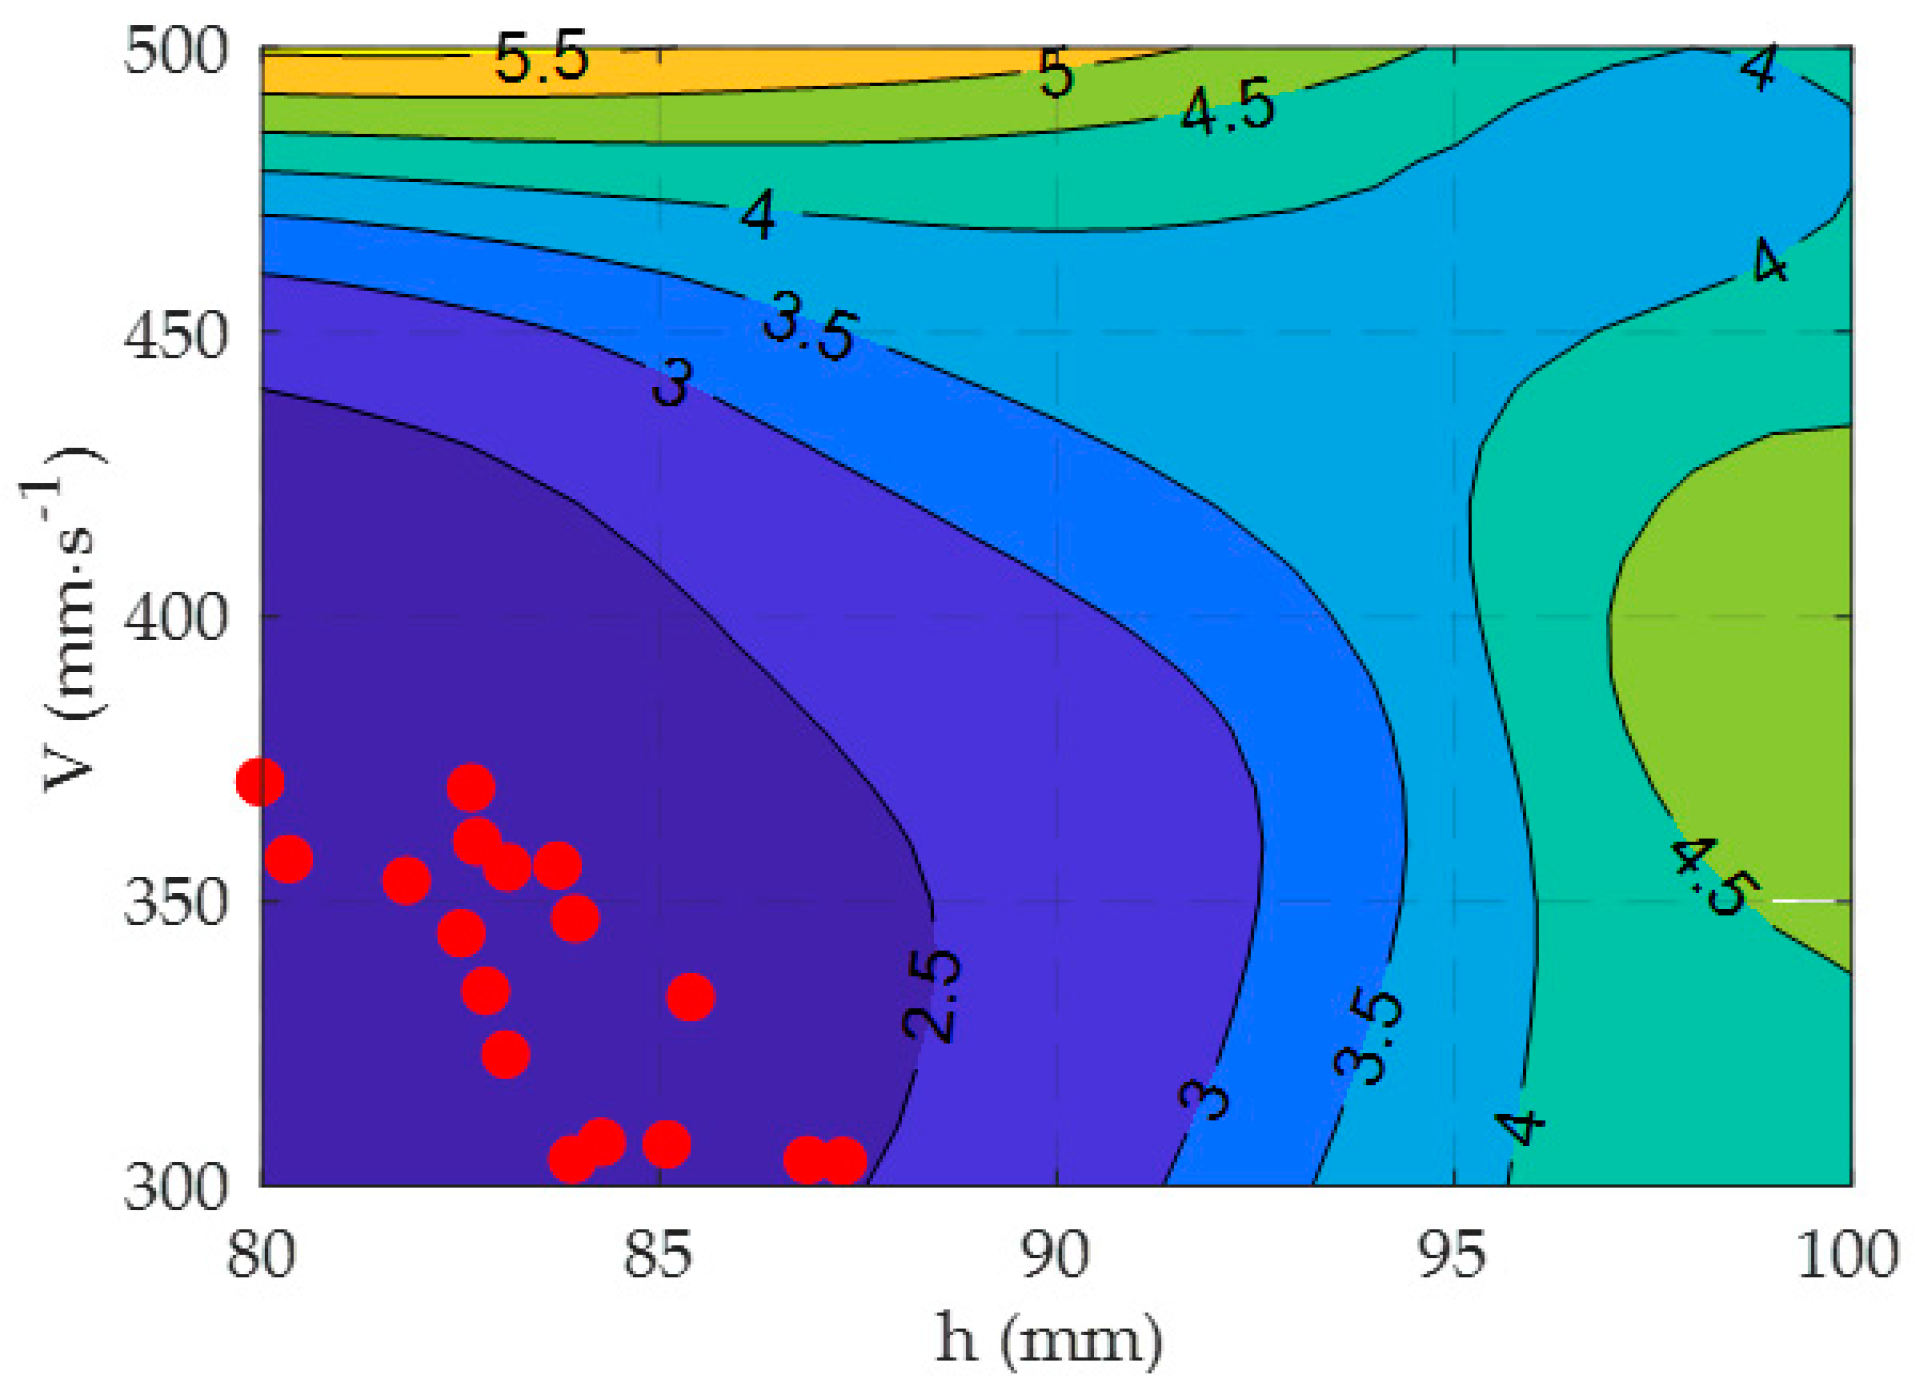
  • The APS ceramic coatings exhibit a relatively dense lamellar microstructure with initial cracking of the lamellas, and they also contain unmelted feedstock powder and splats built up from columnar grains. The hardness of the coatings ranges from 885 HV0.1 to 1235 HV0.1 and their porosity ranges from 5.59% to 2.30%. The hardness and porosity of the coatings depend on the ASP process parameters.
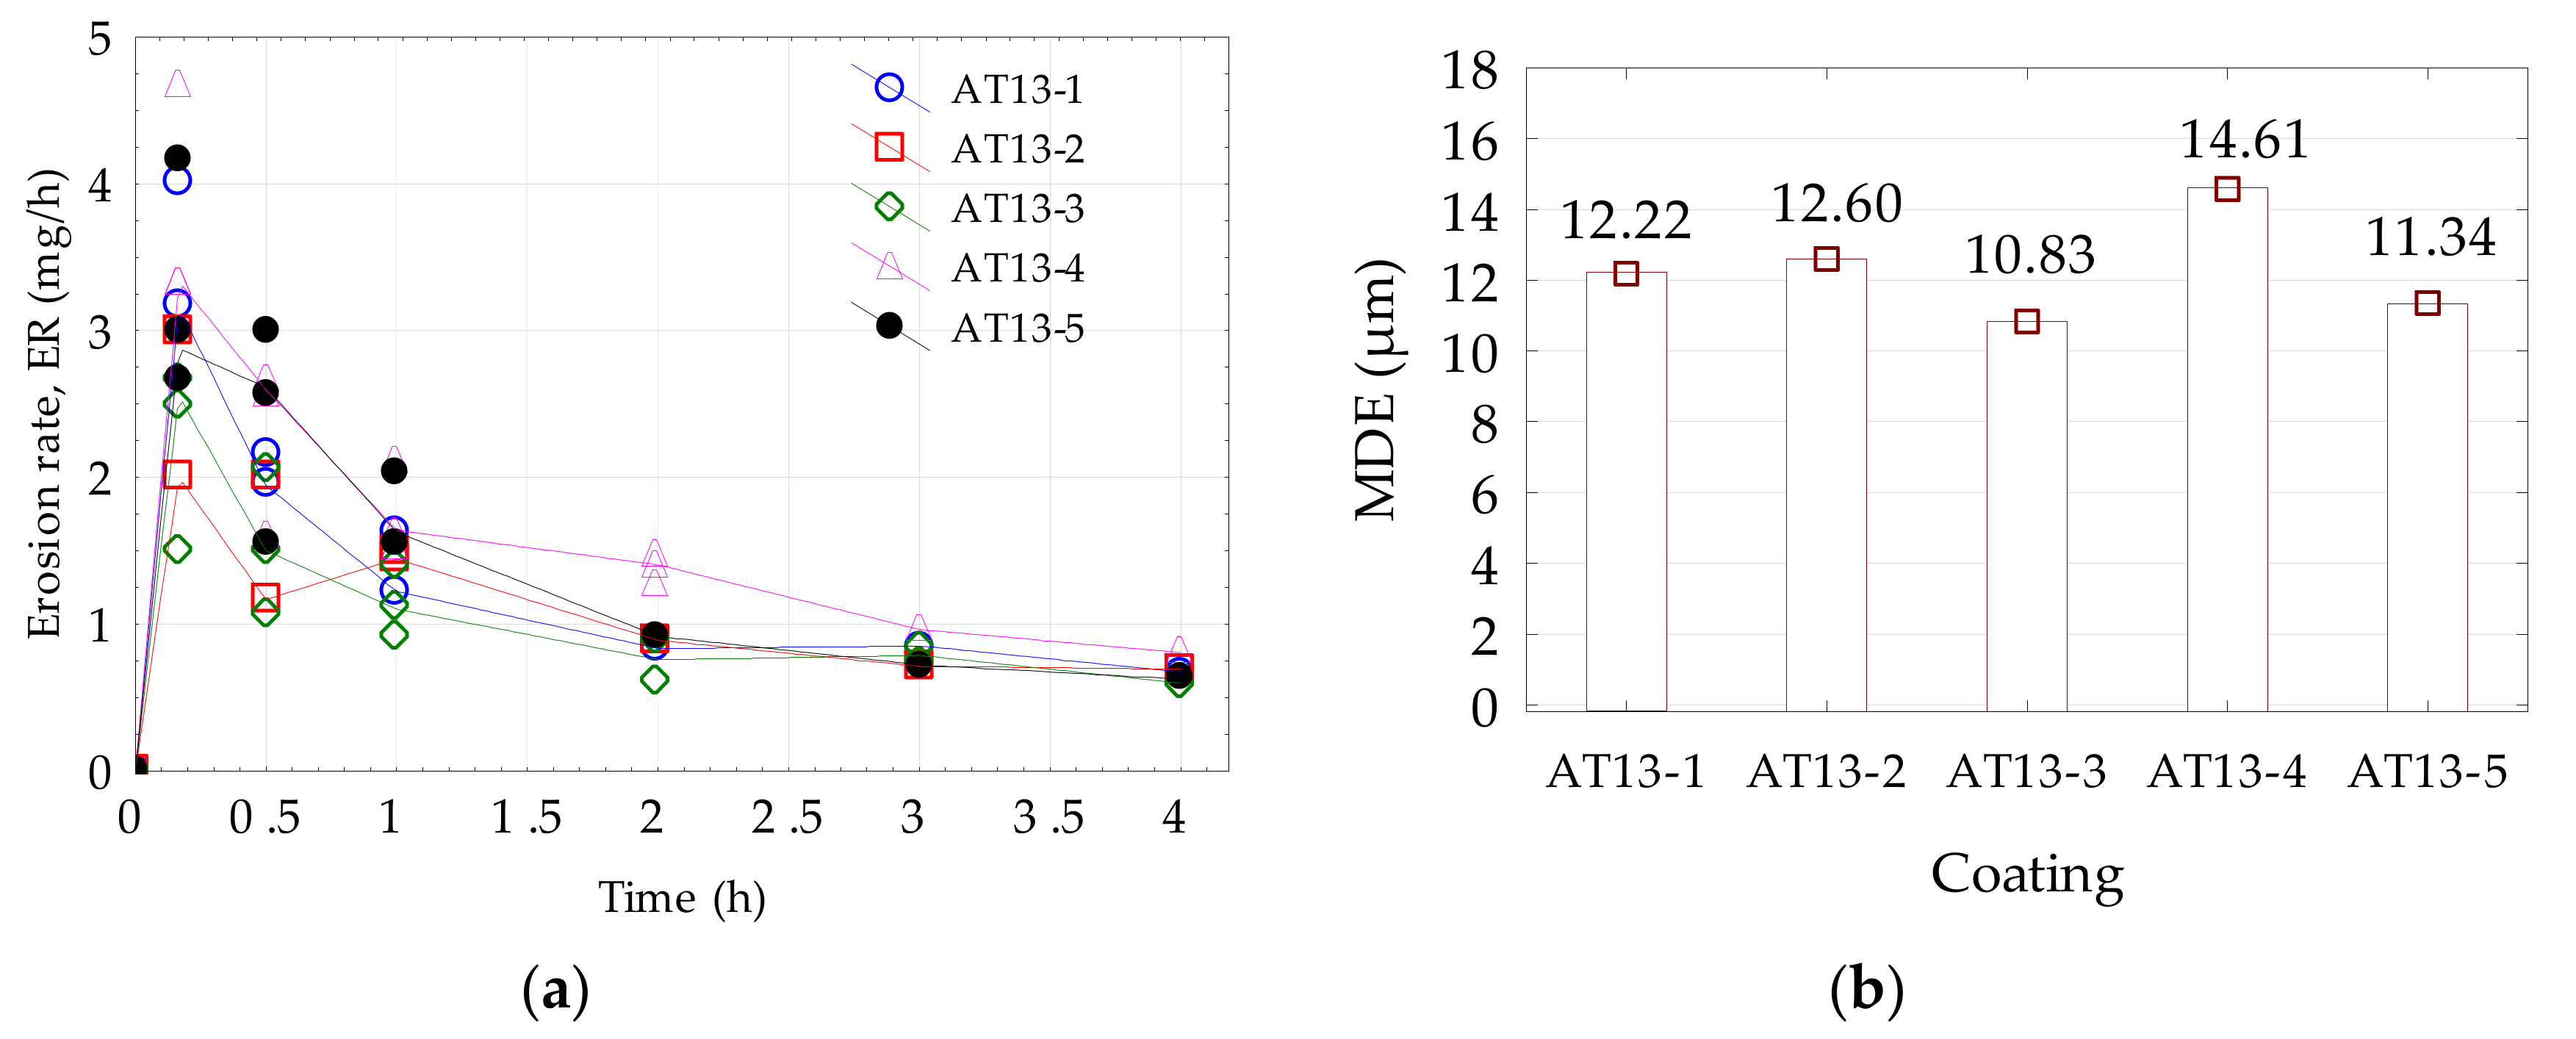
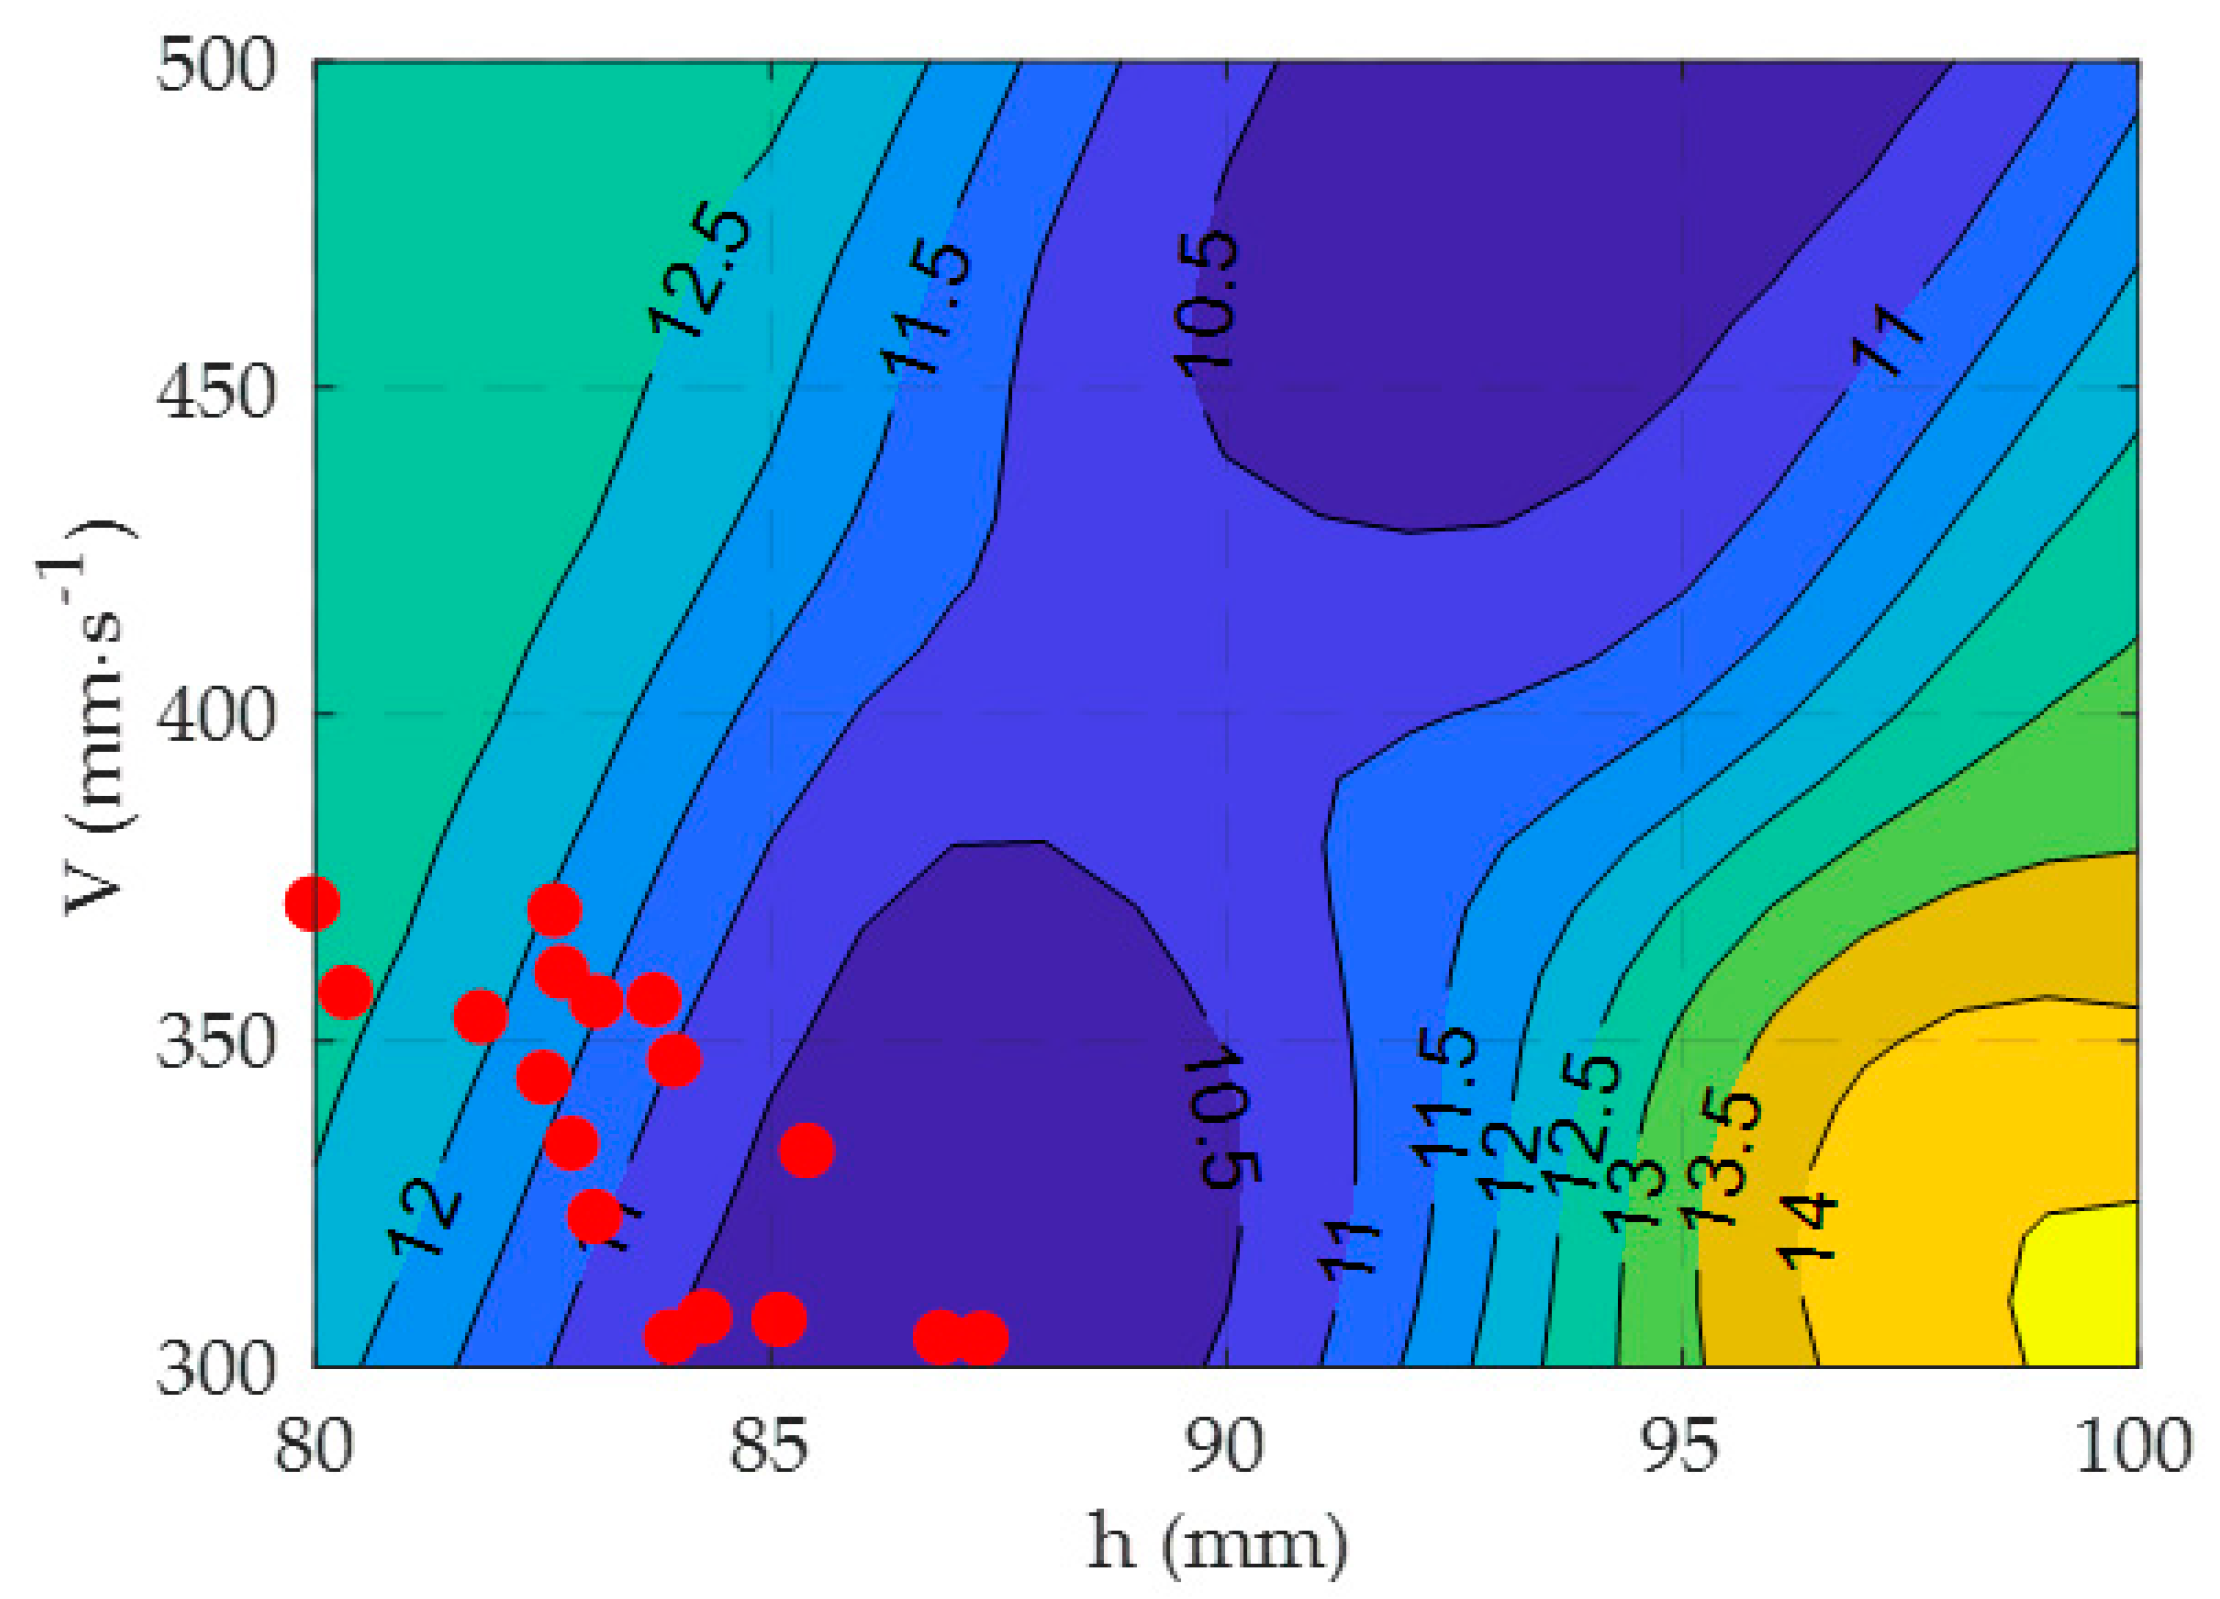
  • The AT13-3 specimen deposited with h = 90 mm and V = 400 m/s exhibits the highest CER resistance. The cavitation erosion mechanism identified for the coatings relies on brittle fracture propagating through the columnar grains; furthermore, it is accelerated by the presence of coating non-uniformities such as pores, cracks and particles of unmelted material.
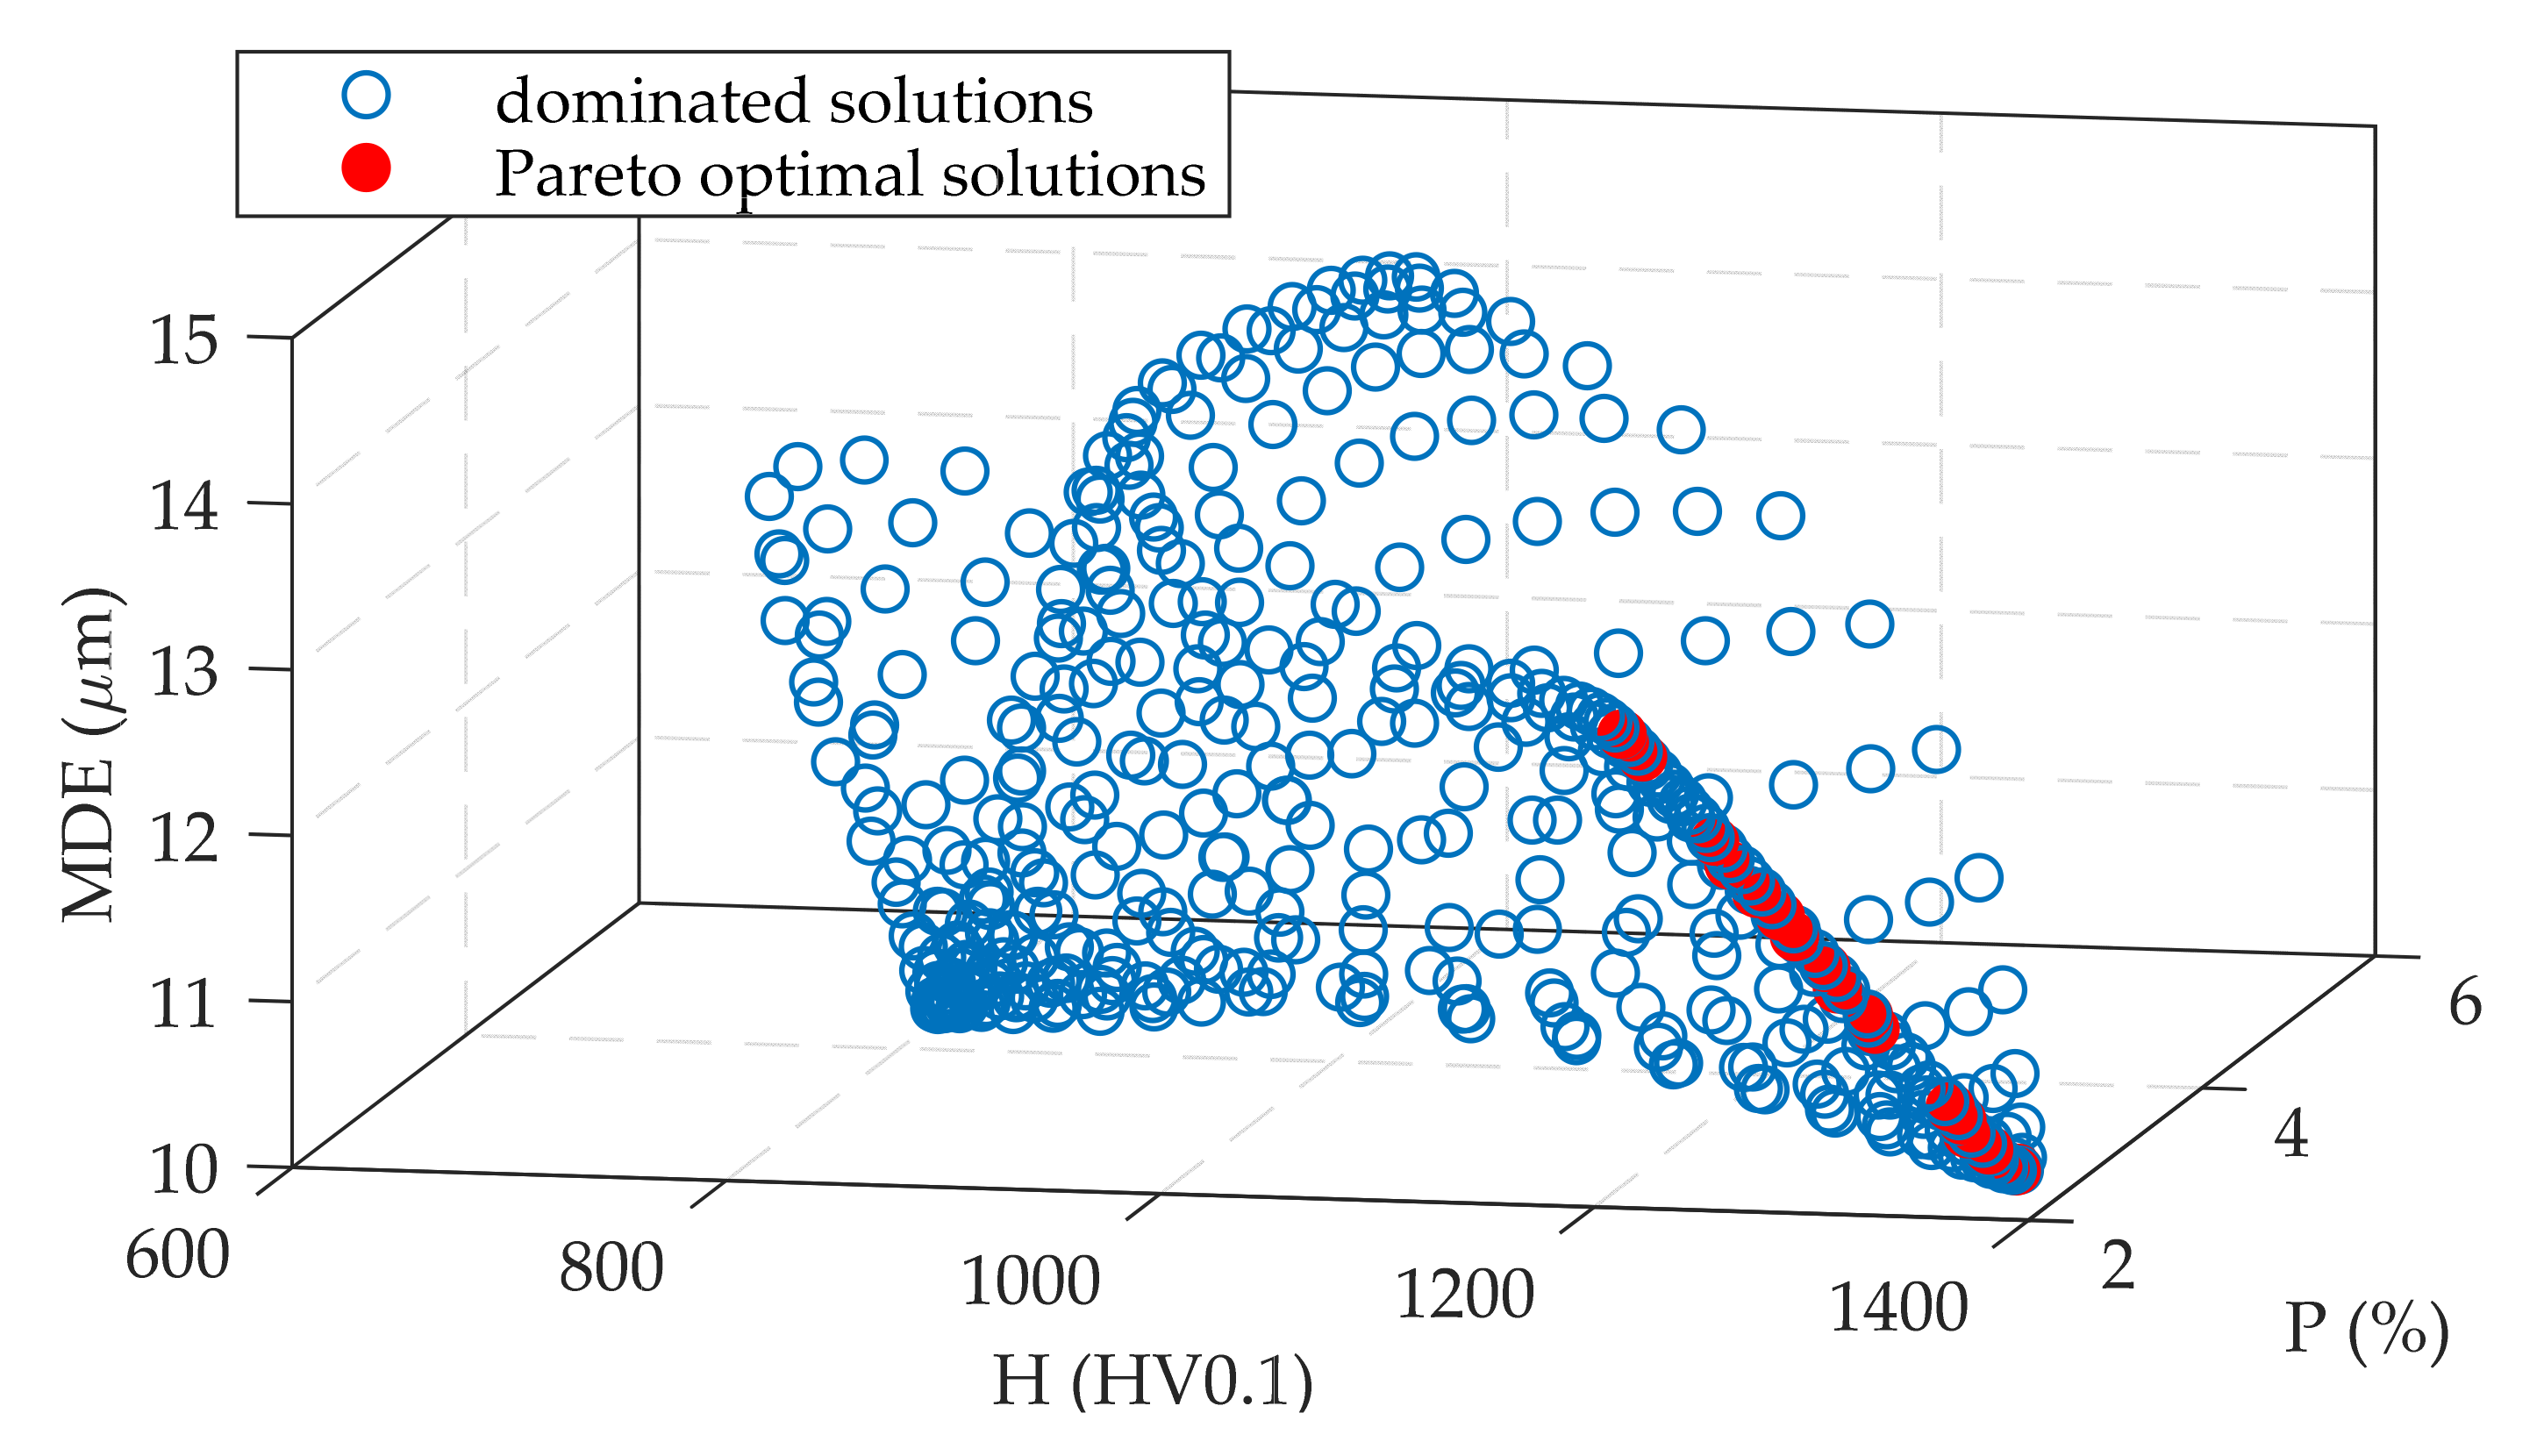
  • The selection of APS process parameters to obtain coatings with the required properties is a multicriteria decision problem. The fusion of artificial neural network and genetic algorithm is a novel approach. This promising method can be employed for solving complex problem such as the selection of spray parameters in the design of ceramic coatings with specified hardness, porosity and superior cavitation erosion resistance.
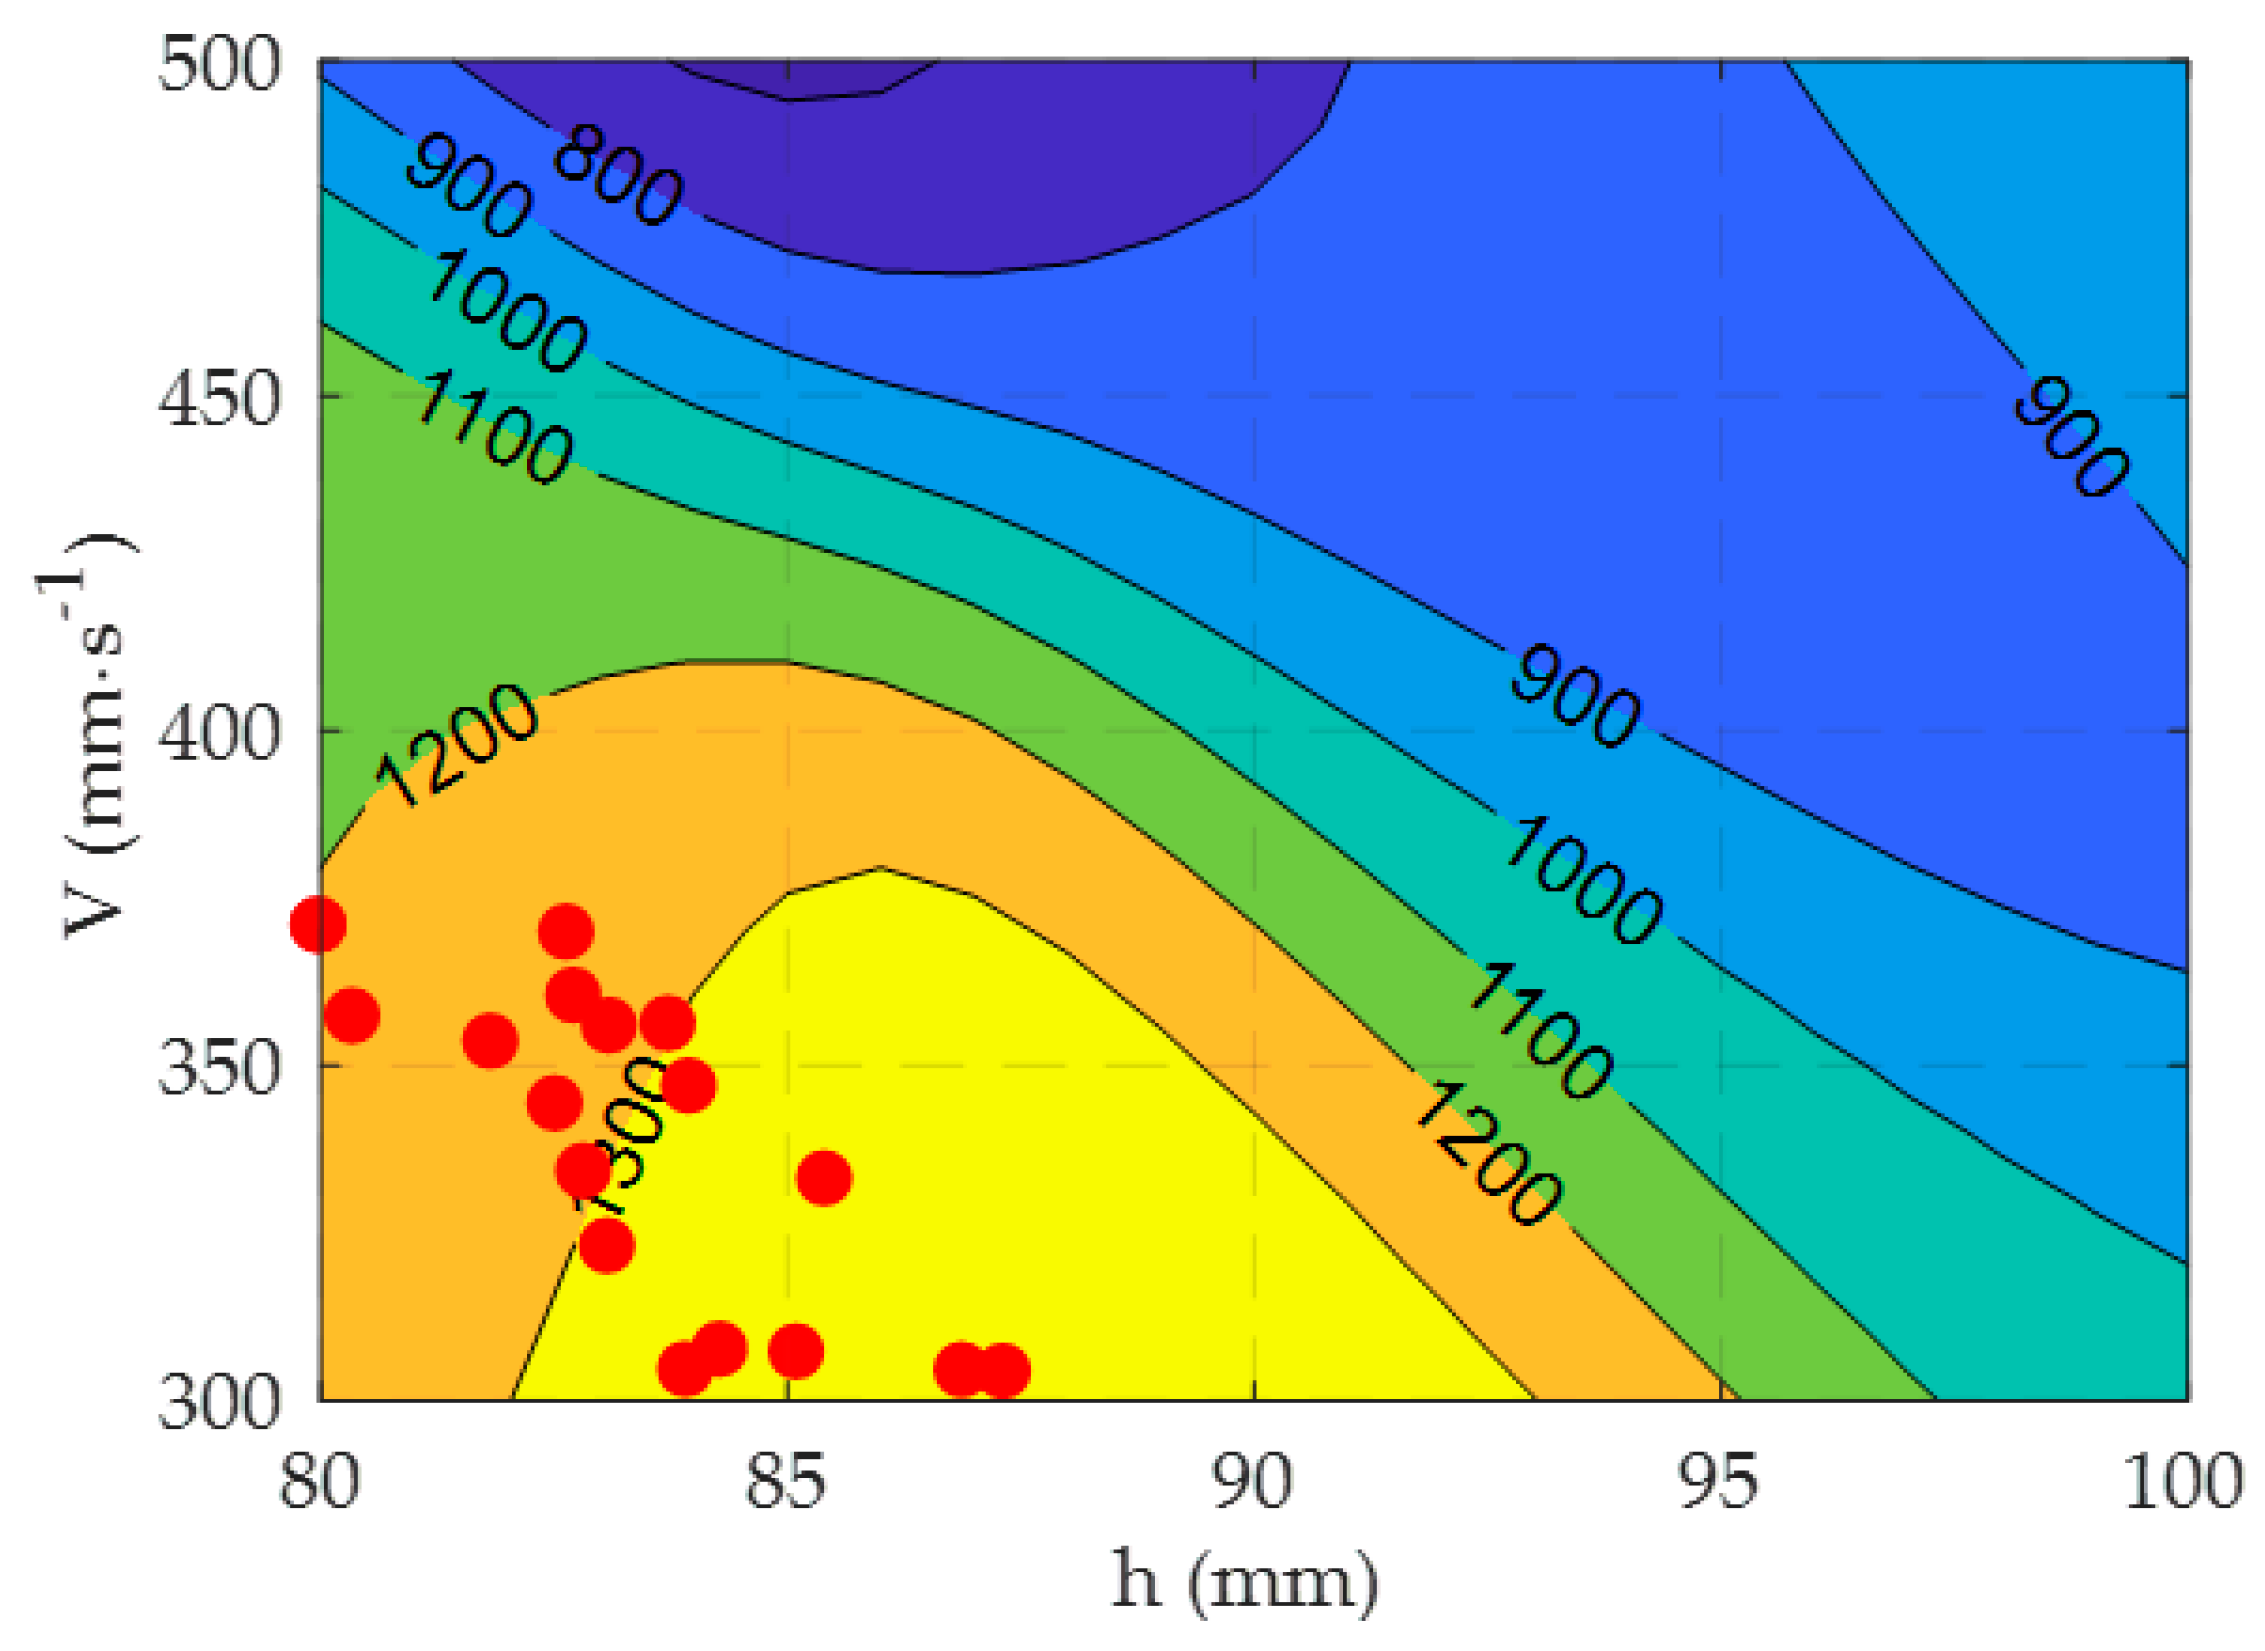
  • By applying multi-objective optimization, we found a set of Pareto-optimal solutions. Summing up the optimization results, the highest hardness and, at the same time, the lowest mean depth of erosion, i.e., 1377 HV0.1 and 10.1 µm, respectively, were obtained with h = 86.9 mm, V = 304 mm∙s−1 and h = 87.3 mm, V = 304 mm∙s−1, while the lowest porosity of 2.28% was obtained with h = 80 mm, V = 371 mm∙s−1 and h = 80.4 mm, V = 357 mm∙s−1. These parameters are optimal for APS Al2O3-13 wt% TiO2 ceramic coatings.

Author Contributions

Conceptualization, M.S., M.A. and L.Ł.; methodology, M.S., M.A. and L.Ł.; software, M.A.; validation, M.S., M.A. and L.Ł.; formal analysis, M.S., M.A., L.Ł., M.W. and M.M.; investigation, M.S., M.A. and L.Ł.; resources, M.S., M.A., L.Ł., M.W. and M.M.; data curation, M.A.; writing—original draft preparation, M.S., M.A. and L.Ł.; writing—review and editing, M.S. and M.A.; visualization, M.S. and M.A.; supervision, M.S., M.A. and L.Ł.; project administration, M.S.; funding acquisition, M.S. and M.A. All authors have read and agreed to the published version of the manuscript.

Funding

The research was financed in the framework of the project Lublin University of Technology—Regional Excellence Initiative, funded by the Polish Ministry of Science and Higher Education (contract No. 030/RID/2018/19).

Conflicts of Interest

The authors declare no conflict of interest.

References

  1. Pawlowski, L. The Science and Engineering of Thermal Spray Coatings, 2nd ed.; Wiley: Chichester, UK; Hoboken, NJ, USA, 2008; ISBN 978-0-471-49049-4. [Google Scholar]
  2. Principles of Thermal Spraying—Plasma-Spray Coating—Wiley Online Library. Available online: https://onlinelibrary.wiley.com/doi/10.1002/9783527614851.ch02 (accessed on 17 September 2020).
  3. Boulos, M.I.; Fauchais, P.L.; Pfender, E. Handbook of Thermal Plasmas; Springer International Publishing: Berlin/Heidelberg, Germany, 2019. [Google Scholar]
  4. Lugscheider, E.; Barimani, C.; Eckert, P.; Eritt, U. Modeling of the APS plasma spray process. Comput. Mater. Sci. 1996, 7, 109–114. [Google Scholar] [CrossRef]
  5. Guessasma, S.; Montavon, G.; Coddet, C. Modeling of the APS plasma spray process using artificial neural networks: Basis, requirements and an example. Comput. Mater. Sci. 2004, 29, 315–333. [Google Scholar] [CrossRef]
  6. Sahab, A.R.M.; Saad, N.H.; Kasolang, S.; Saedon, J. Impact of Plasma Spray Variables Parameters on Mechanical and Wear Behaviour of Plasma Sprayed Al2O3 3%wt TiO2 Coating in Abrasion and Erosion Application. Procedia Eng. 2012, 41, 1689–1695. [Google Scholar] [CrossRef] [Green Version]
  7. Aruna, S.T.; Balaji, N.; Shedthi, J.; Grips, V.K.W. Effect of critical plasma spray parameters on the microstructure, microhardness and wear and corrosion resistance of plasma sprayed alumina coatings. Surf. Coat. Technol. 2012, 208, 92–100. [Google Scholar] [CrossRef]
  8. Yugeswaran, S.; Selvarajan, V.; Vijay, M.; Ananthapadmanabhan, P.V.; Sreekumar, K.P. Influence of critical plasma spraying parameter (CPSP) on plasma sprayed Alumina–Titania composite coatings. Ceram. Int. 2010, 36, 141–149. [Google Scholar] [CrossRef]
  9. Michalak, M.; Łatka, L.; Sokołowski, P.; Niemiec, A.; Ambroziak, A. The Microstructure and Selected Mechanical Properties of Al2O3 + 13 wt % TiO2 Plasma Sprayed Coatings. Coatings 2020, 10, 173. [Google Scholar] [CrossRef] [Green Version]
  10. Łatka, L.; Niemiec, A.; Michalak, M.; Sokołowski, P. Tribological Properties of Al2O3 + TiO2 Coatings Manufactured by Plasma Spraying. Bimon. Tribol. 2019, 283, 19–24. [Google Scholar] [CrossRef]
  11. Chochowski, A.; Obstawski, P. The use of thermal-electric analogy in solar collector thermal state analysis. Renew. Sustain. Energy Rev. 2017, 68, 397–409. [Google Scholar] [CrossRef]
  12. Aleksiejuk, J.; Chochowski, A.; Reshetiuk, V. Analog model of dynamics of a flat-plate solar collector. Sol. Energy 2018, 160, 103–116. [Google Scholar] [CrossRef]
  13. Salat, R.; Awtoniuk, M. Black box modeling of PIDs implemented in PLCs without structural information: A support vector regression approach. Neural Comput. Appl. 2015, 26, 723–734. [Google Scholar] [CrossRef] [Green Version]
  14. Chmiel, J.; Jasionowski, R.; Zasada, D. Cavitation erosion and corrosion of pearlitic gray cast iron in non-standardized cavitation conditions. Solid State Phenom. 2015, 225, 19–24. [Google Scholar] [CrossRef]
  15. Cui, Z.D.; Man, H.C.; Cheng, F.T.; Yue, T.M. Cavitation erosion–corrosion characteristics of laser surface modified NiTi shape memory alloy. Surface Coat. Technol. 2003, 162, 147–153. [Google Scholar] [CrossRef]
  16. Amarendra, H.J.; Chaudhari, G.P.; Nath, S.K. Synergy of cavitation and slurry erosion in the slurry pot tester. Wear 2012, 290–291, 25–31. [Google Scholar] [CrossRef]
  17. Wang, Y.; Wu, J.; Ma, F. Cavitation–silt erosion in sand suspensions. J. Mech. Sci. Technol. 2018, 32, 5697–5702. [Google Scholar] [CrossRef]
  18. Su, K.; Wu, J.; Xia, D. Classification of regimes determining ultrasonic cavitation erosion in solid particle suspensions. Ultrason. Sonochem. 2020, 68, 105214. [Google Scholar] [CrossRef]
  19. Da Silva, F.N.; de Oliveira, P.M.; Araújo, N.M.d.F.T.d.S.; de Carvalho Filho, E.T.; da Cunha, J.D.; da Silva, D.R.; de Medeiros, J.T.N. Corrosion-cavitation-erosion: Surface morphology study of a carbon steel in a multiphasic saline bath. Matéria 2019, 24. [Google Scholar] [CrossRef]
  20. Liang, L.; Pang, Y.; Tang, Y.; Zhang, H.; Liu, H.; Liu, Y. Combined wear of slurry erosion, cavitation erosion, and corrosion on the simulated ship surface. Adv. Mech. Eng. 2019, 11, 1687814019834450. [Google Scholar] [CrossRef] [Green Version]
  21. Tocci, M.; Pola, A.; Girelli, L.; Lollio, F.; Montesano, L.; Gelfi, M. Wear and Cavitation Erosion Resistance of an AlMgSc Alloy Produced by DMLS. Metals 2019, 9, 308. [Google Scholar] [CrossRef] [Green Version]
  22. Hattori, S.; Ishikura, R. Revision of cavitation erosion database and analysis of stainless steel data. Wear 2010, 268, 109–116. [Google Scholar] [CrossRef]
  23. Steller, J. International Cavitation Erosion Test and quantitative assessment of material resistance to cavitation. Wear 1999, 233–235, 51–64. [Google Scholar] [CrossRef]
  24. Szala, M.; Dudek, A.; Maruszczyk, A.; Walczak, M.; Chmiel, J.; Kowal, M. Effect of atmospheric plasma sprayed TiO2-10% NiAl cermet coating thickness on cavitation erosion, sliding and abrasive wear resistance. Acta Phys. Pol. A 2019, 136, 335–341. [Google Scholar] [CrossRef]
  25. Jasionowski, R.; Przetakiewicz, D.; Przetakiewicz, W. Cavitation Erosion Resistance of Alloys Used in Cathodic Protection of Hulls of Ships. Arch. Metall. Mater. 2014, 59, 241–245. [Google Scholar] [CrossRef] [Green Version]
  26. Mann, B.S.; Arya, V. An experimental study to corelate water jet impingement erosion resistance and properties of metallic materials and coatings. Wear 2002, 253, 650–661. [Google Scholar] [CrossRef]
  27. Krella, A.K.; Zakrzewska, D.E. Cavitation Erosion—Phenomenon and Test Rigs. Adv. Mater. Sci. 2018, 18, 15–26. [Google Scholar] [CrossRef] [Green Version]
  28. García, G.L.; López-Ríos, V.; Espinosa, A.; Abenojar, J.; Velasco, F.; Toro, A. Cavitation resistance of epoxy-based multilayer coatings: Surface damage and crack growth kinetics during the incubation stage. Wear 2014, 316, 124–132. [Google Scholar] [CrossRef]
  29. Dular, M.; Bachert, B.; Stoffel, B.; Sirok, B. Relationship between cavitation structures and cavitation damage. Wear 2004, 257, 1176–1184. [Google Scholar] [CrossRef]
  30. Szala, M. Application of computer image analysis software for determining incubation period of cavitation erosion—preliminary results. ITM Web Conf. 2017, 15, 06003. [Google Scholar] [CrossRef] [Green Version]
  31. Gireń, B.G. Kawitacyjne Niszczenie Warstw Ukształtowanych Wiązką Promieniowania Laserowego; Wydawn. IMP PAN: Gdańsk, Poland, 2006. [Google Scholar]
  32. Szala, M.; Łatka, L.; Walczak, M.; Winnicki, M. Comparative Study on the Cavitation Erosion and Sliding Wear of Cold-Sprayed Al/Al2O3 and Cu/Al2O3 Coatings, and Stainless Steel, Aluminium Alloy, Copper and Brass. Metals 2020, 10, 856. [Google Scholar] [CrossRef]
  33. Will, C.R.; Capra, A.R.; Pukasiewicz, A.G.M.; Chandelier, J.d.G.; Paredes, R.S.C. Comparative study of three austenitic alloy with cobalt resistant to cavitation deposited by plasma welding. Weld. Int. 2012, 26, 96–103. [Google Scholar] [CrossRef]
  34. Maksimović, V.M.; Devečerski, A.B.; Došen, A.; Bobić, I.; Erić, M.D.; Volkov-Husović, T. Comparative Study on Cavitation Erosion Resistance of A356 Alloy and A356FA5 Composite. Trans. Indian Inst. Met. 2017, 70, 97–105. [Google Scholar] [CrossRef]
  35. Hattori, S.; Ishikura, R.; Zhang, Q. Construction of database on cavitation erosion and analyses of carbon steel data. Wear 2004, 257, 1022–1029. [Google Scholar] [CrossRef]
  36. Tzanakis, I.; Bolzoni, L.; Eskin, D.G.; Hadfield, M. Evaluation of Cavitation Erosion Behavior of Commercial Steel Grades Used in the Design of Fluid Machinery. Metall. Mater. Trans. A 2017, 48, 2193–2206. [Google Scholar] [CrossRef] [Green Version]
  37. Gao, G.; Zhang, Z.; Cai, C.; Zhang, J.; Nie, B. Cavitation Damage Prediction of Stainless Steels Using an Artificial Neural Network Approach. Metals 2019, 9, 506. [Google Scholar] [CrossRef] [Green Version]
  38. Szala, M.; Awtoniuk, M. Neural modelling of cavitation erosion process of 34CrNiMo6 steel. IOP Conf. Ser. Mater. Sci. Eng. 2019, 710, 012016. [Google Scholar] [CrossRef]
  39. Jafarzadeh, K.; Valefi, Z.; Ghavidel, B. The effect of plasma spray parameters on the cavitation erosion of Al2O3–TiO2 coatings. Surface Coat. Technol. 2010, 205, 1850–1855. [Google Scholar] [CrossRef]
  40. Łatka, L.; Szala, M.; Michalak, M.; Pałka, T. Impact of atmospheric plasma spray parameters on cavitation erosion resistance of Al2O3-13%TiO2 coatings. Acta Phys. Pol. A 2019, 136, 342–347. [Google Scholar] [CrossRef]
  41. Szala, M.; Awtoniuk, M.; Łatka, L.; Macek, W.; Branco, R. Artificial neural network model of hardness, porosity and cavitation erosion wear of APS deposited Al2O3 -13 wt % TiO2 coatings. J. Phys. Conf. Ser. 2021. in print. [Google Scholar]
  42. Pierlot, C.; Pawlowski, L.; Bigan, M.; Chagnon, P. Design of experiments in thermal spraying: A review. Surf. Coat. Technol. 2008, 202, 4483–4490. [Google Scholar] [CrossRef]
  43. Szala, M.; Walczak, M.; Łatka, L.; Gancarczyk, K.; Özkan, D. Cavitation Erosion and Sliding Wear of MCrAlY and NiCrMo Coatings Deposited by HVOF Thermal Spraying. Adv. Mater. Sci. 2020, 20, 26–38. [Google Scholar] [CrossRef]
  44. Maruszczyk, A.; Dudek, A.; Szala, M. Research into Morphology and Properties of TiO2—NiAl Atmospheric Plasma Sprayed Coating. Adv. Sci. Technol. Res. J. 2017, 11, 204–210. [Google Scholar] [CrossRef] [Green Version]
  45. Łatka, L.; Michalak, M.; Jonda, E. Atmospheric Plasma Spraying of Al2O3 + 13% TiO2 Coatings Using External and Internal Injection System. Adv. Mater. Sci. 2019, 19, 5–17. [Google Scholar] [CrossRef] [Green Version]
  46. ASTM G32-10: Standard Test Method for Cavitation Erosion Using Vibratory Apparatus; ASTM International: West Conshohocken, PA, USA, 2010.
  47. Tangirala, A.K. Principles of System Identification: Theory and Practice; CRC Press: Boca Raton, FL, USA, 2015; ISBN 978-1-4398-9599-3. [Google Scholar]
  48. Łatka, L.; Pawłowski, L.; Winnicki, M.; Sokołowski, P.; Małachowska, A.; Kozerski, S. Review of Functionally Graded Thermal Sprayed Coatings. Appl. Sci. 2020, 10, 5153. [Google Scholar] [CrossRef]
  49. Meghwal, A.; Anupam, A.; Murty, B.S.; Berndt, C.C.; Kottada, R.S.; Ang, A.S.M. Thermal Spray High-Entropy Alloy Coatings: A Review. J. Therm. Spray Tech. 2020, 29, 857–893. [Google Scholar] [CrossRef]
  50. Yılmaz, R.; Kurt, A.O.; Demir, A.; Tatlı, Z. Effects of TiO2 on the mechanical properties of the Al2O3–TiO2 plasma sprayed coating. J. Eur. Ceram. Soc. 2007, 27, 1319–1323. [Google Scholar] [CrossRef]
  51. Matikainen, V.; Niemi, K.; Koivuluoto, H.; Vuoristo, P. Abrasion, Erosion and Cavitation Erosion Wear Properties of Thermally Sprayed Alumina Based Coatings. Coatings 2014, 4, 18–36. [Google Scholar] [CrossRef] [Green Version]
  52. Davis, J.R. Handbook of Thermal Spray Technology; ASM International: Almere, The Netherlands, 2004; ISBN 978-0-87170-795-6. [Google Scholar]
  53. Coello, C.C.; Lamont, G.B.; van Veldhuizen, D.A. Evolutionary Algorithms for Solving Multi-Objective Problems, 2nd ed.; Genetic and Evolutionary Computation; Springer: New York, NY, USA, 2007; ISBN 978-0-387-33254-3. [Google Scholar]
  54. Chen, Q.; Hu, P.; Pu, J.; Wang, J.H. Sensitivity analysis and multi-objective optimization of double-ceramic-layers thermal barrier system. Ceram. Int. 2019, 45, 17224–17235. [Google Scholar] [CrossRef]
Figure 1. Block diagram of the analyzed neural model.
Processes 08 01544 g001
Figure 2. APS-deposited Al2O3-13 wt% TiO2 coatings: surface morphology and cross section microstructure of AT13-2 (a,b) and AT13-5 (c,d), SEM-BSD.
Processes 08 01544 g002
Figure 3. Cavitation erosion results: (a) erosion rate-time curves, (b) erosion depth after 4 h of testing.
Processes 08 01544 g003
Figure 4. Cavitation damage development observed at different magnifications and exposure times: (a,b) progression of erosion in the AT13-1 coating before and after 2 h of cavitation, ×1000; (c,d) progression of erosion in the AT13-3 coating after 4 h of cavitation testing, ×4000, SEM-BSD.
Processes 08 01544 g004aProcesses 08 01544 g004b
Figure 5. Influence of the number of hidden neurons on the fit index for learning (left) and testing (right) datasets.
Processes 08 01544 g005
Figure 6. Surface plot of the function H (h, V).
Processes 08 01544 g006
Figure 7. Surface plot of the function P (h, V).
Processes 08 01544 g007
Figure 8. Surface plot of the function MDE (h, V).
Processes 08 01544 g008
Figure 9. Pareto front in objective space.
Processes 08 01544 g009
Figure 10. Contour plot of the function H (h, V) with optimal solutions (red dots).
Processes 08 01544 g010
Figure 11. Contour plot of the function P (h, V) with optimal solutions (red dots).
Processes 08 01544 g011
Figure 12. Contour plot of the function MDE (h, V) with optimal solutions (red dots).
Processes 08 01544 g012
Table 1. Sample codes and atmospheric plasma spraying (APS) process variables.
Sample CodeStand-Off Distance,
h (mm)
Torch Velocity,
V (mm∙s−1)
AT13-180300
AT13-280500
AT13-390400
AT13-4100300
AT13-5100500
Table 2. Properties of the Al2O3-13 wt% TiO2 coatings used in the artificial neural network (ANN) calculations, average ± SD.
Sample CodeHardness, H
(HV0.1)
Porosity, P
(%)
AT13-11237 ± 1052.30 ± 0.37
AT13-2885 ± 1085.59 ± 0.63
AT13-31059 ± 1122.91 ± 0.51
AT13-41028 ± 1184.28 ± 0.60
AT13-5984 ± 1084.16 ± 0.57
Table 3. Fit index for the ANN with a 2-6-3 structure.
Output SignalFit Index (%)
Learning DatasetTesting Dataset
H10098.4
P10084.6
MDE10082.6
Table 4. Set of Pareto-optimal solutions.
Solution NumberDecision Variables x*Objective Function J
h
(mm)
V
(mm∙s−1)
H
(HV0.1)
P
(%)
MDE
(µm)
180.037112032.2812.7
284.034713162.3811.0
386.930413772.4610.1
482.737012502.3211.9
583.735612992.3611.2
682.736012632.3311.8
780.435712122.2812.6
881.835312442.3112.1
982.833412942.3511.3
1085.130713662.4210.2
1182.534412742.3311.6
1285.433313562.4210.3
1383.132313132.3711.0
1483.930413492.4010.5
1584.330713542.4110.4
1683.135612802.3411.5
1787.330413772.4810.1
x* is a set of decision variables that forms the Pareto front.
Publisher’s Note: MDPI stays neutral with regard to jurisdictional claims in published maps and institutional affiliations.

