Article

A Methodology to Estimate the Sorption Parameters from Batch and Column Tests: The Case Study of Methylene Blue Sorption onto Banana Peels

by
Anastasia Stavrinou
1,2,
Christos A. Aggelopoulos
1 and
Christos D. Tsakiroglou
1,*
1
Foundation for Research and Technology Hellas—Institute of Chemical Engineering Sciences, Stadiou Street, Platani, 26504 Patras, Greece
2
Department of Physics, University of Patras, 26504 Patras, Greece
*
Author to whom correspondence should be addressed.
Processes 2020, 8(11), 1467; https://doi.org/10.3390/pr8111467
Submission received: 2 November 2020 / Revised: 12 November 2020 / Accepted: 13 November 2020 / Published: 16 November 2020
(This article belongs to the Section Chemical Processes and Systems)

Abstract

:
In the present work, a methodology is presented where batch and fixed-bed column tests of dye sorption onto granular biosorbents are analyzed with properly selected models to estimate the parameters required for the rational design of pilot-scale units. The sorption of methylene blue (MB) onto banana peels (BP) was investigated as a case study. To identify the mechanisms of MB sorption onto BP, the pore structure and surface of BP were characterized with mercury intrusion porosimetry (MIP), Fourier transform infrared spectroscopy (FTIR), and scanning electron microscopy (SEM). Batch tests were performed over the temperature range of 15–45 °C, and three models (Langmuir, Freundlich, Langmuir–Freundlich) were fitted to equilibrium and kinetic data for (i) estimating thermodynamic/kinetic parameters and (ii) choosing the model with the best goodness-of-fit. Sorption tests on fixed-bed columns were combined with a one-dimensional macroscopic convection/dispersion/sorption model to estimate the sorption parameters of BP beds. MB sorption onto BP was a purely exothermic (ΔH0~−20 kJ/mol), reversible, and monolayer chemisorption with high activation energy for the desorption step (Ed~29 kJ/mol) and low activation energy for the adsorption step (Ea~9 kJ/mol). The Langmuir isotherm (KL = 141.9 m3/kg, T = 25 °C) and Langmuir kinetic model (kd = 1.05 × 10⁻⁵ s−1) provided the best fitting to equilibrium and transient data of batch tests. The sorption capacity ~0.15–0.22 kg/kg and kinetic constant 0.3 × 10⁻⁵ s−1–4.0 × 10⁻⁵ s−1 estimated from tests on BP beds were comparable to those obtained from batch tests.

1. Introduction

The presence of dyes in liquid industrial waste poses a risk to the ecosystem and human health [1,2,3]. Methylene blue (MB) is a cationic azo dye widely used in industry, and several diseases (e.g., hypertension, anemia) have been associated with its presence in the human body [4]. Adsorption is a simple and effective method of removing dyes from aqueous systems [5,6]. Among the adsorbents occasionally used to remove pollutants from wastewater, activated carbon is the most popular [7,8]. In recent years, emphasis has been placed on low-cost adsorbents made from agricultural waste as alternatives to commercial activated carbon [9]. Such materials, prepared from the peels and shells of fruits or leaves of trees, have been used to remove dyes from wastewater [10,11,12,13]. Special attention has been paid to olive-pomace [14,15] and oil waste mills [16] for the removal of dyes from wastewater. Still, it is worth mentioning the capacity of olive pomace/chitosan composites to adsorb antibiotics from wastewater [17].
Banana is a widely consumed fruit, and its peels are raw material for the development of low-cost adsorbents. Banana peels have been widely investigated as adsorbents for the removal of various types of dyes from water [18,19,20], although corresponding flow-through sorption studies in fixed-bed columns are limited [21]. However, extensive sorption studies have been performed on fixed-bed columns for other types of low-cost adsorbents [22,23,24,25,26]. In an earlier work [27], banana (BP), cucumber (CP), and potato (PP) peels were tested as adsorbents for the purification of deionized water contaminated with MB. Equilibrium sorption tests were conducted at a constant temperature T = 25 °C in batch reactors under variable conditions, and the maximum sorption capacity for MB was found as ca 0.21, 0.17 and 0.11 g/g-sorbent for BP, CP and PP, respectively. Among the various models (pseudo-first-order, pseudo-second-order, Elovich, intraparticle diffusion) used to fit kinetic data of MB sorption onto BP, the second-order model presented the best goodness-of-fit. The point of zero charge was measured and found as PZC = 6.5 for BP. The sorption of MB onto BP was favored at pH > 6 due to the stronger electrostatic attraction between negatively charged surface sites (COO, OH) and positive charges of MB cations [27]. Based on these studies, BP was selected to be used as a low-cost biosorbent for the removal of MB from wastewater, under continuous flow conditions. However, for designing and manufacturing pilot-scale units, additional data are needed for: (i) the sensitivity of the sorption system to temperature, as quantified by the heat of adsorption and activation energies of adsorption/desorption steps; (ii) the sorption capacity and sorption rate kinetics when the MB solution is injected through a bed of BP grains.
Regarding the thermodynamic analysis of the sorption process, commonly, the changes of Gibbs free energy, standard enthalpy (heat of adsorption), and standard entropy are estimated from batch tests conducted at various temperatures [20,28,29,30,31]. On the other hand, the capacity of adsorbents to remove pollutants from wastewater under continuous flow conditions depends on a variety of parameters: nature of pollutants, characteristics of adsorbent, bed height, size of particles, pollutant inlet concentration, wastewater pH, and wastewater flow rate [32,33,34,35,36,37,38,39,40,41,42]. In summary, the measured dye removal efficiency by biosorbents may vary over a broad range, depending on the types of sorbent and sorbate, the mode of test used (batch/fixed-bed column), and experimental conditions (Table 1). Therefore, it is critical to study the effect of flow rate and geometrical properties of fixed-bed columns on the sorption properties of the adsorbent before designing a pilot-scale unit.
Despite the great abundance of solute adsorption studies on batch reactors and fixed-bed columns of biosorbents, there is still a knowledge gap in how to utilize all parameters obtained from lab-scale equilibrium/nonequilibrium and batch/continuous flow tests for the scale-up and design of an efficient pilot adsorption system. A valuable tool in such an effort is the formulation of models capable of not only fitting to the experimental data but also providing a true-to-the physics picture of the process dynamics. From this perspective, it might be of high importance to demonstrate how tests performed on batch reactors and fixed-bed columns could be interpreted by mutually consistent to each other and true-to-the mechanism equilibrium/kinetic sorption models so that a unique set of parameters is finally estimated.
The present study combines batch and fixed-bed column tests with true-to-the physics models to provide all parameters, which, along with an adequate numerical tool, would allow the rational design of pilot-scale biosorbents. The case study of methylene blue (sorbate) sorption onto banana peels (sorbent) is examined. The methodology, however, is more general and could be combined with a wide variety of models and applied to numerous sorbent/sorbate systems. Equilibrium and kinetic studies of MB sorption onto BP are conducted in batch reactors at four temperatures (15–45 °C). Nonlinear regression analysis of results is performed by three models, each capable of describing the sorption isotherm and kinetics. In this manner, the equilibrium and kinetic constants of MB sorption onto BP are estimated as functions of temperature. Accounting for the properties of BP surface and pore structure, mechanisms of MB sorption onto BP, and model goodness-of-fit, the most suitable sorption model is chosen. The MB removal efficiency from water is studied with flow-through sorption tests onto grains of banana peels packed in a fixed-bed column by varying the inlet MB concentration (100 and 200 mg/L), bed height (1.86, 3.72, and 5.58 cm), and feed injection rate (1 and 3 mL/min). A numerical model is developed by combining convective flow with hydrodynamic dispersion and sorption dynamics in a porous bed. By fixing the sorption equilibrium constant, the remaining sorption parameters are estimated with inverse modeling of the MB concentration breakthrough curves. The variability of BP bed sorption parameters is interpreted referring to interactions of reactive with mass-transfer processes at the grain- and bed-scale. Finally, the estimated MB sorption capacity of BP beds is compared with the corresponding capacities of other biosorbents from earlier studies.

2. Materials and Methods

2.1. Materials

Methylene blue (molecular formula: C16H18N3ClS) was supplied by Merck and used without any other purification. MB was dissolved in distilled water to prepare stock solutions with a concentration of 1000 mg/L, which were diluted to obtain solutions over the concentration range of experiments (10–300 mg/L). All aqueous solutions were degassed before use to minimize the eventual generation of air bubbles during the tests.
Bananas were purchased from a fruit store, and their peels were used to prepare the adsorbents. The peels were washed extensively with water, dried in an oven at 110 °C for 24 h, crushed with a stainless grinder, and sieved on a mechanical shaker (Fritsch) to isolate particles in the size range of 125–500 μm.

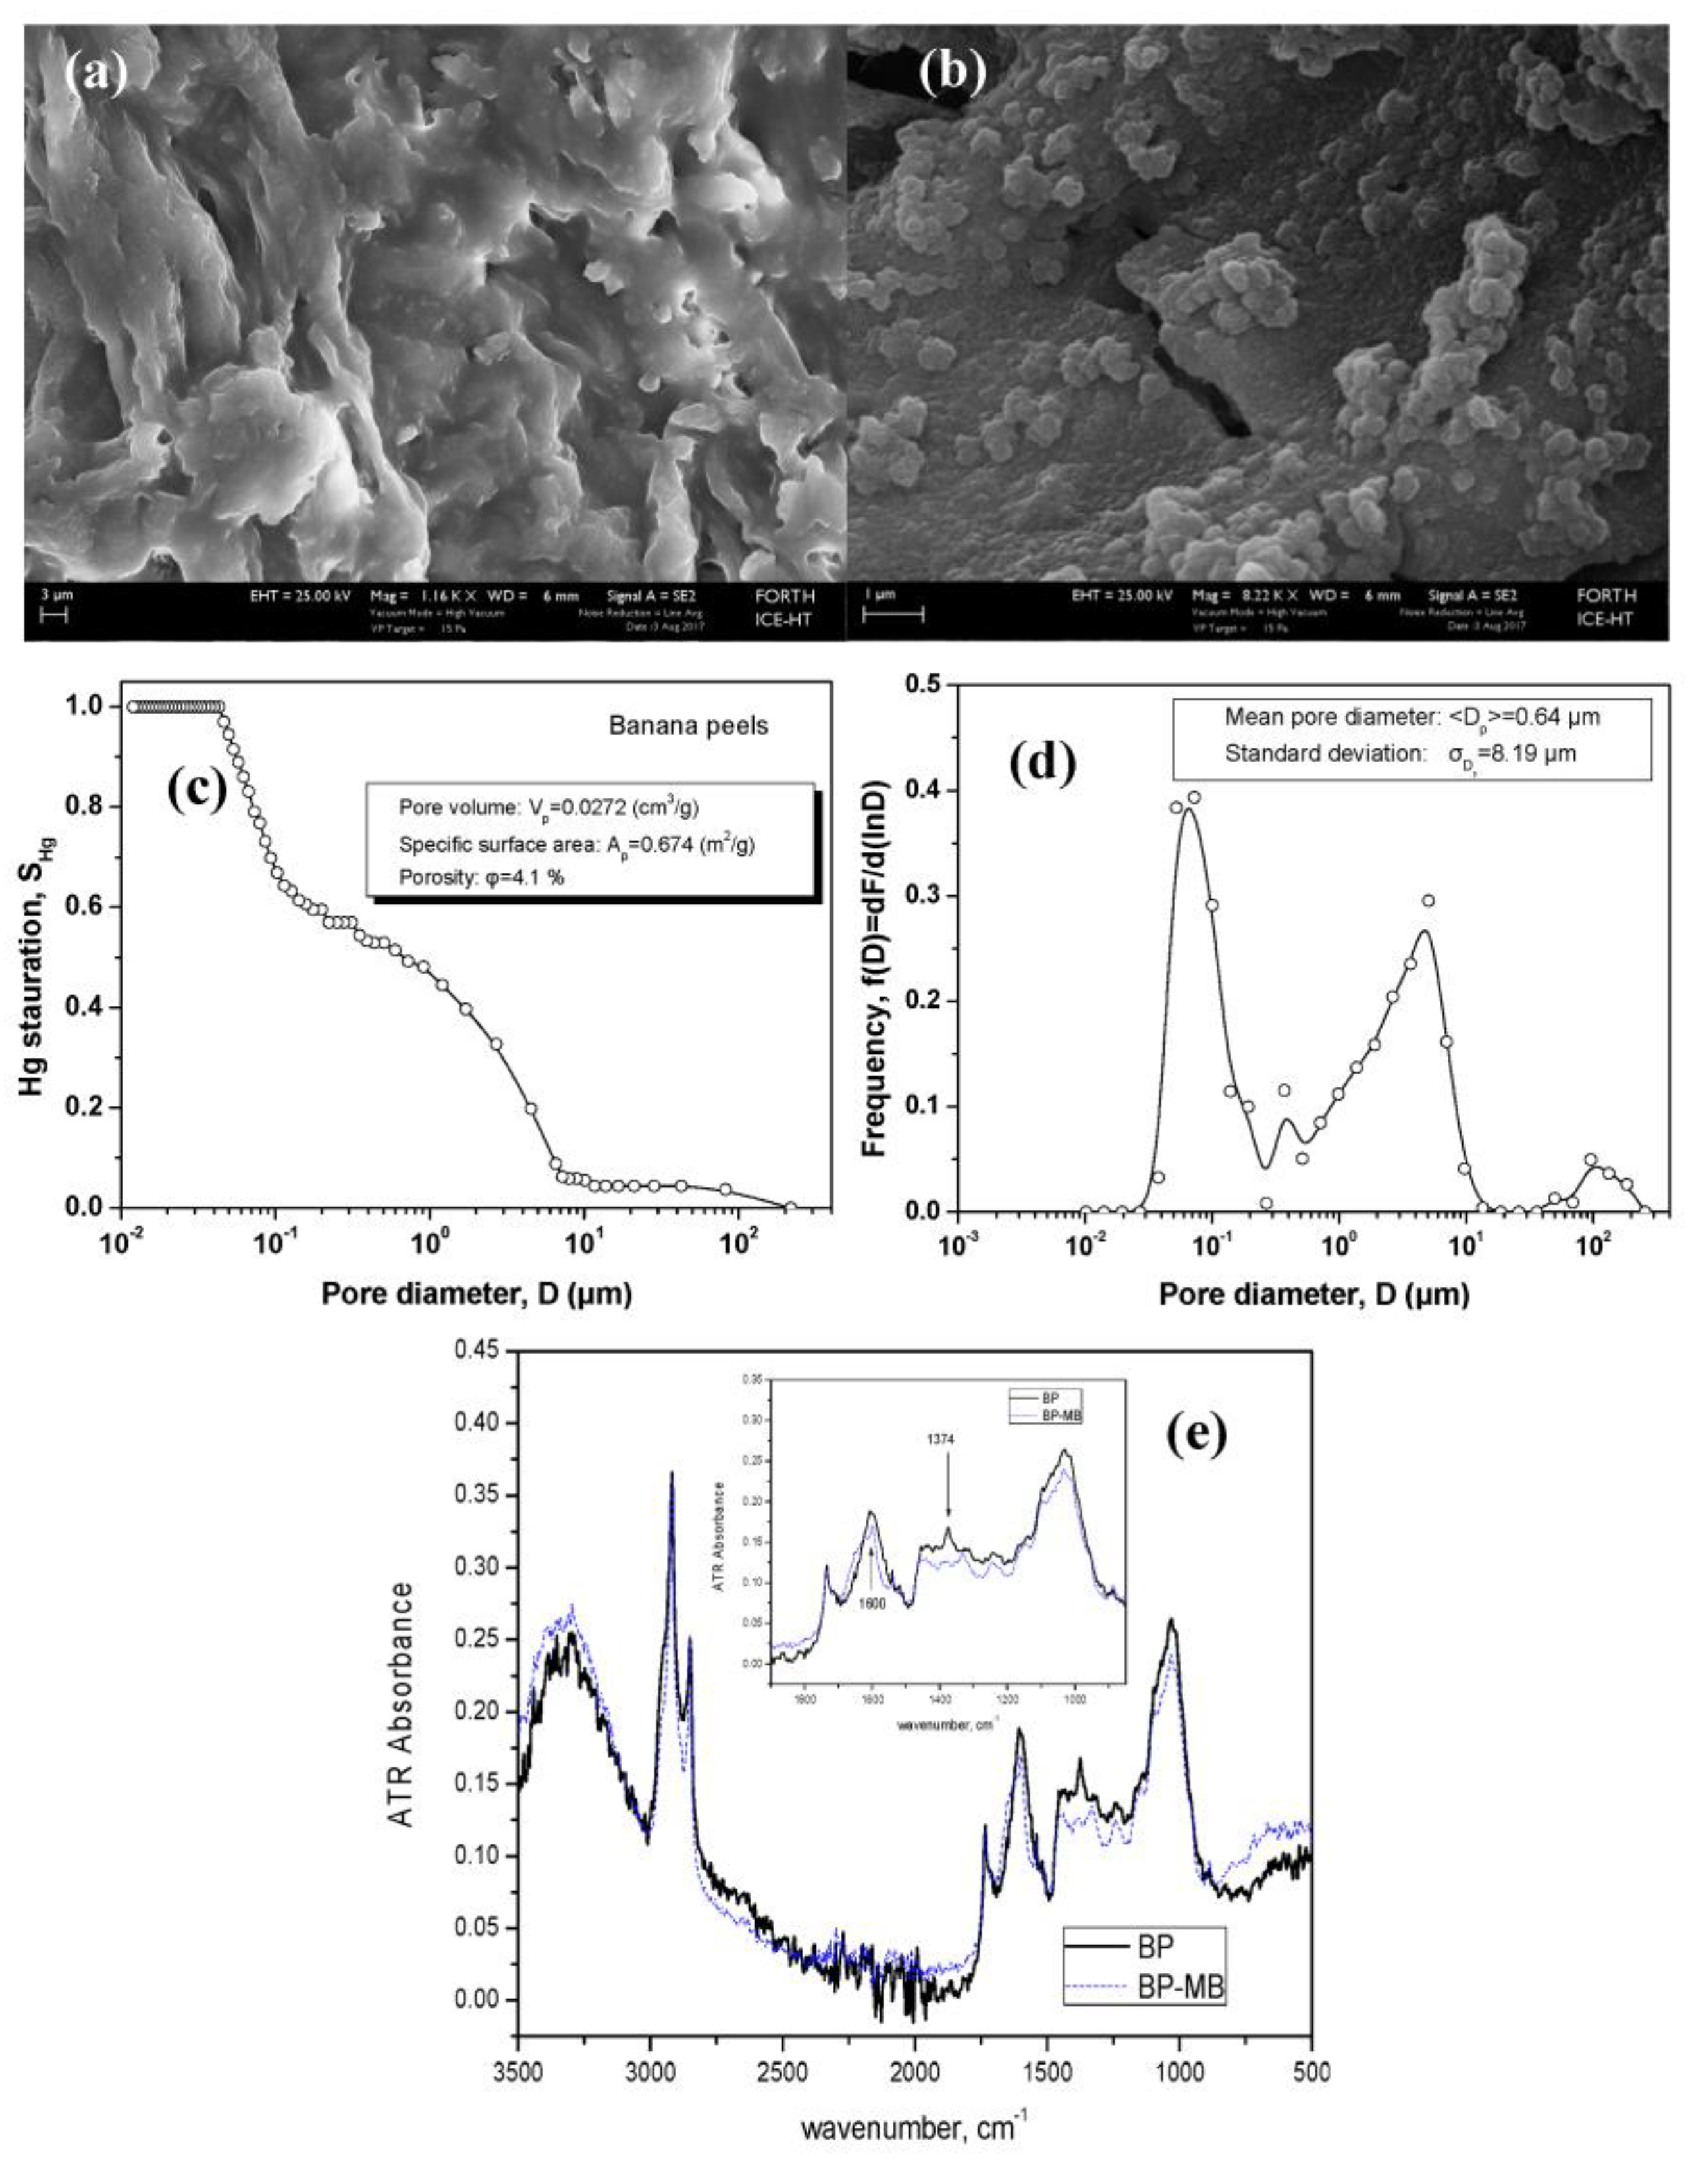
2.2. Surface Characterization

The porosity, specific surface area, and pore size distribution of dry banana peels were measured with mercury intrusion porosimetry (MIP) on a Pore Master 60 (Quantachrome Instruments., Boynton Beach, FL, USA). The morphological characterization of the adsorbent surface was performed with field-emission scanning electron microscopy (FE-SEM) (Zeiss SUPRA 35VP-FEG) operating at 5 keV, and the chemical characterization of their surface was based on attenuated total reflectance midinfrared (ATR-FTIR) spectra (Bruker Equinox 55 FTIR spectrometer) on dry BP grains before and after MB adsorption.

2.3. Batch Sorption Studies

Equilibrium and kinetic sorption studies were conducted in tightly sealed glass bottles on an orbital shaker rotating at a speed of 2.4 rpm and placed inside a thermostatted incubator. For each run, 0.01 g of BP was added in 10 mL of MB solution with a concentration between 10 and 300 mg/L, and the initial pH of the solution was adjusted to 6.0 by adding 0.1 M HCl or 0.1 M NaOH, accordingly. Tests were carried out at four constant temperatures: 15, 25, 35, and 45 °C. Samples were collected from each suspension with the aid of a tip syringe, either at regular time intervals for kinetic tests or after 24 h for equilibrium studies. Each sample was centrifuged (Heraeus Megafuge 16, Thermo Scientific, Waltham, MA, USA), and the concentration of the supernatant solution was determined by measuring its light absorbance at wavelength 663 nm in a UV–vis spectrophotometer (UV-1900 Shimadzu).

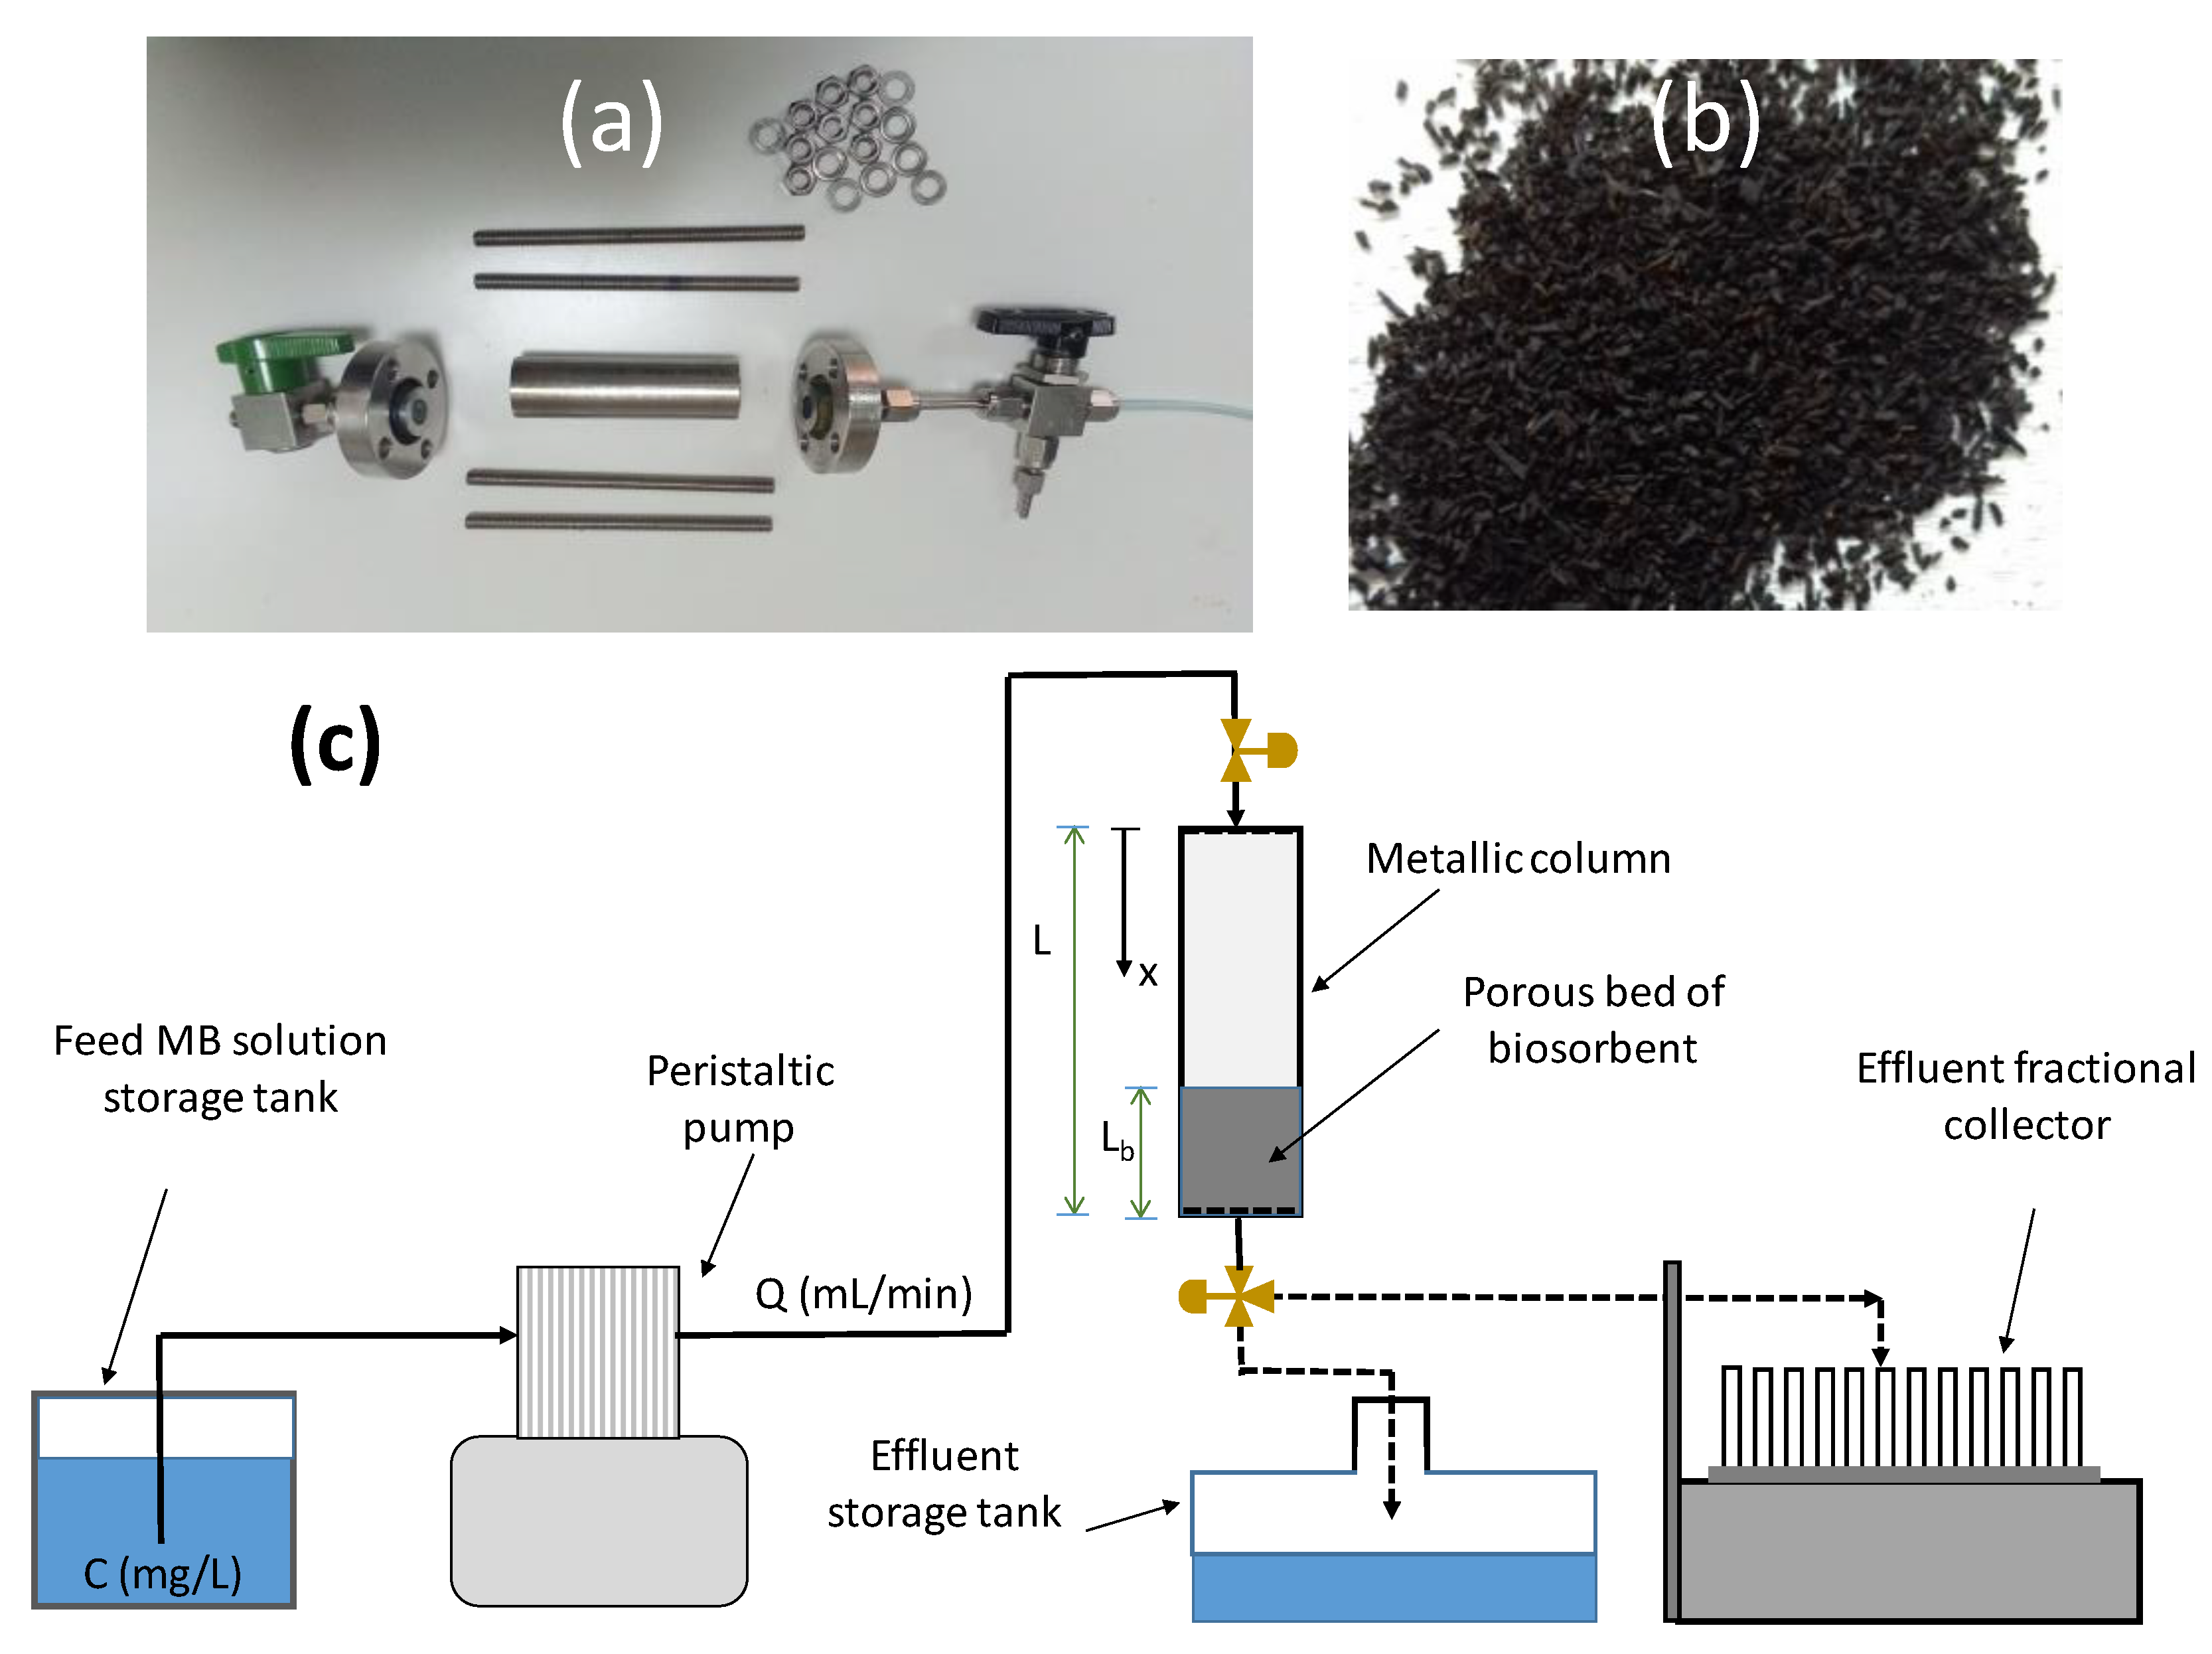
2.4. Continuous Flow Studies in a Fixed-Bed Column

A stainless steel column (L = 6.65 cm, D = 1.68 cm) was fabricated (Figure 1a). A fraction of the column was packed with a weighted mass of granular BP (Figure 1b) and connected with a peristaltic pump (Dynamax/Rainin RP-1) to inject the MB solution at a constant influx rate (Figure 1c). The effluent outflowing from the outlet port was either dropped in a storage tank or collected in 7 mL centrifugal glass tubes of a fractional collector (ELDEX) (Figure 1c) to measure the MB concentration with UV–vis spectroscopy. The entire system was placed in a thermostated incubator (Friocell) to keep the temperature constant. Before starting each test, the column was flushed with 1 L of degassed and distilled water to remove any impurities from the BP grains. Experiments were conducted for two initial MB concentrations (C0 = 100 and 200 mg/L), three masses of adsorbent (ms = 2.43, 4.86, and 7.29 g), and two volumetric flow rates (Q = 1 and 3 mL/min).
The goal of the column sorption experiments was to quantify the effects of flow and mass-transfer parameters (e.g., Peclet number) on the sorption capacity and kinetics. Such information could be exploited when designing a pilot adsorption system and for scaling-up and selecting the geometrical (e.g., diameter, column, and bed lengths) and flow (e.g., flow rate) parameters.

3. Theoretical Modeling

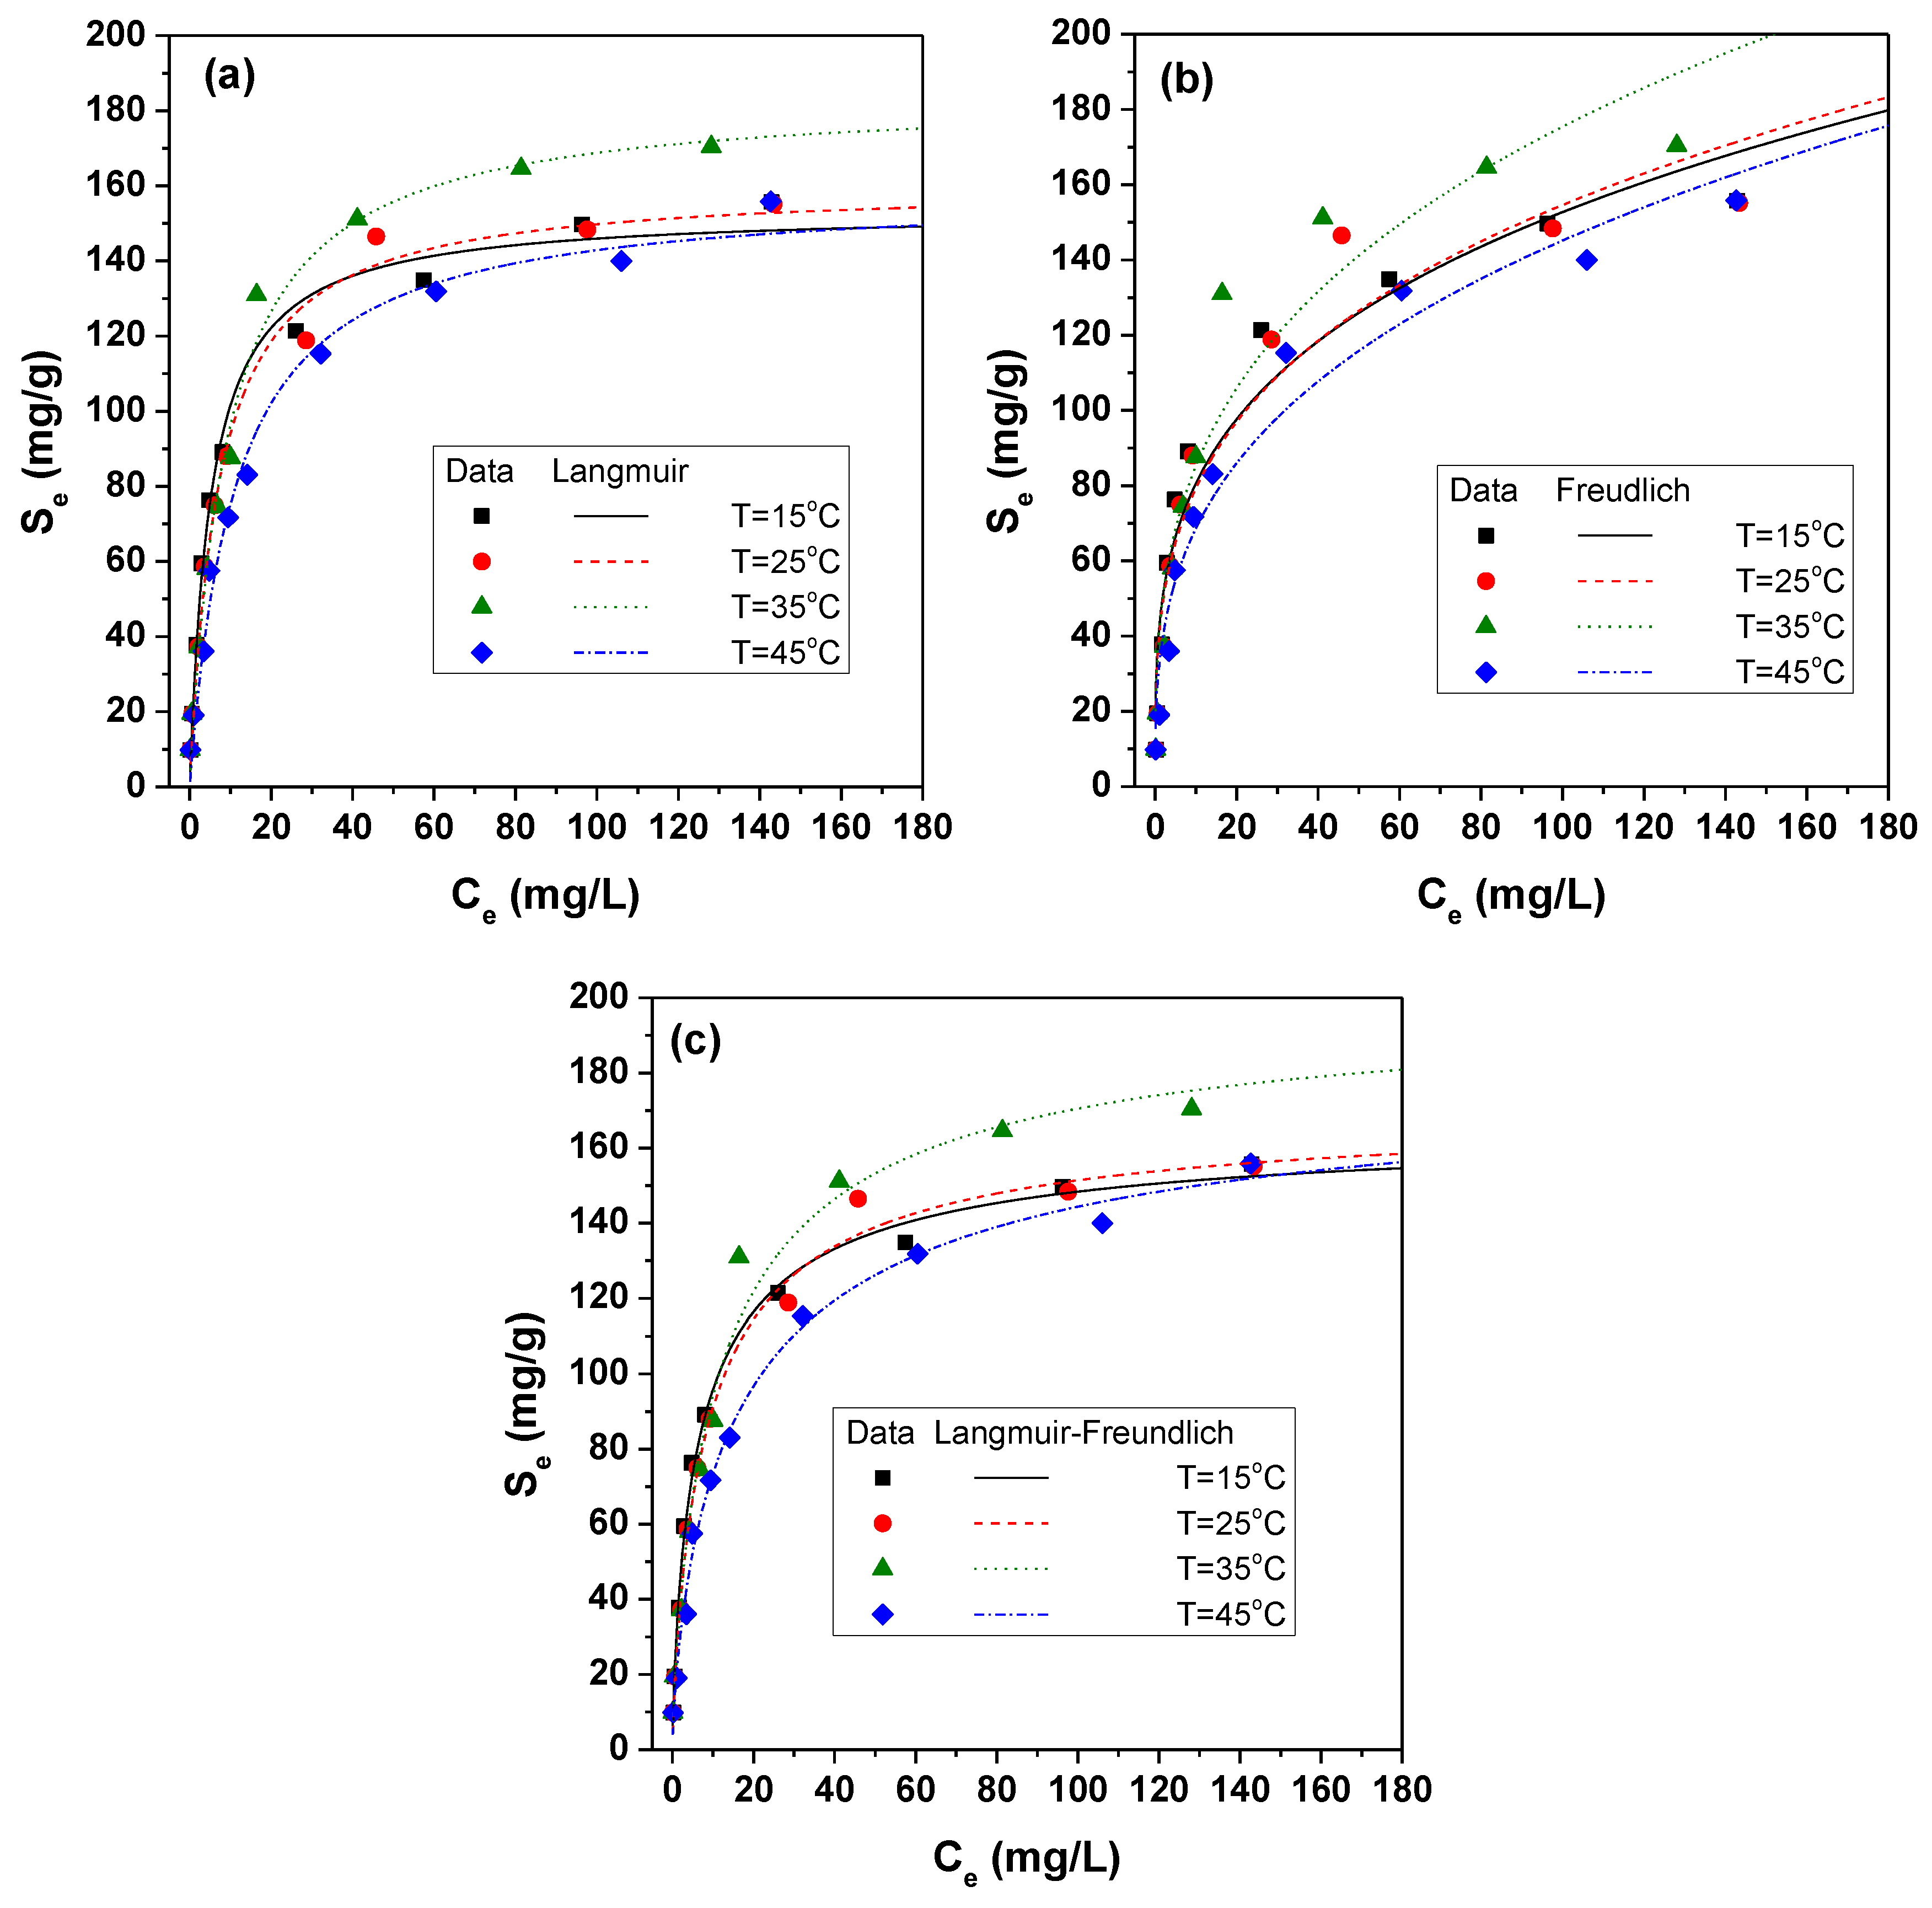
3.1. Sorption Isotherms
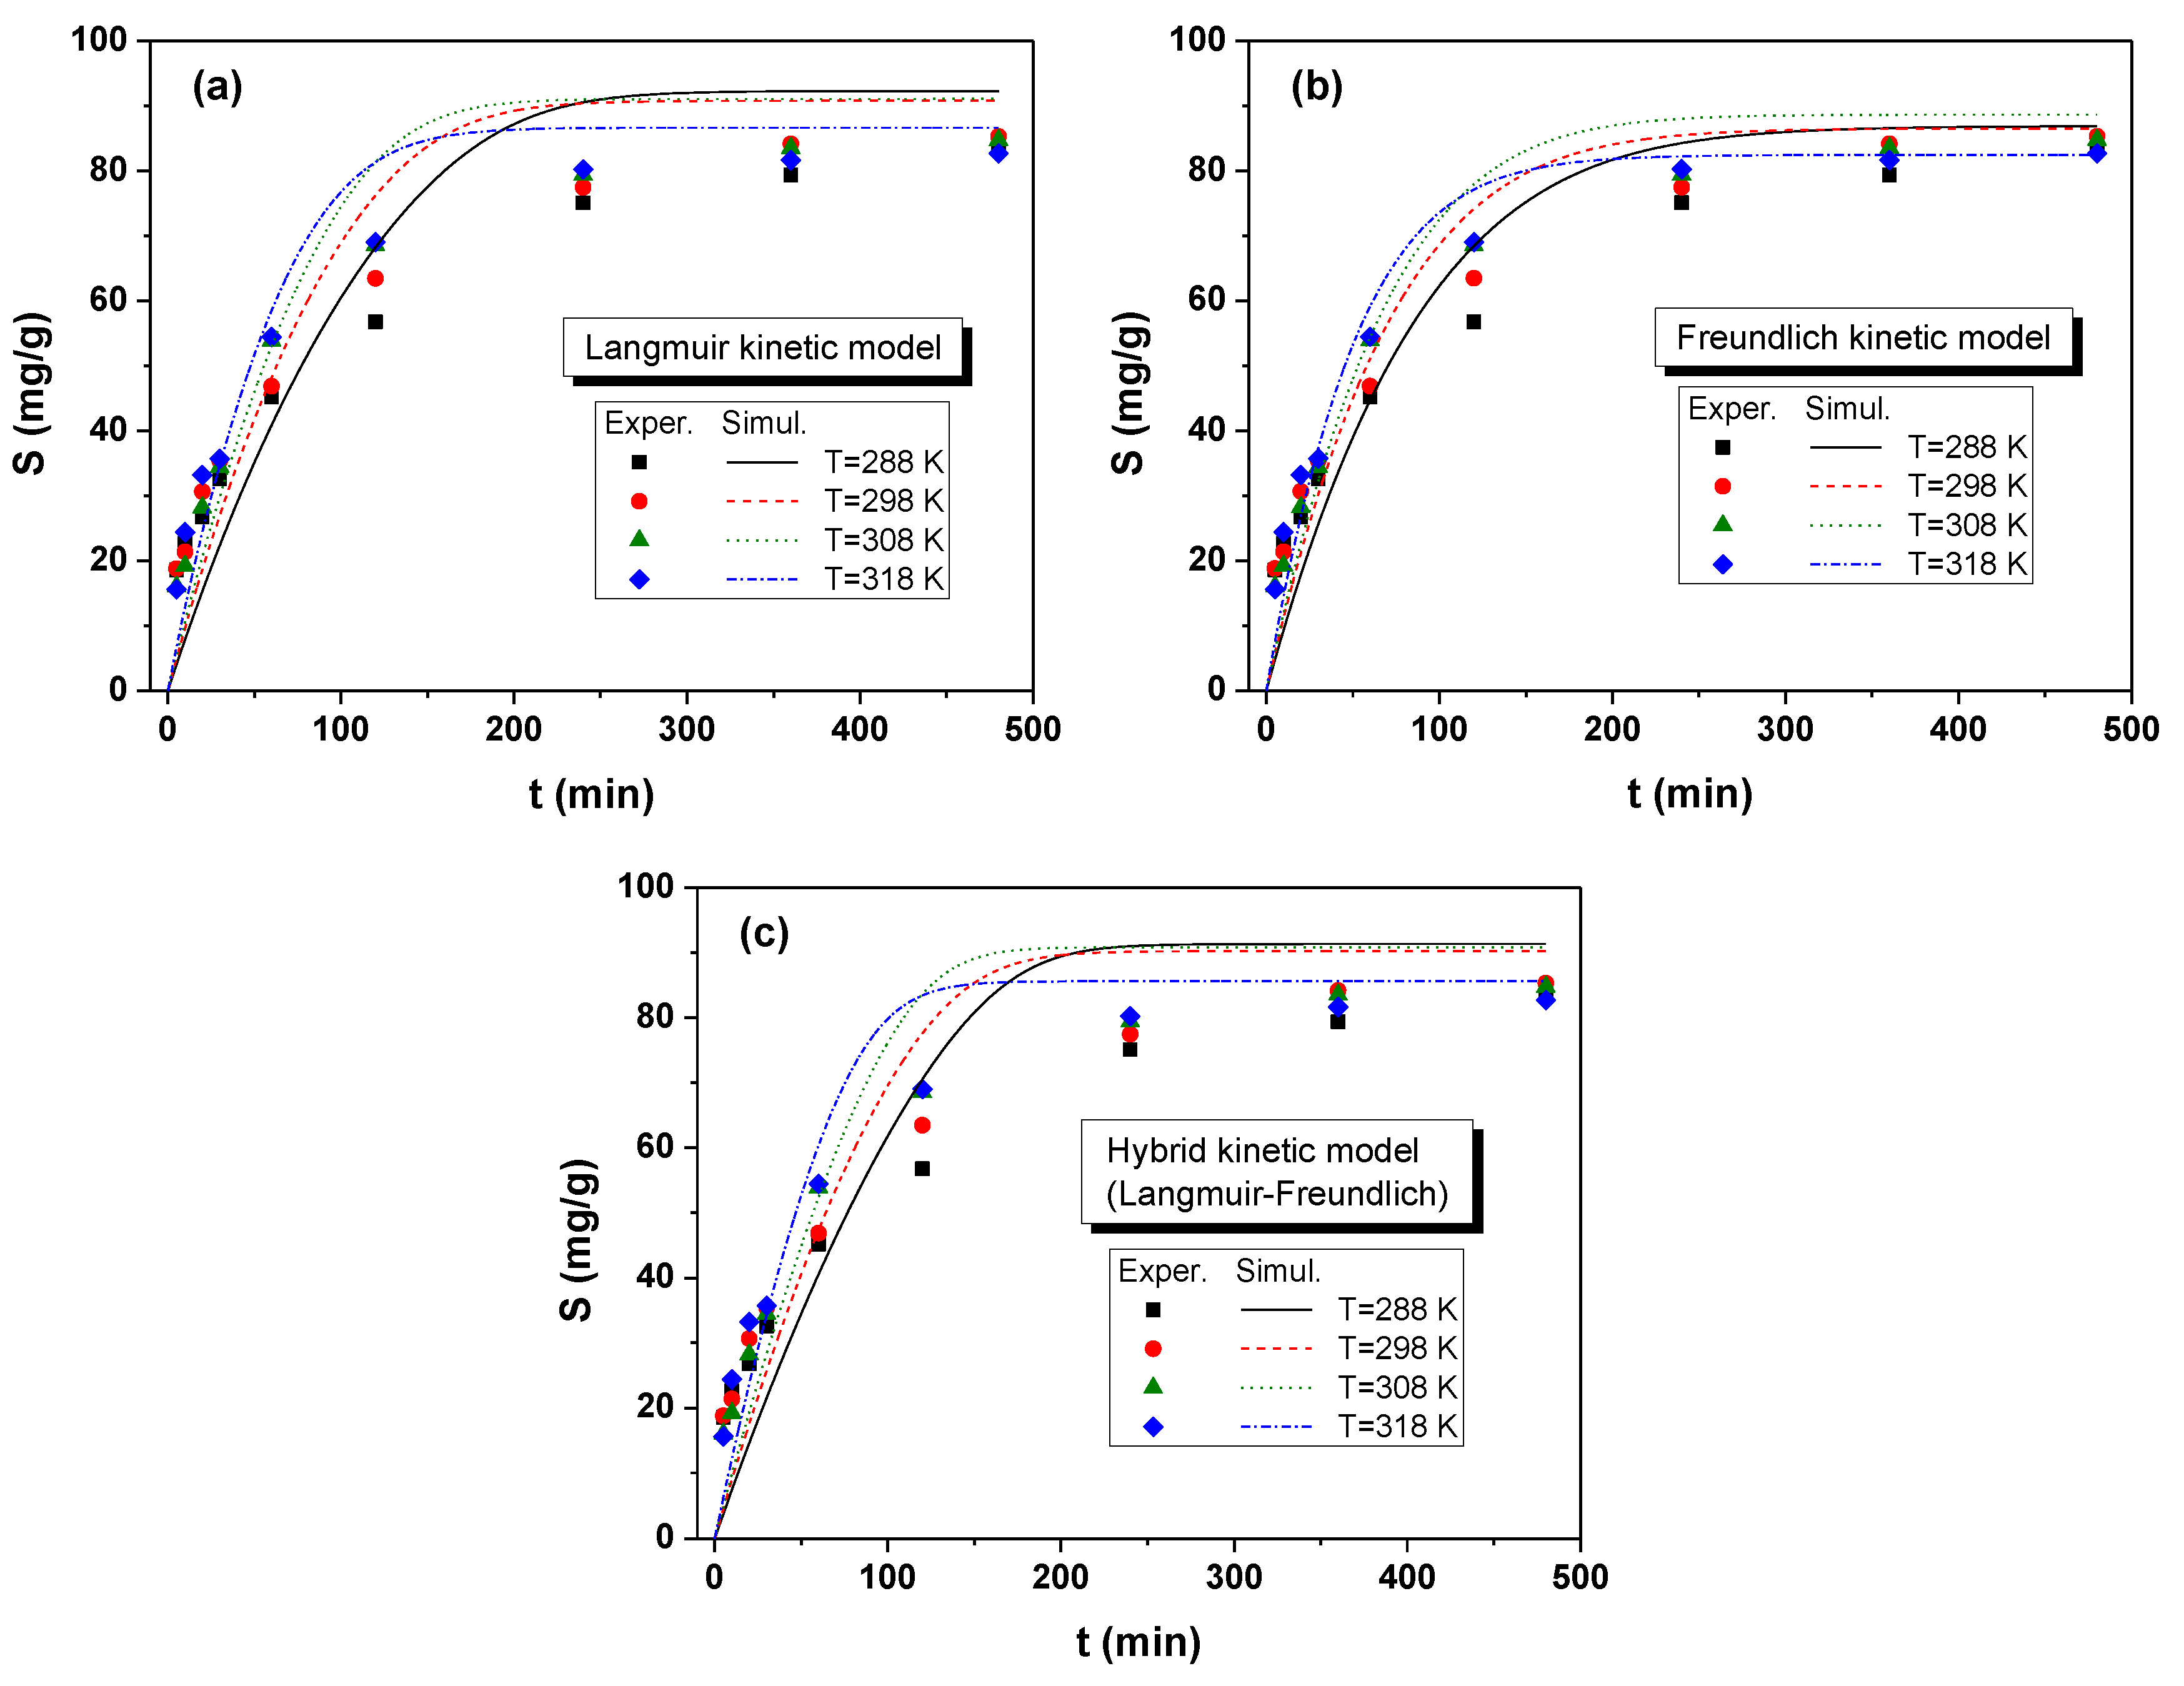
The Langmuir model assumes monolayer biosorption on identical and energetically equivalent active sites without any interaction between adsorbed molecules [43] and is written
S e q = K L S m a x C e 1 + K L C e
where Seq (mg/g) is the mass of dye adsorbed per unit mass of adsorbent at equilibrium, Ce (mg/L) is the equilibrium concentration of dye in solution, Smax (mg/g) is the maximum adsorption capacity of the adsorbent corresponding to monolayer coverage, and KL (L/mg) is the Langmuir adsorption constant.
The Freundlich isotherm describes the multilayer biosorption with the nonuniform distribution of sorption sites over the heterogeneous surface along with interactions between adsorbed molecules [44] and is expressed by
S e q = K F C e β
where K F ((mg/g)(L/mg)1/n) is the Freundlich adsorption constant related to the maximum adsorption capacity of the adsorbent, and the exponent β varies with the adsorbent heterogeneity.
The Langmuir–Freundlich isotherm is a hybrid model describing the distribution of sorption energy onto the heterogeneous surface of the adsorbent [45]. This model transits to the Freundlich or Langmuir isotherm at low or high adsorbate concentrations, respectively. The isotherm can be expressed as follows
S e q = K L F S m a x C e β 1 + K L F C e β
where K L F is the equilibrium constant for heterogeneous solid, and β is a heterogeneous parameter ranging from 0 to 1.
For a reversible adsorption/desorption process, the dependence of the equilibrium constant K I ( I = L , F , L F ) on the absolute temperature T (K) is governed by the van’t Hoff equation [46]
d l n ( K I ) d T = Δ H 0 R T 2
where R represents the universal gas constant (8.314 J K−1 mol−1), and Δ H 0 represents the change of the standard enthalpy (heat) of adsorption (J mol−1). Over a limited temperature range, Δ H 0 can be assumed constant, the integration of Equation (4) yields
ln ( K I ) = ln ( B ) Δ H 0 R ( 1 T )
and Δ H 0 can be estimated from the slope of the plot of ln ( K I ) versus 1 / T (Equation (5)).

3.2. Kinetic Models

The analysis of kinetic data of MB sorption onto BP with conventional (first-order/second-order/etc.) models has already been performed [27]. To maintain consistency in kinetic with equilibrium models, instead of using the conventional models, the dynamic form of the aforementioned isotherms was chosen [47,48]. Sorption is regarded as a reversible reaction with fundamental steps: the adsorption/desorption of dye molecules between the aqueous phase and the surface of adsorbent.
(1)
In the Langmuir kinetic model, the adsorption rate is regarded proportional to the fraction of vacant sites, and the desorption rate is proportional to the fraction of sites covered by adsorbed molecules. The overall rate is written
d S d t = [ k a C ( S max S ) k d S ]
where k a , k d are the kinetic constants of adsorption and desorption steps, respectively. At equilibrium, d S / d t = 0 , and Equation (6) coincides with the Langmuir isotherm with
K L = k a k d
(2)
In the Freundlich kinetic model, the adsorption rate changes nonlinearly with the concentration of dissolved molecules, and the overall sorption rate is given by [48]
d S d t = ( k a C β k d S )
At equilibrium, Equation (8) coincides with the Freundlich isotherm with
K F = k a k d
(3)
In the hybrid (Langmuir–Freundlich) kinetic model, the adsorption rate changes nonlinearly with the concentration of dissolved molecules and is proportional to the concentration of vacant sites. The rate becomes
d S d t = [ k a C β ( S max S ) k d S ]
At equilibrium, Equation (10) coincides with the Langmuir–Freundlich isotherm with
K L F = k a k d
Starting from the integrated form of the van’t Hoff relationship (Equation (5)), and after some manipulation [46], we get Arrhenius-type equations for the rate constants
l n ( k a ) = l n ( A a ) E a R T ,   l n ( k d ) = l n ( A d ) E d R T
where E a , E d are the activation energies for the adsorption and desorption step, and A a , A d are the corresponding pre-exponential factors, interrelated by
Δ H 0 = E a E d ,   l n ( B ) = l n ( A a ) l n ( A d )

3.3. Modeling the Performance of a Fixed-Bed Column

The one-dimensional (1D) transport of a solute (MB) through a nonhomogeneous porous medium, such as the bed of packed BP grains, is governed by convection, dispersion, and adsorption [49] and described by the following mass balance:
C t = D L 2 C x 2 u 0 C x ρ b ϕ S t
where t is the time (s), C is the MB concentration (kg/m3) at axial distance x (m) from the column inlet, DL is the longitudinal hydrodynamic dispersion coefficient (m2 s−1), u0 is the pore velocity (m s−1), defined as u 0 = Q / ( ϕ A ) , A is the cross-sectional area of the column, ϕ is the bed porosity, S is the concentration of MB adsorbed per unit mass of solid (kg/kg), and ρ b is the bulk density of the dried adsorbent. If normalized, the aforementioned kinetic models (Equations (6), (8), and (10)) can be merged into a general expression for the overall sorption rate as
S t = a [ S e q ( C ) S ]
where a is a rate constant that is proportional to kd. The hydrodynamic dispersion coefficient is commonly described by the relationship [50]:
D L = D m F ϕ + a L u 0
where Dm is the molecular diffusion coefficient of MB (m2 s−1), F is the electrical formation factor of the porous bed of adsorbing grains, and a L is the longitudinal dispersion length (m). For homogeneous porous media, for the sake of simplicity, we can assume that a L d g [50].
If L is the total height of the column (m), and using the dimensionless variables τ = tu0/L, ξ = x/L, C* = C/C0, Equations (14) and (15) are finally transformed into the following dimensionless relationships
C * τ = ( 1 F ϕ P e d + a L d g ) ( d g L ) 2 C * ξ 2 C * ξ ( a ρ b ϕ C 0 ) [ S e q ( C * ) S ]
S τ = ( a L u 0 ) [ S e q ( C ) S ]
where P e d = u 0 d g / D m is the grain-scale Peclet number.
Equations (17) and (18) describe the mass transfer along the bed of adsorbing material extending over the length, ξ 0 ξ 1.0 , where the distance ξ 0 specifies the upper surface of the adsorbent, ξ 0 = 1 ( L b / L ) , and L b is the bed height (Figure 1c). On the other hand, the first segment of the column, 0 ξ < ξ 0 , is fully occupied by the aqueous phase. Over this region, no sorption occurs, namely
S ( τ , ξ ) = 0    0 ξ < ξ 0
whereas the MB mass transfer is described by the classical diffusion–convection equation, which in dimensionless form is written
C * τ = 1 P e L 2 C * ξ 2 ϕ C * ξ     0 ξ < ξ 0
where P e L = u 0 L / D m is the column-scale Peclet number, which can be replaced by P e d through the relationship
P e L = P e d ( L d g )
The foregoing Equations (17)–(20) are subject to the initial condition
τ = 0    C * ( 0 , ξ ) = 0
and the boundary conditions
ξ = 0    C * ( τ , 0 ) = 1 S ξ = 0
ξ = 1    C * ξ = 0 S ξ = 0

4. Results

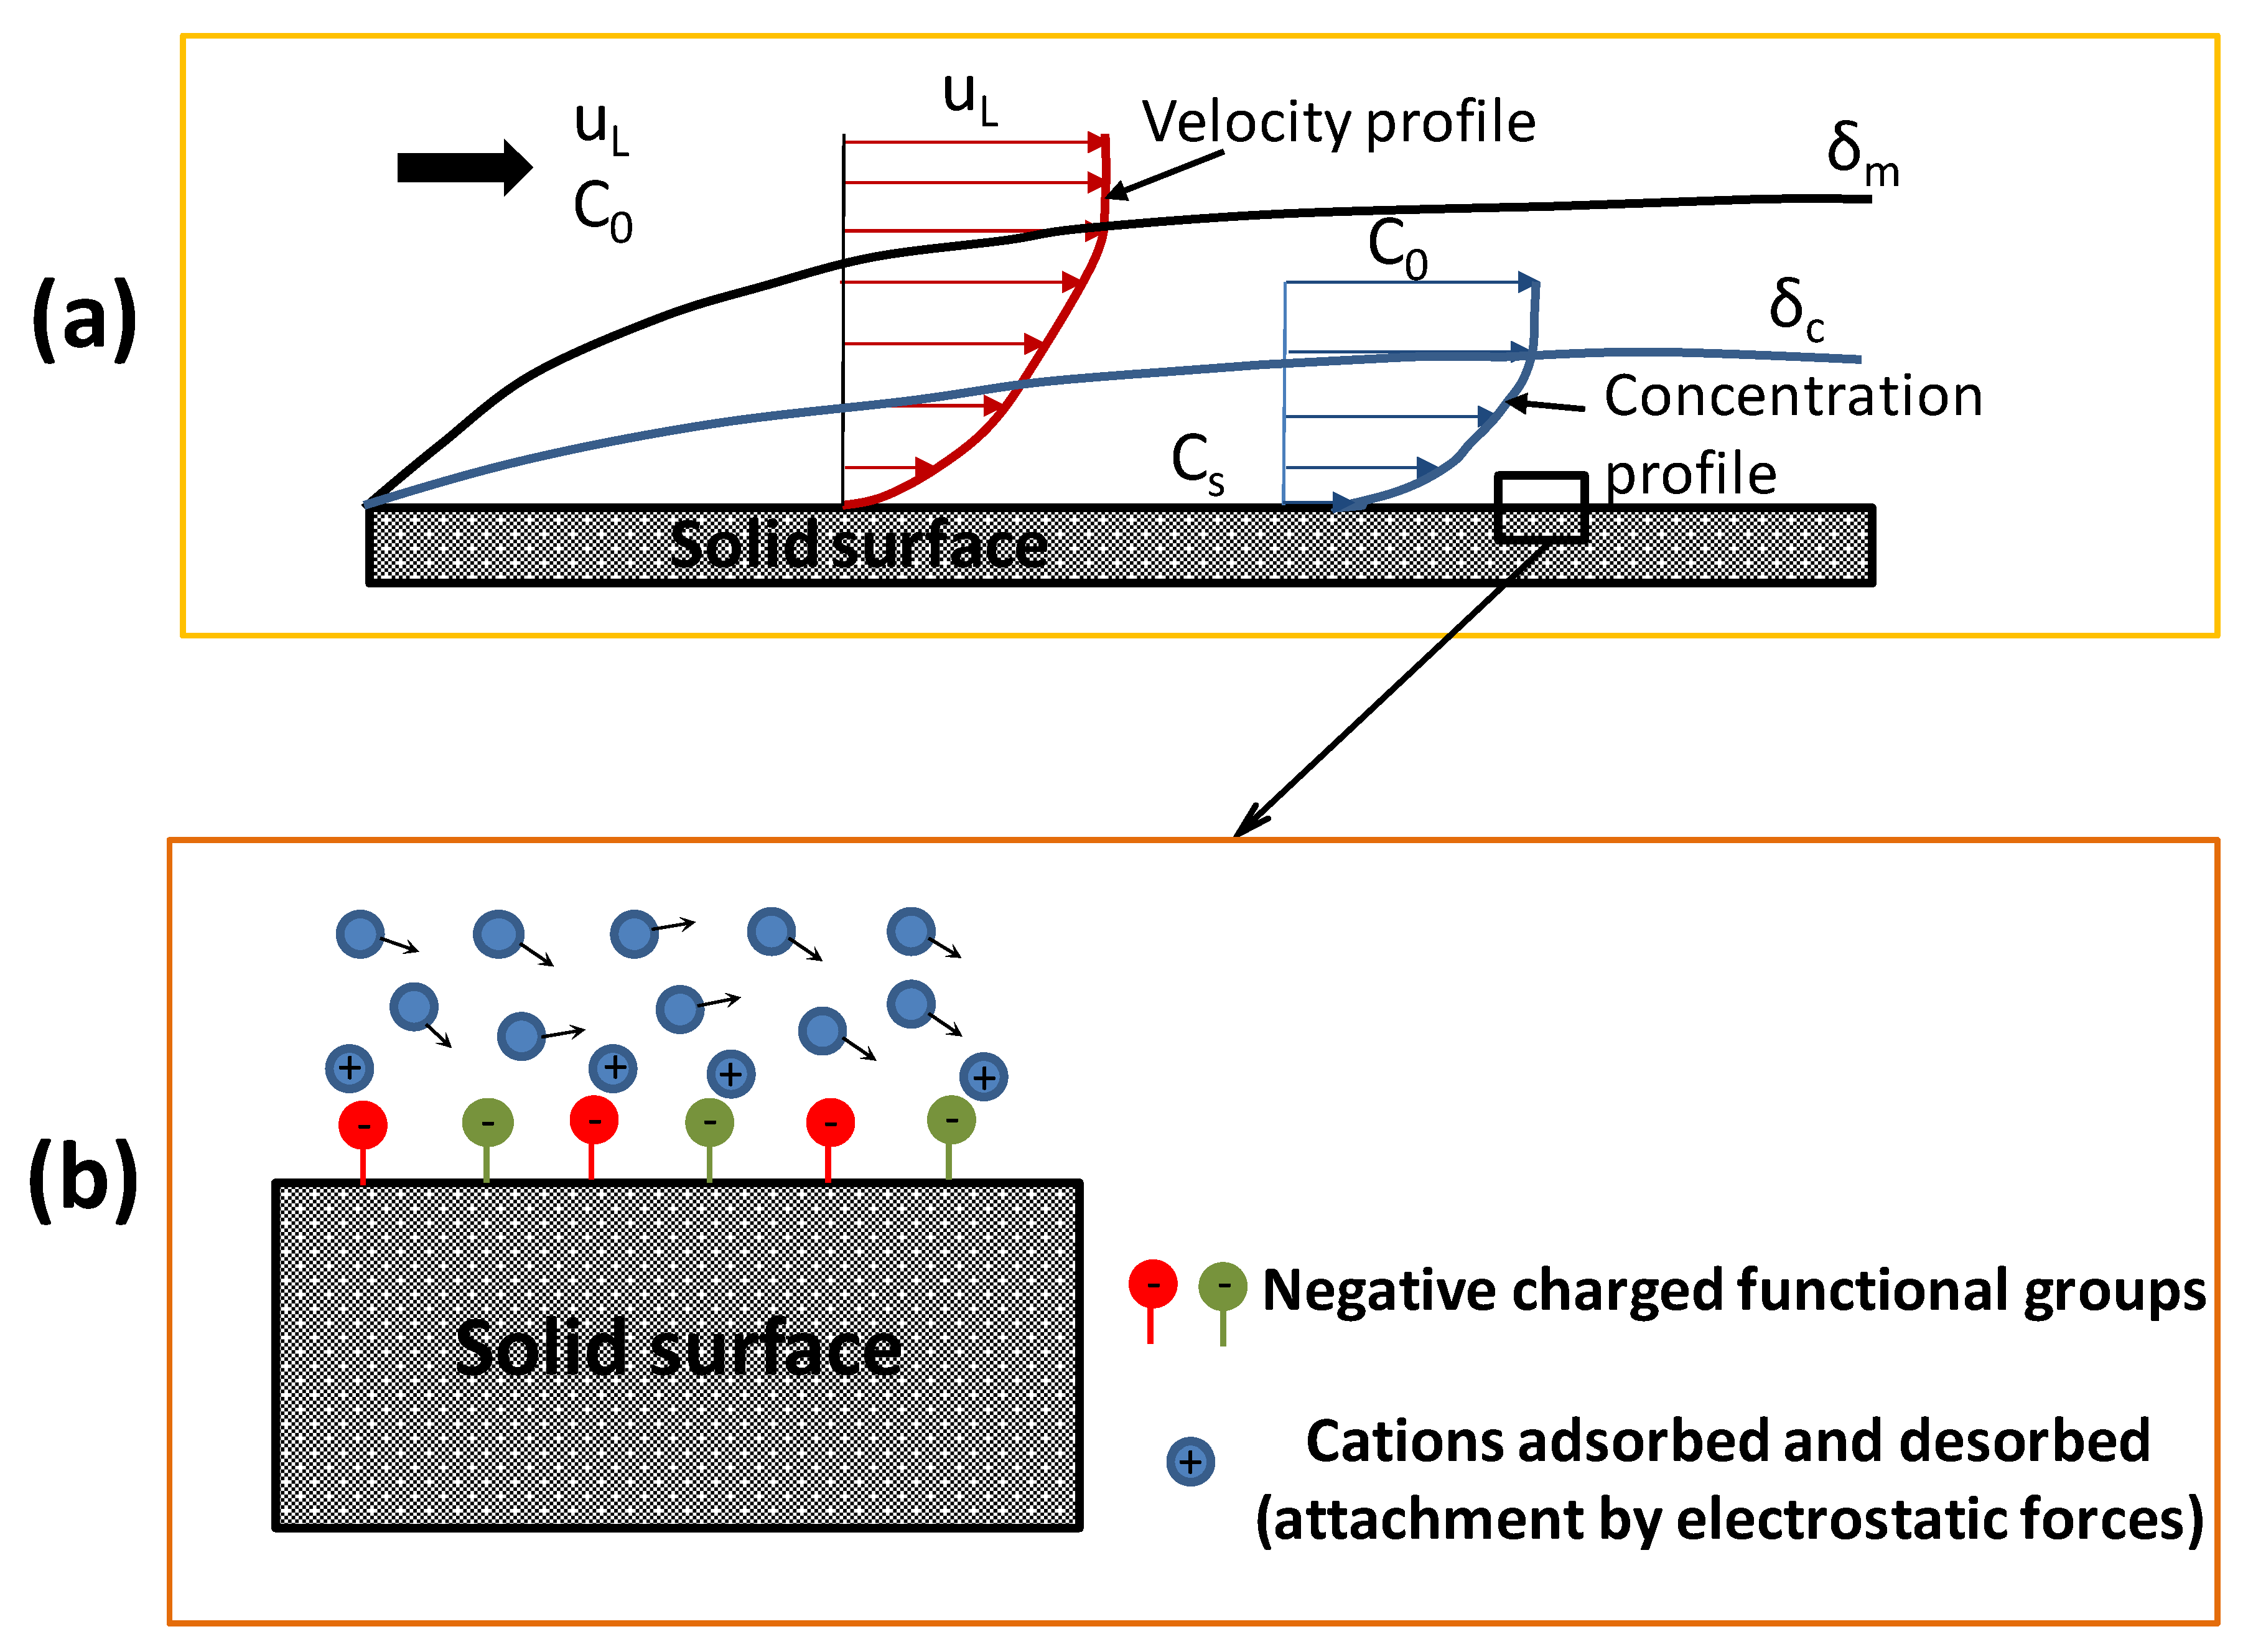
4.1. Surface Chemistry and Sorption Mechanism

Potential changes on the BP surface due to the BP sorption are evident in the FE-SEM images (Figure 2a,b). It is observed that the initially rough surface of the adsorbent (Figure 2a) is smoothed by adsorbed molecules of dyes (Figure 2b). Moreover, mercury intrusion porosimetry (MIP) data (Figure 2c,d) indicate that BP peels have low intragranular porosity (~4%), a very low specific surface area (<1 m2/g), and a trimodal pore diameter distribution (Figure 2d), associated with intergranular pores (~20–250 μm), crevices (~0.5–20 μm), and surface microroughness (<0.5 μm).
The surface chemistry of BP and its interactions with MB were analyzed by examining the ATR spectra of BP grains before and after MB adsorption (Figure 2e), and an analytic interpretation was given elsewhere [27]. A high number of hydroxyl, oxygen, and carboxyl functional groups (OH, C-O, C=O) were identified on the surface of BP. The oxygen atoms of these groups might create hydrogen bonds with the nitrogen atoms of MB [51]. The characteristic bands of MB were overlapped by stretching vibrations of BP (inset of Figure 2e). Given that the adsorbed MB mass is much less than the BP mass, the peaks associated with BP were prevalent in the spectrum. The band at ~1600 cm−1 is associated with the stretching vibrations of C=O and C-O of carboxylate groups of BP and the stretching vibration of the C=N bond of MB (Figure 2e). In this manner, the amplitude and intensity of this band changed after the MB sorption due to the electrostatic interactions between BP and MB. Respectively, the oxygen atoms of the C=O carboxylate group of BP could participate in hydrogen bonding (a form of electrostatic interactions) with the nitrogen atoms of MB, leading to the disappearance of the band at 1374 cm−1 in the spectrum of BP-MB (Figure 2e). The electrostatic interactions of the negatively charged BP surface with the positively charged cations of MB is the main mechanism of adsorption onto BP.

4.2. Equilibrium and Kinetic Parameters from Batch Tests

Nonlinear regression analysis of sorption isotherms revealed that the Langmuir (Equation (1)) and Langmuir–Freundlich (Equation (3)) models fit the data better than the Freundlich model (Equation (2)) (Table 2, Figure 3). This is reflected in the lower value of the coefficient of determination, R2, and broad confidence intervals for the Freundlich parameters (Table 2).
The foregoing estimated values of equilibrium constants, l n ( K L ) , l n ( K F ) , l n ( K L F ) (Table 2), were fitted to the van’t Hoff equation (Equation (5)) to estimate the heat of adsorption (Table 3). It seems that the reversible MB adsorption/desorption in BP is an exothermic reaction ( Δ H 0 < 0 ), whereas the fitting to the Freundlich equilibrium constant is poor (Table 3). However, depending on the type of adsorbent, the potential pretreatment, and changes on pore space morphology, the dye sorption onto sorbents may be dominated by one or more mechanisms (e.g., electrostatic interactions, pore diffusion), and such differences are commonly reflected in the different values of standard heat of adsorption (Table 4).
The equilibrium parameters estimated from sorption isotherms (Table 2) were fixed, and the kinetic constant k d was estimated (Table 5) with the nonlinear fitting of the transient MB sorption datasets to the numerical solution of Langmuir (Equation (6)) Freundlich (Equation (8)) and hybrid (Equation (10)) kinetic models (Figure 4a–c) by the ATHENA Visual Studio 14 software [52]. Due to the limited number of degrees of freedom (only one parameter to estimate), discrepancies were observed between the predicted curves and measured data (Figure 4a–c), while the confidence intervals were quite high (Table 5) for all kinetic models.
Using linear regression analysis, the kinetic constant vs. temperature datasets (Table 5) were fitted with Equation (12) to estimate the pre-exponential factor ln ( A d ) and activation energy E d for the desorption step. Subsequently, the pre-exponential factor of ln ( A a ) and activation energy E a for the adsorption step were obtained from Equation (13) along with the results of Table 3. All parameters of the sorption rate constants are summarized in Table 6. Based on R 2 values and the relative size of the standard deviation (Table 6), it seems that the fitting is very good for the Langmuir model, satisfactory for the hybrid model, and poor for the Freundlich model (Table 6). For all cases, the activation energy for the desorption step is quite high and exceeds the heat of adsorption, in agreement with the theory for exothermic reactions [46]. On the other hand, the activation energy for adsorption step is quite low, indicating that MB adsorption onto BP can be regarded as a weakly activated step (Table 6).
From Table 2, Table 3, Table 5 and Table 6, it is evident that the Langmuir isotherm and kinetic model agree with the mechanism of monolayer chemisorption of MB cations on the surface of BP grains by attractive electrostatic forces, providing the best fitting to (i) the experimental data of batch tests and (ii) generated thermodynamic parameters therefrom. It is worth mentioning that the relatively high values of heat of adsorption (Table 3) and desorption activation energy (Table 6) along with the low adsorption activation energy are consistent with the abovementioned mechanism of chemical sorption of MB on BP surface through electrostatic interactions.

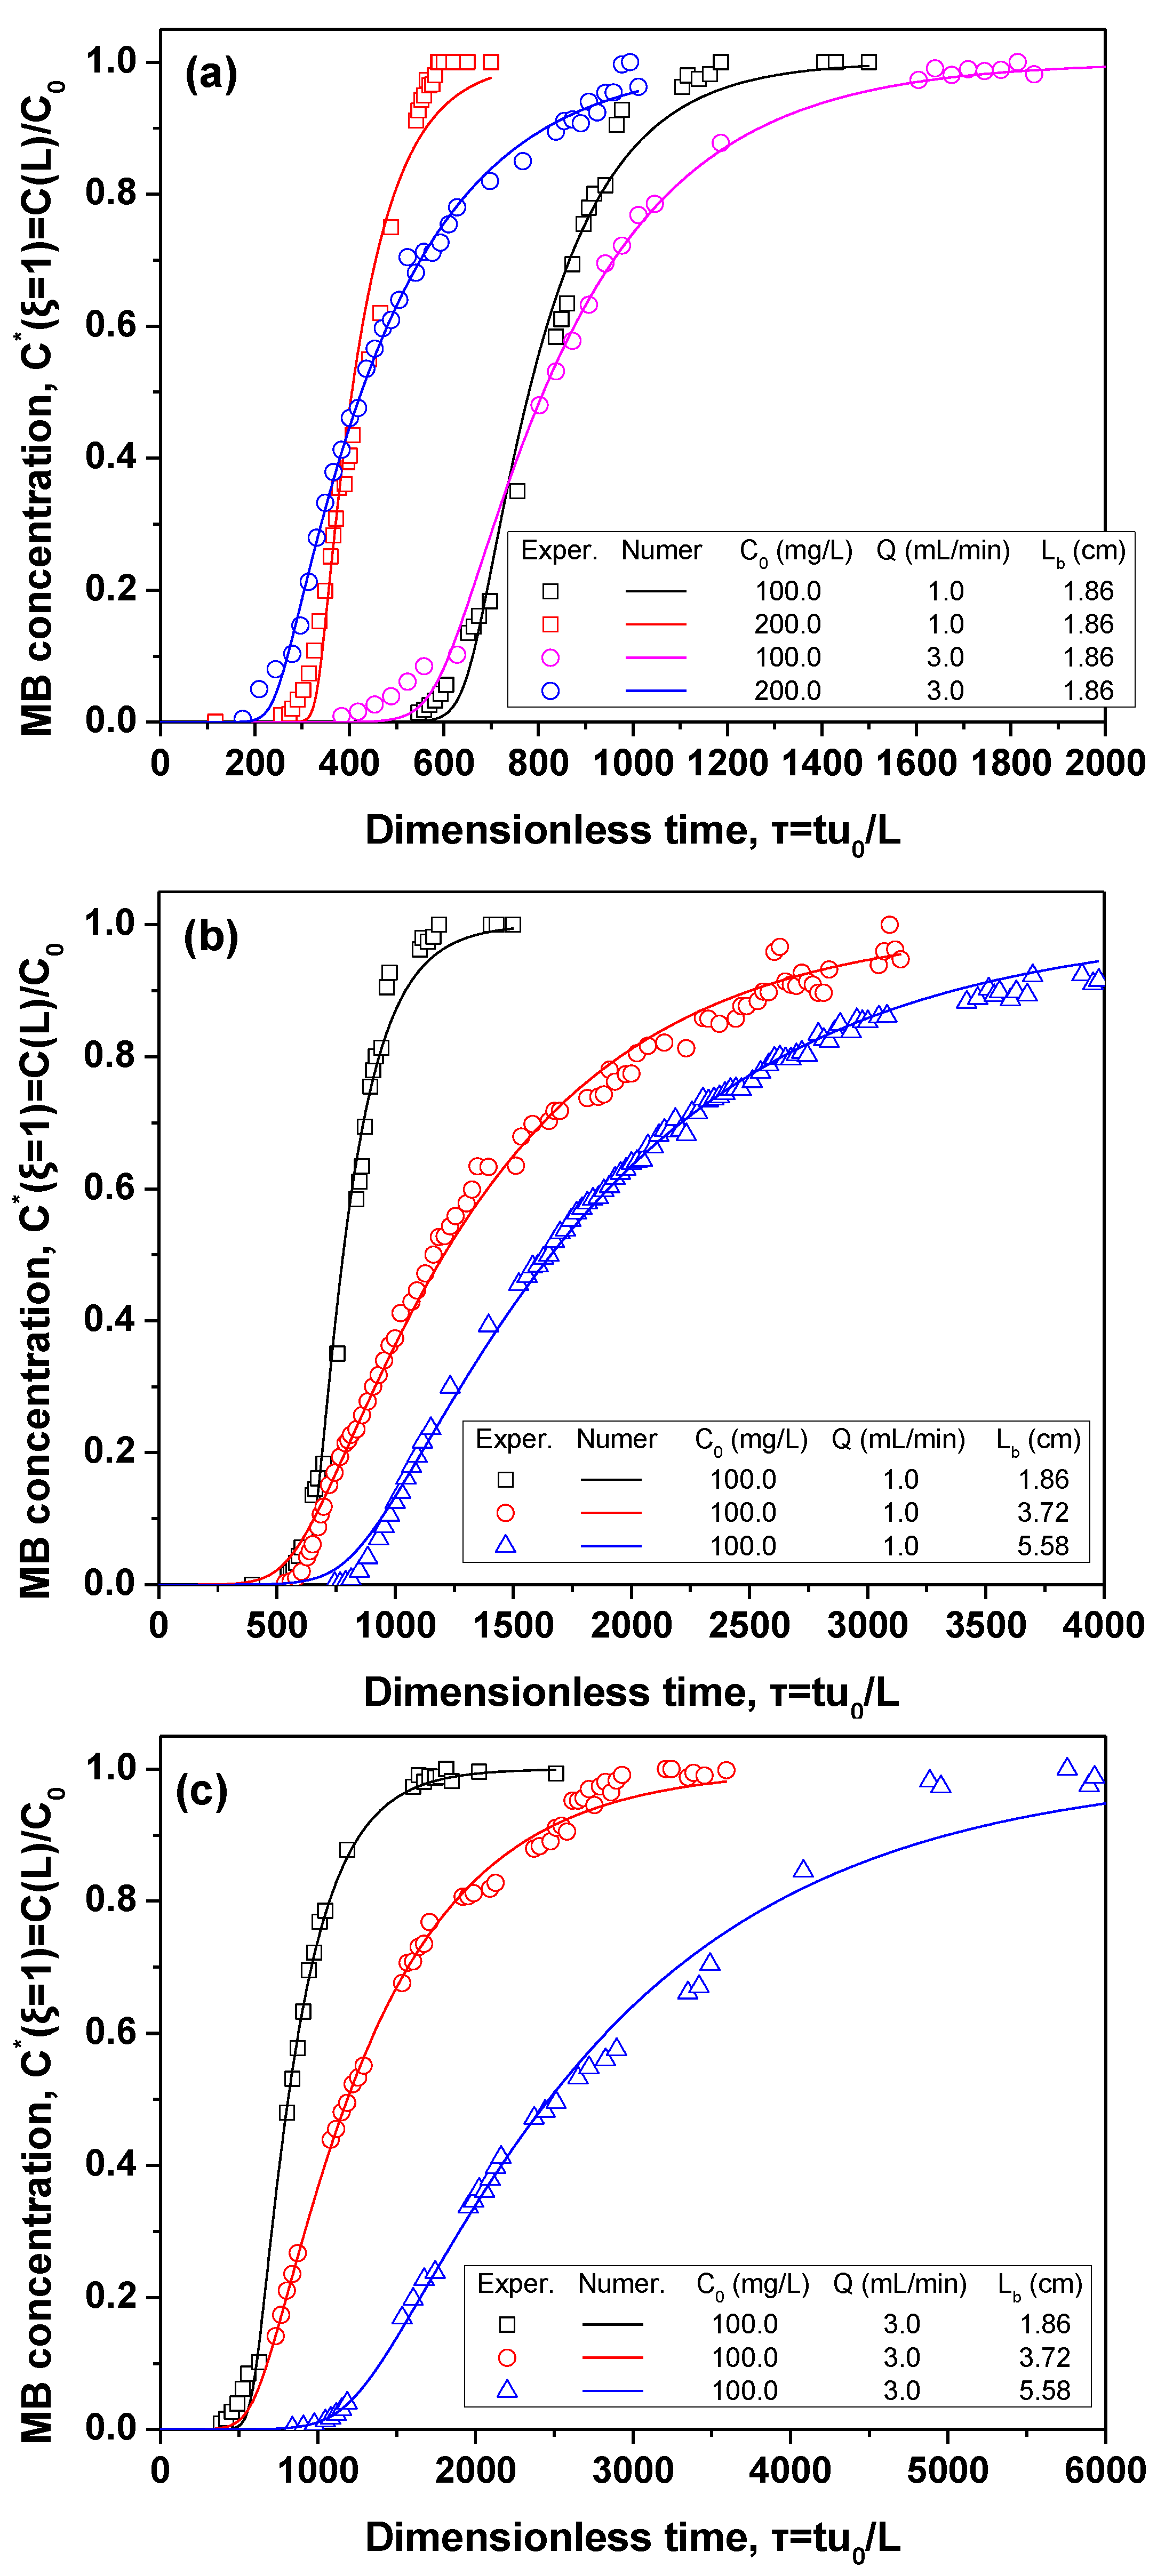
4.3. Parameter Estimation from Column Tests

To simulate the MB fate in a fixed-bed column (Figure 1c), the Langmuir isotherm and kinetic model were selected to describe the sorption process. Under these conditions, Equations (17) and (18) are transformed to
C * τ = ( 1 F ϕ P e d + a L d g ) ( d g L ) 2 C * ξ 2 C * ξ ( ρ b L a ϕ u 0 C 0 ) [ K L C 0 C * ( S max S ) S ] ( 1 + K L C 0 C * )
S τ = ( L a u 0 ) [ K L C 0 C * ( S max S ) S ] ( 1 + K L C 0 C * )
where the rate constant a is defined by
a = k d ( 1 + K L C 0 C * ) ,   k d a k d ( 1 + K L C 0 )
and its value is expected to vary over the region.
The full set of input parameters for the operation of the fixed-bed column are given in Table 7. For each set of experimental conditions ( C 0 , Q , L b ), the Langmuir equilibrium constant K L was kept equal to that estimated from batch tests at 25 °C (Table 2), and ATHENA Visual Studio 14 software was used to estimate the sorption parameter values ( S max , a ) that minimize the distance of experimental from numerically predicted breakthrough curve. Specifically, the partial differential equations (Equations (20), (25), and (26)) were solved with finite differences, under the adequate initial (Equation (22)) and boundary (Equations (19), (23), and (24)) conditions. The numerically predicted transient response of the MB concentration at the column outlet was fitted to the measured breakthrough curve by a stochastic Bayesian estimator [52], and the results are shown in Table 8. There is an excellent agreement between the experimental and numerically predicted breakthrough curves (Figure 5a–c).
The maximum MB sorption capacity of BP bed, S max , estimated from flow-through tests (Table 8) is comparable to that determined by batch experiments (Figure 6a). The rate kinetic constant estimated from column tests, a , is comparable to the lower limit of inequality (Equation (27)), k d , and much less than the upper limit k d ( 1 + K L C 0 ) (Figure 6b).
At the microscopic scale of the grain surface (Figure 7a), the near-surface flow and solute concentration fields can be approximated by the boundary layer theory so that the dynamics of solute mass-transfer toward the solid surface is correlated with the fluid properties and flow conditions [53]. Statistical thermodynamics and molecular dynamics [54] approaches are required to quantify the interactions (e.g., electrostatic attraction of MB cations to negatively charged sites of the solid surface) at the submicroscopic scale (Figure 7b).
It seems that S max increases with the flow velocity (Table 8, Figure 6a). As the flow velocity increases, the thickness of the boundary layers around the grain surfaces decreases (Figure 7a), the access of MB cations to the active sites of the solid surface is facilitated (Figure 7b), and the overall sorption capacity of the bed, S max , has the tendency to increase (Table 8, Figure 6a). As the bed length increases, nonuniformities of the flow field caused by nonrandom pore space heterogeneities, associated with the quality of bed packing, may prevent the MB access to a fraction of grain surface sites and lead to lower bed sorption capacity (Table 8, Figure 6a). On the other hand, the longer water retention times and the conditions of fully developed flow in long beds increase the probability of MB cations to access the active surface sites, increasing the overall MB sorption capacity (Table 8). Therefore, the estimated S max value may be an increasing or decreasing function of the bed length (Table 8, Figure 6a).
It seems that the kinetic constant, a , increases with the flow velocity and with initial concentration and bed length decreasing (Table 8, Figure 6b). It is a macroscopic parameter depending on the diffusive transport of dissolved molecules from the bulk phase to the external surface of the grains (Figure 7a) and the kinetics of the purely reactive process of adsorption/desorption of solute molecules surrounding the surface (Figure 7b). The diffusion rate is proportional to the concentration gradient across the boundary layer, the thickness, δ c , of which is inversely proportional to the square root of the local pore velocity [53]. Therefore, the higher the flow velocity, the thinner the concentration boundary layers around the grains and the higher the expected a values (Table 8, Figure 6b). On the other hand, the higher the feed concentration, C 0 , the higher the concentration gradient across the boundary layer (Figure 7a), the faster the diffusive rate of MB toward the solid surface, the higher the expected a values (Table 8, Figure 6b).
As the bed height increases, the spatial fluctuations of the flow velocity are enhanced due to either more frequent nonrandom heterogeneities of the pore space or higher spatial deviations of the pore velocity. Such an enhancement of the nonuniformity of the flow field may delay the MB access to grain surfaces leading to a lower sorption rate constant, a (Table 8, Figure 6b).
The mass-transfer rate of solute in a fixed-bed column is governed by: (i) the bed-scale Peclet number defined by P e b = u 0 L b / D m and regarded as the ratio of the time of convective flow to the time of diffusion; (ii) the Damköhler number defined by D a = a L / u 0 and regarded as the ratio of the time of sorption process to the time of convective flow.
For the sake of homogenization, the MB maximum sorption capacity estimated from flow tests on BP beds is expressed as a function of P e b and compared with the corresponding literature data obtained from flow tests on the beds of various biosorbents (Figure 8a). It is evident that the highest S max values were achieved with bed columns operating at a relatively low P e b < 1000 (Figure 8a). On the other hand, for the majority of other biosorbents, the MB sorption capacity was weaker, while most studies were conducted over high values of Peclet number ( P e b > > 1000 ) (Figure 8a). However, due to the different origins of adsorbents and grain sizes, it is difficult to give a full interpretation of the observed MB sorption capacity in terms of the prevailing flow and mass-transfer regime.
Regarding the sorption dynamics in BP beds, the smaller than 1.0 D a values confirm that sorption is always much slower than convective flow at the bed-scale, and sorption kinetics is a decreasing function of P e b , tending to an asymptotic value at very high P e b values (Figure 8b).

5. Conclusions

A methodology was proposed and applied to the case of methylene blue sorption onto banana peels, where sorption parameters needed for the design of pilot-scale biosorbents were obtained from the combination of batch and column studies with mutually consistent and true-to-the mechanism sorption models. Equilibrium and kinetic sorption tests of MB onto BP grains were conducted in batch reactors at temperatures of 15–45 °C to estimate thermodynamic/kinetic properties and assess the goodness-of-fit for three models used to describe the isotherms and sorption kinetics: Langmuir, Freundlich, and Hybrid (Langmuir–Freundlich).
MB sorption tests were conducted in fixed-bed columns packed with BP grains by varying the flow rate, the MB concentration in feed solution, and bed length, measuring the relevant MB concentration breakthrough curves. To estimate the maximum sorption capacity along with the sorption rate constant as functions of all pertinent parameters, the breakthrough curves were fitted to the numerical solution of a 1-D advection–dispersion–sorption model coupled with the Langmuir kinetic model.
The most important conclusions are outlined below
  • MB sorption onto BP is an exothermic and reversible process, with a strongly activated desorption step and weakly activated adsorption step.
  • Equilibrium and kinetic data are better fitted by the Langmuir model, which is consistent with the monolayer chemisorption of MB cations onto BP solid surface by electrostatic forces.
  • The experimental breakthrough curves and MB sorption capacity onto BP grains of the bed are predicted satisfactorily by the numerical model.
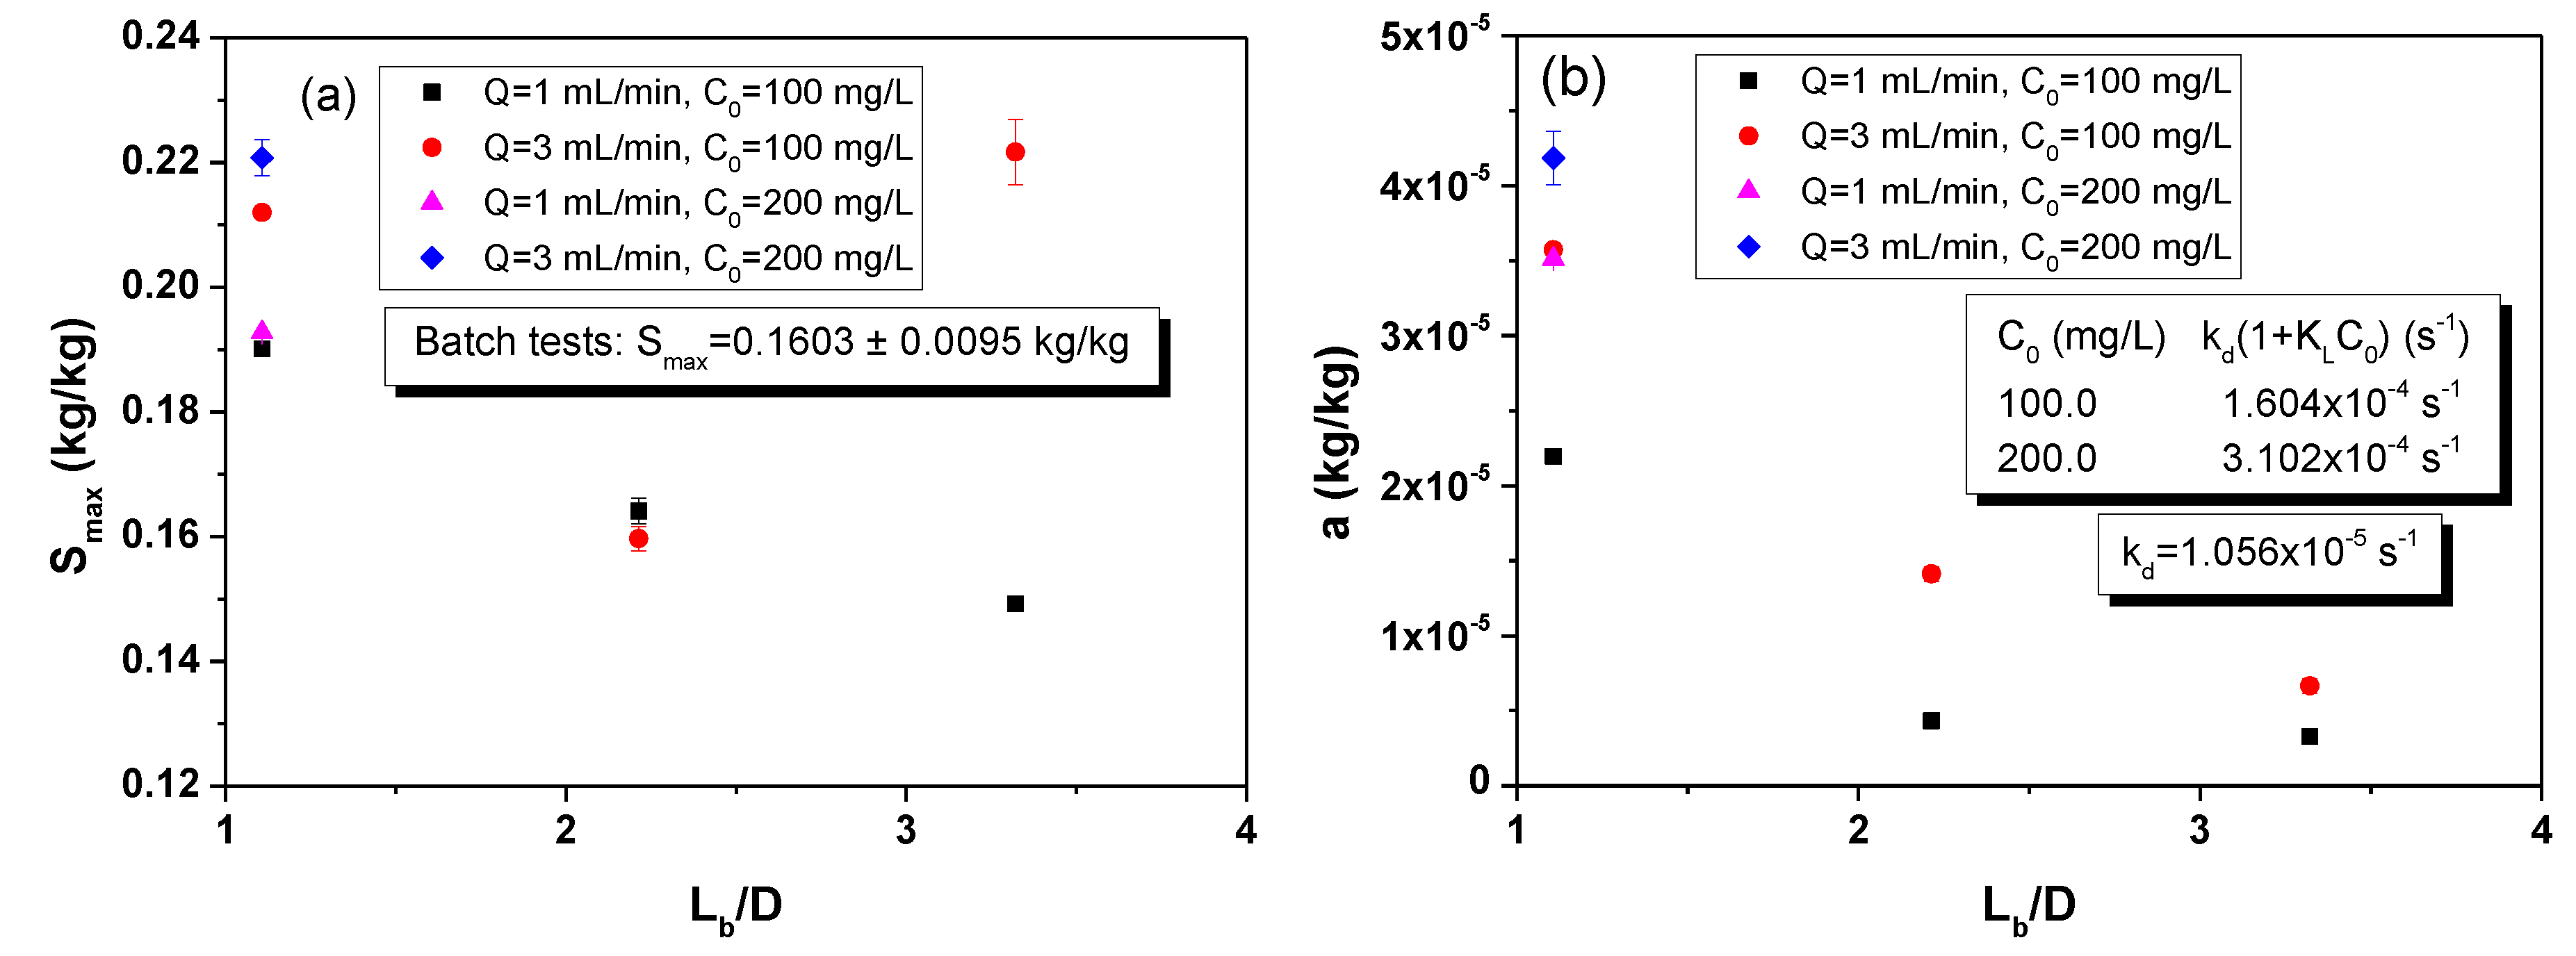
  • The sorption capacity of adsorbents under continuous flow conditions is comparable to the corresponding one estimated from batch experiments.
  • The sorption rate constant estimated from continuous flow tests on a column bed is fully compatible with corresponding parameters estimated from batch tests when the same sorption model is used.
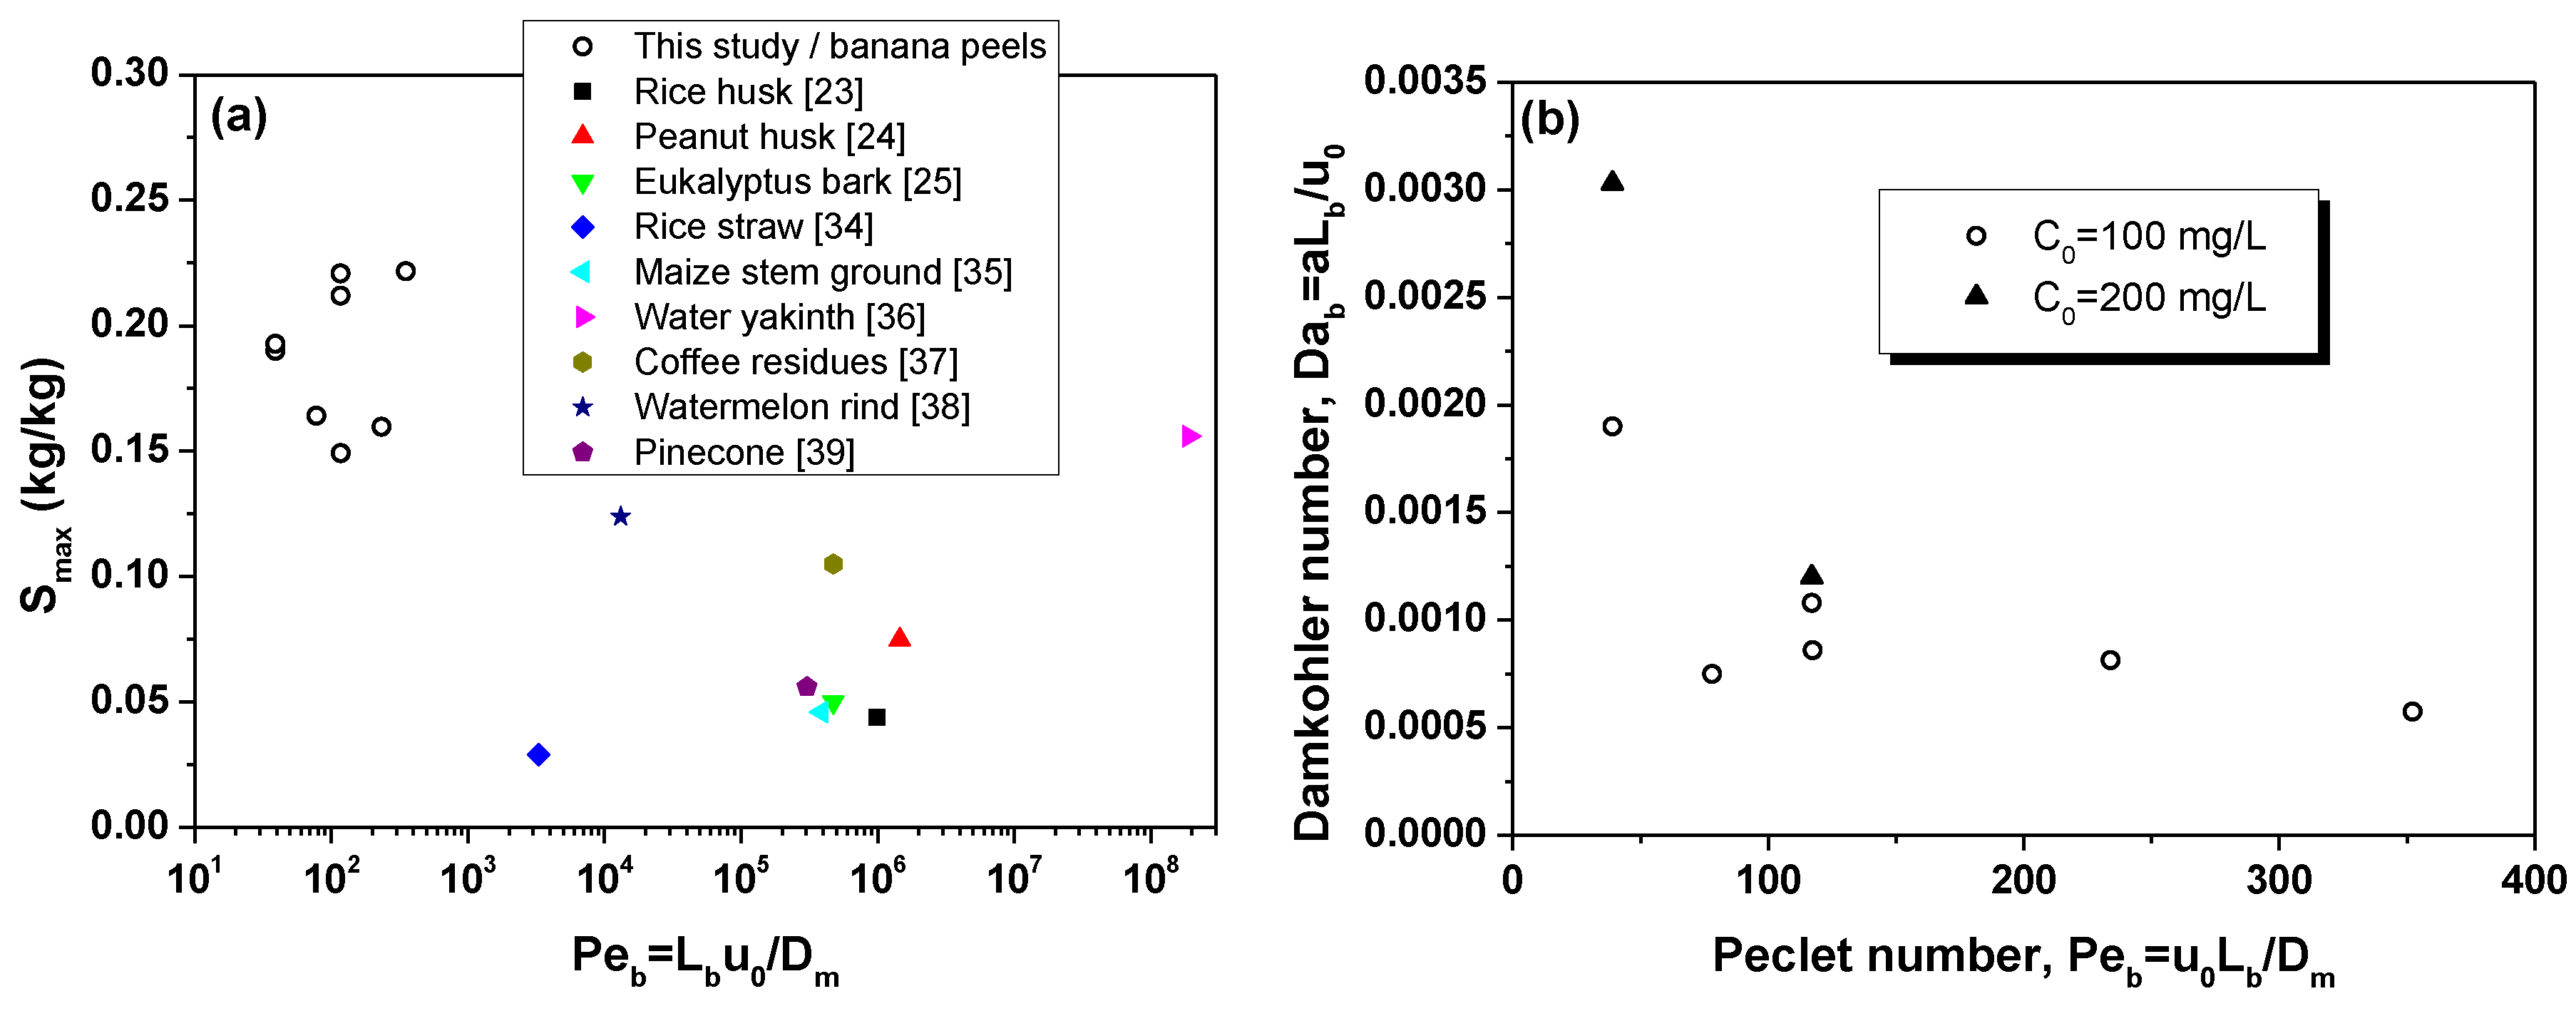
  • The kinetics of sorption in column beds is affected by the thickness of the velocity and concentration boundary layers surrounding the grains of sorbent and nonuniformities of the flow field caused by local nonrandom heterogeneities. This parameter is an increasing function of flow velocity and feed concentration and a decreasing function of bed length. It is a decreasing function of P e b , tending to an asymptotic value at high values of this parameter.
  • Compared to earlier studies, the highest MB sorption capacity was achieved in the present study with fixed-bed columns of BP operating over relatively low P e b values.
It is worth mentioning that, depending on the sorbent/sorbate system, a broad variety of equilibrium/kinetic models might be used in the aforementioned methodology. However, it is critical to use equilibrium and kinetic sorption models that are mutually consistent with each other so that, finally, a unique set of parameters is estimated. In this manner, when designing a pilot-scale system, the uncertainty associated with the choice of parameter values is minimized, and the cost-efficiency and performance of large-scale sorption systems are ensured.

Author Contributions

Conceptualization, methodology, C.D.T. and C.A.A.; investigation, formal analysis, validation, data curation, A.S.; software, C.D.T.; supervision, project administration, C.D.T.; funding acquisition, writing-review and editing, C.D.T. and C.A.A. All authors have read and agreed to the published version of the manuscript.

Funding

This research was implemented under the Actions: (1) “Action for the Strategic Development on the Research and Technological Sector” which is cofinanced by Greece and the European Union (European Regional Development Fund) through the Operational Program “Competitiveness, Entrepreneurship and Innovation, NSRF 2014–2020” (project title: “Innovative Actions in Environmental Research and Development—PErAn”; project code: MIS 5002358). (2) “Supporting Enterprises for Research Projects in the Microelectronics and Advanced Materials”, which is cofinanced by the European Union and National Resources through the Operational Program “Western Greece 2014–2020” (project title: “Development of materials for energy autonomous water purification units for its safe reuse—YLENDOR; project code: MIS 5029472).

Conflicts of Interest

The authors declare that they have no conflict of interest.

Nomenclature

A Cross-sectional area of fixed-bed column
A a Pre-exponential factor of Arrhenius rate constant for adsorption step
A d Pre-exponential factor of Arrhenius rate constant for desorption step
a Rate constant of desorption step
a L Hydrodynamic dispersion length
B Integration constant of van’t Hoff equation
C Dye concentration in aqueous solution
C 0 Initial dye concentration
C e Dye concentration in solution at equilibrium with adsorbent
C * Dimensionless dye concentration in aqueous solution
D Inside diameter of column
D L Longitudinal dispersion coefficient
D m Molecular diffusion coefficient of dye
D a Damköhler number
d g Adsorbent grain diameter
d g Mean grain size
E a Activation energy for adsorption step
E d Activation energy for desorption step
F Electrical formation factor of packed bed
K F Freundlich equilibrium constant
K L Langmuir equilibrium constant
K L F Langmuir–Freundlich equilibrium constant
k Permeability of packed bed
k a Kinetic constant of adsorption step
k d Kinetic constant of desorption step
L Column length
L b Bed length
m s Adsorbent mass
Q Volumetric flow rate
P e d Bed-scale Peclet number
P e d Grain-scale Peclet number
P e L Column-scale Peclet number
R Universal gas constant
S Adsorbed dye concentration (dye mass per unit mass of adsorbent)
S e Adsorbed dye concentration at equilibrium
S max Sorption capacity (maximum dye concentration)
T Temperature
t time
u 0 Mean pore velocity
x Axial coordinate
Greek letters
β Freundlich exponent
Δ H 0 Heat of adsorption
ξ Dimensionless axial coordinate
ξ 0 Dimensionless axial position of the upper bed surface
ρ b Bulk density of bed
τ Dimensionless time
ϕ Porosity of packed bed

References

  1. Katheresan, V.; Kansedo, J.; Lau, S.Y. Efficiency of various recent wastewater dye removal methods: A review. J. Environ. Chem. Eng. 2018, 6, 4676–4697. [Google Scholar] [CrossRef]
  2. Rawat, D.; Mishra, V.; Sharma, R.S. Detoxification of azo dyes in the context of environmental processes. Chemosphere 2016, 155, 591–605. [Google Scholar] [CrossRef] [PubMed]
  3. Brüschweiler, B.J.; Merlot, C. Azo dyes in clothing textiles can be cleaved into a series of mutagenic aromatic amines which are not regulated yet. Regul. Toxicol. Pharmacol. 2017, 88, 214–226. [Google Scholar] [CrossRef]
  4. Wainwright, M.; Crossley, K.B. Methylene Blue—A therapeutic dye for all seasons? J. Chemother. 2002, 14, 431–443. [Google Scholar] [CrossRef] [PubMed]
  5. Bhatnagar, A.; Sillanpää, M. Utilization of agro-industrial and municipal waste materials as potential adsorbents for water treatment—A review. Chem. Eng. J. 2010, 157, 277–296. [Google Scholar] [CrossRef]
  6. Alvarez-Torrellas, S.; Boutahala, M.; Boukhalfa, N.; Munoz, M. Effective Adsorption of methylene blue dye onto magnetic nanocomposites. Modeling and Reuse Studies. Appl. Sci. 2019, 9, 4563. [Google Scholar] [CrossRef] [Green Version]
  7. Djilani, C.; Zaghdoudi, R.; Djazi, F.; Bouchekima, B.; Lallam, A.; Modarressi, A.; Rogalski, M. Adsorption of dyes on activated carbon prepared from apricot stones and commercial activated carbon. J. Taiwan Inst. Chem. Eng. 2015, 53, 112–121. [Google Scholar] [CrossRef]
  8. Mailler, R.; Gasperi, J.; Coquet, Y.; Derome, C.; Buleté, A.; Vulliet, E.; Bressy, A.; Varrault, G.; Chebbo, G.; Rocher, V. Removal of emerging micropollutants from wastewater by activated carbon adsorption: Experimental study of different activated carbons and factors influencing the adsorption of micropollutants in wastewater. J. Environ. Chem. Eng. 2016, 4, 1102–1109. [Google Scholar] [CrossRef] [Green Version]
  9. Bhatnagar, A. Applications of Adsorbent for Water Pollution Control; Bentham Science Publishers: Sharjah, UAE, 2012; pp. 382–412. [Google Scholar]
  10. Cui, L.; Liu, C.; Wu, G. Performance and mechanism of methylene blue biosorption on orange peel. Environ. Technol. 2008, 29, 1021–1030. [Google Scholar] [CrossRef]
  11. Saeed, A.; Sharif, M.; Iqbal, M. Application potential of grapefruit peel as dye sorbent: Kinetics, equilibrium and mechanism of crystal violet adsorption. J. Hazard. Mater. 2010, 179, 564–572. [Google Scholar] [CrossRef] [PubMed]
  12. Tanyildizi, M.T. Modeling of adsorption isotherms and kinetics of reactive dye from aqueous solution by peanut hull. Chem. Eng. J. 2011, 168, 1234–1240. [Google Scholar] [CrossRef]
  13. Deniz, F.; Karaman, S. Removal of Basic Red 46 dye from aqueous solution by pine tree leaves. Chem. Eng. J. 2011, 170, 67–74. [Google Scholar] [CrossRef]
  14. Rizzi, V.; D’Agostino, F.; Gubitosa, J.; Fini, P.; Petrella, A.; Agostiano, A.; Semeraro, P.; Cosma, P. An alternative use of olive pomace as a wide-ranging bioremediation strategy to adsorb and recover disperse orange and disperse red industrial dyes from wastewater. Separations 2017, 4, 29. [Google Scholar] [CrossRef] [Green Version]
  15. Rizzi, V.; D’Agostino, F.; Fini, P.; Semeraro, P.; Cosma, P. An interesting environmental frinedly cleanup: The excellent potential of olive pomace for disperse blue adsorption/desoprtion from wastewater. Dyes Pigm. 2017, 140, 480–490. [Google Scholar] [CrossRef]
  16. Rizzi, V.; Mongiovi, C.; Fini, P.; Petrella, A.; Semeraro, P.; Cosma, P. Operational parameters affecting the removal and recycling of dierct blue industrial dye from wastewater using bleached oil mill waste as alternative adsorbent material. Int. J. Environ. Agric. Biotechnol. 2017, 2, 1560–1572. [Google Scholar]
  17. Rizzi, V.; Lacalamita, D.; Gubitosa, J.; Fini, P.; Petrella, A.; Romita, R.; Agostiano, A.; Gabaldon, J.A.; Gorbe, M.I.F.; Gomez-Morte, T.; et al. Removal of tetracycline from polluted water by chitosan-olive pomace adsorbing films. Sci. Tot. Environ. 2019, 693, 1–12. [Google Scholar] [CrossRef]
  18. Palma, C.; Contreras, E.; Urra, J.; Martínez, M.J. Eco-friendly technologies based on banana peel use for the decolourization of the dyeing process wastewater. Waste Biomass Valor. 2011, 2, 77–86. [Google Scholar] [CrossRef]
  19. Dahiru, M.; Uba Zango, Z.; Haruna, M.A. Cationic Dyes Removal Using Low-Cost Banana Peel Biosorbent. Am. J. Mater. Sci. 2018, 8, 32–38. [Google Scholar]
  20. Mondal, N.K.; Kar, S. Potentiality of banana peel for removal of Congo red dye from aqueous solution: Isotherm, kinetics and thermodynamics studies. Appl. Water Sci. 2018, 8, 157. [Google Scholar] [CrossRef] [Green Version]
  21. Abbas, S.H.; Kamar, F.H.; Hossien, Y.K. Methyl Violet 2B Dye from Aqueous Solutions Onto Waste of Banana Peel Using Fixed-Bed Column. Int. J. Civ. Eng. Technol. 2018, 9, 2094–2109. [Google Scholar]
  22. Djelloul, C.; Hamdaoui, O. Dynamic adsorption of methylene blue by melon peel in fixed-bed columns. Desalin. Water Treat. 2015, 56, 2966–2975. [Google Scholar] [CrossRef]
  23. Han, R.; Wang, Y.; Yu, W.; Zou, W.; Shi, J.; Liu, H. Biosorption of methylene blue from aqueous solution by rice husk in a fixed-bed column. J. Hazard. Mater. 2007, 141, 713–718. [Google Scholar] [CrossRef] [PubMed]
  24. Song, J.; Zou, W.; Bian, Y.; Su, F.; Han, R. Adsorption characteristics of methylene blue by peanut husk in batch and colmn modes. Desalination 2011, 265, 119–125. [Google Scholar] [CrossRef]
  25. Afroze, S.; Sen, T.K.; Ang, H.M. Adsorption performance of continuous fixed bed column for the removal of methylene blue (MB) dye using Eucalyptus sheathiana bark biomass. Res. Chem. Interm. 2016, 42, 2343–2364. [Google Scholar] [CrossRef]
  26. Dardouri, S.; Sghaier, J. Adsorptive removal of methylene blue from aqueous solution using different agricultural wastes as adsorbents. Korean J. Chem. Eng. 2017, 34, 1037–1043. [Google Scholar] [CrossRef]
  27. Stavrinou, A.; Aggelopoulos, C.A.; Tsakiroglou, C.D. Exploring the adsorption mechanisms of cationic and anionic dyes onto agricultural waste peels of banana, cucumber and potato: Adsorption kinetics and equilibrium isotherms as a tool. J. Environ. Chem. Eng. 2018, 6, 6958–6970. [Google Scholar] [CrossRef]
  28. Chen, Z.; Zhang, J.; Fu, J.; Wang, M.; Wang, X.; Han, R.; Xu, Q. Adsorption of methylene blue onto poly(cyclotriphosphazene-co-4,4′-sulfonyldiphenol) nanotubes: Kinetics, isotherm and thermodynamic analysis. J. Hazard. Mat. 2014, 273, 263–271. [Google Scholar] [CrossRef]
  29. Inyinbor, A.A.; Adekola, F.A.; Olatunji, G.A. Kinetics, isotherms and thermodynamic modeling of liquid phase adsorption of Rhodamine B dye onto Raphia hookerie fruit epicarp. Water Resour. Ind. 2016, 15, 14–27. [Google Scholar] [CrossRef] [Green Version]
  30. Li, C.; Xia, H.; Zhang, L.; Peng, J.; Cheng, S.; Shu, J.; Zhang, S. Kinetics, tehrmodynamics, amnd isotherm study on the removal of methylene blue dye by adsorption via copper modified activated carbon. Res. Chem. Intermed. 2018, 44, 2231–2250. [Google Scholar] [CrossRef]
  31. Varadarajan, G.; Ponnusami, V. Kinetics, equilibrium, and tehrmodynamic studies on adsorption of methylene blue by carbonized plant leaf powder. J. Chem. 2013, 2013, 415280. [Google Scholar] [CrossRef]
  32. Patel, H. Fixed-bed column adsorption study: A comprehensive review. Appl. Water Sci. 2019, 9, 9–45. [Google Scholar] [CrossRef] [Green Version]
  33. Al-Degs, Y.S.; Khraisheh, M.A.M.; Allen, S.J.; Ahmad, M.N. Adsorption characteristics of reactive dyes in columns of activated carbon. J. Hazard. Mater. 2009, 165, 944–949. [Google Scholar] [CrossRef] [PubMed]
  34. Singh, B.; Thakur, V.; Bhatia, G.; Verma, D.; Singh, K. Eco-friendly and Cost-effective Use of Rice Straw in the Form of Fixed Bed Column to Remove Water Pollutants. J. Biorem. Biodegrad. 2016, 7, 1000374. [Google Scholar] [CrossRef] [Green Version]
  35. Kojić, P.S.; Vučurović, V.V.; Lukić, N.L.; Karadžić, M.; Popović, S.S. Continuous adsorption of methylene blue dye on the maize stem ground tissue. Acta Periodica Technol. 2017, 48, 127–139. [Google Scholar] [CrossRef]
  36. Khan, M.R.; Mozumder, S.I.; Islam, A.; Prasad, D.M.R.; Alam, M.M. Methylene blue adsorption onto water hyacinth: Batch and column study. Water Air Soil Pollut. 2012, 223, 2943–2953. [Google Scholar] [CrossRef]
  37. Kopsidas, O. Fixed-bed-column Studies for Methylene Blue Removal and Recovery by Untreated Coffee Residues. J. Environ. Sci. Eng. B 2016, 5, 412–418. [Google Scholar] [CrossRef]
  38. Lakshmipathy, R.; Sarada, N.C. Methylene blue adsorption onto native watermelon rind: Batch and fixed bed column studies. Desalin. Water Treat. 2016, 57, 10632–10645. [Google Scholar] [CrossRef]
  39. Yagub, M.T.; Sen, T.K.; Afroze, S.; Ang, H.M. Fixed-bed dynamic column adsorption study of methylene blue (MB) onto pine cone. Desalin. Water Treat. 2015, 55, 1026–1039. [Google Scholar] [CrossRef]
  40. Akar, S.T.; Gorgulu, A.; Akar, T.; Celik, S. Decolorization of reactive blue 49 contaminated solutions by capsicum anuum seeds: Batch and continuous mode biosorption applications. Chem. Eng. J. 2011, 168, 125–133. [Google Scholar] [CrossRef]
  41. Sadaf, S.; Bhatti, H.N. Batch and fixed-bed column studies for the removal of indosol yellow BG dye by peanut husk. J. Taiwan Inst. Chem. Eng. 2014, 45, 541–553. [Google Scholar] [CrossRef]
  42. Bharathi, K.S.; Ramesh, S.P.T. Fixed-bed column studies on biosorption of crystal violet from aqueous solution by Citrullus lanatus rind and Cyperus rotundus. Appl. Water Sci. 2013, 3, 673–687. [Google Scholar] [CrossRef] [Green Version]
  43. Foo, K.Y.; Hameed, B.H. Insights into the modeling of adsorption isotherm systems. Chem. Eng. J. 2010, 156, 2–10. [Google Scholar] [CrossRef]
  44. Foo, K.Y.; Hameed, B.H. Dynamic adsorption behavior of methylene blue onto oil palm shell granular activated carbon prepared by microwave heating. Chem. Eng. J. 2012, 203, 81–87. [Google Scholar] [CrossRef]
  45. Ayawei, N.; Ebelegi, A.N.; Wankasi, D. Modelling and Interpretation of adsorption isotherms. J. Chem. 2017, 2017, 3039817. [Google Scholar] [CrossRef]
  46. Smith, J.M. Chemical Engineering Kinetics, 3rd ed.; McGraw-Hill: Tokyo, Japan, 1981; pp. 9–57. [Google Scholar]
  47. Ghosal, P.S.; Gupta, A.K. Development of a generalized adsorption isotherm model at solid-liquid interface: A novel approach. J. Mol. Liq. 2017, 240, 21–24. [Google Scholar] [CrossRef]
  48. Scopp, J. Derivation of the Freundlich Adsorption Isotherm from Kinetics. J. Chem. Educ. 2009, 86, 1341–1343. [Google Scholar] [CrossRef]
  49. Magga, Z.; Tzovolou, D.N.; Theodoropoulou, M.A.; Dalkarani, T.; Pikios, K.; Tsakiroglou, C.D. Soil column experiments used as a means to assess transport, sorption, and biodegradation of pesticides in groundwater. J Environ. Sci. Health B 2008, 43, 732–741. [Google Scholar] [CrossRef]
  50. Aggelopoulos, C.A.; Tsakiroglou, C.D. The longitudinal dispersion coefficient of soils as related to the variability of local permeability. Water Air Soil Pollut. 2007, 185, 223–237. [Google Scholar] [CrossRef]
  51. Jawad, A.H.; Razuan, R.; Appaturi, J.N.; Wilson, L.D. Adsorption and mechanism study for methylene blue dye removal with carbonized watermellon (Citrullus lanatus) rind preparde via one-step liquid phase H2SO4 activation. Surf. Interfaces 2019, 16, 76–84. [Google Scholar] [CrossRef]
  52. Stewart, W.E.; Caracotsios, M. Computer-Aided Modeling of Reactive Systems; Wiley-Interscience: Hoboken, NJ, USA, 2008; pp. 177–257. [Google Scholar]
  53. Bird, R.B.; Stewart, W.E.; Lightfoot, E.N. Transport Phenomena; Wiley: New York, NY, USA, 1960; pp. 592–625. [Google Scholar]
  54. Khalfaoui, M.; Nakhli, A.; Aguir, C.; Omri, A.; M’henni, M.F.; Ben Lamine, A. Statistical thermodynamics of adsorption of dye DR75 onto natural materials and its modifications: Double-layer model with two adsorption energies. Environ. Sci. Pollut. Res. 2014, 21, 3134–3144. [Google Scholar] [CrossRef]
Figure 1. (a) Components of the fixed-bed column. (b) Packing material. (c) Schematic diagram of the experimental setup.
Processes 08 01467 g001
Figure 2. Representative FE-SEM images of BP (a) before and (b) after methylene blue (MB) adsorption. (c) Cumulative and (d) differential pore diameter distribution of banana peels from mercury intrusion porosimetry (MIP) data. (e) ATR-FTIR spectra of banana peels’ (BP) surface before and after MB adsorption.
Processes 08 01467 g002
Figure 3. Experimental vs. predicted isotherms of MB sorption onto BP grains. (a) Langmuir model. (b) Freundlich model. (c) Langmuir–Freundlich model.
Processes 08 01467 g003
Figure 4. Experimental vs. numerically predicted transient response of MB sorption onto BP for the three kinetic models: (a) Langmuir; (b) Freundlich; (c) hybrid (Langmuir–Freundlich).
Processes 08 01467 g004
Figure 5. Experimentally measured vs. numerically predicted breakthrough curves of the MB concentration under varying flow conditions in a fixed-bed column of BP grains. (a) Effect of the inlet MB concentration on the breakthrough curves. (b) Effect of the bed length on the breakthrough curves at a low flow rate. (c) Effect of the bed length on the breakthrough curves at a high flow rate.
Processes 08 01467 g005
Figure 6. Estimated sorption properties of BP bed as functions of all pertinent parameters: (a) maximum sorption capacity; (b) sorption kinetic constant.
Processes 08 01467 g006
Figure 7. (a) Approximate velocity and concentration boundary layers at the vicinity of the grain surface (its curvature is ignored; uL is the local pore velocity; Cs is the solute concentration at the liquid/solid interface). (b) At the submicroscopic level, the sorption of a cationic dye on the solid surface may be governed by the near-surface concentration of MB cations, the frequency of their collisions with the surface, and the strength of attractive electrostatic forces between the negatively charged sites and positively charged cations.
Processes 08 01467 g007
Figure 8. (a) Maximum MB sorption capacity of BP bed as function of Peclet number, as compared with that of other biosorbent beds from earlier studies; (b) Variability of kinetic sorption constant of BP bed (Damkohler number) as a function of Peclet number.
Processes 08 01467 g008
Table 1. Dye sorption capacity for banana peels and other biosorbents.
AdsorbentDyeSorption Capacity (mg/g)Mode of StudyReference
Banana peelMethylene blue210Batch[27]
Cucumber peelMethylene blue170Batch[27]
Potato peelMethylene blue110Batch[27]
Banana peelMethylene blue, Malachite green120Batch[19]
Banana peelAcid Black 1250Batch[18]
Banana peelCongo red1.7Batch[20]
Copper-modified activated carbonMethylene blue323Batch[30]
Carbonized plant leaf powderMethylene blue61.2Batch[31]
Grapefruit peelCrystal Violet254Batch[11]
Olive pomaceDirect red, Direct orange>4, >3.5Batch[14]
Oil mill wasteDirect blue>5Batch[16]
Banana peelMethylene blue150–220Fixed-bed columnThis study
Rice huskMethylene blue4.4Fixed-bed column[23]
Peanut huskMethylene blue75.1Fixed-bed column[24]
Eucalyptus sheathiana bark biomassMethylene blue49.5Fixed-bed column[25]
Rice strawMethylene blue29Fixed-bed column[34]
Maize stem groundMethylene blue45.9Fixed-bed column[35]
Water hyakinthMethylene blue156Fixed-bed column[36]
Coffee residuesMethylene blue104.5Fixed-bed column[37]
Watermelon rindMethylene blue 124.4Fixed-bed column[38]
PineconeMethylene blue55.7Fixed-bed column[39]
Capsicum annuum seedsReactive blue 4965.5Fixed-bed column[40]
Peanut huskIndosol Yellow BG25.9Fixed-bed column[41]
Citrullus lanatus rind and Cyperus rotundusCrystal violet54.2Fixed-bed column[42]
Table 2. Optimal estimates and 95% confidence intervals of isotherm parameters for MB adsorption onto BP.
ModelParameterTemperature (°C)
15253545
LangmuirSmax (mg/g)153.4 ± 8.1160.3 ± 9.5184.1 ± 14.0158.7 ± 11.9
KL (L/mg)0.196 ± 0.0430.142 ± 0.0330.11 ± 0.0290.090 ± 0.0253
R20.9910.9900.9880.987
Freundlichβ0.278 ± 0.07170.290 ± 0.08170.314 ± 0.09360.325 ± 0.069
KF (L/mg)n(mg/g)
((mg/g)(L/g)n)
42.49 ± 12.4440.72 ± 13.4541.39 ± 15.1632.45 ± 9.25
R20.9420.9350.9290.964
Langmuir–Freundlich Smax (mg/g)166.85 ± 13.91171.34 ± 21.02201.11 ± 19.98184.21 ± 35.63
KL (L/mg)0.227 ± 0.0370.169 ± 0.0460.140 ± 0.04050.122 ± 0.032
β0.775 ± 0.1370.826 ± 0.2090.802 ± 0.1570.737 ± 0.201
R20.9960.9930.9860.993
Table 3. Thermodynamic parameters for the MB sorption onto BP.
ModelParameterOptimal Value ± Standard Error
LangmuirΔH0 (kJ/mol)−19.72 ± 1.10
ln(B) −9.89 ± 0.44
R20.991
0.9869
FreundlichΔH0 (kJ/mol)−5.93 ± 3.06
ln(B) 1.68 ± 0.94
R20.478
Langmuir–FreundlichΔH0 (kJ/mol)−15.75 ± 1.50
ln(B) −8.09 ± 0.60
R20.973
Table 4. Thermodynamic properties of adsorbents from literature.
AdsorbentDyeΔH0 (kJ/mol)Reference
Banana peelMethylene blue−20.0This study
Banana peelCongo red−28.3[20]
Copper-modified activated carbonMethylene blue6.2[30]
PZS nanotubesMethylene blue9.8[28]
Carbonized Plant Leaf PowderMethylene blue23.1[31]
Table 5. Optimal estimates and 95% confidence intervals of the parameters of three kinetic models for MB sorption onto BP.
ModelParameterTemperature (°C)
15253545
Langmuirkd × 103 (min−1)0.397 ± 0.140.634 ± 0.1940.777 ± 0.1821.328 ± 0.308
R20.8970.9300.9620.9625
Freundlichkd × 103 (min−1)6.40 ± 2.617.68 ± 2.737.25 ± 2.0110.87 ± 2.84
R20.8530.8960.9390.947
Hybrid kd × 103 (min−1)0.814 ± 0.3131.056 ± 0.3431.305 ± 0.3372.617 ± 0.653
R20.8750.9190.9520.954
Table 6. Kinetic parameters for the MB sorption onto BP.
ModelParameterOptimal Value ± Standard Error
Langmuir kinetic modelEd (kJ/mol)29.02 ± 3.58
ln(Ad) 4.29 ± 1.42
R20.956
Ea (kJ/mol)9.30
ln(Aa) −5.6
Freundlich kinetic modelEd (kJ/mol)11.48 ± 4.87
ln(Ad) −0.28 ± 1.94
R20.603
Ea (kJ/mol)5.55
ln(Aa) 1.40
Langmuir–Freundlich (hybrid) kinetic modelEd (kJ/mol)28.04 ± 6.50
ln(Ad) 4.51 ± 2.58
R20.855
Ea (kJ/mol)12.29
ln(Aa) −3.59
Table 7. Geometrical parameters and physical properties of the experimental system.
D (m)0.0168 ϕ 0.35
L (m)0.0665 F 4.0
C 0 (kg/m3)0.1a  k (m2)0.8 × 10⁻¹²
0.2
u 0 (m s−1)2.15 × 10⁻⁴ d g (m)3.0 × 10⁻⁴
6.45 × 10⁻⁴
L b (m)0.0186 a L (m)3.0 × 10⁻⁴
0.0372
0.0558
ρ b (kg m−3)590 D m (m2 s−1)4.6 × 10⁻¹⁰
a Measured Darcy permeability of the packed column.
Table 8. Sorption parameters estimated with inverse modeling of column tests ( T = 25 °C, KL = 141.9 m3 kg−1, kd = 1.05 × 10⁻⁵s−1).
Q (mL/min)Lb/DC0
(mg/L)
Smax
(kg/kg)
a × 105 (s−1) SSR (Sum of Square Residuals)
1.01.107100.00.190 ± 0.00032.195 ± 0.00080.047
1.01.107200.00.193 ± 0.00023.511 ± 0.00790.1093
1.02.214100.00.164 ± 0.00200.433 ± 0.01410.0512
1.03.321100.00.149 ± 0.00090.330 ± 0.00570.0213
3.01.107100.00.212 ± 0.00013.753 ± 0.00120.0102
3.01.107200.00.221 ± 0.00294.184 ± 0.179 0.0154
3.02.214100.00.160 ± 0.00191.412 ± 0.0490.0163
3.03.321100.00.222 ± 0.00530.666 ± 0.0480.0372
Publisher’s Note: MDPI stays neutral with regard to jurisdictional claims in published maps and institutional affiliations.

