Article

Effect of Sialic Acid on Mammalian Cell Culture and Protein Expression: A Potential Productivity Enhancer for Biopharmaceutical Cell Culture Processes

1
Institute of Plasma Physics, Hefei Institutes of Physical Science, Chinese Academy of Sciences, Hefei 230031, China
2
University of Science and Technology of China, Hefei 230026, China
*
Author to whom correspondence should be addressed.
Authors with equal contribution.
Processes 2020, 8(11), 1449; https://doi.org/10.3390/pr8111449
Submission received: 24 September 2020 / Revised: 2 November 2020 / Accepted: 9 November 2020 / Published: 12 November 2020
(This article belongs to the Section Pharmaceutical Processes)

Abstract

:
Improved productivity of the two most commonly used cell lines in the biopharmaceutical industry, such as human embryonic kidney 293 (HEK293) and Chinese hamster ovary (CHO), could reduce production costs and increase manufacturing capacity. One method for increasing protein productivity is the addition of antioxidants during the cell culture process. In this study, we examined the effect of sialic acid (SA) on one HEK293 cell line and two CHO cell lines. The addition of SA to HEK293 cell led to a higher viable cell density (VCD), viability (Via), and a lower lactate content in the later stage of cultures. Further results showed that SA reduced the reactive oxygen species (ROS), improved cell viability, reduced lactate production, and increased antibody expression by more than 20% in the later stage of the two CHO cell lines cultures. Besides, an optimized dose of SA had no significant effect on acidic variants level aggregation level, N-linked glycosylation pattern, and SA content on antibodies. These results suggest that the addition of SA can improve the productivity of biopharmaceutical cell culture processes.

1. Introduction

In the past 30 years, recombinant protein drugs have been widely used to treat various complex diseases [1]. Among the 10 best-selling drugs worldwide in 2020, recombinant protein drugs occupy 7 spots. Humira has been at the number one position in global sales for eight consecutive years. Mammalian cells are the preferred host cell for the production of recombinant therapeutic modalities, such as monoclonal antibodies. Mammalian cells can produce post-translationally modified proteins (mainly glycosylated forms) that display modifications similar to those observed in human cells [2]. Several mammalian cell lines are in use for the production of recombinant proteins, including Chinese hamster ovary (CHO) and NS0 cells. However, 70% of recombinant therapeutic proteins are produced in CHO cells [3,4]. The first step in the production of recombinant protein drugs is the large-scale cell culture; therefore, improving the productivity of the cell culture process will increase the manufacturing capacity and reduce the cost of protein drugs.
Nowadays, the fed-batch process is the most commonly adapted cell culture process in the industry. Under a fed-batch process, a large number of metabolic byproducts and medium components accumulate with the increasing culture duration. Some of these components can produce reactive oxygen species (ROS) in the presence of oxygen [5]. ROS are natural byproducts of aerobic metabolism in mammalian cells; however, when ROS levels reach a threshold, they can affect cell growth -owing to their high reactivity towards biological components, including proteins, lipids, RNA, and DNA [6,7]. For safety and raw material control considerations, serum-free, chemically defined cell culture media are used for cell culture and protein expression in biopharmaceutical industries. However, due to the lack of serum, ROS levels are often high during the later stage of fed-batch cultures. High ROS levels affect the density of viable cells; moreover, cell viability drops rapidly in the later stage of cultures, thereby reducing the expression of recombinant proteins.
Owing to a large number of potential ROS sources during mammalian cell culture, the deleterious effect of ROS on process performance becomes a key issue. Adding specific ingredients to the medium is considered the simplest and most effective method to reduce the level of ROS. Many ingredients have been reported to reduce ROS levels [8]. Alpha-tocopherol (vitamin E) is well known for its ROS-scavenging properties and its ability to counteract lipid peroxidation. However, this compound is rarely included in cell culture media composition because of its poor solubility in water [5]. Ascorbic acid (vitamin C), a cofactor of enzymes involved in acetyl CoA metabolism, displays high reactivity towards oxygen and, therefore, has a significant antioxidant potential; however, it can be detrimental to the cell culture if it is not stabilized by other molecules, such as magnesium, selenium, or glutathione. However, vitamin C supplementation during culture does not positively -affect CHO cell growth, precisely due to its instability in culture media [9,10]. The development of more stable derivatives of these molecules was considered to address the issues related to solubility and stability [11]. For instance, the use of stabilized derivatives, such as L-ascorbic 2-phosphate, can help to decrease cell death and improve recombinant protein titers [12]. However, L-ascorbic 2-phosphate is a strong reducing reagent, which can easily destroy the redox balance and damage the cells. Therefore, the use of vitamin derivatives comes with a risk of altered antioxidant potential that must be carefully considered.
Sialic acid (SA) is an α-keto monosaccharide with a 9-carbon atom skeleton that commonly found in nature [13,14]. N-acetylneuraminic acid (Neu5Ac) is the only sialic acid that can be synthesized in the human body. Thus, SA usually refers to Neu5Ac, if not otherwise specified. SA is considered to be the antioxidant component in edible “bird’s nest”. water extract from such edible bird’s nest can inhibit the cytotoxicity induced by H2O2, and remove intracellular ROS in a dose-dependent manner. SA is considered to be the antioxidant component behind this [15,16]. Pure Neu5Ac and N-glycolylneuraminic acid (Neu5Gc) are stable in aqueous solutions and are unaltered even after several months of storage at 4 °C. In addition, studies have shown that Neu5Ac can be used as an antioxidant and convert H2O2 into H2O and nontoxic carboxylic acids, without generating oxygen free radicals [17,18].
In this study, effects of SA on mammalian cell culture, metabolism, and productivity were studied. Furthermore, the effects of SA on the parameters of antibody quality, such as aggregation, charge heterogeneity, and N-linked glycosylation, were examined. We first studied the effects of SA on human embryonic kidney 293 (HEK293) cells in a fed-batch shake-flask model; and then studied the effects of SA on two CHO-K1 cell lines. Finally, we obtained the optimal SA concentration in the fed-batch shake flask model and showed that an optimized SA concentration can decrease the level of ROS and increase antibody harvest titers by over 20% in shake flasks without reducing antibody quality.

2. Materials and Methods

2.1. Cell Line, Media, and Seed Expansion

Via transfection of the desired antibody genes into the same parental CHO k1 GS cell line, we obtained the stable CHO cell lines A and B expressing different recombinant human mAbs (mAb1, mAb2); the two cell lines were used in this study. The HEK293 cells did not contain the target expressed gene.
Proprietary chemically defined basal and feed media were used (Table 1). Dynamis was purchased from Thermo Fisher Scientific (Waltham, MA, USA), and Cell Boost 7a/7b was purchased from GE Healthcare (Chicago, IL, USA). SA (purity ≥99%, it is derived from E. coli fermentation method) was purchased from Wuhan Zhongke Optics Valley Green Biotechnology Co., Ltd. (Wuhan, China). For HEK293 cell culture, we added 4 mM glutamine (Gln) to the basal medium and added 4 mM Gln every two days after.
Vial thaw and cell culture expansion were performed for two CHO-K1 and one HEK293 cell lines using shake flasks (Corning Life Sciences, New York, NY, USA) using the Dynamis medium and cells were cultured in a humidified incubator (INFORS AG, Bottmingen, Switzerland) using the standard conditions of 37.0 °C, 6% CO2, and incubated at 100–140 rpm. Cells were passaged every 3–4 days prior to N stage fed-batch production.

2.2. Fed-Batch Production Culture Conditions

The fed-batch production experiments for HEK293 and CHO-K1 cells were performed in 250 mL shaker flasks (Corning Life Sciences, New York, NY, USA) with an initial working volume of 50 mL in a humidified INFORS incubator at 37 °C and 6% CO2. The agitation was set at 120 rpm. HEK293 cells were seeded at 2 × 10⁵ viable cells/mL and CHO-k1 cells were seeded at 5 × 10⁵ viable cells/mL in chemically defined basal media. For HEK293 cells, feed media was added at 3% initial culture volume from day 5, and then fed once every two days; SA was added on day 9, 10, 11, 12, and an amount equivalent to 1/4 of the total was added each time. For CHO-K1 Cells, feed media was added at 5% initial culture volume from day 5, and then fed once every two days; SA was added on day 7, 8, 9, 10, and an amount equivalent to 1/4 of the total was added each time. A glucose stock solution was added as necessary.
The basal media was Dynamis (Thermo Fisher Scientific, Waltham, MA, USA), the feed media were cell boost 7a and cell boost 7b (GE Healthy, Chicago, IL, USA)-10:1, respectively.

2.3. Cell and Metabolite Analysis

Cell culture sampling was performed to monitor viable cell density (VCD) and metabolic parameters, including glucose and lactate levels, every two days during the entire culture period at least. VCD and viability were detected using trypan blue staining via an automatic Vi-cell Cell Counter (Beckman, Brea, CA, USA). Glucose and lactate were monitored using a Nova Biomedical 400 Analyzer (Nova Biomedical, Waltham, MA, USA). Supernatant samples were stored at −20 °C. At the end of the experiments, frozen supernatant samples were thawed and collectively submitted for antibody titers and ROS determinations.

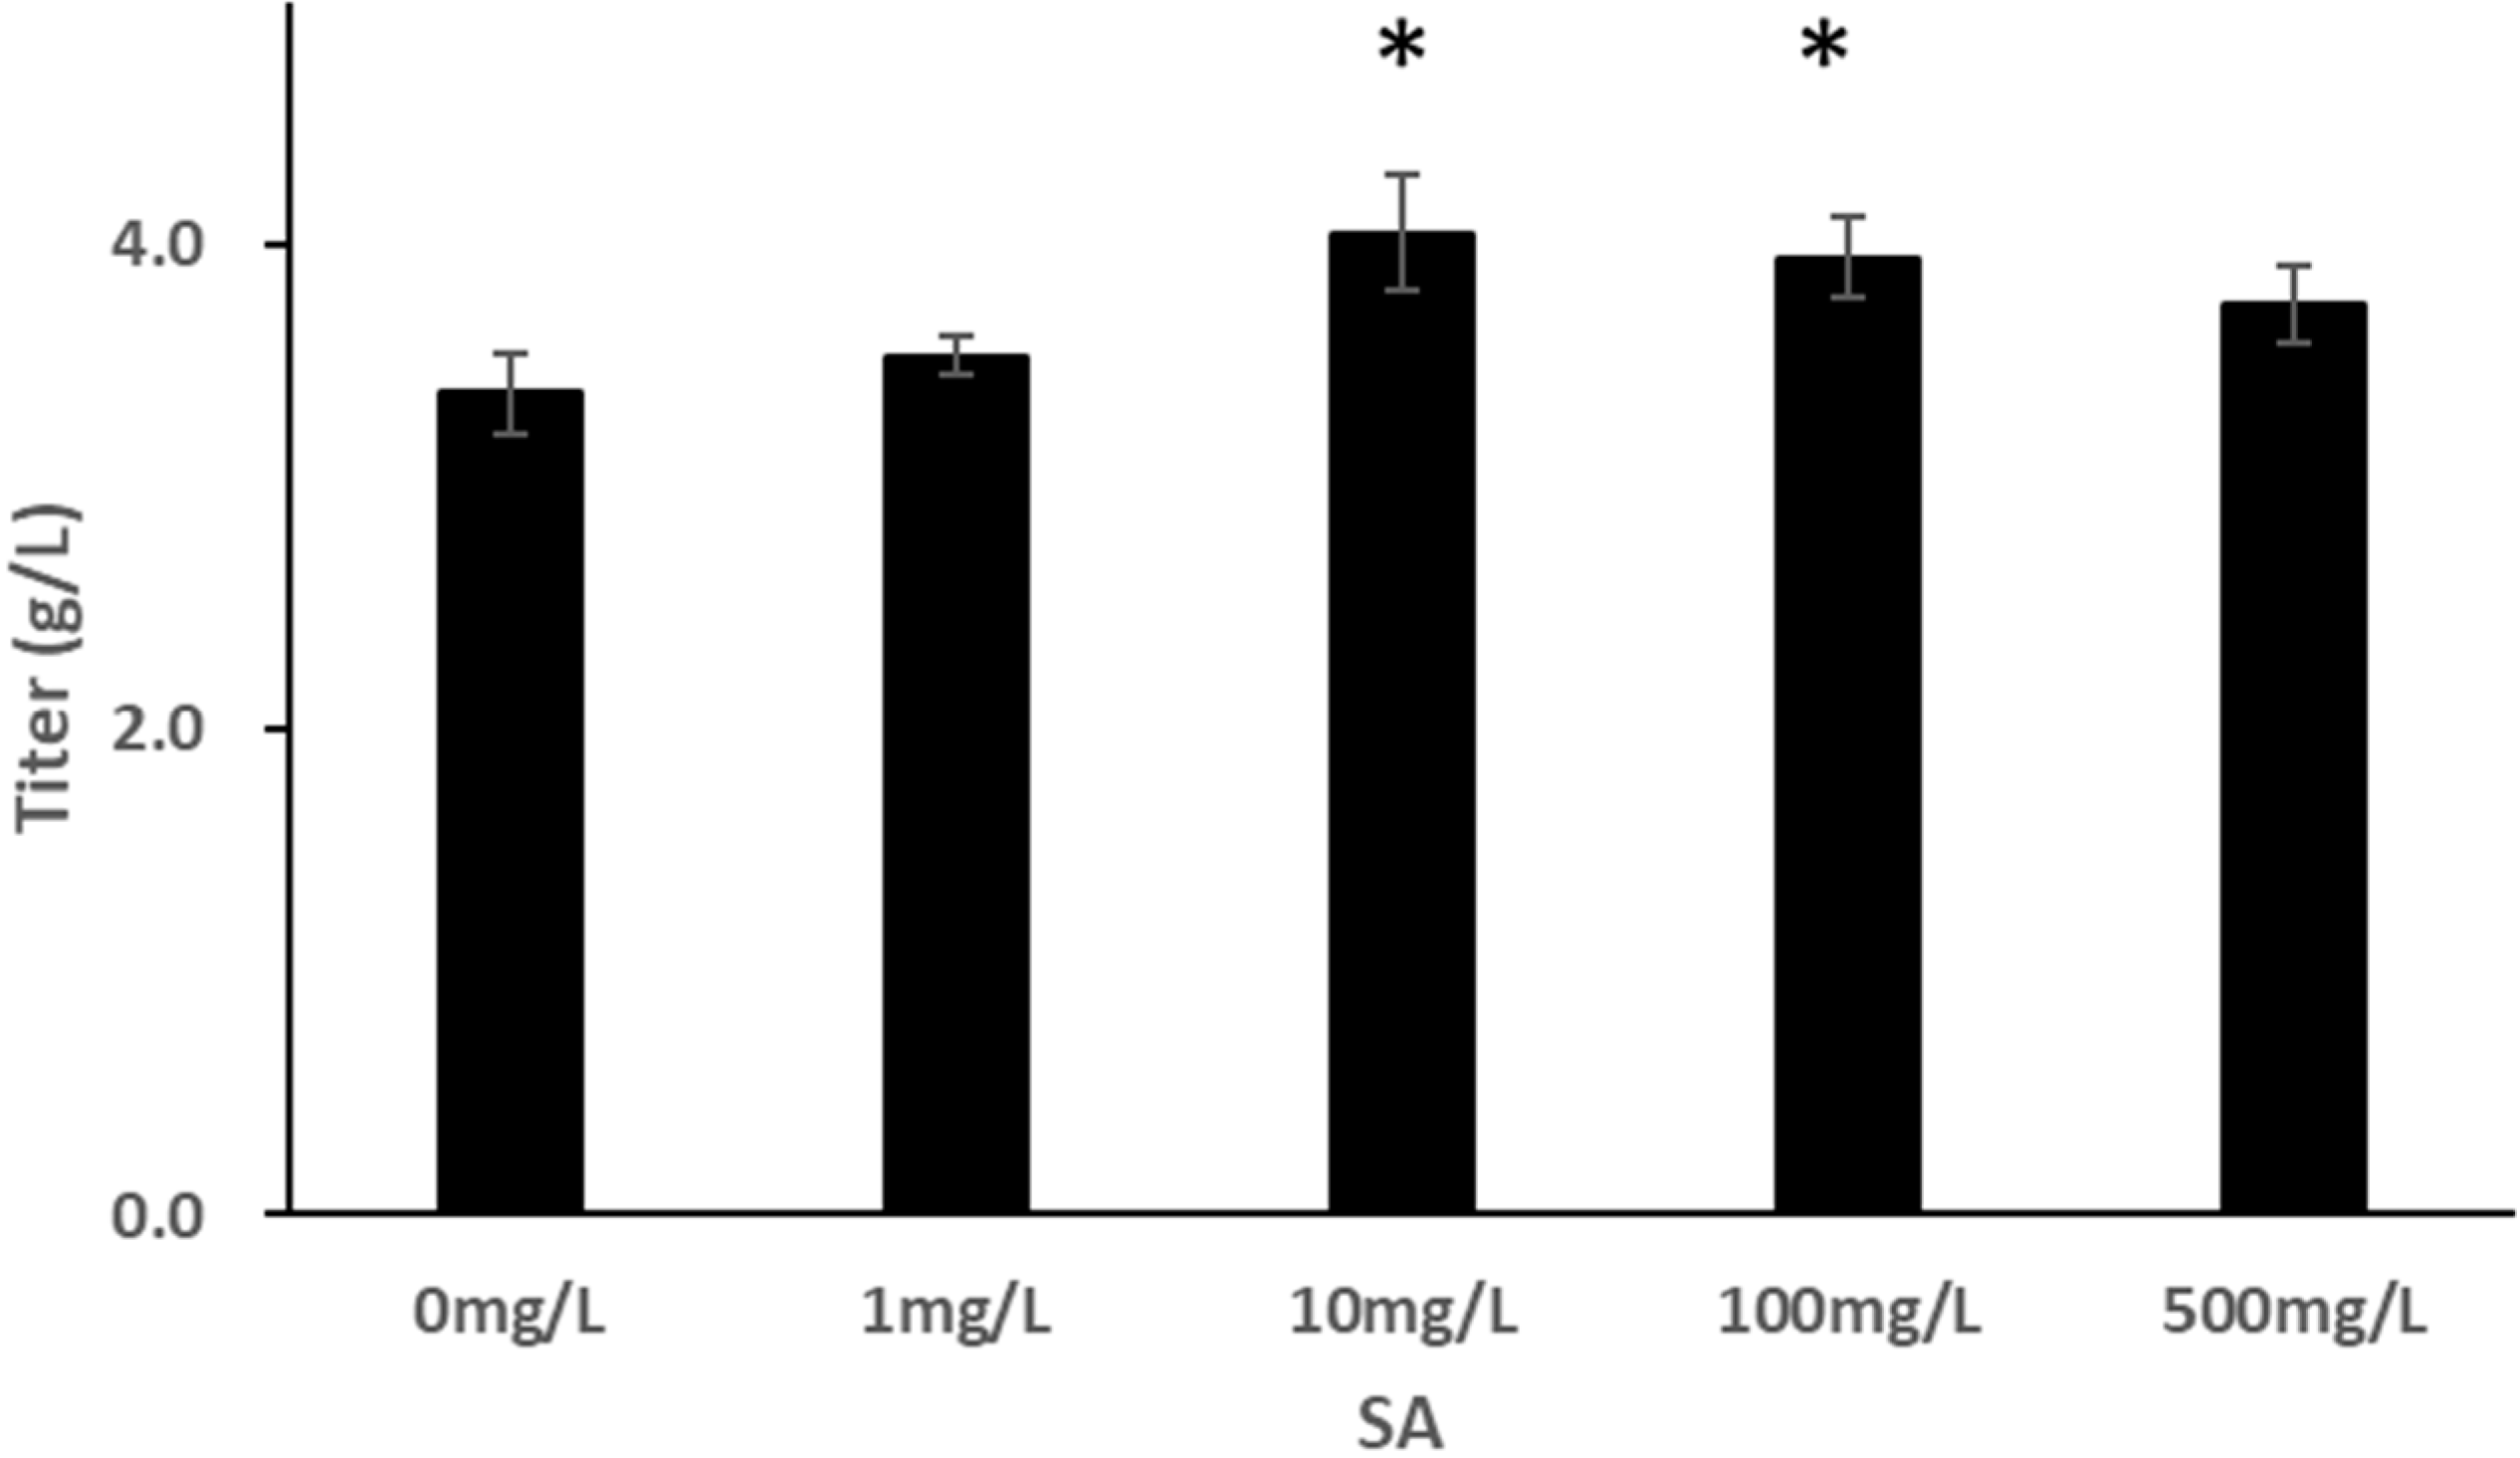
2.4. Analysis of Antibody Concentration (Titer)

After centrifugation, cell culture supernatant samples were injected into an HPLC system (Agilent, Santa Clara, CA, USA) equipped with UV detection at 280 nm. The column used was the TSKgel Protein A-5PW 4.6 × 35 mm, 20 μm (Tosoh, Japan). The flow rate was set at 1 mL/min. A gradient method using as the mobile phases 50 mM sodium phosphate/150 mM sodium chloride and 100 mM glycine/150 mM sodium chloride; each sample was eluted every 8 min.

2.5. Physicochemical Analysis

The cell supernatants were collected on days 15 and 17 and purified using a protein A column (GE Healthy, Chicago, IL, USA). For the size variant, the samples were analyzed using a TSK G3000SWXL column 7.8 × 300 mm, 5 μm (Tosoh, Japan) with the mobile phase buffer (50 mM NaH2PO4, 250 mM NaCl, pH 6.8) at a constant flow rate of 0.5 mL/min.
Moreover, CE-SDS was performed under non-reducing conditions for the analysis of purity/impurities. A Beckman Coulter, PA 800 capillary electrophoresis system (Brea, CA, USA) was used with an effective length of 30.2 cm, 50 mm I.D. bare-fused silica capillary.
For the charge variant, the samples were analyzed using a Propac WCX10 4 × 250 mm, 5 μm (Thermo Fischer Scientific, Waltham, MA, USA). Gradient elution was performed at a constant flow rate of 0.8 mL/min.
For oligosaccharides profile analysis, N-linked glycans were first enzymatically released from the antibodies with peptide-N-glycosidase F (pNGase F), then labeled with 2-Aminobenzamide, and subsequently analyzed using ultra-performance liquid chromatography (UPLC) with fluorescence detection.

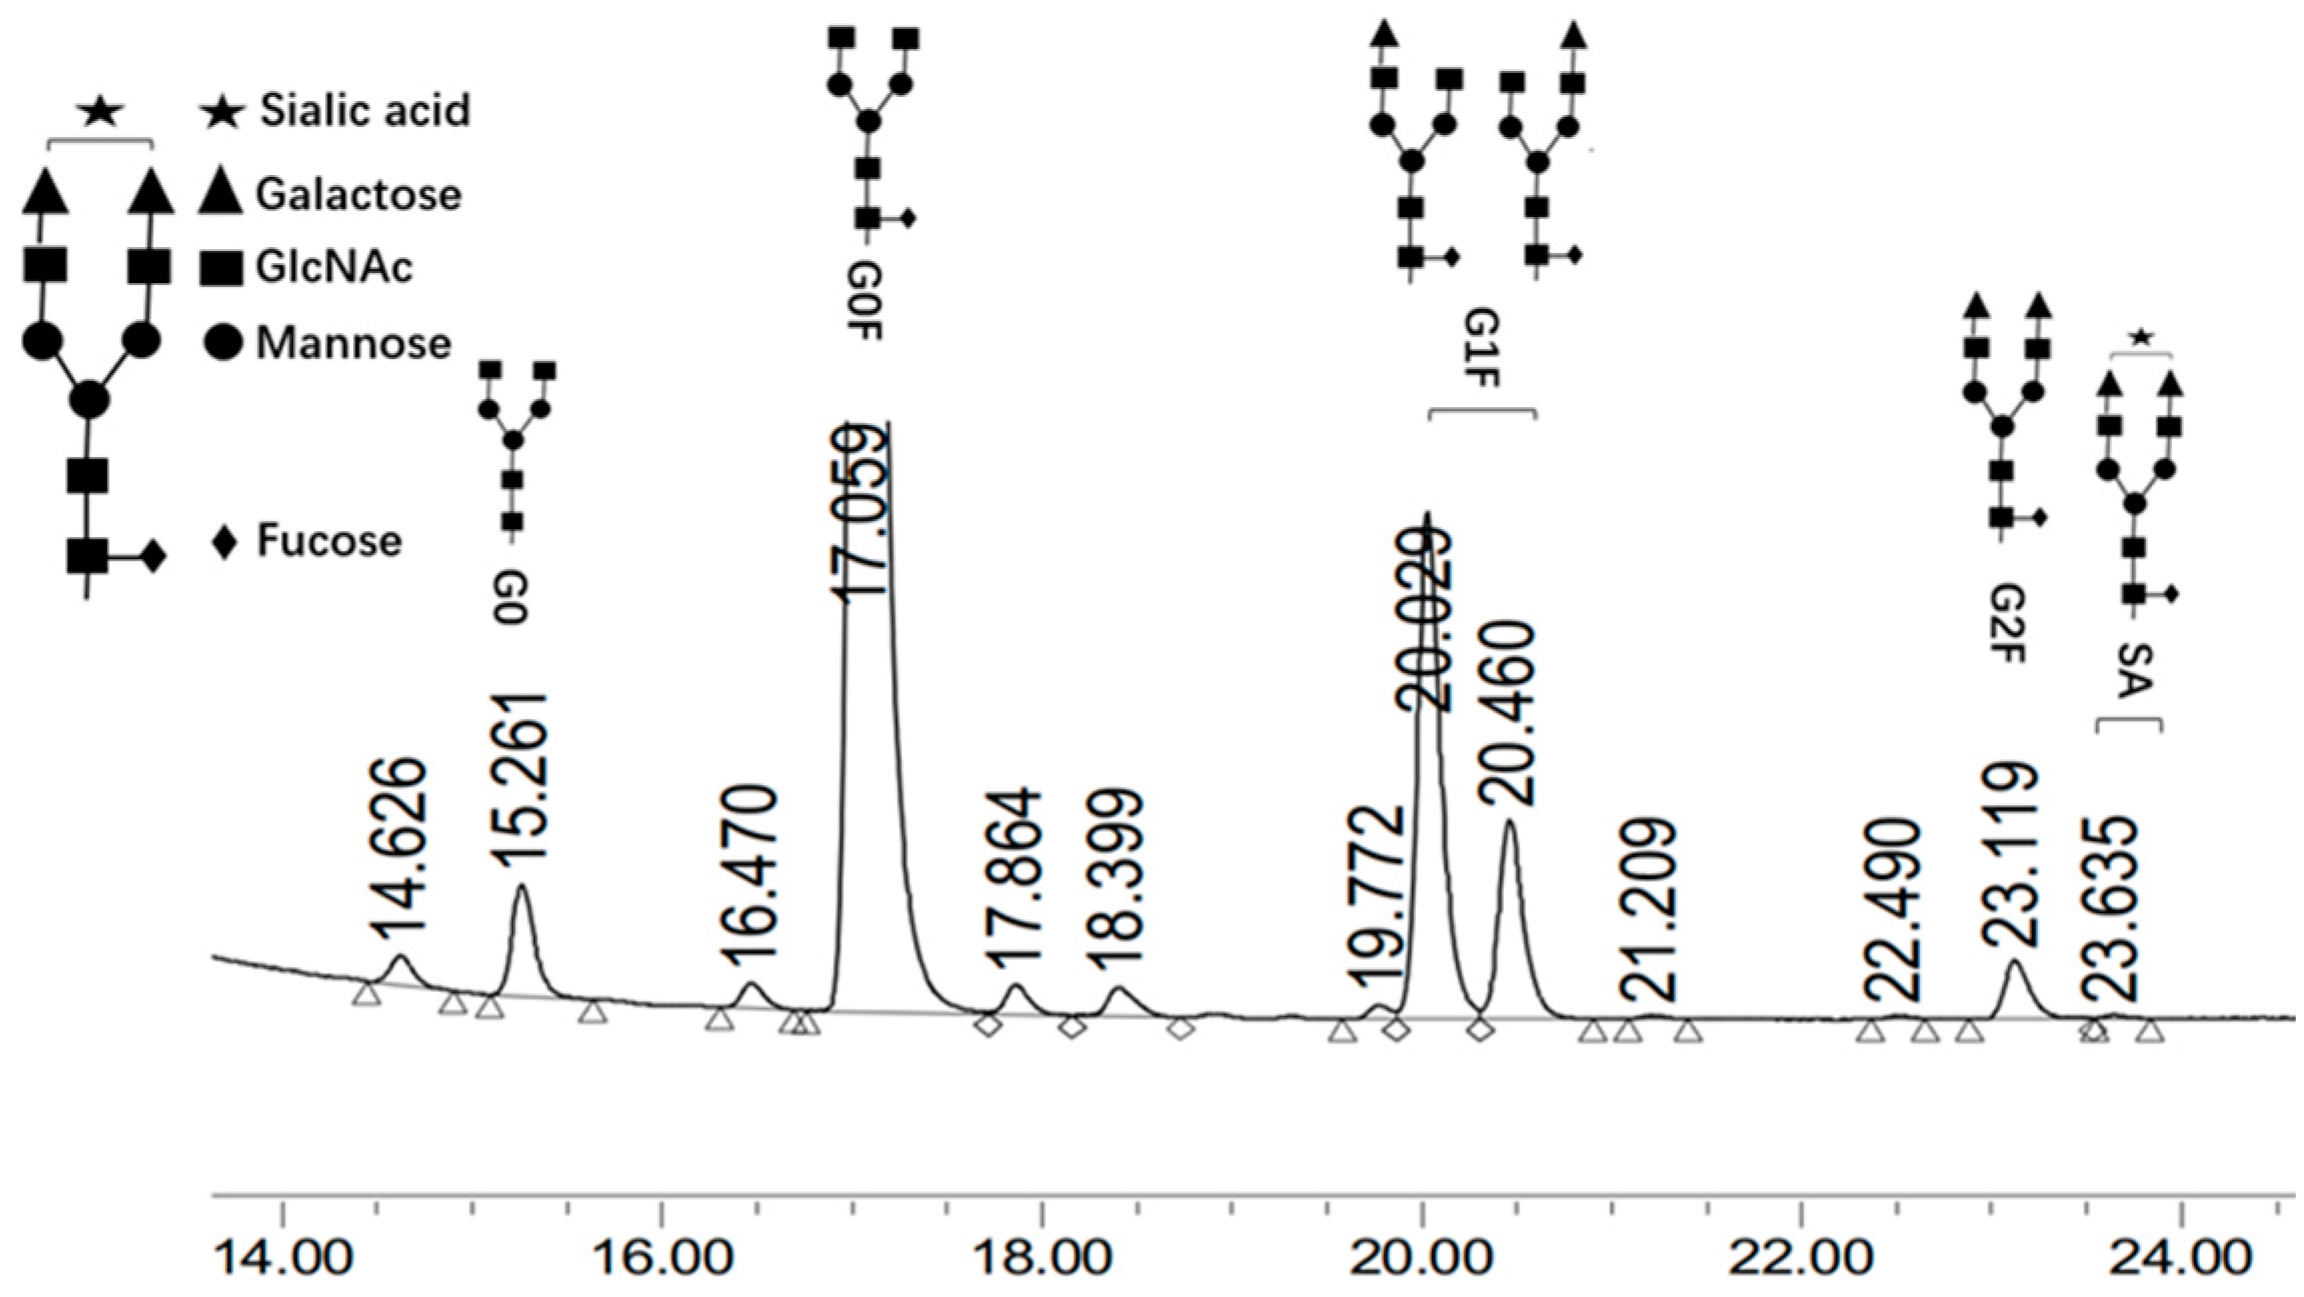
2.6. Analysis of N-Glycan SA

SA is composed of nine carbon atoms attached to the glycoprotein. Among the monoclonal antibody drugs, Neu5Ac and Neu5Gc are the most common [19]. The purified antibody was acid hydrolyzed with 0.1 mol/L trifluoroacetic acid at 80 °C for 1 h. The released SA was labeled with 1,2-diamino-4,5-methylenedioxybenzene (DMB) (Sigma, St. Louis, MO, USA) at 50 °C for 3 h. The DMB-labeled SA was separated by Reverse-phase high performance liquid chromatographic (RP-HPLC) with fluorescent detector (Waters, Taunton, MA, USA).
The chromatograph column is ACQUITY UPLC BEH C18 130 Å, 2.1 × 50 mm, 1.7 μm. The mobile phase is acetonitrile: methanol: water (9:7:84). The excitation wavelength is 373 nm, the emission wavelength is 448 nm. The SA content was quantified based on external standard method. The results were reported as molar ratios.

2.7. Analysis of ROS

DCFH-DA (2,7-Dichlorodi-hydrofluorescein diacetate) was diluted with Dynamis cell culture medium in a ratio of 1:1000 to a final concentration of 10 μmol/L. After the cells were collected, they were suspended in diluted DCFH-DA at a cell concentration of 106 cells/mL, and incubated in a cell incubator at 37 °C for 20 min. The mixture was mixed every 3–5 min to facilitate the reaction. Cells were washed three times with Dynamis cell culture medium to completely remove the DCFH-DA that had not entered into the cells. After collecting the cells, they were analyzed using a fluorescence spectrophotometer (Fluoroskan, Thermo Fischer Scientific, Waltham, MA, USA).

2.8. Statistical Analysis

The VCD, integral VCD (IVCD), viability, lactate levels, ROS and antibody titers at harvest were evaluated statistically in comparison of experiments to control. Evaluation of statistical significance (p < 0.05) was calculated according to the Kruskal–Wallis test.

3. Results and Discussion

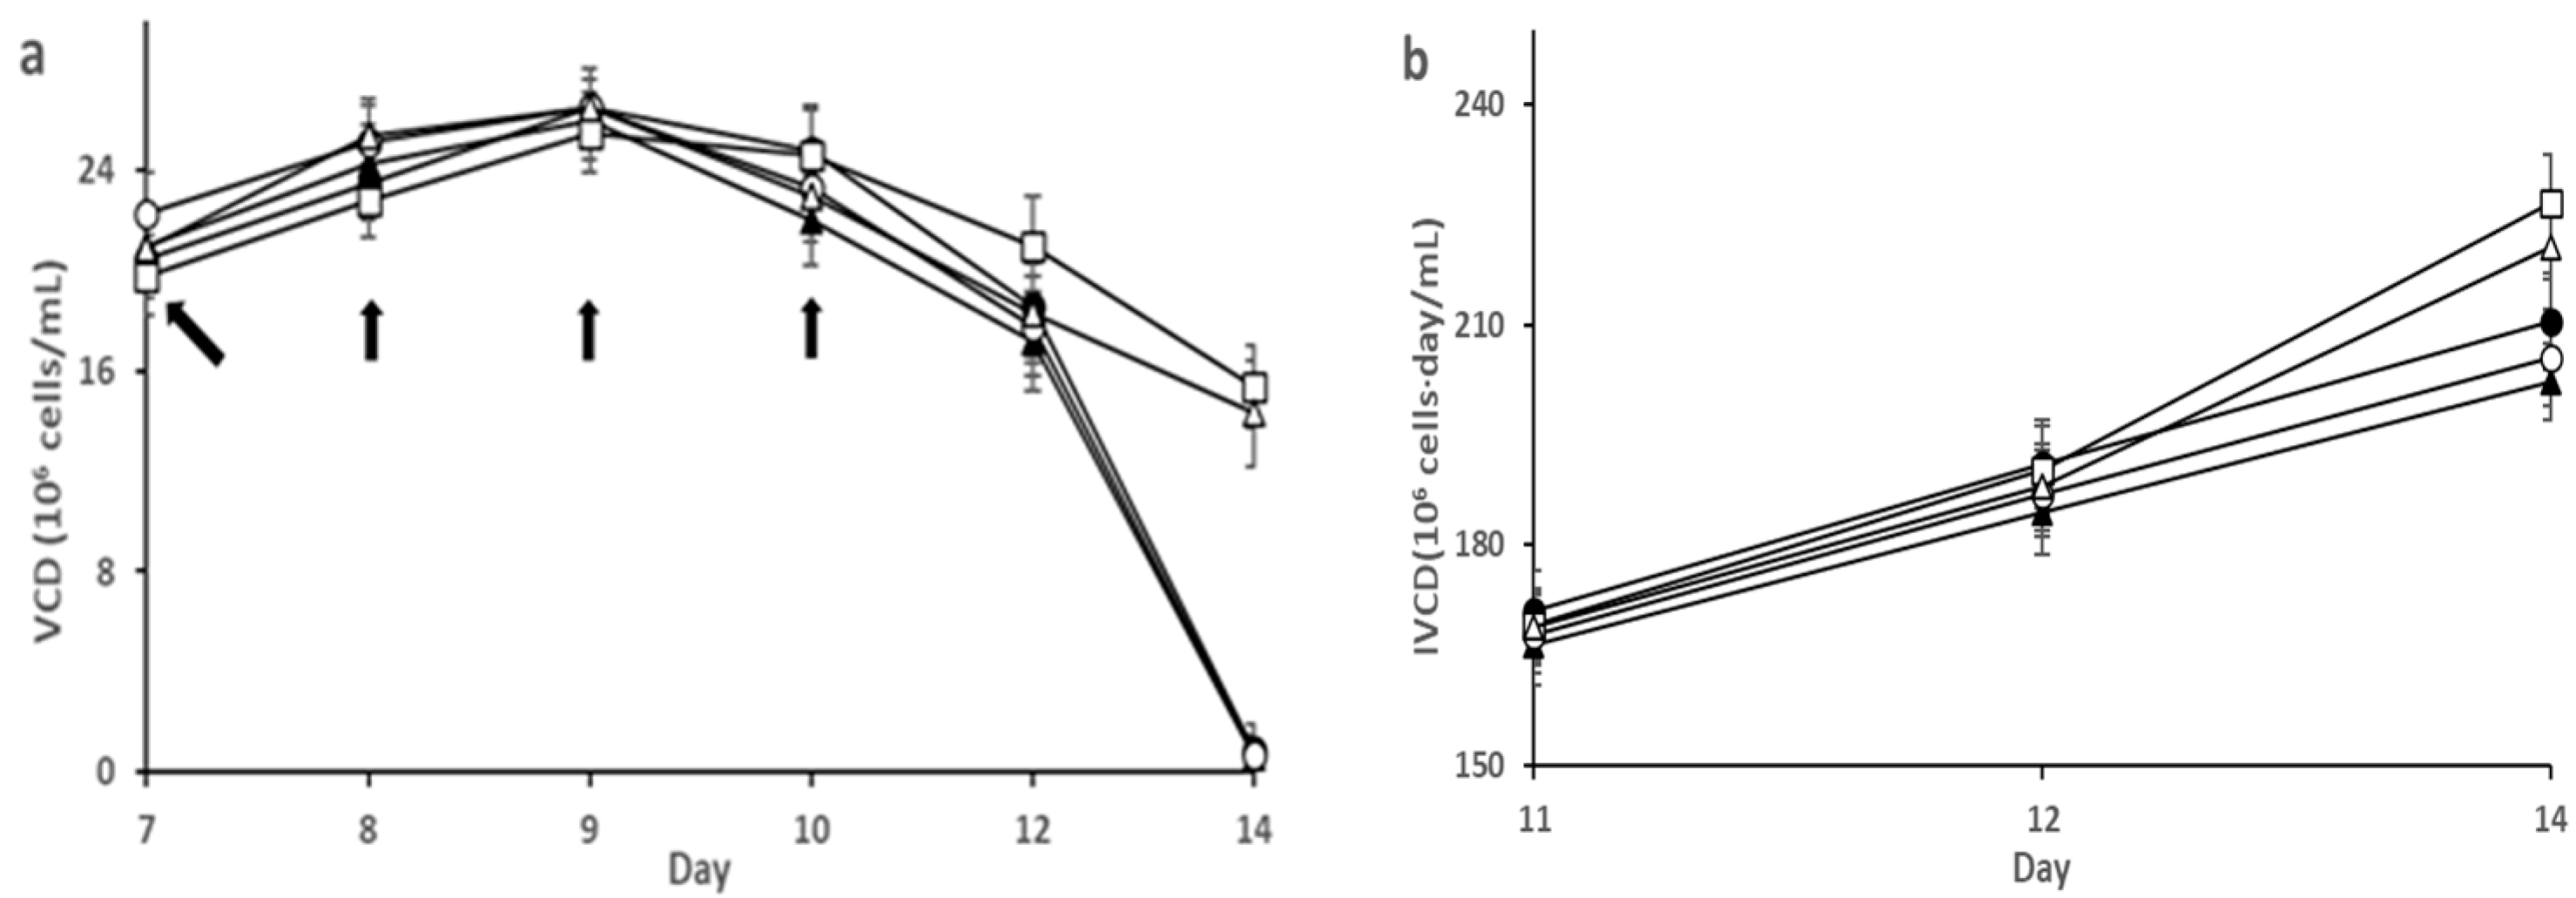
3.1. Effect of SA on HEK293 Cell Culture

SA (1–500 mg/L) was added to fed-batch shake flask cultures from days 9 to12; each time, SA was added in amounts equivalent to 1/4 of the total amount. Since SA is acidic in nature, it is necessary to adjust the pH to 7.0 ± 0.1 with sodium hydroxide when the SA solution is prepared to mitigate the influence of pH changes on the cell culture.
These results are shown in Figure 1. When HEK293 cells were cultured up to day 10–11, peak viable cell densities (VCDs) were obtained. Subsequently, the VCD began to decrease. Compared with the control, the addition of SA had a significant effect on the VCD (Figure 1a). At the end of the culture (Day 17), the VCD of the 10 mg/L SA group was 46% higher than that of the control group (0 mg/L) (p < 0.05). The addition of SA also maintained -a higher cell viability in the later stages of the cultures but the difference was not significant (Figure 1c, p > 0.05). Among the various concentrations used, the cell viability at the end of culture was the highest (84.8%) with 10 mg/L SA.
The concentration of lactate generated during the later stages of cell culture was analyzed (as shown in Figure 1d, p < 0.05). As the culture duration increased, the lactate concentration first decreased and then remained constant. Similar to the results of VCD, the concentration of lactate first decreased and then increased as the concentration of supplemented SA increased. At the end of the culture, the lowest lactate concentration (0.659 g/L) was obtained in the presence of 10 mg/mL SA, which was 37.2% lower than that of the control.
Leticia et al. reported that the concentration of lactate could be reduced by a lower culture pH and this also obtain a higher VCD and titer [20]. In this study, we found that adding a suitable concentration of SA can also reduce the concentration of lactate, thereby obtaining a higher VCD and viability at the end of the culture. The difference was that the lactate concentration of the control in this study was not as high as Leticia et al. reported, so the study results were not as significant as those reported by Leticia et al. However, compared to lowering the pH of the culture, adding SA directly reduces the risk of process instability. Eric et al. also reported that reducing the concentration of lactate can significantly increase VCD and the expression of glycoproteins at the end of culture [21]. Since SA can reduce the production of lactate, we hypothesize it can also affect the production of protein on HEK293 cells, but this would depend on whether the host cell produces a lot of lactate. Furthermore, although a high SA concentration (500 mg/L) did not exert any positive effects, no adverse effects were observed on cell growth and metabolism. This indicated that the cells can tolerate SA over a wide concentration range. These results support the future use of SA in long-term cell culture.

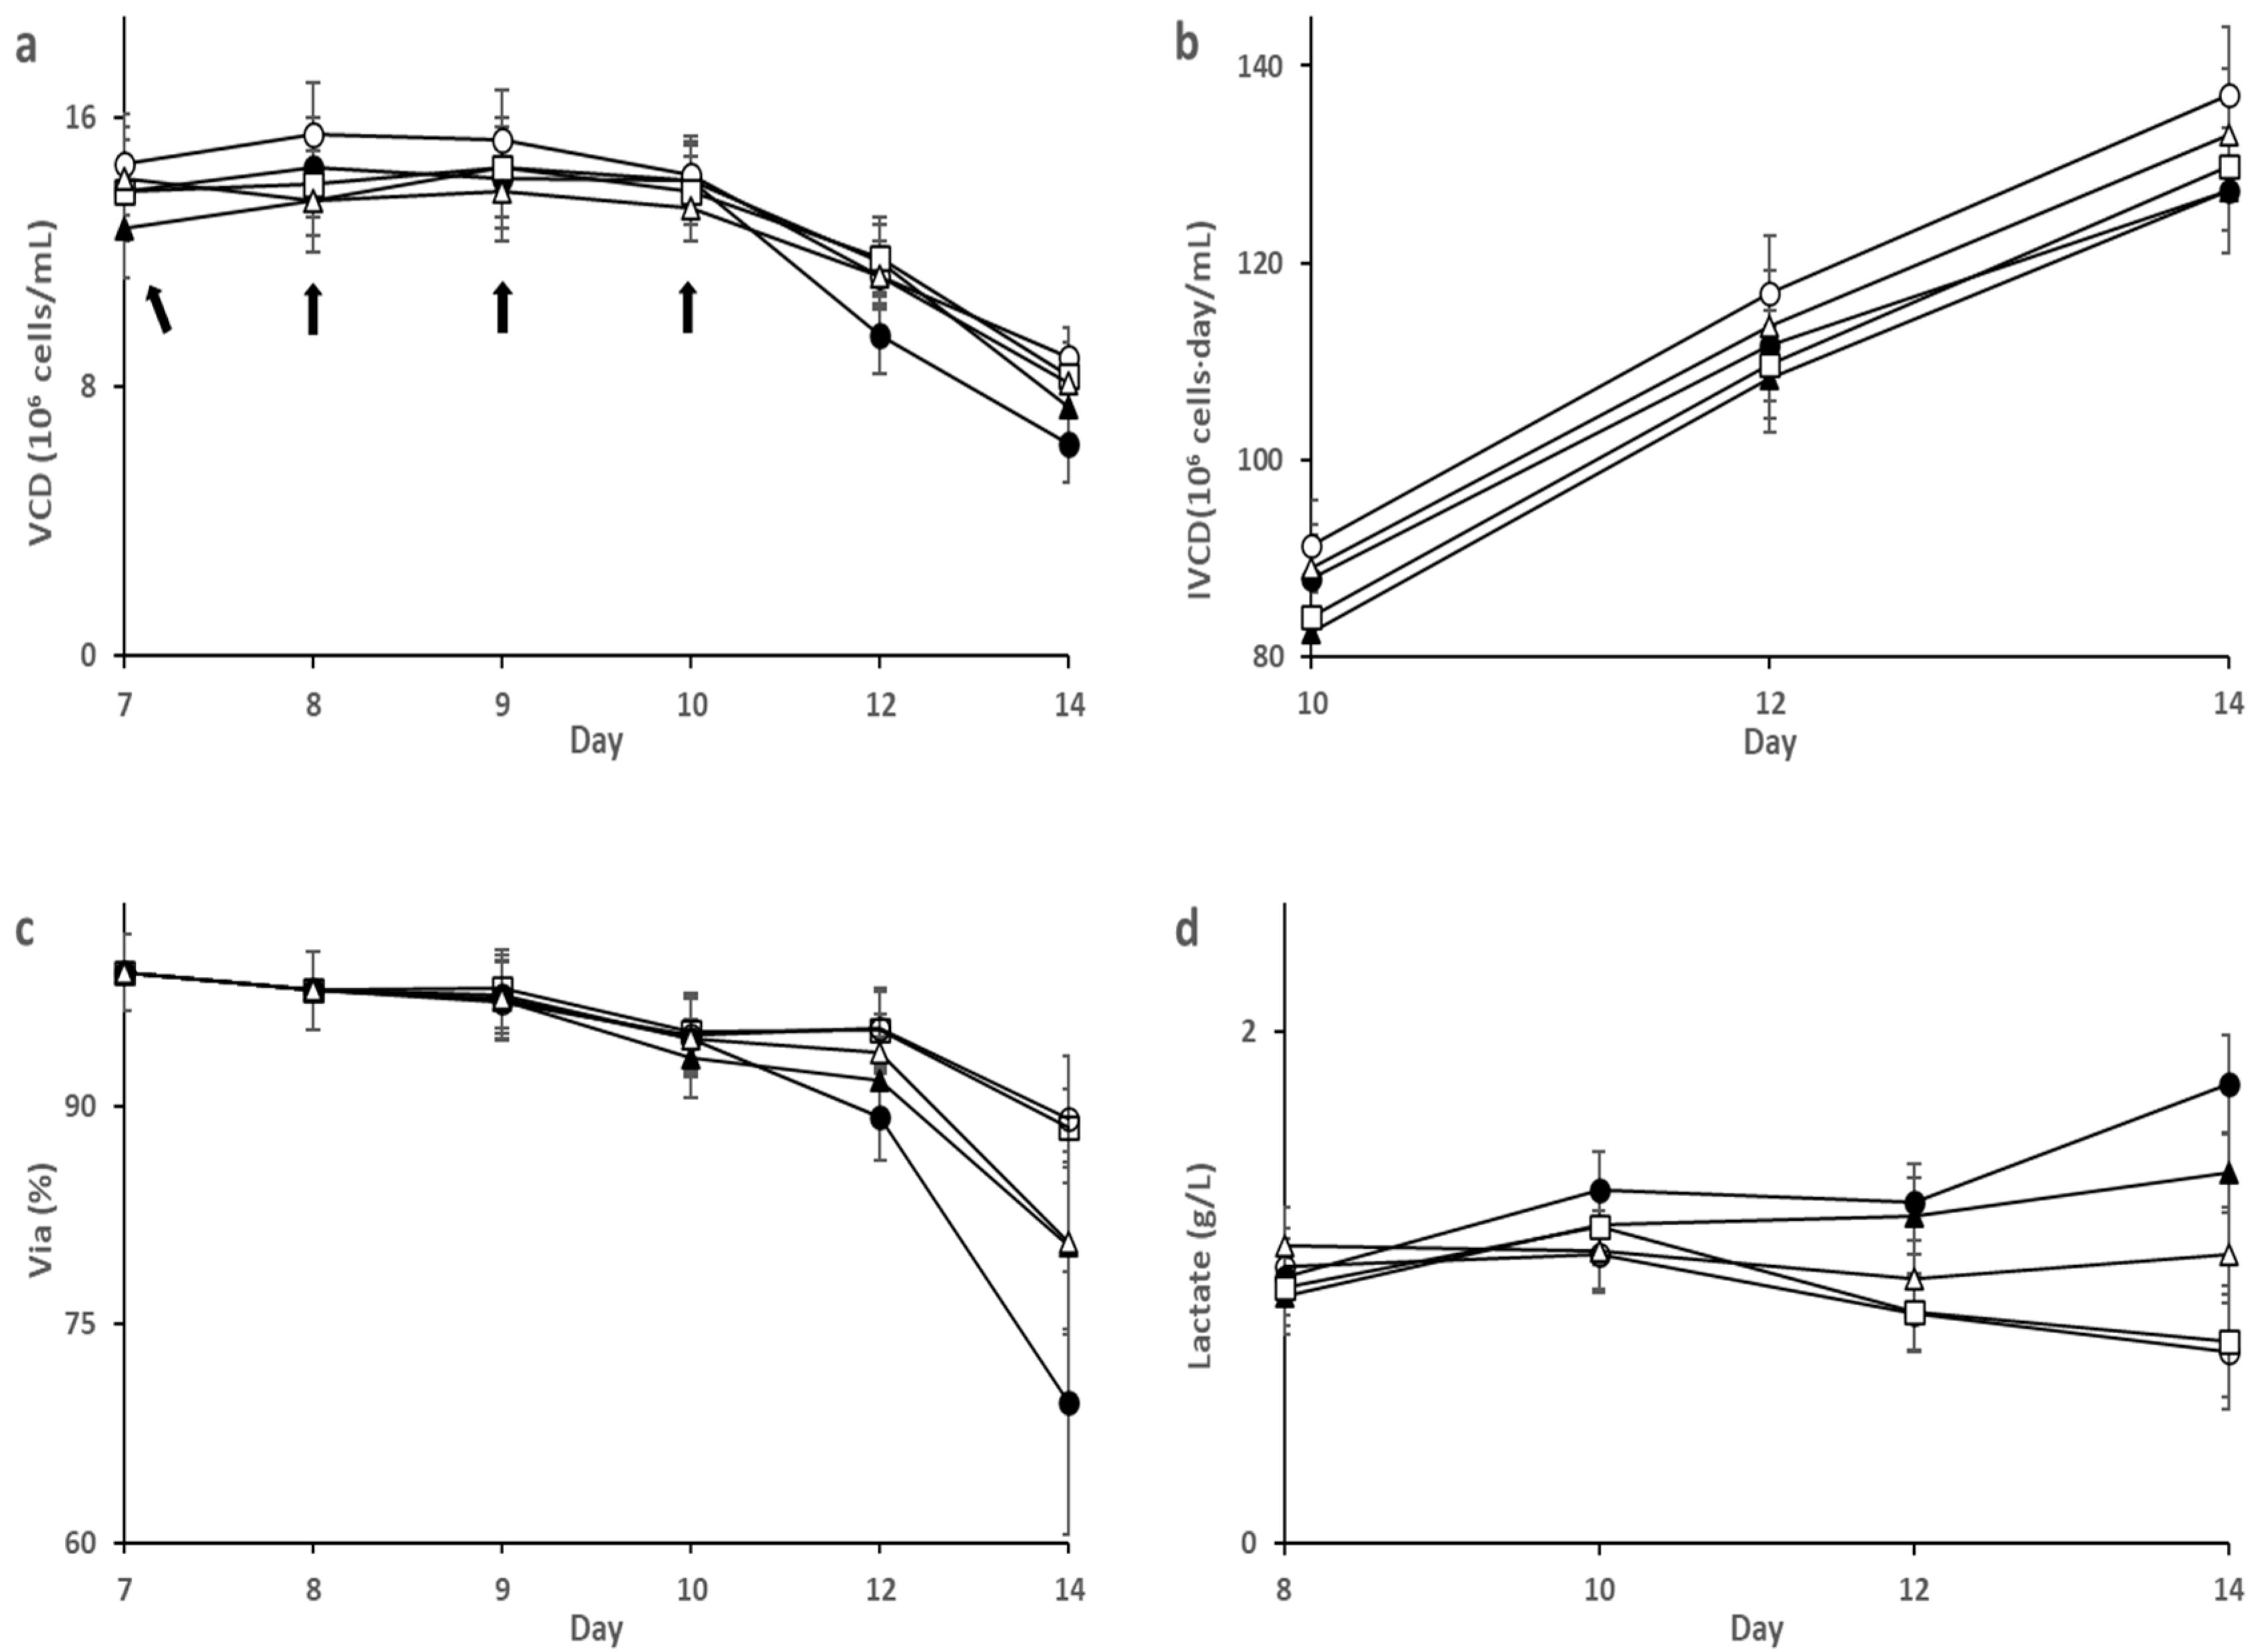
3.2. Effect of SA on CHO-K1 Cell Culture

Since SA maintained cell viability, growth, and reduced the production of lactate during the later stages of long-term HEK293 cell culture, we sought to determine whether SA also has a positive effect on CHO-K1 cell culture, since currently, CHO-K1 cells are the most widely used mammalian host cells for the expression of recombinant proteins [22]. We chose CHO-K1 cell line A and B as the models as both of them can express monoclonal antibodies. A total of 1–500 mg/L SA was added to the fed-batch shake flask cultures from day 7 to 10; each time, SA was added in amounts equivalent to 1/4 of the total amount.
For cell line A (Figure 2), the VCD and viability of the control group and the SA low-addition groups (1 and 10 mg/L) decreased rapidly in the later stage of cultures, accompanied by a large amount of lactate production (more than 2 g/L). These phenomena have been widely reported [23,24], high lactate level could lower the pH of the culture, thus accelerating the decline of VCD. On the other hand, the concentration of lactate remained low (approximately 1 g/L) in the SA high-addition groups (100 mg/L and 500 mg/L) and the concentration of lactate was approximately 50% lower than that of the control group (p < 0.05). At the same time, The SA high-addition groups obtained higher VCD (p < 0.05) and viability (p < 0.05) in the later stage of cultures. On day 14, the cell viability of the control group and the low SA concentration group (1 mg/L and 10 mg/L) were lower than 10%, but in the 100 mg/L and 500 mg/L SA groups, the cell viability at the end of the culture remained above 80%. Among them, the viability of cell line A with 100 mg/L SA was the highest at 89.3%. However, unlike cell line A, cell line B had lower lactate production (less than 2 g/L); therefore, cell line B did not experience rapid decline in VCD and viability as cell line A in the later stage of cultures (Figure 3). When SA was added in the later stage of cultures, higher viability (p < 0.05) and lower lactate (p < 0.05) were observed compared to those in the control group, but no statistically significance effect on VCD (p = 0.205) and IVCD (p = 0.338) was observed for cell line B, At the same time, we found that the optimal concentration range of SA added to cell lines A and B are different. The optimal concentration range of SA for cell line A is 100–500 mg/L, while for cell line B is 10–100 mg/L. This requires further analysis.
The lactate concentration increased in the control and SA low-concentration groups, which may be related to ROS generation as cells can accumulate a large amount of ROS in the later stage of cultures; of note, high concentrations of ROS can damage the electron transport chain and inhibit NADH oxidation, ultimately leading to the accumulation of lactate [25,26]. Iijima R reported that SA reacts with hydrogen peroxide in animal models and reduces ROS toxicity in cells [17]; however, the effect of SA on ROS during cell culture has not been reported. Therefore, we evaluated the ROS levels in the later stage of the cultures (Figure 4). Our results showed that adding a certain amount of SA indeed significantly reduced the ROS concentration in cell lines A (p < 0.05) and B (p < 0.05), thereby protected the cells from ROS-mediated damage and lactate generation. The decrease in ROS levels were inversely proportional to the increase in the SA concentration. In cell line A cultured with 100 mg/L SA, the ROS levels were only about 60% compared to those in the control, whereas for cell line B, the addition of 10 mg/L and 100 mg/L SA led to ROS levels of only 80% and 60%, respectively, compared to those in the control at the end of culture (Figure 4b). A higher concentration of SA could still scavenge ROS; however, if the amount of SA added was too high, ROS levels were reduced to a very low level, impairing the cells’ redox balance. Chevallier et al. reported that, when the intracellular oxidative balance is disrupted, it affects cell growth, yield, and quality; thus, SA should not be added at extremely high concentration [25].
Both CHO lines were generated from the same parental cell, but the results show that the ROS levels of cell lines A and B are not the same There are various reasons that may explain these discrepancies: (1) For the CHO cell lines A and B, the feed medium and feed volumes used were the same; of note, the feed medium also contained antioxidants [27,28,29]. Although the total amount of antioxidants brought in from the feed was the same for both types of cells, CHO A cells grow better; therefore, a single cell had fewer antioxidants available from the feed and basal medium for lines A versus B. (2) The different insertion sites of the target genes may have caused a big difference in the cell’s own metabolism.
These results indicate that different cells and culture processes produce different levels of ROS. Therefore, the best concentration of SA will vary according to the cell type and culture condition. When the cell ROS levels are high, the best effect can be obtained by adding an optimized concentration of SA to reduce ROS to an appropriate level because high ROS levels may induce the production of more lactate, and high lactate would further induce cell death [25]. Helen et al. reported the influence of SA on CHO cell culture. Since there was no production of lactate, VCD and viability were also maintained at a higher level in the later stage of cultures, so they found that SA had no obvious effect on the growth and metabolism of CHO [30]. Therefore, we hypothesize that SA reduces the production of lactate at the later stage of culture by reducing the level of ROS, so it may have a positive effect on cell culture.
Since the addition of SA significantly reduced the concentration of ROS and lactate during the later stage of cell culture, and maintained the cells at a higher viability and lower lactate production may result in a higher titer [31,32], we next sought to determine whether the antibody expression levels were also significantly increased and the results are shown in Figure 5 and Figure 6. For cell line A, the addition of 100 mg/L SA resulted in the highest antibody expression (1.76 g/L), which was 26.6% higher than that of the control group (p < 0.01). The expression level of antibodies in the cells grown in the presence of 500 mg/L SA also increased by 12.2% compared to the control group; however, compared to the cells cultured with 100 mg/L SA, the expression level was slightly lower. Thus, the addition of a very high amount of SA may negatively affect antibody expression. For cell line B, the addition of 10 mg/L and 100 mg/L SA resulted in the highest antibody expression, which around 20% higher than that in the control group (p < 0.05).
Since SA is a component of glycosylation [33], it is necessary to evaluate whether the addition of SA affects the quality of recombinant antibodies. The results on antibody quality are shown in Table 2. The addition of SA had no significant effect on the Size Exclusion Chromatography (SEC) purity, glycosylation, and SA content of the antibodies (Figure 7) compared to the control conditions for both cell lines A and B. However, the addition of SA slightly reduced the acidic variant of Cation exchange Chromatography (CEX) (p > 0.05). Overall, the addition of SA did not adversely affect the quality of the antibodies. Compared with the existing processes, the addition of SA could help to increase productivity without reducing the quality of the antibodies produced, which is very important for commercial production. However, SA addition slightly reduced the content of acidic variants in the context of charge heterogeneity; therefore, SA may not be suitable for applications requiring product quality comparability. On the other hand, when the product itself needs a reduction of acidic variants, adding SA would be an ideal choice. To the best of our knowledge, this is the first study to report that SA can reduce ROS and increase antibody expression in mammalian cell cultures.
In our study, we found that the addition of an optimized SA amount could decrease the levels of ROS and lactate and, therefore, increase antibody expression by over 20% in shake flasks without reducing antibody quality. However, the effect of the addition of SA depends mainly on the intracellular ROS and lactate level; when the ROS and lactate level is high, adding an optimized dose of SA will have a positive effect. If the intracellular ROS and lactate content is relatively low or within a reasonable range, adding SA may disrupt the intracellular redox balance and affect the overall cell productivity, so it may not have the positive effect. However, it should be noted that a large amount of SA was used in this study, so the increase in productivity could be caused by the residual impurities in SA. However, this possibility is very small, because the purity of SA is very high (purity ≥99%). When 100 mg/L of SA was used, the total amount of impurities introduced by SA was less than 1mg/L, which was very low level for cell culture.
Since CHO cells have a significant lack of diploidy, and have a strong tendency towards metabolic mutations, therefore, it will be important to study whether SA affects CHO genes. We did not conduct this research, but we have done some research on SP2/0, the results show that SA did not affect SP2/0 cell genes (data not shown).

4. Conclusions

We studied the effect of SA on cell culture and protein production. We performed multiple complementary experiments to identify the best concentration of SA for one HEK293 cell line and two CHO cell lines using the shake flask culture method. The best SA dose differed for different cell lines. For HEK293 cells, the best SA concentration was about 10 mg/L; we found that the addition of SA increased harvest VCD and viability and lowered lactate levels compared to those in the control. For CHO cells stably expressing monoclonal antibodies, the best SA concentration was about 100 mg/L. The addition of a suitable SA amount could improve the VCD and viability and reduce the concentration of lactate in the later stage of cell culture. These changes ultimately increased the harvest titers without reducing the antibody product quality. Furthermore, we found that adding appropriate concentrations of SA significantly reduced ROS levels in cell culture. Therefore, SA addition improves the cell viability and the titer of antibodies, and reduces the production of lactate in the context of fed-batch culture conditions. These results suggest that the addition of SA is an attractive method for improving the productivity of cell culture processes for biopharmaceutical industry purposes. To the best of our knowledge, this is the first study to report that SA can reduce ROS and increase antibody expression in mammalian cell cultures. Feary et al. reported that low levels of oxidation of the intracellular environment would affect the correct folding of disulfide bonds, thereby affecting antibody expression [34]. Therefore, it is important to maintain a proper redox level in the intracellular environment. Since CHO cells lack plasma membrane transporters for SA monosaccharide, SA enters the cell very slowly. Therefore, unlike other antioxidants, SA changes intracellular oxidation levels slowly and does not reduce the level of intracellular oxidation to very low levels. In addition, the good stability, low price, and safety of SA make it an ideal candidate antioxidant for cell culture.

Author Contributions

Conceptualization J.Y.; methodology, X.C. and S.X.; validation, J.W.; formal analysis, X.C. and S.X.; investigation, X.C. and X.S.; writing—original draft preparation, X.C. and X.S.; writing—review and editing, J.W.; supervision, J.Y.; funding acquisition, J.Y. All authors have read and agreed to the published version of the manuscript.

Funding

This research was funded by Science and Technology Service Network Initiative of Chinese Academy of Sciences, grant number KFJ-STS-QYZD-122.

Acknowledgments

The authors thank Zhongkui Li for providing valuable information and helpful suggestions.

Conflicts of Interest

The authors declare no conflict of interest.

References

  1. Couzin-Frankel, J. Breakthrough of the year 2013. Cancer immunotherapy. Science 2013, 342, 1432–1433. [Google Scholar] [CrossRef] [PubMed] [Green Version]
  2. Butler, M.; Meneses-Acosta, A. Recent advances in technology supporting biopharmaceutical production from mammalian cells. Appl. Microbiol. Biotechnol. 2012, 96, 885–894. [Google Scholar] [CrossRef] [PubMed]
  3. Dumont, J.; Euwart, D.; Mei, B.; Estes, S.; Kshirsagar, R. Human cell lines for biopharmaceutical manufacturing: History, status, and future perspectives. Crit. Rev. Biotechnol. 2016, 36, 1110–1122. [Google Scholar] [CrossRef] [PubMed] [Green Version]
  4. Kim, J.Y.; Kim, Y.G.; Lee, G.M. CHO cells in biotechnology for production of recombinant proteins: Current state and further potential. Appl. Microbiol. Biotechnol. 2012, 93, 917–930. [Google Scholar] [CrossRef] [PubMed]
  5. Halliwell, B. Cell culture, oxidative stress, and antioxidants: Avoiding pitfalls. Biomed. J. 2014, 37, 99–105. [Google Scholar] [CrossRef]
  6. Halliwell, B. Reactive species and antioxidants. Redox biology is a fundamental theme of aerobic life. Plant Physiol. 2006, 141, 312–322. [Google Scholar] [CrossRef] [Green Version]
  7. Fritz, R.; Bol, J.; Hebling, U.; Angermuller, S.; Volkl, A.; Fahimi, H.D.; Mueller, S. Compartment-dependent management of H2O2 by peroxisomes. Free Radic. Biol. 2007, 42, 1119–1129. [Google Scholar] [CrossRef]
  8. Halliwell, B.; Cross, C.E. Oxygen-derived species: Their relation to human disease and environmental stress. Environ. Health Perspect. 1994, 102, 5–12. [Google Scholar]
  9. Schnellbaecher, A.; Binder, D.; Bellmaine, S.; Zimmer, A. Vitamins in cell culture media: Stability and stabilization strategies. Biotechnol. Bioeng. 2019, 116, 1537–1555. [Google Scholar] [CrossRef] [Green Version]
  10. Kurano, S.; Kurano, N.; Leist, C.; Fiechter, A. Utilization and stability of vitamins in serum-containing and serum-free media in CHO cell culture. Cytotechnology 1990, 4, 243–250. [Google Scholar] [CrossRef]
  11. Hata, R.; Senoo, H. L-ascorbic acid 2-phosphate stimulates collagen accumulation, cell proliferation, and formation of a three-dimensional tissue like substance by skin fibroblasts. J. Cell Physiol. 1989, 138, 8–16. [Google Scholar] [CrossRef] [PubMed]
  12. Yun, Z.; Takagi, M.; Yoshida, T. Effect of antioxidants on the apoptosis of CHO cells and production of tissue plasminogen activator in suspension culture. J. Biosci. Bioeng. 2001, 91, 581–585. [Google Scholar] [CrossRef]
  13. Angata, T.; Varki, A. Chemical diversity in the sialic acids and related alpha-keto acids: An evolutionary perspective. Chem. Rev. 2002, 102, 439–469. [Google Scholar] [CrossRef] [PubMed]
  14. Kim, K.C.; Kang, K.A.; Lim, C.M.; Park, J.H.; Jung, K.S.; Hyun, J.W. Water extract of edible bird’s nest attenuated the oxidative stress-induced matrix metalloproteinase-1 by regulating the mitogen-activated protein kinase and activator protein-1 pathway in human keratinocytes. J. Korean Soc. Appl. Biol. Chem. 2012, 55, 347–354. [Google Scholar] [CrossRef]
  15. Wang, B.; Brand-Miller, J. The role and potential of sialic acid in human nutrition. Eur. J. Clin. Nutr. 2003, 57, 1351–1369. [Google Scholar] [CrossRef] [PubMed] [Green Version]
  16. Chang, R.; Yang, B.; Zhu, Q.J. Theoretical studies on the electronic structure parameters and reactive activity of Neu5Gc and Neu5Ac under food processing solvent environment. Molecules 2019, 24, 313. [Google Scholar] [CrossRef] [Green Version]
  17. Iijima, R.; Takahashi, H.; Namme, R.; Ikegami, S.; Yamazaki, M. Novel biological function of sialic acid (N-acetylneuraminic acid) as a hydrogen peroxide scavenger. FEBS Lett. 2004, 561, 163–166. [Google Scholar] [CrossRef] [Green Version]
  18. Iijima, R.; Ichikawa, T.; Yamazaki, M. Sialic acid attenuates the cytotoxicity of the lipid hydroperoxides HpODE and HpETE. Carbohydr. Res. 2009, 334, 933–935. [Google Scholar] [CrossRef]
  19. Kang, D.G.; Kim, C.S.; Cha, H.J. Coexpression of CMP-sialic acid transporter reduces N-glycolylneuraminic acid levels of recombinant glycoproteins in Chinese hamster ovary cells. Biotechnol. Bioeng. 2019, 116, 2815–2822. [Google Scholar] [CrossRef]
  20. Liste-Calleja, L.; Lecina, M.; Lopez-Repullo, J.; Albiol, J.; Solà, C.; Cairó, J.J. Lactate and glucose concomitant consumption as a self-regulated pH detoxification mechanism in HEK293 cell cultures. Appl. Microbiol. Biotechnol. 2015, 99, 9951–9960. [Google Scholar] [CrossRef]
  21. Karengera, E.; Robotham, A.; Kelly, J. Concomitant reduction of lactate and ammonia accumulation in fed-batch cultures: Impact on glycoprotein production and quality. Biotechnol. Prog. 2018, 34, 494–504. [Google Scholar] [CrossRef] [PubMed]
  22. Dhara, V.G.; Naik, H.M.; Majewska, N.I.; Betenbaugh, M.J. Recombinant antibody production in CHO and NS0 Cells: Differences and similarities. BioDrugs 2018, 32, 571–584. [Google Scholar] [CrossRef] [PubMed]
  23. Fan, Y.; Val, I.J.; Muller, C. Amino acid and glucose metabolism in fed-batch CHO cell culture affects antibody production and glycosylation. Biotechnol. Bioeng. 2015, 112, 521–535. [Google Scholar] [CrossRef] [PubMed] [Green Version]
  24. Yuk, I.H.; Russell, S.; Tang, Y. Effects of copper on CHO cells: Cellular requirements and product quality considerations. Biotechnol. Prog. 2015, 31, 226–238. [Google Scholar] [CrossRef]
  25. Chevallier, V.; Andersen, M.R.; Malphettes, L. Oxidative stress-alleviating strategies to improve recombinant protein production in CHO cells. Biotechnol. Bioeng. 2020, 117, 1172–1186. [Google Scholar] [CrossRef] [Green Version]
  26. Zagari, F.; Jordan, M.; Stettler, M. Lactate metabolism shift in CHO cell culture: The role of mitochondrial oxidative activity. New Biotechnol. 2013, 30, 238–245. [Google Scholar] [CrossRef]
  27. Kyriakopoulos, S.; Kontoravdi, C. A framework for the systematic design of fed-batch strategies in mammalian cell culture. Biotechnol. Bioeng. 2014, 111, 2466–2476. [Google Scholar] [CrossRef]
  28. Yao, T.; Asayama, Y. Animal-cell culture media: History, characteristics, and current issues. Reprod. Med. Biol. 2017, 16, 99–117. [Google Scholar] [CrossRef]
  29. Pan, X.; Streefland, M.; Dalm, C. Selection of chemically defined media for CHO cell fed-batch culture processes. Cytotechnology 2017, 69, 39–56. [Google Scholar] [CrossRef] [Green Version]
  30. Kildegaard, H.F.; Fan, Y.; Sen, J.W. Glycoprofiling effects of media additives on IgG produced by CHO cells in fed-batch bioreactors. Biotechnol. Bioeng. 2016, 113, 359–366. [Google Scholar] [CrossRef]
  31. Xu, S.; Hoshan, L.; Chen, H. Improving lactate metabolism in an intensified CHO culture process: Productivity and product quality considerations. Bioprocess Biosyst. Eng. 2016, 39, 1689–1702. [Google Scholar] [CrossRef] [PubMed]
  32. Altamirano, C.; Illanes, A.; Becerra, S. Considerations on the lactate consumption by CHO cells in the presence of galactose. J. Biotechnol. 2006, 125, 547–556. [Google Scholar] [CrossRef] [PubMed]
  33. Lin, N.; Mascarenhas, J.; Sealover, N. Chinese hamster ovary (CHO) host cell engineering to increase sialylation of recombinant therapeutic proteins by modulating sialyltransferase expression. Biotechnol. Prog. 2015, 31, 334–346. [Google Scholar] [CrossRef] [PubMed] [Green Version]
  34. Feary, M.; Racher, A.J.; Young, R.J.; Smales, C.M. Methionine Sulfoximine supplementation enhances productivity in GS-CHOK1SV cell lines through Glutathione biosynthesis. Biotechnol. Prog. 2017, 33, 17–25. [Google Scholar] [CrossRef] [PubMed]
Figure 1. Effect of sialic acid (SA) on human embryonic kidney 293 (HEK293): cell growth (a), integral of viable density (IVCD) (b), viability (c), and lactate production (d). The total amount of SA added was 0 mg/L (closed circles), 1 mg/L (closed triangles), 10 mg/L (open circles), 100 mg/L (open squares), 500 mg/L (open triangles). Values are reported as the average ± standard deviation (n = 3). The arrow indicates the addition of SA.
Processes 08 01449 g001
Figure 2. Effect of SA on cell line A: cell growth (a), (IVCD) (b), viability (c), and lactate production (d). The total amount of SA added was 0 mg/L (closed circles), 1 mg/L (closed triangles), 10 mg/L (open circles), 100 mg/L (open squares), 500 mg/L (open triangles). Values are reported as the average ± standard deviation (n = 3). The arrow indicates the addition of SA.
Processes 08 01449 g002aProcesses 08 01449 g002b
Figure 3. Effect of SA on cell line B: cell growth (a), (IVCD) (b), viability (c), and lactate (d). The total amount of SA added was 0 mg/L (closed circle), 1 mg/L (closed triangles), 10 mg/L (open circles), 100 mg/L (open squares), 500 mg/L (open triangles). Values are reported as the average ± standard deviation (n = 3). The arrow indicates the addition of SA.
Processes 08 01449 g003
Figure 4. Effect of SA on the reactive oxygen species (ROS) levels. Cell line A (a), and cell line B (b). The total amount of SA added was 0 mg/L (closed circles), 1 mg/L (closed triangles), 10 mg/L (open circles), 100 mg/L (open squares), 500 mg/L (open triangles). The ROS level of the control group for cell line A was normalized to 100 on day 10. Values are reported as the average ± standard deviation (n = 3).
Processes 08 01449 g004
Figure 5. Effect of SA concentration on the cell line A harvest antibody titers. Values are reported as the average ± standard deviation (n = 3). Statistically significant differences are defined as p < 0.05. Statistical significance * for p < 0.05, ** for p < 0.01.
Processes 08 01449 g005
Figure 6. Effect of SA on the cell line B harvest antibody titers. Values are reported as the average ± standard deviation (n = 3). Statistically significant differences are defined as p < 0.05. Statistical significance * for p < 0.05.
Processes 08 01449 g006
Figure 7. N-glycan profiles. The abscissa indicates the peak time (min).
Processes 08 01449 g007
Table 1. Summary of experimental condition for this study.
Cell LineBasal MediumFeed MediumTime of Adding Sialic Acid (Day)
HEK293DynamisCell Boost 7a/7b9, 10, 11, 12
CHO cell line ADynamisCell Boost 7a/7b7, 8, 9, 10
CHO cell line BDynamisCell Boost 7a/7b7, 8, 9, 10
Table 2. Addition of SA yields comparable antibody product quality 1.
Cell LineConditionSEC Major Peak (%)Charge HeterogeneityN-Glycan Profile
Acidic (%)Main (%)Basic (%)G0F (%)G1F (%)G2F (%)SA (%)
AControl98.8 ± 0.323.4 ± 1.368.2 ± 2.48.4 ± 0.985.2 ± 3.110.2 ± 1.22.1 ± 0.20.5 ± 0.1
SA:10 mg/L99.1± 0.220.9 ± 1.270.3 ± 2.58.8 ± 0.983.7 ± 3.011.3 ± 1.11.9 ± 0.20.5 ± 0.1
SA:100 mg/L98.5 ± 0.317.0 ± 1.073.9 ± 2.49.1 ± 1.186.3 ± 2.88.76 ± 1.12.4 ± 0.30.6 ± 0.1
BControl99.2 ± 0.220.8 ± 1.172.4 ± 2.46.8 ± 0.778.2 ± 2.914.4 ± 1.33.2 ± 0.30.7 ± 0.1
SA:10 mg/L98.8 ± 0.317.1 ± 1.175.7 ± 2.67.2 ± 0.779.3 ± 2.413.8 ± 1.33.0 ± 0.20.8 ± 0.1
SA:100 mg/L99.1 ± 0.316.8 ± 1.376.1 ± 2.67.1 ± 0.881.2 ± 2.512.2 ± 1.22.8 ± 0.30.8 ± 0.1
1 The Day 14 harvest material was purified via protein A chromatography. Protein A eluates from the fed-batch shake flask experiments were tested for impurities via Size Exclusion Chromatography (SEC), charge heterogeneity via Cation exchange Chromatography (CEX), N-glycan profile viaUPLC-FLD, and SA via HPLC-FLD. Values of each parameter are reported as average ± standard deviation (n = 3).
Publisher’s Note: MDPI stays neutral with regard to jurisdictional claims in published maps and institutional affiliations.

