Article

Significant Effect of Sample Pretreatment on Ara h1 Extraction and Improved Sensitive SWCNT-Based Detection through Optimization

Gyedang College of General Education, Sangmyung University, 31 Sangmyungdae-Gil, Dongnam-Gu, Cheonan 31066, Korea
Processes 2020, 8(11), 1420; https://doi.org/10.3390/pr8111420
Submission received: 12 October 2020 / Revised: 2 November 2020 / Accepted: 6 November 2020 / Published: 8 November 2020
(This article belongs to the Special Issue Bioprocess Design and Optimization)

Abstract

:
Single-walled carbon nanotube (SWCNT)-based nanobiosensors have received increasing attention from food researchers as a future instrument of food safety due to their high sensitivity. However, the pretreatment process of the sample applying to SWCNT-based nanobiosensor is required to be more delicate compared to other analyses. In this study, the pretreatment process of Ara h1 protein from its retained complex food matrix was optimized using various buffer compounds and the pretreated allergenic Ara h1 obtained for the optimized process was detected by SWCNT-based nanobiosensor. In the pretreatment process, the buffer extraction method with tris buffer (Tris-HNO3, pH 8.4) was developed and used to extract native peanut allergens from foods. The extraction procedure for Ara h1 from peanut butter foods was performed by varying the temperature, extraction time, and additives (NaCl and skim milk powder). The results of these tests using our SWCNT-based biosensor were analyzed to evaluate the allergenic nature of the extracts. The peak level of Ara h1 extraction was achieved as 84.60 ± 7.50 ng/mL at 21 °C/60 min with the mixture of Tris-HNO3 and 1 M NaCl. In addition, other significant Ara h1 extractions were found to be 29.59 ± 2.57 at 21 °C/15 min and 27.74 ± 1.33 ng/mL at 60 °C/15 min. This study emphasizes the importance of adjusting the extraction time and temperature with respect to the target allergen and food matrix components. After the optimization of the sample pretreatment, the precision of SWCNT-based nanobiosensor by the resistance difference (ΔR) of the SWCNT-based biosensor via linear sweep voltammetry in a potentiostat was identified using the pretreated Ara h1 sample from the processed food compared with the indirect enzyme-linked immunosorbent assay (ELISA) results.

Graphical Abstract

1. Introduction

Food allergy is one of the major trending issues all over the world. Accidental ingestion of peanut-containing foods that can trigger allergic reactions towards sensitized individuals cannot be ignored [1,2], so monitoring sensitive consumers with food allergies is crucial. Although many steps have already been taken by food regulatory agencies and manufacturers to mitigate the risks of allergic diseases through the use of good manufacturing practices, hazard analysis and implementing critical control points [3], minimizing the prevalence of allergic disease still remains a challenge. Among the allergic foods, peanut is considered among the major sources for most food allergenic reactions. The common peanut (Arachis hypogaea) allergens are referred to Ara h1 to Ara h13. Ara h1 is a heat stable 7S globulin protein belonging to the vicilin family and accounts for approximately 12–16% of the total protein in peanuts [4,5]. Ara h1 causes allergenic disease in 35–95% of patients [6]. It is protected from ingestion in the human gastrointestinal track and identified by serum IgE in more than 90% of peanut-allergic patients [7].
Many immunological methods, including direct or indirect, competitive, and sandwich enzyme-linked immunosorbent assays (ELISAs), have been described and considered as a useful method for the sensitive and selective detection of the peanut allergen because of their affordability and simplicity [8,9]. However, the main drawbacks of ELISA are that they are time consuming, not reusable, expensive, and must be conducted by trained personnel. Polymerase chain reaction (PCR) procedures and nucleic acid-based detection methods have been promoted as rapid detection tools [10,11,12], but they are expensive, not applicable for on-site detection, and require skilled personnel in the laboratory. As current detection methods have some limitations, such as limited on-site detection, time-consuming steps, expensive equipment, costly reagents, and the need for skilled personnel [9,13], there is a need to develop a sensitive, rapid, and selective detection system that can provide reliable and specific results with minimal cost and labor.
Biosensors have become a promising concept because of their reliable, rapid and precise information on food safety. The assimilation of nanomaterials, especially single-walled carbon nanotubes (SWCNTs), onto biosensor platforms offers numerous benefits for the detection of biological molecules like microorganisms, virus and pollutants [10,14,15]. SWCNTs are considered as one of the key nanomaterials for biosensor development due to their nanometer diameter (~1 nm) [16]. In addition to their exceptional electrical properties, SWCNTs have high strength, flexibility, and biomolecular compatibility [17,18]. Due to the smallest diameter of 1 nm, SWCNTs can obtain size compatible character to detect single biomolecules [4,19,20]. Thus, they offer the greatest interactions at the interface of adjacent biomolecules because all of nano-scaled carbon atoms are in direct contact with their environment and have large surface area [15,21,22]. In addition, the charge carrier density of SWCNTs is comparable to the surface charge density of biomolecules, which enhances the electrochemical sensitivity of SWCNTs to target biomolecules [21].
Besides using a biosensor for detection, a crucial step in food analysis is the extraction of the peanut allergen using the buffer extraction method and its constituents because the biosensor method does not have the scope for direct practical use in real food samples. Several conditions in the pretreatment process need to be considered to save the integrity of the target peanut proteins, i.e., the pH of the extraction buffer solution, the extraction temperature, and the extraction time. Besides, it is crucial to assure that the target peanut proteins are not be destroyed or modified during the entire sample pretreatment procedure. The food matrix has had a large inhibiting effect on the extraction results because of nonspecific binding, which can cause false-negative results [23]. If samples are not treated correctly for extraction, the biosensor device cannot detect Ara h1 in foods. Although the types of antibodies and assays used are varied for different samples, different Ara h1 extraction methods have been used in different studies, which is why a different biosensor method has been considered [24]. Therefore, we developed the SWCNT-based biosensor for standard Ara h1 detection in our previous works [4,25]. The use of a biosensor for detecting Ara h1 in real foods is important because the clinical relevance of the peanut allergen is increasing. Because of the inherent difficulty of analyzing allergen proteins in food samples [26,27], the goal of this research was to explore the best conditions for extracting Ara h1 from the complex food matrix of peanut butter by using different temperature, time and buffer recipes (NaCl and skim milk powder). To our knowledge, there is no prior report on the use of SWCNT-based biosensor assay for Ara h1 detection in food extracts after pretreatment process. Therefore, objectives of this study are to (1) characterize the SWCNT-based biosensor for Ara h1; and (2) optimize the pretreatment conditions (i.e., time and temperature) of Ara h1 extraction from the processed foods.

2. Materials and Methods

2.1. Materials

SWCNTs, purity with >95% (w/w), were purchased from Sigma-Aldrich, Co. Ltd. (St. Louis, MO, USA). The pure standard peanut allergen Ara h1 and the polyclonal antibodies of Ara h1 (anti-Ara h1 pAbs) for the inhibition test (20,000 ng/mL) was obtained by Indoor Biotechnologies Inc. (Cardiff, UK) from the United Kingdom. Buffer compounds containing phosphate buffered saline (PBS, 0.1 M, pH 7.4), Tris-HNO3 (65%, w/w), skim milk powder, and NaCl as buffer were purchased from Life Technology, Co. Ltd. (Seoul, Korea) and prepared by mixing with purified water. Bovine serum albumin (BSA, 96–99%) was obtained from Baoman Bio-tech Co., Ltd. (Seoul, Korea).

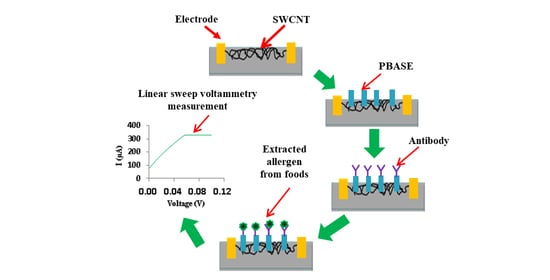
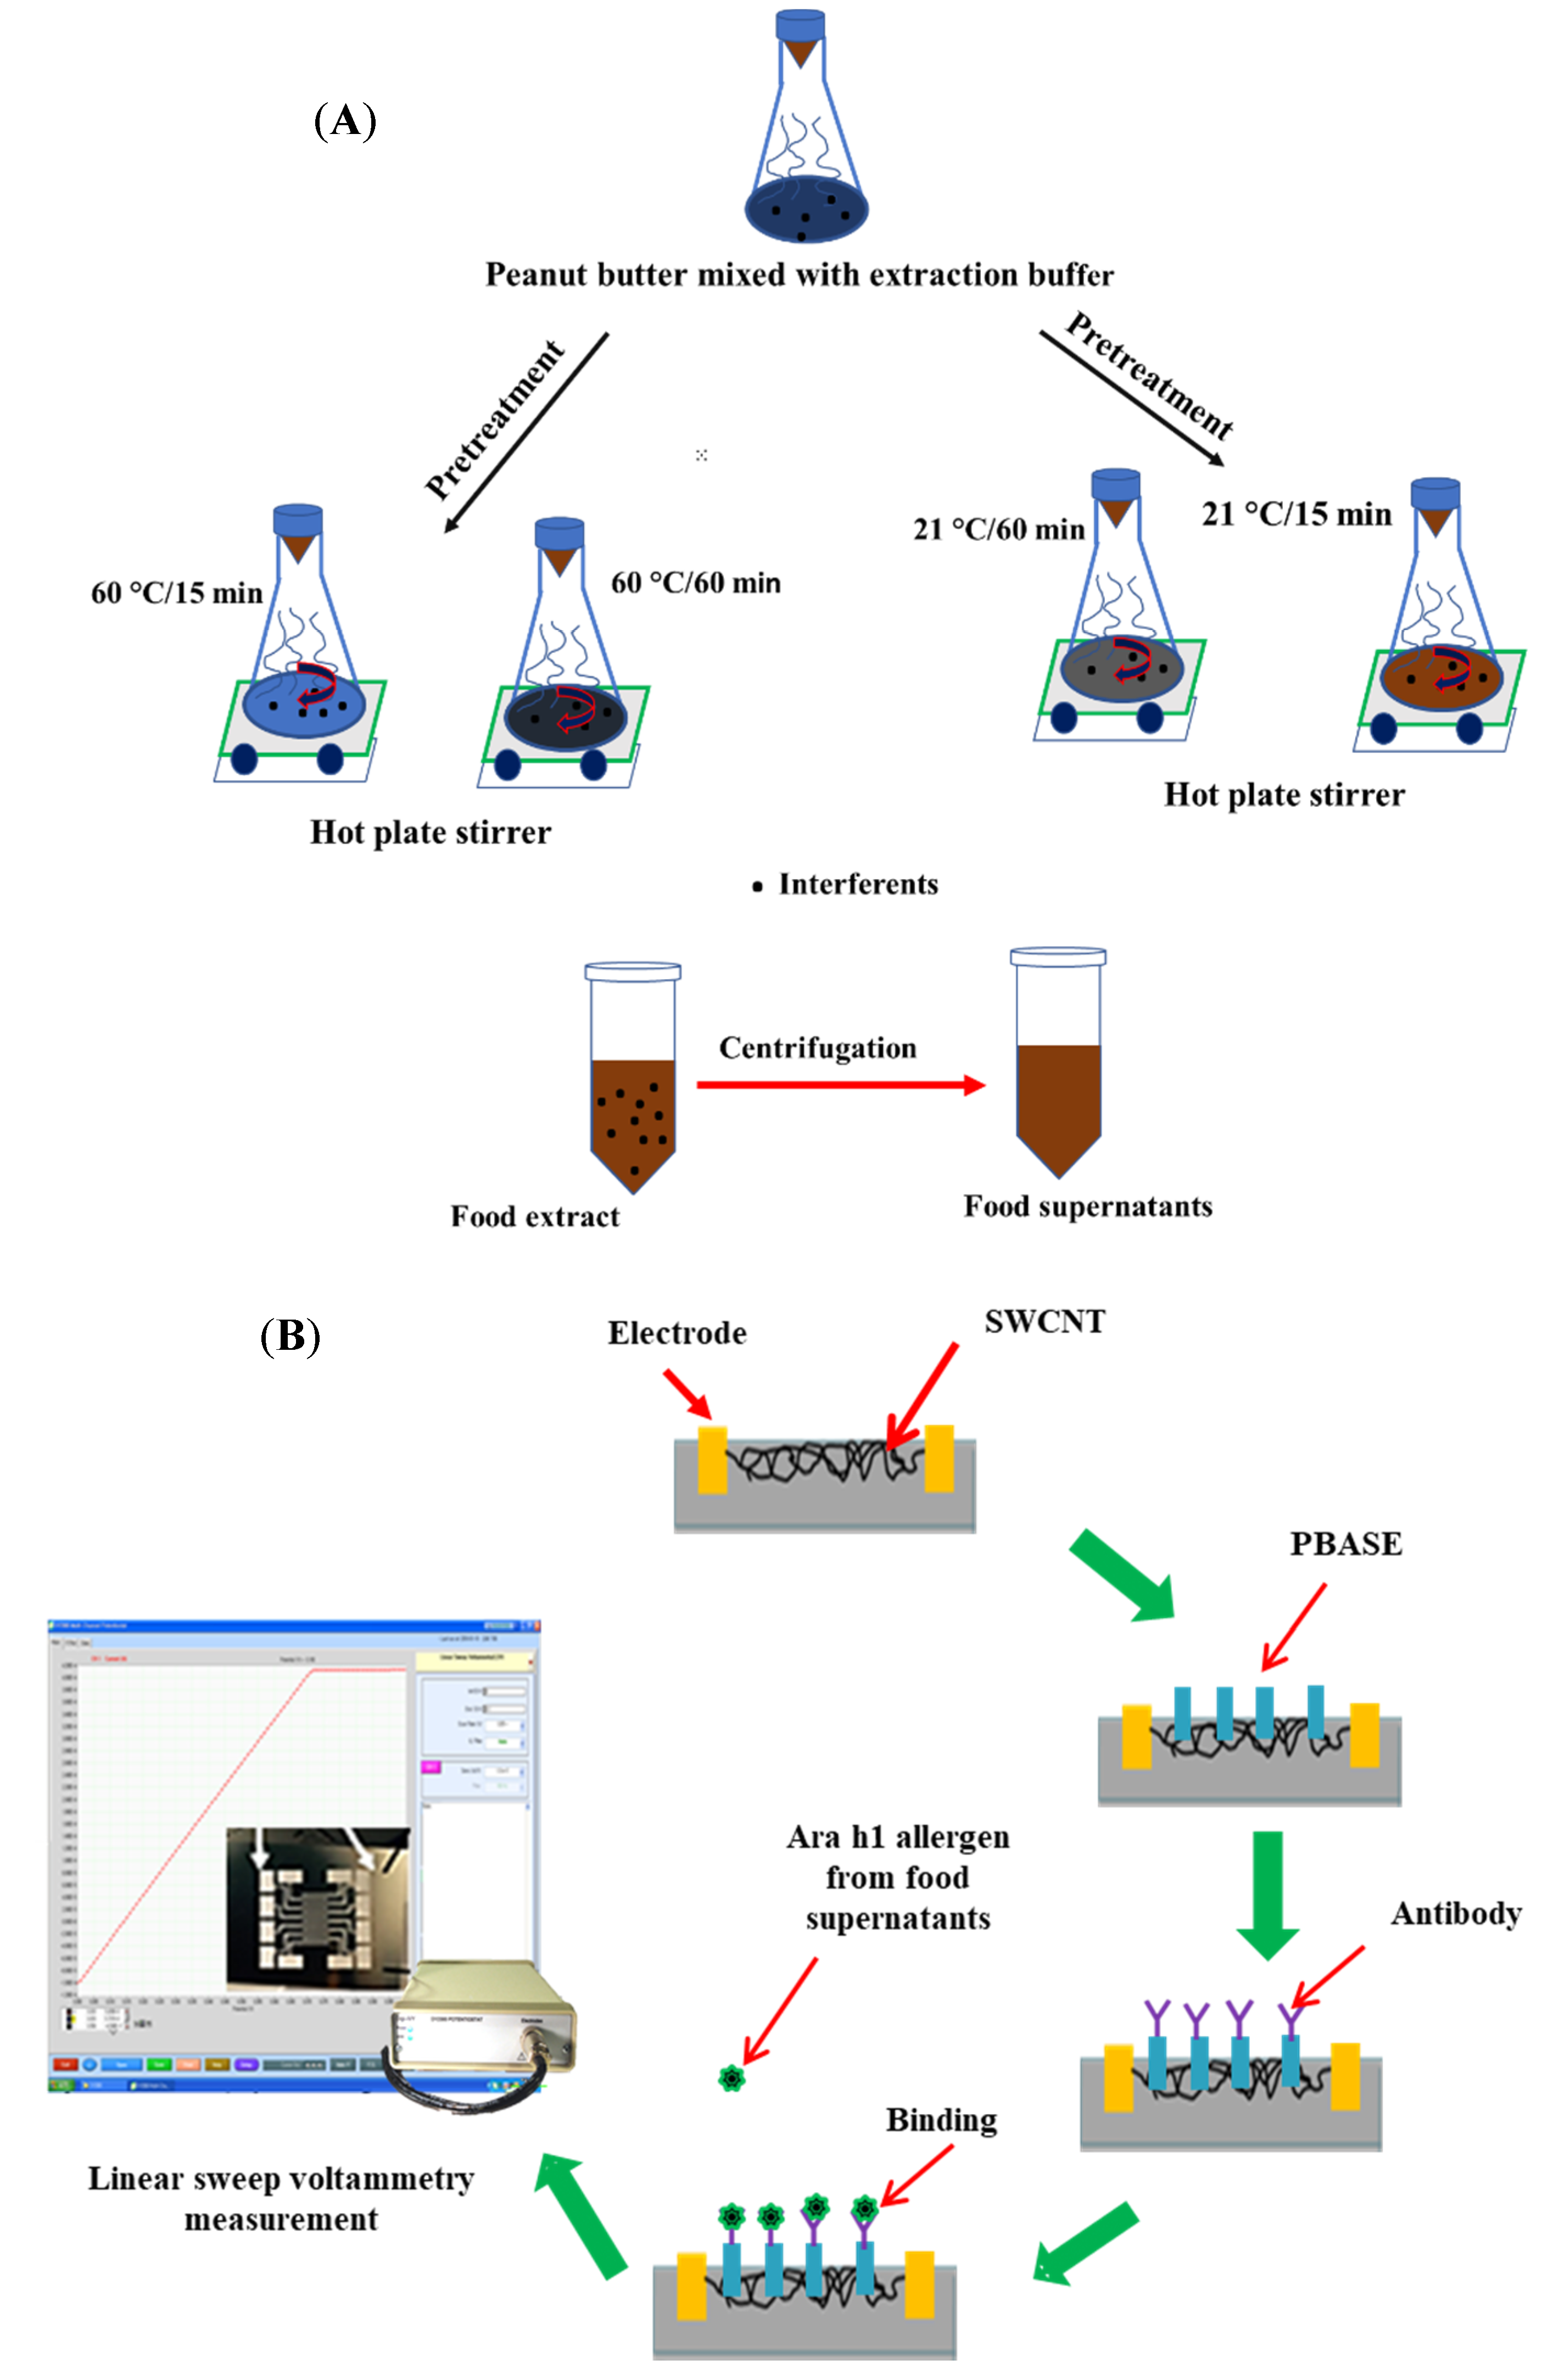
2.2. SWCNT-Based Nanobiosensor for the Detection of Ara h1 Protein

First, 0.1 mg of SWCNTs was dispersed in 1 mL of N,N-dimethylformamide (DMF) and sonicated for 2 h using an ultrasonic sonicator. The sonicated SWCNT suspension was aligned between electrodes on the biosensor template. Then, the biosensor template was annealed at 80 °C into the dry oven for 15 min. Afterward, the annealed biosensor plate was fabricated with 1-pyrenebutanoic acid, succinimidyl ester (PBASE) for 2 h at room temperature (PBASE concentration was 9.8 mg of PBASE diluted into 5 mL of DMF). Subsequently, the fabricated biosensor was functionalized with anti-Ara h1 pAbs overnight at 4 °C. The functionalized biosensor bound with pAbs was used to detect Ara h1 in foods [25].

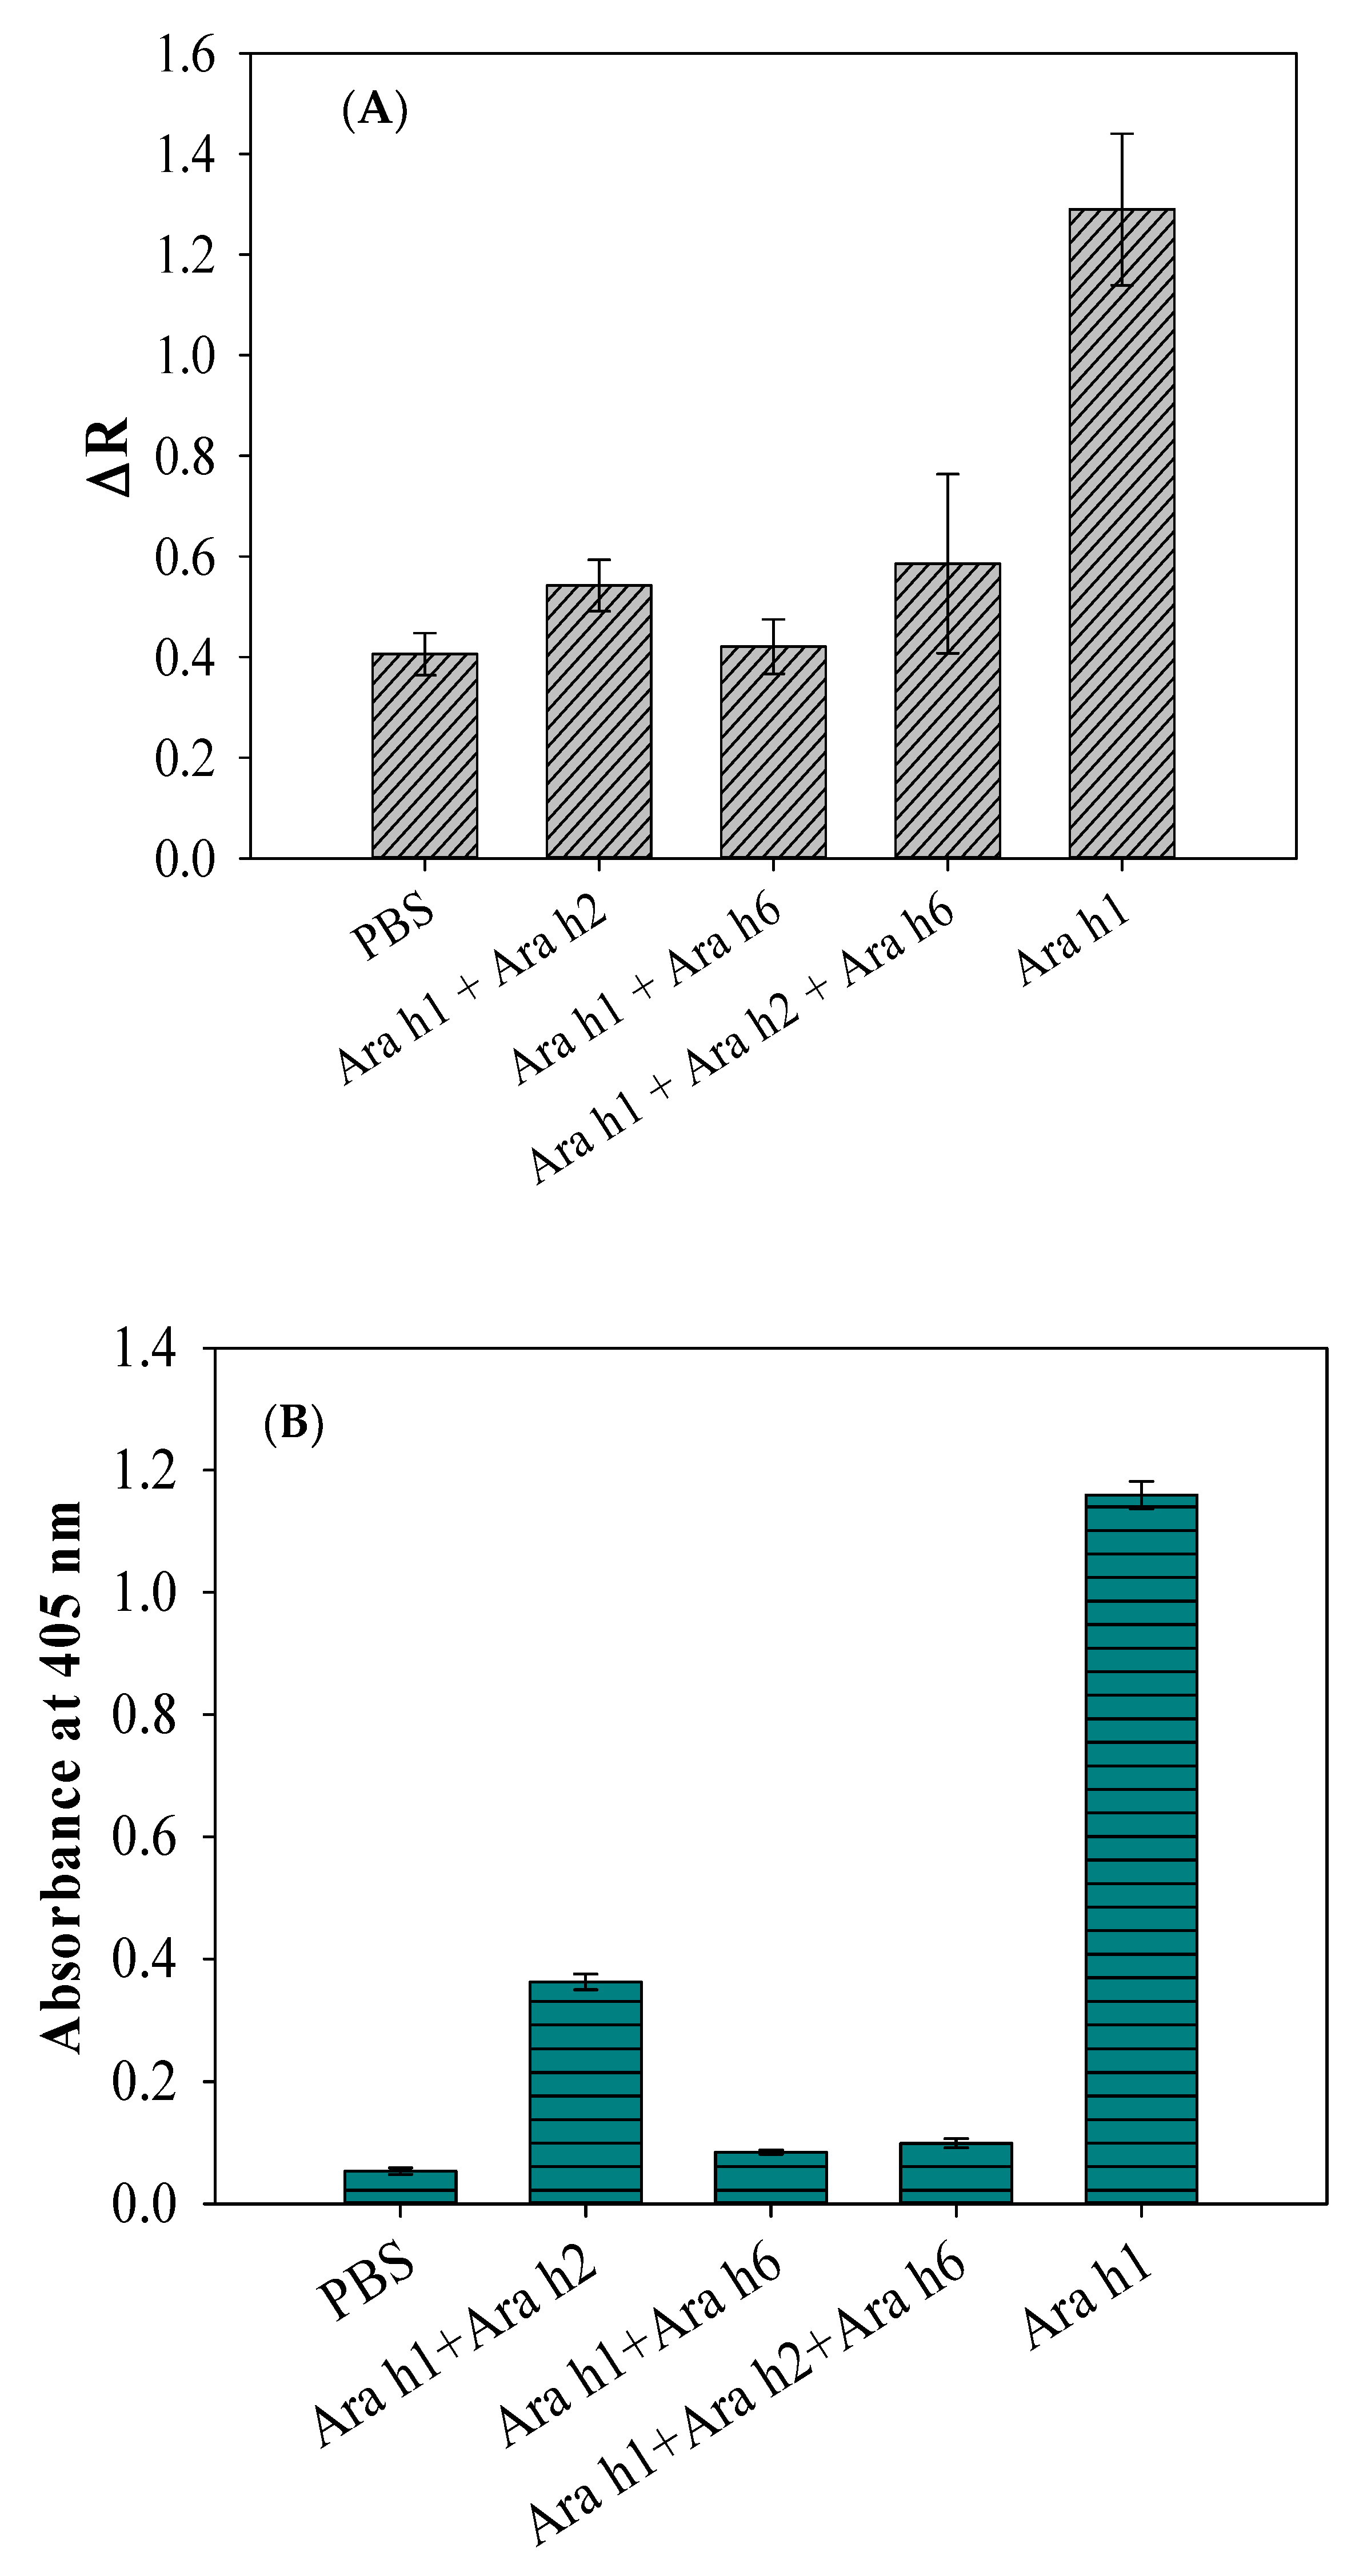
2.3. Analysis of Inhibitory Effects of Antibodies

The efficacy of the inhibition of anti-Ara h1 antibodies caused by the peanut allergens and their mixtures (Ara h1, Ara h1 with Ara h2, Ara h1 with Ara h6, Ara h1 with Ara h2, and Ara h6) was investigated using indirect ELISA and compared with inhibitory effects determined by the developed SWCNT-based biosensor. The concentrations of combined-allergen samples were maintained at 100 ng/mL for inhibition analysis. The preparation steps for ELISA to verify the inhibitory effects of the antibodies were performed by following the procedure described previously [1]. First, each combined allergen suspension (100 μL) was added in a 96-well ELISA kit and incubated at 37 °C for 1 h. After incubation, the ELISA plate wells were blocked by 0.2% BSA for 1 h. Then, 100 µL of anti-Ara h1 pAb was added to each blocked ELISA well and incubated for 2 h. Then, anti-rabbit IgG-alkaline phosphatase secondary antibody, which was diluted at 1:1500, was added to each ELISA well for 1 h. Then, a 100 µL aliquot of p-nitrophenyl phosphate (p-npp), prepared by 5 mg of p-npp mixed in 5 mL of 1 M ethanolamine buffer was added to each desired well for 20 min. Afterwards, the color development of ELISA wells was measured using a Synergy H1 hybrid multimode microplate reader (BioTek Instruments, Sangmyung University, Jongno-gu, Korea) at 405 nm. To analyze the inhibitory effects determined by the biosensor, 100 µL of each allergen combination suspension was applied to the functionalized biosensor surface separately for 30 min at room temperature. Afterwards, the biosensor was washed each time with purified water to eliminate the unbound peanut allergens. Following this step, the resistance of the biosensor was measured by a linear sweep voltammetry program to determine the inhibitory effects caused by the nontarget peanut allergens and compared it with the results from the ELISA.

2.4. Pretreatment of Ara h1 Protein from the Processed Food

A complex peanut butter containing peanuts (89.9%), manufactured by Qingdao Jixing Foods Co. Ltd. (Beijing, China), was bought at nearby supermarket and used in this study for peanut allergen extraction. The major constituents of the obtained sample were vegetable fat, phenolic compounds, starch, soya lecithin, and flavor additives. As a negative control, we used PBS buffer without peanut foods as an ingredient (and without a label alleging its potential presence). The sample preparation and pretreatment steps of real peanut butter was followed by the procedure described previously with a slight modification [7]. The pretreatment steps for allergen extraction are shown in Figure 1A. Briefly, the peanut butter food was first preserved at −20 °C to prevent melting during grinding. Then, the frozen peanut butter sample was ground using a grinder machine. Different extracts of the ground sample were made, in triplicate, using 2 g of the powdered peanut butter foods and 20 mL of Tris-HNO3 buffer (B) and different concentrations of NaCl (S), skim milk powder (M), or both (Sigma-Aldrich). In summary, the buffer extraction recipes for pretreating the samples were as follows: (B) Tris-HNO3 buffer, (S) Tris-HNO3 buffer and 0.1 or 1 M sodium chloride (NaCl) and (M) Tris-HNO3 buffer and 1 or 2 g of skim milk powder. The food extracts of peanut butter were acquired at a controlled time with 15 or 60 min and temperatures of 21 °C and 60 °C. Afterward, the extract samples were centrifuged at 5000 rpm for 5 min. An aliquot of 1 mL of centrifuged supernatant was further centrifuged at 10,000 rpm for 3 min and the resulting supernatant was used for biosensor analysis.
Linear sweep voltammetry (LSV) is one of the voltammetric electrochemical analysis methods, wherein the current of the working electrode was measured with respect to the applied voltage which linearly swept between the working electrode and reference electrode. In this study, the LSV program was used to measure the biosensor current using a potentiostat at each step of allergen extraction from foods. The current of the biosensor was considered between 0.0 and 0.1 V for each test. The resistance (R) of the biosensor was calculated by following the inverse of the I/V value and ∆R, which is the main electrical response for detection using the SWCNT-based biosensor, calculated as
R = (R1 − R0)/R0
where R0 is the initial resistance of the biosensor measured with only PBASE as linker and R1 is the resistance of biosensor measured with Ara h1 or food extracts. The stepwise development process of a biosensor and its measurement by LSV have been shown in Figure 1B.

2.5. Statistical Analysis

The LSV and ELISA measurements were repeated in triplicate and the data were reported as average ± standard deviation. All analyses of the data were performed by the one-way analysis of variance (ANOVA), and the differences between the means were analyzed using the Duncan multiple range test with a defined significance level of p < 0.05.

3. Results and Discussion

Inhibition Analysis of Antibodies

The cross reactivity of antibody (i.e., inhibition of antibody) is known as among the major concerns in immunological assays [28]. During the course of experiments, the inhibitory efficacy produced by the affinity of nontarget peanut allergen molecules toward the allergen antibodies (pAbs) needs to be verified by the SWCNT-based biosensor and compared to that of the obtained inhibition response using indirect ELISA with the same allergens. For the biosensor, Ara h1 alone and Ara h1 with the addition of nontarget allergens Ara h2 and Ara h6 were examined against anti-Ara h1 pAbs to verify antibody cross-reactivity, while the concentrations of the allergen suspensions were kept constant at 100 ng/mL. For each step of biosensor analysis, the biosensor was characterized electrically by measuring the resistance. As can be seen in Figure 2A, the maximum resistance signal was observed for Ara h1 alone, which was the target biomaterial, demonstrating that there was no significant inhibitory side effect between Ara h1 antigens and anti-Ara h1 pAbs.
Meanwhile, the minimum resistance signal was obtained with the Ara h1 by the addition of nontarget allergens Ara h2 and Ara h6. PBS was used as a control. Basically, the difference among the Ara h1, Ara h2, and Ara h6 antigen molecules was their epitopes, which comprise a large polymer of repeating oligosaccharides in cells and is the specific part of the antigen that the antibody targets [29]. Ara h1 consists of a specific anti-Ara h1 epitope on its outer membrane that is specific enough to react with anti-Ara h1 antibodies, whereas all the other allergens consist of nonspecific epitopes that are not specific enough to react with anti-Ara h1 antibodies. The differences in epitopes were not the only cause of the reduced biosensor response. The other reason might be responsible for causing the inhibition of the antibodies in this case. For example, the presence of the nonspecific antigens Ara h2 and Ara h6, in addition to Ara h1, might have inhibited the binding reactivity of anti-Ara h1 pAbs with Ara h1 molecules. This is called the inhibitory effect of antibodies.
Indirect ELISA is a widely used technique to confirm the specific binding reaction of an antibody with the selected antigen [29]. As can be seen in Figure 2B, only Ara h1 reacted (or responded, or was specific) sufficiently with the anti-Ara h1 pAbs, confirming that the pAbs were not inhibited enough from binding with Ara h1. However, the combined suspensions, Ara h1 with the addition of nontarget allergens Ara h2 and Ara h6, scientifically confirmed the inhibition of the anti-Ara h1 pAbs. The ELISA inhibition result was in good agreement with the inhibition result obtained by the SWCNT-based biosensor, as seen in Figure 2. The ELISA test is popular for determining the specificity of pAbs; however, it still has some limitations, i.e., it is a lengthy process (6~7 h), requires trained personnel to perform it, and is not portable. In this study, we used an indirect ELISA as a reference method by which we validated the biosensor assay as a sensitive, rapid, and label-free assay. As the antibodies of Ara h1 were inhibited by the presence of nontarget particles (i.e., Ara h2 and Ara h6), the food samples must undergo pretreatment analysis before allergen extraction to reduce the inhibition of antibodies from the foods. This is because peanut butter samples have a variety of allergenic nature with its food particles, so inhibitory components can be possibly reduced after the pretreatment analysis.
Different biosensing methods have been used by several authors to detect peanut allergens in peanut-containing food supernatants by following sample pretreatment protocols [25,30]. One leading food pretreatment method is the buffer extraction protocol that uses Tris-buffer and additives (skim milk powder and salt), where the pH of the buffer solution is maintained at 7~9 to extract the peanut allergen from foods [30,31,32]. In general, some food products consist of phenolic compounds, which make it difficult to extract the peanut allergen from the food matrix components because nontarget materials reduce antibody binding specificity during allergen extraction. The additives used in buffer extraction recipes were skim milk powder and NaCl of different ionic concentrations [33]. The interference caused by phenolic compounds was effectively reduced by skim milk powder, while the NaCl ionic concentration was used to improve allergen extraction from food samples [34]. Although ELISA is a popular method for detecting a peanut allergen in peanut-containing food supernatants, it does not provide consistent extraction results [1,4]. The quantification range, detection limits, and results of these assays are not consistent and fluctuated in different tests [24]. In addition, buffer extraction can be influenced by the parameters of temperature, time, and the nature of additives used in analysis.
The direct quantification of peanut allergen extracted in food sample supernatants is known to be difficult [4], so measuring the ∆R of the biosensor electrode, with pure Ara h1 as the standard curve, was considered as the best option for peanut protein quantification in this study. As shown in set of Figure 2A, a standard linear curve relationship between ∆R and Ara h1 concentrations ranging between 1 and 100 ng/mL was obtained. In this regard, ∆R from the SWCNT-based biosensor was determined for food extracts containing Ara h1. The value of ∆R obtained was interpolated in the calibration curve, and the concentrations of the extracted Ara h1 were calculated using the linear part of the calibration curve [4]. A linear regression relationship between ∆R and Ara h1 concentration between 1 and 100 ng/mL was obtained: ∆R = 0.0004 × Ara h1 concentration (ng/mL) + 0.1629; r = 0.9828.
To verify the effect of extraction time and temperature, the extraction of Ara h1 from peanut butter was done at 21 °C for 60 min, 21 °C for 15 min, 60 °C for 60 min and 60 °C for 15 min. For each time and temperature set, different extraction recipes using Tris-HNO3 buffer mixed with NaCl, skim milk powder, or both were used. Table 1 presents the results of the extractions at 60 °C for 60 min and 60 °C for 15 min. As can be observed in Table 1, the extracted Ara h1 amounts ranged from 2.35 ± 1.81 to 27.74 ± 1.33 ng/mL and from 2.45 ± 0.23 to 19.15 ± 3.61 ng/mL.
Among them, the maximum amount of Ara h1 extracted was 27.74 ± 1.33 ng/mL at 60 °C for 15 min using a buffer extraction recipe of B/1S (Tris-HNO3 with 1 M NaCl). Skim milk powder and NaCl were thought to improve allergen extraction. However, the minimum amount of Ara h1 extraction was obtained as 2.35 ± 1.81 ng/mL using the buffer recipes of B/0.1S/2M (Tris-HNO3 diluted with 0.1 M NaCl and 2 g of skim milk powder) at 60 °C for 15 min, which means the combination of skim milk powder and NaCl was not enough to extract the Ara h1 from the foods at 60 °C for 15 min. In contrast, the extractions using the same recipes at 60 °C for 60 min were comparatively higher at 15.67 ± 2.23 ng/mL of Ara h1. The reduction in Ara h1 extracted using 0.1 M NaCl and 2 g of skim milk powder at 60 °C for 60 min compared with that at 60 °C for 15 min shows the effect of time for extraction.
The extraction of Ara h1 from peanut butter was also analyzed at 21 °C for 15 min and 21 °C for 60 min using the buffer recipes prepared from Tris-HNO3 buffer with NaCl, skim milk powder, or both. Table 2 shows that the maximum amount of Ara h1 extracted was 84.60 ± 7.50 ng/mL (p < 0.05) when the buffer recipe of B/1M (Tris-HNO3 mixed with 1 g of skim milk powder) was used at 21 °C for 60 min.
However, 29.59 ± 2.57 ng/mL was the highest amount of Ara h1 extracted at 21 °C for 15 min using the recipe of B/1S (Tris-HNO3 mixed with 1 M NaCl). The minimum amounts of extracted Ara h1 were 2.31 ± 0.12 and 2.37 ± 0.11 ng/mL at 21 °C for 15 min when using buffer recipes of B/1S/2M (Tris-HNO3 mixed with 1 M NaCl and 2 g skim milk powder) and B/2M (Tris-HNO3 diluted with 2 g of skim milk powder), respectively.
For a better contrast and understanding the extraction results, the extracted Ara h1 amounts were grouped according to the time and temperature sets. It has been reported that sample solution contact time has an effect on the peanut allergen extracted from a food sample [7]. The amounts of Ara h1 extracted at 60 °C for 60 min were less than those extracted for 15 min (Figure 3A).
As can be shown in Figure 3A, the maximum Ara h1 was extracted for 15 min, which occurred when using the buffer recipe of B/1S (Tris-HNO3 with 1 M NaCl). The minimum amount extracted occurred when the sample was pretreated with buffer recipes of B/1S/2M (Tris-HNO3 with 1 M NaCl and 2 g of skim milk powder) at 60 °C/60 min. Therefore, the former condition (B/1S for 60 °C/15 min) could be recommended for the extraction process. It was seen that the allergen extraction levels were higher for 60 °C/15 min than for 60 °C/60 min. This may be due to protein denaturation. Some active peanut proteins may be damaged or denatured during longer sample solution contact times at the same temperature (60 °C) and using the same extraction recipes. This is not acceptable for the protocol for allergen recovery from foods. The analysis of Ara h1 recovery suggests that the buffer recipe of B/1S could be used for extracting Ara h1 (p < 0.05) from peanut butter food samples using the SWCNT-based biosensor for 60 °C/15 min.
As can be seen in Figure 3B, the greatest amount (ng/mL) of Ara h1 extracted from peanut butter was 84.60 ng/mL at 21 °C for 60 min and 29.59 ng/mL at 21 °C for 15 min. It is seen that the extraction amounts were higher at 21 °C for 60 min than at 21 °C for 15 min. The highest amount of Ara h1 was extracted (p < 0.05) with the extraction recipe B/1M (Tris-HNO3 buffer with 1 g of skim milk powder). In general, the composition of the extraction recipes was significant for Ara h1 extraction in this study. We found that approximately three times more Ara h1 was extracted at 21 °C for 60 min with the another three kinds of recipes except B/1M: (1) B/2M (Tris-HNO3 buffer addition of 2 g of skim milk powder); (2) B/0.1S/1M (Tris-HNO3 buffer addition of 0.1 M NaCl and 1 g of skim milk powder); and (3) B/0.1S/2M (Tris-HNO3 buffer addition of 0.1 M NaCl and 2 g of skim milk powder). In contrast, the other highest amounts of Ara h1 were extracted at 21 °C for 15 min only using B/0.1S and B/1S (addition of 0.1 and 1 M NaCl, respectively). Negligible concentrations of Ara h1 were extracted when using B/2M (Tris-HNO3 buffer with 2 g of skim milk powder) and B/1S/2M (Tris-HNO3 buffer with 1M NaCl and 2 g of skim milk powder) at 21 °C for 15 min, as seen in Figure 3B.
For the 60 min extraction period, lower amounts of Ara h1 were extracted at 60 °C than at 21 °C (Figure 4A). Compared with the extractions of 21 °C/60 min with 60 °C/60 min, the extraction levels at 21 °C for 60 min were statistically more significant (p < 0.05). Comparing the 15 min extractions at 21 °C and 60 °C, Figure 4B clearly shows that the results were not significantly different (p > 0.05) when using the extraction mixtures of B/2M (inclusion of 2 g of skim milk powder), B/0.1S/1M (addition of 0.1 M NaCl and 1 g of skim milk powder), and B/0.1S/2M (addition of 0.1 M NaCl and 2 g of skim milk powder). Overall, the extraction amounts were higher at 21 °C/60 min, suggesting that the SWCNT-based biosensor be used with that buffer extraction condition. According to a study conducted by Pollet et al. (2011), chocolate significantly impaired the detection of Ara h1 when foods were pretreated and extracted using B/1S/1M (addition of 1 M NaCl and 1 g of skim milk powder) at 21 °C for 60 min [33]. It was also reported that Ara h1 can be extracted through the pretreatment process from chocolate products using dry milk powder (5% nonfat dry milk) [26].
The capacity of the biosensor to quantify the amount of Ara h1 extracted from a complex food sample has been reported previously [4,30,33]. It is crucial to know if the buffer recipes selected as the best for extraction could interfere with protein detection. PBS and Tris-HNO3 buffer were prepared as blank extracts (without sample) and used as controls with the biosensor to compare their extraction performance to that of the other peanut extracts. The estimated results for PBS and Tris-HNO3 buffer showed that the biosensor did not detect extracted Ara h1 from the peanut butter sample, which confirmed that the extraction recipes used in this study did not have the potential to inhibit the ability of the biosensor to detect Ara h1 in a peanut butter sample. Thus, any possibility of the extraction mixtures used interfering with SWCNT-based biosensor detection can be excluded.

4. Conclusions

A SWCNT-based biosensor is a rapid and sensitive detection tool, developed and used to detect Ara h1 in peanut butter foods. The biosensor showed a high-performance level, sensitive response and miniaturized structure compared to other conventional assays. Biosensor immobilized with anti-Ara h1 pAb decreased the inhibition effects with respect to only Ara h1 (p < 0.05), whereas there was a significant inhibition effect for solutions of Ara h1 combined with Ara h2 and with Ara h6. The results of this work show that the buffer recipes used significantly increase the amount of extracted Ara h1 and that a long extraction time (60 min) at 21 °C was mostly more efficient than a short period (15 min), except for the use of 60 °C for 60 min, which led to a decline in the amount of extracted protein. Using this analysis, 21 °C for 60 min and 60 °C for 15 min were selected as the optimum extraction conditions because the highest amounts of Ara h1 were extracted with their use. This study highlighted that the sample preparation steps and extraction conditions (time and temperature) influenced peanut allergen extraction.

Funding

This research was funded by 2018 Research Grant from Sangmyung University.

Conflicts of Interest

The author declares no conflict of interest.

References

  1. Sobhan, A.; Oh, J.H.; Park, M.-K.; Lee, J. Detection of peanut allergen Ara h 6 in commercially processed foods using a single-walled carbon nanotube–based biosensor. J. AOAC Int. 2018, 101, 1558–1565. [Google Scholar] [CrossRef] [PubMed]
  2. Kagan, R.S.; Joseph, L.; Dufresne, C.; Gray-Donald, K.; Turnbull, E.; St Pierre, Y.; Clarke, A.E. Prevalence of peanut allergy in primary-school children in Montreal, Canad. J. Allergy Clin. Immunol. 2003, 112, 1223–1228. [Google Scholar] [CrossRef] [PubMed]
  3. Velusamy, V.; Arshak, K.; Korostynska, O.; Oliwa, K.; Adley, C. An overview of foodborne pathogen detection: In the perspective of biosensors. Biotechnol. Adv. 2010, 28, 232–254. [Google Scholar] [CrossRef]
  4. Sobhan, A.; Oh, J.-H.; Park, M.-K.; Kim, S.W.; Park, C.; Lee, J. Assessment of peanut allergen Ara h1 in processed foods using a SWCNTs-based nanobiosensor. Biosci. Biotechnol. Biochem. 2018, 82, 1134–1142. [Google Scholar] [CrossRef] [PubMed] [Green Version]
  5. Sun, X.; Guan, L.; Shan, X.; Zhang, Y.; Li, Z. Electrochemical detection of peanut allergen Ara h 1 using a sensitive DNA biosensor based on stem–loop probe. J. Agric. Food Chem. 2012, 60, 10979–10984. [Google Scholar] [CrossRef]
  6. Wen, H.W.; Borejsza-Wysocki, W.; DeCory, T.R.; Durst, R.A. Peanut allergy, peanut allergens, and methods for the detection of peanut contamination in food products. Compr. Rev. Food Sci. Food Saf. 2007, 6, 47–58. [Google Scholar] [CrossRef]
  7. Alves, R.C.; Pimentel, F.B.; Nouws, H.P.A.; Silva, T.H.B.; Oliveira, M.B.P.P.; Delerue-Matos, C. Improving the extraction of Ara h 6 (a peanut allergen) from a chocolate-based matrix for immunosensing detection: Influence of time, temperature and additives. Food Chem. 2017, 218, 242–248. [Google Scholar] [CrossRef] [Green Version]
  8. Sobhan, A.; Oh, J.H.; Park, M.K.; Lee, J. Reusability of a single-walled carbon nanotube-based biosensor for detecting peanut allergens and Y. enterocolitica. J. Microelectron. Eng. 2020, 225, 111281. [Google Scholar] [CrossRef]
  9. Yamada, K.; Kim, C.-T.; Kim, J.-H.; Chung, J.-H.; Lee, H.G.; Jun, S. Single walled carbon nanotube-based junction biosensor for detection of Escherichia coli. PLoS ONE 2014, 9, e105767. [Google Scholar] [CrossRef] [Green Version]
  10. Sobhan, A.; Lee, J.; Park, M.K.; Oh, J.H. Rapid detection of Yersinia enterocolitica using a single–walled carbon nanotube-based biosensor for Kimchi product. LWT 2019, 108, 48–54. [Google Scholar] [CrossRef]
  11. Sobhan, A.; Oh, J.; Lee, J. Rapid Detection of Ara h2 using single walled carbon nanotube based biosensor for peanut allergen control. Appl. Mech. Mater. 2018, 878, 286–290. [Google Scholar] [CrossRef]
  12. Malorny, B.; Paccassoni, E.; Fach, P.; Bunge, C.; Martin, A.; Helmuth, R. Diagnostic real-time PCR for detection of salmonella in food. Appl. Environ. Microbiol. 2004, 70, 7046–7052. [Google Scholar] [CrossRef] [PubMed] [Green Version]
  13. García-Aljaro, C.; Cella, L.N.; Shirale, D.J.; Park, M.; Muñoz, F.J.; Yates, M.V.; Mulchandani, A. Carbon nanotubes-based chemiresistive biosensors for detection of microorganisms. Biosens. Bioelectron. 2010, 26, 1437–1441. [Google Scholar] [CrossRef]
  14. Sobhan, A.; Muthukumarappan, K.; Cen, Z.; Wei, L. Characterization of nanocellulose and activated carbon nanocomposite films’ biosensing properties for smart packaging. Carbohydr. Polym. 2019, 225, 115189. [Google Scholar] [CrossRef] [PubMed]
  15. Allen, B.L.; Kichambare, P.D.; Star, A. Carbon nanotube field-effect-transistor-based biosensors. Adv. Mater. 2007, 19, 1439–1451. [Google Scholar] [CrossRef]
  16. Iijima, S. Carbon nanotubes: Past, present, and future. Phys. B Condens. Matter. 2002, 323, 1–5. [Google Scholar] [CrossRef]
  17. Katz, E.; Willner, I. Biomolecule-functionalized carbon nanotubes: Applications in nanobioelectronics. Chem. Phys. Chem. 2004, 5, 1084–1104. [Google Scholar] [CrossRef]
  18. Kang, I.; Yeo, Y.; Kim, J.H.; Won, J.; Gollapudi, R.; Subramaniam, S.; Narasimhadevara, S.; Hurd, D.; Boerio, J.; Mall, S.; et al. Introduction to carbon nanotube and nanofiber smart materials. Compos. Part B Eng. 2006, 37, 382–394. [Google Scholar] [CrossRef]
  19. Barone, P.W. Near-infrared optical sensors based on single-walled carbon nanotubes. Nat. Mater. 2005, 4, 86–92. [Google Scholar] [CrossRef]
  20. Sobhan, A.; Muthukumarappan, K.; Wei, L.; Van Den Top, T.; Zhou, R. Development of an activated carbon-based nanocomposite film with antibacterial property for smart food packaging. Mater. Today Commun. 2020, 23, 101124. [Google Scholar] [CrossRef]
  21. Heller, I.; Janssens, A.M.; Ma, J.; Minot, E.D.; Lemay, S.G.; Dekker, C. Identifying the mechanism of biosensing with carbon nanotube transistors. Nano Lett. 2008, 8, 591–595. [Google Scholar] [CrossRef] [PubMed]
  22. Maroto, A.; Balasubramanian, K. functionalized metallic carbon nanotube devices for pH sensing. Chem. Phys. Chem. 2007, 8, 220–223. [Google Scholar] [CrossRef]
  23. HocineL, L.; Pitre, M. Quantitative and qualitative optimization of allergen extraction from peanut and selected tree nuts. Part 2. Optimization of buffer and ionic strength using a full factorial experimental design. Food Chem. 2016, 194, 820–827. [Google Scholar]
  24. Jayasena, S.; Smits, M.; de Jong, A.; Nordlee, J.; Baumert, J.; Taylor, S.L.; Pieters, R.H.; Koppelman, S.J. Comparison of six commercial ELISA kits for their specificity and sensitivity in detecting different major peanut allergens. J. Agric. Food Chem. 2015, 63, 1849–1855. [Google Scholar] [CrossRef]
  25. Sobhan, A.; Oh, J.-H.; Park, M.-K.; Kim, S.W.; Park, C.; Lee, J. Single walled carbon nanotube based biosensor for detection of peanut allergy-inducing protein Ara h1. J. Korean J. Chem. Eng. 2018, 34, 172–178. [Google Scholar] [CrossRef]
  26. Pomés, A.; Vinton, R.; Chapman, M.D. Peanut allergen (Ara h 1) detection in foods containing chocolate. J. Food Prot. 2004, 67, 793–798. [Google Scholar] [CrossRef]
  27. Hurst, W.J.; Krout, E.R.; Burks, W.R. A comparison of commercially available peanut ELISA test kits on the analysis of samples of dark and milk chocolate. Immunoass. Immunochem. 2002, 23, 451–459. [Google Scholar] [CrossRef]
  28. Pal, S.; Ying, W.; Alocilja, E.C.; Downes, F.P. Sensitivity and specificity performance of a direct-charge transfer biosensor for detecting Bacillus cereus in selected food matrices. Biosyst. Eng. 2008, 99, 461–468. [Google Scholar] [CrossRef]
  29. Jin, M.; Lang, J.; Shen, Z.Q.; Chen, Z.L.; Qiu, Z.G.; Wang, X.W.; Li, J.W. A rapid subtractive immunization method to prepare discriminatory monoclonal antibodies for food E. coli O157:H7 contamination. PLoS ONE 2012, 7, e31352. [Google Scholar] [CrossRef] [Green Version]
  30. Alves, R.C.; Pimentel, F.B.; Nouws, H.P.A.; Correr, W.; González-García, M.B.; Oliveira, M.B.P.P.; Delerue-Matos, C. Detection of the peanut allergen Ara h 6 in foodstuffs using a voltammetric biosensing approach. Anal. Bioanal. Chem. 2015, 407, 7157–7163. [Google Scholar] [CrossRef]
  31. Maier, I.; Morgan, M.R.A.; Lindner, W.; Pittner, F. Optical resonance-enhanced absorption-based near-field immunochip biosensor for allergen detection. Anal. Chem. 2008, 80, 2694–2703. [Google Scholar] [CrossRef]
  32. Lu, Y.; Ohshima, T.; Ushio, H. Rapid Detection of fish major allergen parvalbumin by surface plasmon resonance biosensor. J. Food Sci. 2004, 69, C652–C658. [Google Scholar] [CrossRef]
  33. Pollet, J.; Delport, F.; Janssen, K.P.F.; Tran, D.T.; Wouters, J.; Verbiest, T. Fast and accurate peanut allergen detection with nanobead enhanced optical fiber SPR biosensor. J. Lammertyn Talanta 2011, 83, 1436–1441. [Google Scholar] [CrossRef] [PubMed]
  34. Wang, W.; Han, J.; Wu, Y.; Yuan, F.; Chen, Y.; Ge, Y. Simultaneous detection of eight food allergens using optical thin-film biosensor chips. J. Agric. Food Chem. 2011, 59, 6889–6894. [Google Scholar] [CrossRef]
Figure 1. Schematic diagram (A) of pretreatment process of peanut butter foods using the buffer extraction method and the display (B) of the manufacture of the single-walled biosensor device for Ara h1 detection and set up for biosensor measurement using a potentiostat. SWCNT: Single-walled carbon nanotube; PBASE: 1-pyrenebutanoic acid, succinimidyl ester.
Processes 08 01420 g001
Figure 2. (A) Inhibition of Ara h1-binding with anti-Ara h1 pAbs determined by the SWCNT-based biosensor. (B) Inhibition of Ara h1-binding with anti-Ara h1 pAbs determined by indirect ELISA. Results are presented as the average ± standard deviation (n = 3); PBS indicates phosphate buffered saline.
Processes 08 01420 g002
Figure 3. Effect of extraction time and temperature: (A) 60 °C for 15 min, 60 °C for 60 min; and (B) 21 °C for 15 min, 21 °C for 60 min for Ara h1 recovery from peanut butter food extract. B denotes only Tris-HNO3 buffer (pH 8.4); 0.1 S denotes 0.1 M NaCl; 1 S denotes 1 M NaCl; 1 M denotes 1 g of skim milk powder; 2 M denotes 2 g of skim milk powder.
Processes 08 01420 g003
Figure 4. Effect of extraction time and temperature: (A) 21 °C for 60 min, 60 °C for 60 min; (B) 21 °C for 15 min, 60 °C/15 min for Ara h1 recovery from peanut butter food extract. B denotes only Tris-HNO3 buffer (pH 8.4); 0.1 S denotes 0.1 M NaCl; 1 S denotes 1 M NaCl; 1 M denotes 1 g of skim milk powder; 2 M denotes 2 g of skim milk powder.
Processes 08 01420 g004
Table 1. Effect of temperature (60 °C) and time (15 min, 60 min) on Ara h 1 extraction from commercial peanut butter food sample according to the extraction condition used.
Extract No.Extraction Condition (60 °C, 15 min)Ara h1 Concentration (ng/mL Sample)CV (%)Extraction Condition
(60 °C, 60 min)
Ara h1 Concentration (ng/mL Sample)CV (%)
1PBSNANAPBSNANA
2B14.62 ± 1.308.81B7.30 ± 1.4620.08
3B/0.1S21.95 ± 3.3515.28B/0.1S12.35 ± 0.987.94
4B/1S27.74 ± 1.334.81B/1S19.15 ± 3.6118.88
5B/1M9.03 ± 1.8019.97B/1S5.68 ± 1.6529.21
6B/2M3.22 ± 0.4019.97B/2M3.17 ± 2.1066.23
7B/0.1S/1M2.61 ± 0.1112.47B/0.1S/1M15.67 ± 2.2314.26
8B/0.1S/2M2.35 ± 1.814.37B/0.1S/2M15.53 ± 0.795.08
9B/1S/1M21.67 ± 1.2376.85B/1S/1M11.56 ± 1.1810.25
10B/1S/2M5.06 ± 1.1622.92B/1S/2M2.45 ± 0.239.38
B: denotes only Tris-HNO3 buffer (pH 8.4); 0.1S: denotes 0.1 M NaCl; 1S: denotes 1 M NaCl; 1M: denotes 1 g of skim milk powder; 2M: denotes 2 g of skim milk powder; NA: denotes not applicable and CV: denotes coefficient of variation (%).
Table 2. Effect of temperature (21 °C) and time (15 min, 60 min) on Ara h 1 extraction from commercial peanut butter food sample according to the extraction condition used.
Extract No.Extraction Condition (21 °C, 15 min)Ara h1 Concentration (ng/mL Sample)CV (%)Extraction Condition (21 °C, 60 min)Ara h1 Concentration (ng/mL Sample)CV (%)
1PBSNANAPBSNANA
2B16.28 ± 0.429.05B62.74 ± 5.638.98
3B/0.1S29.29 ± 2.652.58B/0.1S49.81 ± 5.6311.29
4B/1S29.59 ± 2.578.69B/1S58.18 ± 7.0512.11
5B/1M7.23 ± 4.9368.19B/1M84.60 ± 7.508.86
6B/2M2.37 ± 0.1129.73B/2M76.12 ± 1.852.43
7B/0.1S/1M3.19 ± 3.0595.61B/0.1S/1M77.50 ± 10.8113.95
8B/0.1S/2M3.18 ± 0.032.54B/0.1S/2M73.77 ± 7.9810.83
9B/1S/1M19.45 ± 0.211.07B/1S/1M25.94 ± 1.385.32
10B/1S/2M2.31 ± 0.125.19B/1S/2M22.85 ± 3.0913.50
B: denotes only Tris-HNO3 buffer (pH 8.4); 0.1S: denotes 0.1 M NaCl; 1S: denotes 1 M NaCl; 1M: denotes 1 g of skim milk powder; 2M: denotes 2 g of skim milk powder; NA: denotes not applicable and CV: denotes coefficient of variation (%).
Publisher’s Note: MDPI stays neutral with regard to jurisdictional claims in published maps and institutional affiliations.

