Article

Improved Sugar Recovery from Orange Peel by Statistical Optimization of Thermo-Alkaline Pretreatment

Department of Biotechnology, Sangmyung University, 20, Hongjimun, 2-Gil, Jongno-Gu, Seoul 03016, Korea
*
Author to whom correspondence should be addressed.
These authors contributed equally to this work.
Processes 2021, 9(3), 409; https://doi.org/10.3390/pr9030409
Submission received: 30 January 2021 / Revised: 18 February 2021 / Accepted: 20 February 2021 / Published: 25 February 2021
(This article belongs to the Special Issue Bioprocess Design and Optimization)

Abstract

:
Orange peel, which is a by-product of oranges, contains carbohydrates that can be converted into sugars and used in the fermentation process. In this study, the thermal alkaline pretreatment process was chosen because of its simplicity and lesser reaction time. In addition, the reaction factors were optimized using response surface methodology. The determined optimal conditions were as follows: 60.1 g/L orange peels loading, 3% KOH and 30 min. Under the optimal conditions, glucan content (GC) and enzymatic digestibility (ED) were found to be 32.8% and 87.8%, respectively. Enzymatic hydrolysis was performed with pretreated and non-pretreated orange peels using three types of enzyme complex (cellulase, cellobiase and xylanase). The minimum concentrations of enzyme complex required to obtain maximum ED were 30 FPU (filter paper unit), 15 CBU (cellobiase unit), and 30 XNU (xylanase unit) based on 1 g-biomass. Additionally, ED of the treated group was approximately 3.7-fold higher than that of the control group. In conclusion, the use of orange peel as a feedstock for biorefinery can be a strategic solution to reduce wastage of resources and produce sustainable bioproducts.

1. Introduction

Rising global population is leading to increasing food production and consumption, eventually leading to growing food wastage [1,2,3]. These food wastes affect public health as well as the environment because they are disposed of by landfilling or incineration [4,5]. Sustainable development has been remarked to deal with environmental concerns and economic growth in the long term [6,7,8]. To this end, a biorefinery system has received considerable attention, as it is a continuous eco-friendly process that uses renewable biomass, such as food waste and microalgae [9,10]. As food waste is a sugar-rich biomass, the biorefinery system focuses on the utilization of water-soluble carbohydrates that are abundant in food wastes [11,12,13,14]. A biorefinery uses carbohydrates from biomass to produce value-added materials through microbial fermentation, but these carbon sources act as a high-cost factor in the fermentation process [15]. Therefore, in order to scale-up the process, carbon sources need to be replaced with inexpensive biomass.
According to the Food and Agriculture Organization (FAO), annual food waste, which have the potential to be next-generation biomass, was estimated at about 1.3 billion tons [16]. In addition, 40–50% of food wastes consist of fruit and vegetable waste [17]. Worldwide, orange is one of the most cultivated fruits. In 2018, approximately 75 million tons of oranges were produced globally; moreover, 50–60% (w/w) of these oranges consisted of residues (peels, seeds, and membrane parts), which were generated after processing [18,19].
Orange peels consist of cellulose, hemicellulose, and pectin [20,21]. Various pretreatment processes, such as physical, chemical, biological pretreatment, have been applied to increase the enzyme accessibility and to increase the conversion of carbohydrate to sugar from biomass [9,22]. Chemical pretreatments (acid and alkaline) are commonly used to improve enzyme accessibility [23]. Although acid pretreatment is an appropriate method to solubilize carbohydrates, it leads to the loss of solubilized carbohydrates, which reduces commercial feasibility [24,25]. In addition, acid can corrode equipment, leading to considerable cost [26]. Thus, it is not ideal for a scale-up process. Alkaline pretreatment increases the accessibility of enzyme to cellulose and hemicellulose [9]. However, they have a long reaction time. For industrial application, a combination of thermal pretreatment process is important to shorten the reaction time [27]. It has been reported that the simultaneous use of diverse pretreatments is effective to increase the degradability of biomass [23,28].
Pretreatment, which accounts for ~35% of the total production cost, is an important step in order to utilize the carbohydrates in biomass [29,30]. To design an economical process, it is required to use the statistical method such as response surface methodology (RSM) [31]. RSM provides an alternative methodology by considering the reciprocal connection between variables based on the experimental responses and provides an estimate of the integrated effect of these variables [32].
Enzymes are required to hydrolyze carbohydrates, such as cellulose and hemicellulose, into monosaccharides [33]. In particular, in an orange peel, cellulase hydrolyzes β-1,4-glycosidic bonds into cellulose and cellobiase hydrolyzes cellobiose or oligosaccharides from the non-reducing ends to glucose [34]. Xylanase is used for hydrolysis of xylan, which is a xylose biopolymer [35]. Optimized reaction conditions and enzyme loading were needed to investigate efficient enzyme hydrolysis [36].
In this study, orange peel underwent thermo-alkaline pretreatment to improve sugar production. The reaction conditions for KOH pretreatment of biomass were statistically optimized using the RSM. In addition, profiling of enzymatic hydrolysis was investigated to determine the efficiency of enzyme loading and reaction time. Finally, the overall process of sugar conversion from biomass was evaluated using a material balance based on 1000 g of orange peel.

2. Materials and Methods

2.1. Materials

Oranges were purchased from Sandlejeoung (Andong, Korea). Celluclast® 1.5L and C-tec 2 were purchased from Novozymes (Krogshoejvej, Bagsværd, Denmark). Xylanase (xylanase from Trichoderma viride) was purchased from Honeywell Fluka (Morris Plains, NJ, USA). Potassium hydroxide (KOH), sulfuric acid (H2SO4), and calcium carbonate (CaCO3) were purchased from Samchun Chemical (Kangnam-Gu, Seoul, South Korea). Citric acid trihydrate was purchased from Junsei (Chuo-ku, Tokyo, Japan).

2.2. Raw Material and Alkaline Pretreatment

The orange peel was air-dried at 105 °C in an oven for 12 h. For the pretreatment, it was ground to 90–100 µm size and autoclaved at 121 °C using KOH. After the pretreatment, the pretreated orange peel was neutralized using de-ionized water (DW) and then dried in an oven at 105 °C for 12 h.

2.3. Design of Experiment by Response Surface Methodology (RSM)

Central composite design (CCD) of RSM was carried out to optimize the significant variables affecting alkaline pretreatment (X1: time, X2: KOH concentration, and X3: solid loading). CCD demonstrates a mathematical model of the interaction of independent variables on alkaline pretreatment for enzymatic hydrolysis. Table 1 shows the variables and their different levels in order to optimize the alkaline pretreatment of orange peel as follows: reaction time (X1); 0–40 min, KOH concentration (X2); 0–4%, and solid loading (X3); 40–120 g/L.
The experimental results were analyzed using analysis of variance (ANOVA). Each variable and their interactions are described by applying the following quadratic equation:
Y = β0 + ΣβiXi + ΣβijXiXj + ΣβijXi2
where Y is the predicted response, Xi and Xj are input variables that influence the response variable Y, β0 is the offset term, βi is the ith linear coefficient, βii is the quadratic coefficient and βij is ijth interaction coefficient [9,37].

2.4. Optimization of Enzymatic Hydrolysis

The enzyme cocktail was composed of 60 FPU/g-biomass cellulase, 30 CBU/g-biomass cellobiase, and 60 XNU/g-biomass xylanase. One-unit filter paper (FPU) and cellobiase (CBU) activity was defined as the amount of enzyme that releases 1 μmol glucose per minute under standard assay conditions. One-unit xylanase (XNU) activity was defined as the amount of enzyme that releases 1 μmol xylose per minute under standard assay conditions. The activities of Celluclast® 1.5L, C-tec 2 and xylanase were determined to be 120 FPU/mL, 200 CBU/mL and 3.56 XNU/mg, respectively. The enzymatic reaction was carried out in a 50 mL conical tube by shaking at 180 rpm at 50 °C up to the maximum yield. The enzymatic digestibility (ED) was calculated using the following equation:
Enzymatic digestibility (ED, %) = (weight of glucose/(weight of glucan × 1.1)) × 100
where 1.1 is the conversion factor of glucan to glucose.

2.5. Analytical Methods

After enzymatic hydrolysis, the concentration of monosaccharides (glucose, xylose, mannose, galactose, and arabinose) in the liquor phase was investigated through high-performance liquid chromatography (HPLC) equipped with a refractive index detector (RID-10A, Shimadzu, Japan). The temperature of the column and RID was 50 °C. Samples with a volume of 20 μL were injected into a Shodex SUGAR SH1101 column (300 mm × 8 mm, Shodex, Japan) and eluted with 0.005 N sulfuric acid at a flow rate of 0.6 mL/min.

3. Results and Discussion

3.1. Characterization of Orange Peel

The mass contents of the orange flesh and peel were 65.7% and 34.3% (w/w), respectively. This result was in agreement with a recent study by Mahato et al. [18]. The average moisture content of whole oranges was 64.0% (w/w). The chemical composition of dried orange peel was investigated using the National Renewable Energy Laboratory (NREL) Laboratory Analytical Procedure (LAP) procedure [38] and the results are shown in Table 2. An orange peel was composed of 25.0% cellulose (glucan), 17.0% hemicellulose (xylan: 11.3% and arabinan: 5.7%), and 58.0% (w/w) others. In another study, Senit et al. and Bustamante et al. calculated the composition of orange peel to be 18.9 ± 0.2% cellulose and 14.6 ± 0.2% hemicellulose, which was similar to our results [39,40]. As carbohydrates are correlated with fermentation, enzymatic hydrolysis was performed to separate monosaccharides for microbial growth using complex structures such as cellulose and hemicellulose [41,42]. Enzymatic hydrolysis using the non-pretreatment group resulted in approximately 25.0% glucan content (GC) and 36.0% ED. Thus, pretreatment was found to be necessary to obtain a high yield of enzymatic hydrolysis. In this study, the thermal–alkaline pretreatment was performed to reduce the reaction time and confirm the advantage of simultaneous pretreatments to improve the hydrolysis of biomass.

3.2. Optimization of Thermal–Alkaline Pretreatment by RSM

Thermal–alkaline pretreatment is suitable for the hydrolysis of biomass that has a cellulose and hemicellulose-linked structure. In this study, KOH was as an alkaline solvent because of its low cost and reduced environmental burden [43]. In order to obtain maximum glucose, the variables of the thermal–alkaline pretreatment were determined according to a previous study [44]. Furthermore, the experimental responses were investigated for GC and ED. Each response was calculated using orange peel hydrolysate.
Furthermore, the CCD of RSM was performed to investigate the correlation between the thermal–alkaline pretreatment and the three variables (X1: time, X2: KOH concentration and X3: solid loading) of five levels (time: 0, 10, 20, 30 and 40 min; KOH concentration: 0%, 1%, 2%, 3% and 4%; solid loading: 40, 60, 80, 100 and 120 g/L) [45]. A KOH concentration of 0% indicates pretreatment with DW and a reaction time of 0 min means a control group without thermal–alkaline pretreatment. Table 3 shows the 20 designed experiments and its response. The range of each experimental data was, as follows: GC: 24.8–33.2% and ED: 29.6–95.1%.
The effects of variables on GC and ED were investigated using three-dimensional (3D) response surfaces according to the established regression model (Figure 1 and Figure 2). Figure 1 indicates the effects of the variables on GC with the 3D response surfaces. The effects of time and KOH concentration on the GC is shown in Figure 1a. The minimum amount of GC at 0 min and 3% KOH was 24.8%. When the reaction time increased, the GC also increased regardless of the KOH concentration. Furthermore, when the reaction time was reduced, lower KOH concentration led to higher GC. Figure 1b confirms the effects of time and solid loading on the GC. The GC was the lowest at 80 g/L solid loading at 0 min; additionally, GC increased with time. The effect of KOH concentration and solid loading on GC is shown in Figure 1c. The lowest GC was obtained at 2.8% KOH concentration with 90 g/L of solid loading, and a higher GC with KOH concentration and a decrease in solid loading were observed.
Figure 2 shows the effects of variables on ED using the 3D response surfaces. The effect of time and KOH concentration on ED is shown in Figure 2a. ED tended to decrease with a decrease in KOH concentration and time. Additionally, ED was high, regardless of the KOH concentration. The effect of KOH concentration and solid loading on ED is shown in Figure 2b. The ED was similar, irrespective of the time and solid loading. According to the Figure 2c, KOH concentration and solid loading are affected by ED. In general, regardless of the KOH concentration and solid loading, it showed a similar level in the 3D response surface. In particular, ED increased with increasing KOH concentration and decreasing solid loading. In other words, the higher exposure of the biomass containing cellulose, the higher the ED [46].
The CCD results were expressed as the following second-order polynomial equation by applying a quadratic regression analysis of the experimental data.
YGC = 26.60 + 1.42X1 − 1.07X2 − 0.90X3 + 0.62X1X2 − 0.73X1X3 − 0.62X2X3 + 0.22X12 + 1.04X22 + 1.22X32
YED = 76.10 + 3.83 X1 + 19.58 X2 − 4.33 X3 − 3.63 X1X2 − 0.043 X1X3 + 0.77 X2X3 − 5.45 X12 − 3.09 X22 − 4.97 X32
where YGC is the GC (%) and YED is the ED (%) value. X1, X2 and X3 are the independent variables of time, KOH concentration and solid loading, respectively. The results of ANOVA for the response surface quadratic model are shown in Table 4 and Table 5.
The F-value is an indicator of the model’s significance [47]. The F-values of each model were 10.24 and 21.58, respectively. To verify the significance of the model terms, the p-value of the model should be less than 0.05 [48,49]. The p-values of each model were 0.0006 and <0.0001. In this experiment, both models were considered significant models. In GC, X1, X2, X3, X22 and X32 were significant model terms and in ED, X1, X2, X3, X12, X22 and X32 were significant model terms. The p-values of the lack-of-fit were 0.9071 and 0.0562, respectively, and each was not significant (p > 0.05) relative to the pure error. This shows that the quadratic model is statistically suitable for predicting responses [50]. The coefficients of variation (CV) were determined as 4.13% and 9.75% for each model. A CV lower than 10% indicates that the variation in the experimental value is within a reasonable range [51]. Meanwhile, the coefficient of determination (R2) can be adopted to explain the reliability of the model term; the adjusted R2 is altered by the degree of freedom [52,53]. When R2 is greater than 0.9, it indicates high reliability. Moreover, the differences between them should be lower than 0.2 [54]. In each model, R2 was 0.9021 and 0.9515, and the adjusted R2 was 0.8140 and 0.9078, respectively, and the differences between them were not higher than 0.2. Finally, adequate precision refers to the signal-to-noise ratio which is a measure of the effectiveness of the model [47]. In this case, each model can be determined as a good model with 10.355 and 17.393 of adequate precision, respectively.
The optimized conditions for the thermal–alkaline pretreatment of orange peel were designed within the experimental range of GC and ED and were determined using the regression model Equations (3)–(4) (Table 6). The optimal conditions for the thermal–alkaline pretreatment were reported as X1: 30 min, X2: 3% and X3: 60.1 g/L; the predicted responses of the GC and ED were 32.3% and 86.0%, respectively. Thermal–alkaline pretreatment was performed under the optimal conditions to verify the model and the GC and ED were 32.8% and 87.8%, respectively. The verification of this model had a high level of accuracy (>98%). This indicates that the regression models can be used to optimize the orange peel pretreatment.

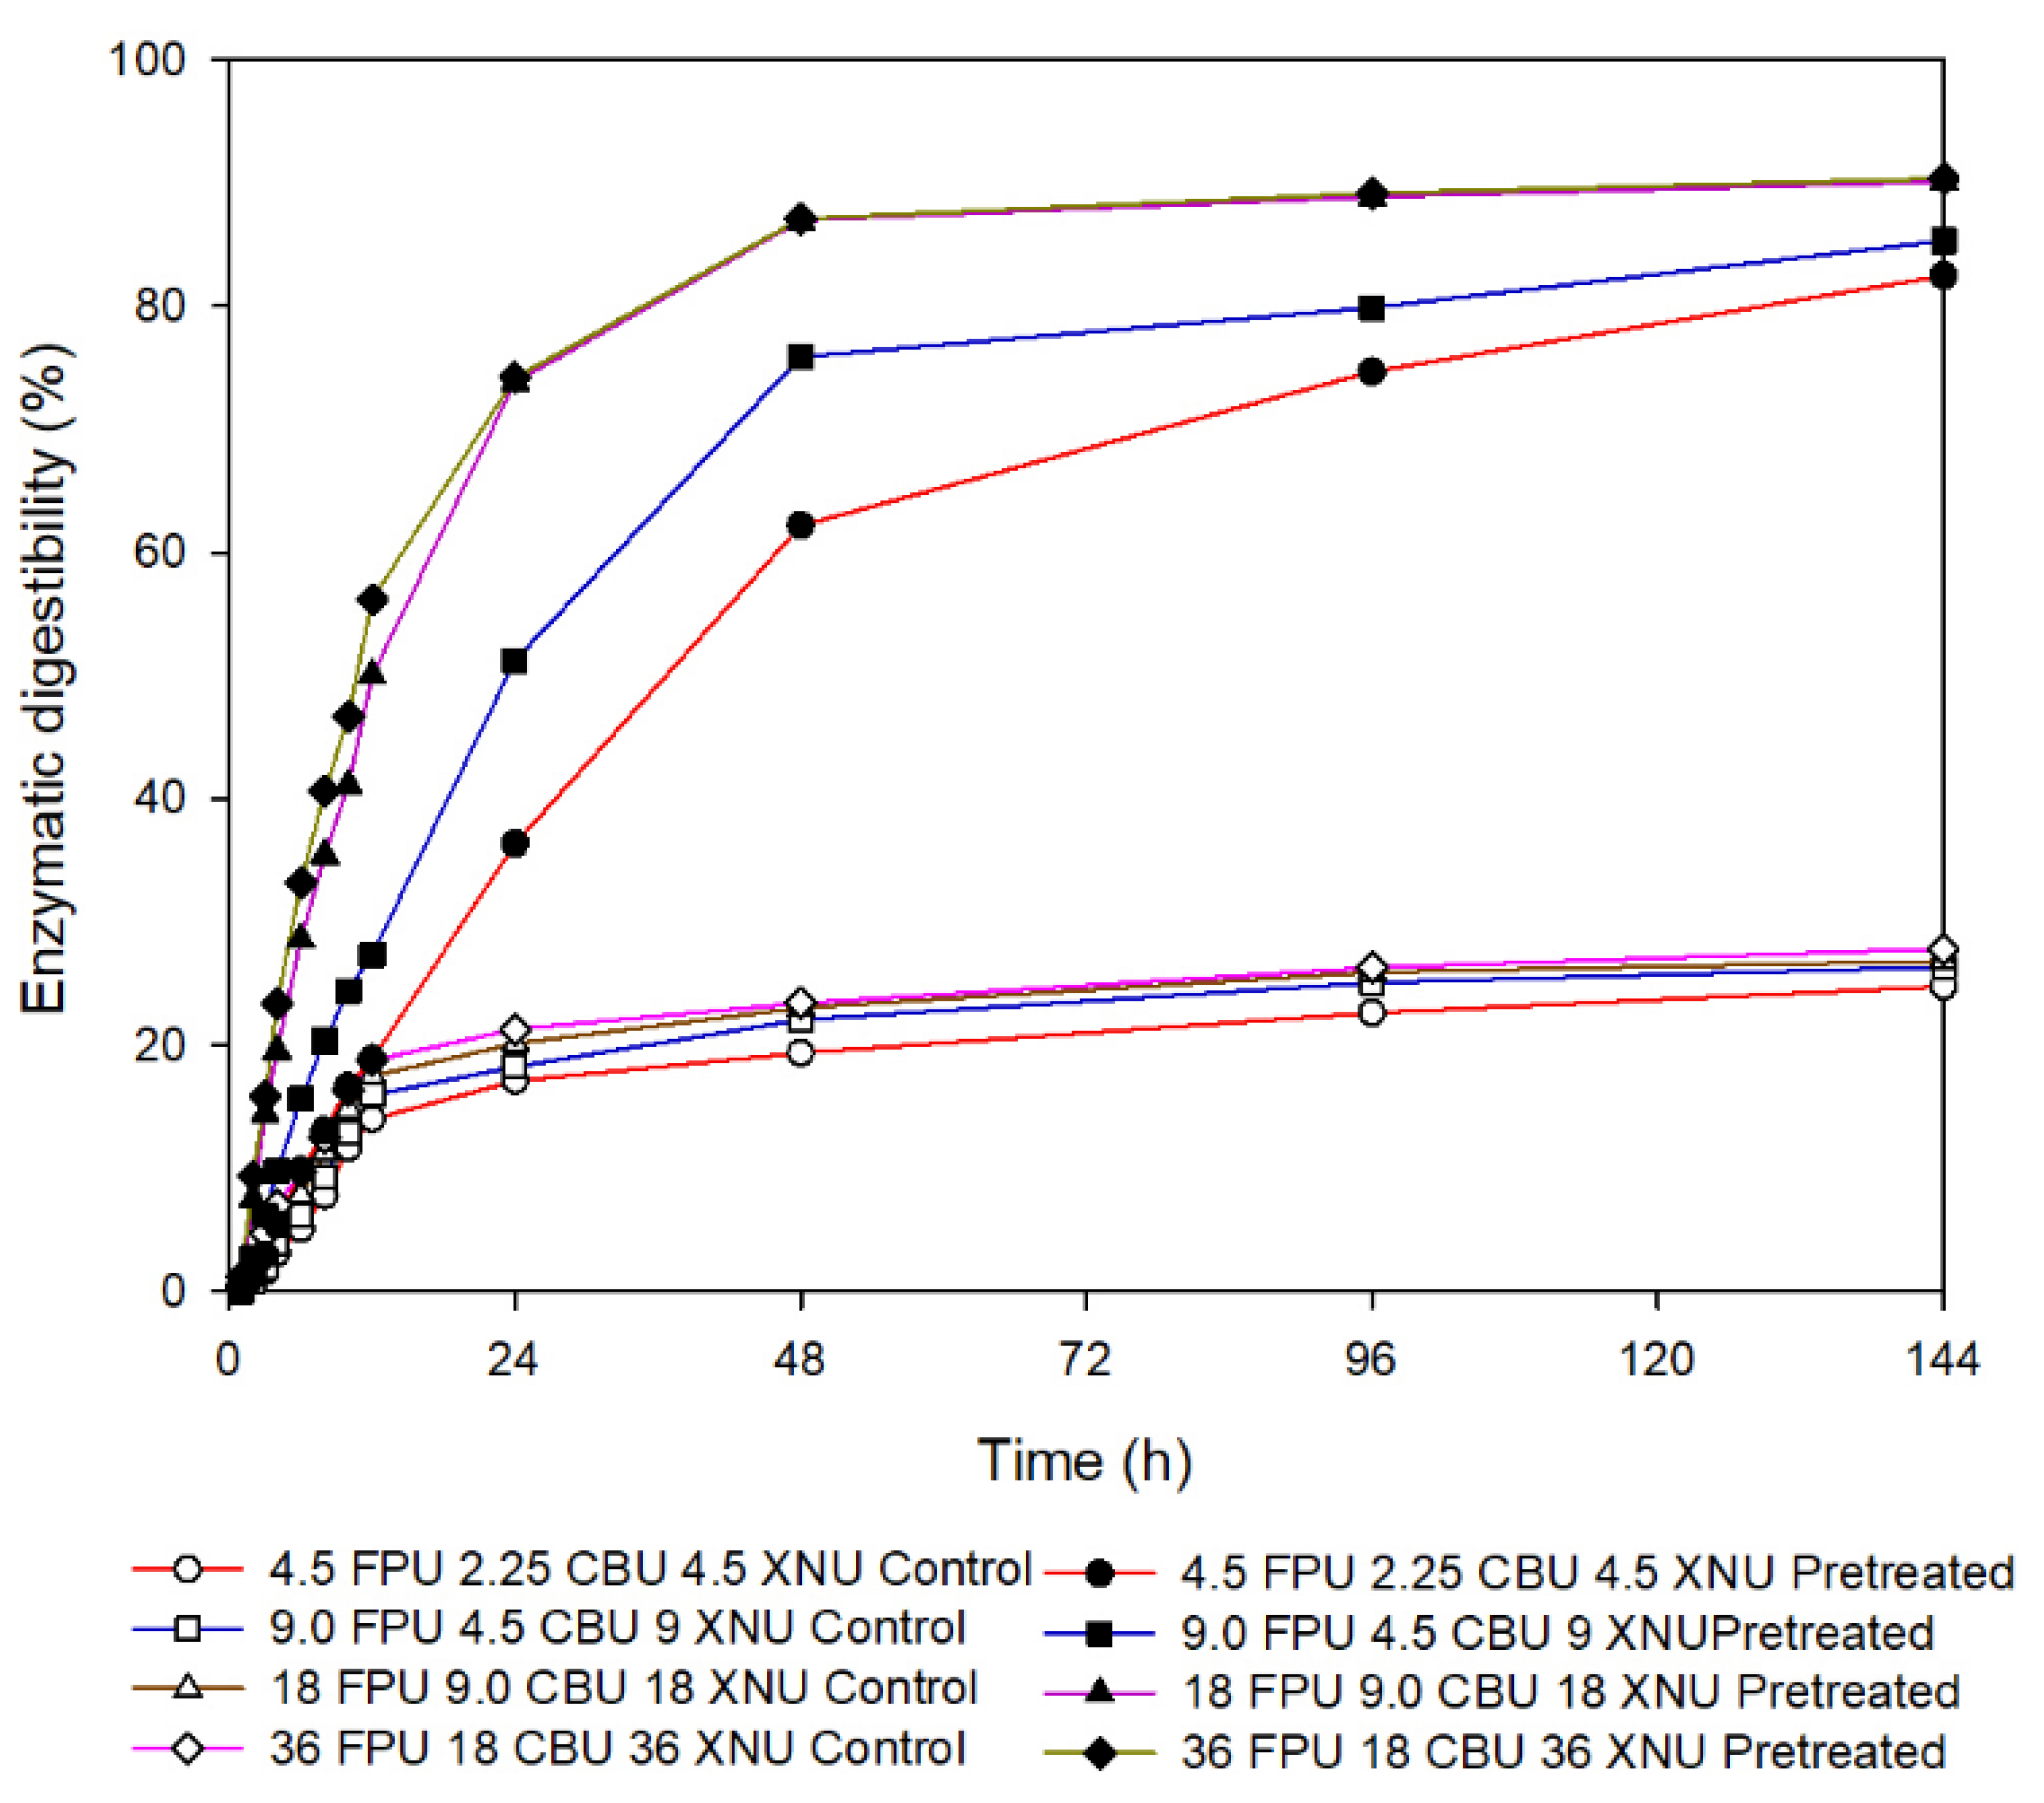
3.3. Selection of Enzyme Concentration

In the fermentation process, carbon sources from organic wastes are preferred over chemical substrates (pure glucose) due to their lower costs [5,6,7,8,14]. In this study, optimal conditions for the enzymatic hydrolysis of biomass, which can be used as a carbon source, were investigated to hydrolyze the substrates in high yields. To determine the effects of thermal–alkaline pretreatment on orange peel, pretreated (experimental group) and non-pretreated (control group) were used for enzymatic hydrolysis. Three types of enzyme (cellulase, cellobiase and xylanase) were combined, and 60 FPU, 30 CBU, and 60 XNU based on g-biomass as 100%. To suggest an economic and scalable approach, the enzyme cocktail was prepared at different concentration, namely 50%, 25% and 12.5%; moreover, various loadings on enzymatic digestibility were analyzed. Consequently, both the experimental and control groups showed that ED increased proportionally with increasing enzyme concentrations (Figure 3). The thermal–alkaline pretreatment led to a maximum ED approximately 86.99%, which was 3.7-fold higher than the control group. Additionally, the concentrations of enzyme cocktails were at 50% and 100% for 48 h. When the enzyme concentrations were 12.5% and 25%, ED in the treatment group was 3.2-fold higher than the control group by approximately 62.2% and 75.9%, respectively. As a result, keeping cost and time under consideration, an appropriate enzymatic hydrolysis process was found that was above 48 h of reaction time and 50% concentration of enzyme cocktails. This demonstrates that the ED of orange peel increases after the thermal–alkaline pretreatment.

3.4. Summary of Pretreatment of Orange Peel

Numerous studies have focused on the effect of pretreatment on improved sugar content (especially glucose) by enzymatic hydrolysis [55,56,57,58,59,60]. Orange peels are rich in carbohydrate, which can serve as substrates in the fermentation process. Pretreatment is required to increase the accessibility of enzymes for the degradation of carbohydrates into the monosaccharides. Table 7 summarizes the various pretreatment types and enzymatic hydrolysis and compares the glucose content before and after pretreatment. Among these, popping pretreatment and steam explosion have been shown to be effective methods for high glucose yield after enzymatic hydrolysis. They can easily break the sugar complex in biomass. However, they are not appropriate for a scale-up process due to high capital cost and pressure [61,62]. Diluted acid pretreatment helps in easy sugar conversion and it reduces the damage to equipment by corrosion; however, it has a longer reaction time [63]. Other pretreatments, such as the Soxhlet and Soxhlet-liquid (two-stage) pretreatment, are time-consuming, which could be a bottleneck. Santi et al. investigated two types of pretreatment and observed that both led to low glucose content from pretreated biomass [60]. However, in this study, 1000 g of pretreated orange peel led to the recovery of approximately 316.7 g glucose after the enzymatic hydrolysis. Unlike other pretreatments, this is advantageous because of its high yields and appropriate time. Therefore, this study provides evidence of the possibility of thermal–alkaline pretreatment of orange peel for a biorefinery system.

4. Conclusions

Orange peel, which has high potential to be a biomass feedstock in the fermentation process, needs to be pretreated to improve sugar recovery. Thermal–alkaline pretreatment was performed to improve the enzyme accessibility. The effects of the pretreatment were investigated based on two responses, GC and ED, to obtain a significant model. Optimal conditions were determined (3% KOH with solid loading of 60.1 g/L for 30 min) using a statistical method for an economical and scalable approach. In the thermal–alkaline pretreatment, GC and ED were found to be 32.8% and 87.8%, respectively. After the pretreatment, the solid fraction was used for enzymatic hydrolysis. In addition, enzyme cocktails were prepared in various concentrations to suggest an economical enzyme loading. As a result, ED was achieved at about 87% using 50% of the enzyme cocktail (30 FPU, 15 CBU, and 30 XNU based on g-biomass) for 48 h. In particular, ED of the treatment group was approximately 3.7-fold higher than the control group (non-pretreatment). Therefore, this study could offer a new scalable approach to move closer toward sustainable development.

Author Contributions

Conceptualization, Y.W.J. and K.H.L.; methodology, Y.W.J. and K.H.L.; software, Y.W.J. and K.H.L.; validation, Y.W.J., K.H.L. and H.Y.Y.; writing—original draft preparation, Y.W.J. and K.H.L.; writing—review and editing, H.Y.Y.; supervision, H.Y.Y.; project administration, H.Y.Y. All authors have read and agreed to the published version of the manuscript.

Funding

This research was supported by a 2018 Research Grant from Sangmyung University.

Institutional Review Board Statement

Not applicable.

Informed Consent Statement

Not applicable.

Data Availability Statement

The data presented in this study are available on request from the corresponding author.

Conflicts of Interest

The authors declare no conflict of interest.

References

  1. Grasso, A.C.; Olthof, M.R.; Boevé, A.J.; van Dooren, C.; Lähteenmäki, L.; Brouwer, I.A. Socio-Demographic Predictors of Food Waste Behavior in Denmark and Spain. Sustainability 2019, 11, 3244. [Google Scholar] [CrossRef] [Green Version]
  2. Park, S.H.; Kim, J.C. Monoolein Cubosomes for Enhancement of in vitro Anti-oxidative Efficacy of Bambusae Caulis in Taeniam Extract Toward Carcinogenic Fine Dust-stimulated RAW 264.7 cells. Korean J. Chem. Eng. 2019, 36, 1466–1473. [Google Scholar] [CrossRef]
  3. Seo, H.S.; Park, B.H. Phenolic Compound Extraction from Spent Coffee Grounds for Antioxidant Recovery. Korean J. Chem. Eng. 2020, 36, 186–190. [Google Scholar] [CrossRef]
  4. Pellera, F.-M.; Pasparakis, E.; Gidarakos, E. Consecutive Anaerobic-Aerobic Treatment of the Organic Fraction of Municipal Solid Waste and Lignocellulosic Materials in Laboratory-Scale Landfill-Bioreactors. Waste Manag. 2016, 56, 181–189. [Google Scholar] [CrossRef] [PubMed]
  5. Morales-Polo, C.; Cledera-Castro, M.D.M.; Moratilla Soria, B.Y. Reviewing the Anaerobic Digestion of Food Waste: From Waste Generation and Anaerobic Process to Its Perspectives. Appl. Sci. 2018, 8, 1804. [Google Scholar] [CrossRef] [Green Version]
  6. Ul-Islam, M.; Ullah, M.W.; Khan, S.; Park, J.K. Production of Bacterial Cellulose from Alternative Cheap and Waste Resources: A Step for Cost Reduction with Positive Environmental Aspects. Korean J. Chem. Eng. 2020, 37, 925–937. [Google Scholar] [CrossRef]
  7. Helalat, S.H.; Bidaj, S.; Samani, S.; Moradi, M. Producing Alcohol and Salt Stress Tolerant Strain of Saccharomyces cerevisiae by Heterologous Expression of pprI Gene. Enzyme Microb. Technol. 2019, 124, 17–22. [Google Scholar] [CrossRef] [PubMed]
  8. Santika, W.G.; Anisuzzaman, M.; Bahri, P.A.; Shafiullah, G.M.; Rupf, G.V.; Urmee, T. From Goals to Joules: A Quantitative Approach of Interlinkages Between Energy and the Sustainable Development Goals. Energy Res. Soc. Sci. 2019, 50, 201–214. [Google Scholar] [CrossRef]
  9. Yoo, H.Y.; Lee, J.H.; Kim, D.S.; Lee, J.H.; Lee, S.K.; Lee, S.J.; Park, C.; Kim, S.W. Enhancement of Glucose Yield from Canola Agricultural Residue by Alkali Pretreatment Based on Multi-Regression Models. J. Ind. Eng. Chem. 2017, 51, 303–311. [Google Scholar] [CrossRef]
  10. Arancon, R.A.D.; Lin, C.S.K.; Chan, K.M.; Kwan, T.H.; Luque, R. Advances on Waste Valorization: New Horizons for a More Sustainable Society. Energy Sci. Eng. 2013, 1, 53–71. [Google Scholar] [CrossRef]
  11. Jeya, M.; Zhang, Y.-W.; Kim, I.-W.; Lee, J.-K. Enhanced Saccharification of Alkali-Treated Rice Straw by Cellulase from Trametes hirsuta and Statistical Optimization of Hydrolysis Conditions by RSM. Bioresour. Technol. 2009, 100, 5155–5161. [Google Scholar] [CrossRef] [PubMed]
  12. Sathesh-Prabu, C.; Shin, K.S.; Kwak, G.H.; Jung, S.-K.; Lee, S.K. Microbial Production of Fatty Acid via Metabolic Engineering and Synthetic Biology. Biotechnol. Bioprocess. Eng. 2019, 24, 23–40. [Google Scholar] [CrossRef]
  13. Banerjee, S.; Mishra, G.; Roy, A. Metabolic engineering of bacteria for renewable bioethanol production from cellulosic biomass. Biotechnol. Bioprocess. Eng. 2019, 24, 713–733. [Google Scholar] [CrossRef]
  14. Kim, S.Y.; Yang, Y.-H.; Choi, K.-Y. Bioconversion of plant hydrolysate biomass into biofuels using an engineered Bacillus subtilis and Escherichia coli mixed-whole cell biotransformation. Biotechnol. Bioprocess. Eng. 2020, 25, 477–484. [Google Scholar] [CrossRef]
  15. Rhie, M.N.; Kim, H.T.; Jo, S.Y.; Chu, L.L.; Baritugo, K.; Baylon, M.G.; Lee, J.; Na, J.; Kim, L.H.; Kim, T.W.; et al. Recent advances in the Metabolic Engineering of Klebsiella pneumoniae: A Potential Platform Microorganism for Biorefineries. Biotechnol. Bioprocess. Eng. 2019, 24, 48–64. [Google Scholar] [CrossRef]
  16. Newsome, T.M.; Van Eeden, L.M. The Effects of Food Waste on Wildlife and Humans. Sustainability 2017, 9, 1269. [Google Scholar] [CrossRef] [Green Version]
  17. Gupta, N.; Poddar, K.; Sarkar, D.; Kumari, N.; Padhan, B.; Sarkar, A. Fruit Waste Management by Pigment Production and Utilization of Residual as Bioadsorbent. J. Environ. Manag. 2019, 244, 138–143. [Google Scholar] [CrossRef]
  18. Mahato, N.; Sinha, M.; Sharma, K.; Koteswararao, R.; Cho, M.H. Modern Extraction and Purification Techniques for Obtaining High Purity Food-Grade Bioactive Compounds and Value-Added Co-Products from Citrus Wastes. Foods 2019, 8, 523. [Google Scholar] [CrossRef] [PubMed] [Green Version]
  19. FAOSTAT Database Results. 2018. Available online: http://www.fao.org/faostat/ (accessed on 18 August 2020).
  20. Zhou, Y.-M.; Chen, Y.-P.; Guo, J.-S.; Shen, Y.; Yan, P.; Yang, J.-X. Recycling of Orange Waste for Single Cell Protein Production and the Synergistic and Antagonistic Effects on Production Quality. J. Clean Prod. 2019, 213, 384–392. [Google Scholar] [CrossRef]
  21. Goshadrou, A. Bioethanol Production from Cogongrass by Sequential Recycling of Black Liquor and Wastewater in a Mild-Alkali Pretreatment. Fuel 2019, 258, 116141. [Google Scholar] [CrossRef]
  22. Abubackar, H.N.; Keskin, T.; Arslan, K.; Vural, C.; Aksu, D.; Yavuzyılmaz, D.K.; Ozdemir, G.; Azbar, N. Effects of Size and Autoclavation of Fruit and Vegetable Wastes on Biohydrogen Production by Dark Dry Anaerobic Fermentation under Mesophilic Condition. Int. J. Hydrog. Energy 2019, 44, 17767–17780. [Google Scholar] [CrossRef]
  23. Yuan, Z.; Wei, W.; Wen, Y.; Wang, R. Comparison of Alkaline and Acid-Catalyzed Steam Pretreatments for Ethanol Production from Tobacco Stalk. Ind. Crop. Prod. 2019, 142, 111864. [Google Scholar] [CrossRef]
  24. Parthiba Karthikeyan, O.; Trably, E.; Mehariya, S.; Bernet, N.; Wong, J.W.C.; Carrere, H. Pretreatment of Food Waste for Methane and Hydrogen Recovery: A Review. Bioresour. Technol. 2018, 249, 1025–1039. [Google Scholar] [CrossRef] [PubMed] [Green Version]
  25. Saha, S.; Kurade, M.B.; El-Dalatony, M.M.; Chatterjee, P.K.; Lee, D.S.; Jeon, B.-H. Improving Bioavailability of Fruit Wastes using Organic Acid: An Exploratory Study of Biomass Pretreatment for Fermentation. Energy Convers. Manag. 2016, 127, 256–264. [Google Scholar] [CrossRef]
  26. Keskin, T.; Abubackar, H.N.; Arslan, K.; Azbar, N. Chapter 12—Biohydrogen Production from Solid Wastes, Biohydrogen. In Biomass, Biofuels, Biochemicals: Biohydrogen, 2nd ed.; Elsevier: Amsterdam, The Netherlands, 2019; pp. 321–346. [Google Scholar]
  27. Kamalini, A.; Muthusamy, S.; Ramapriya, R.; Muthusamy, B.; Pugazhendhi, A. Optimization of Sugar Recovery Efficiency using Microwave Assisted Alkaline Pretreatment of Cassava Stem using Response Surface Methodology and its Structural Characterization. J. Mol. Liq. 2018, 54, 55–63. [Google Scholar] [CrossRef]
  28. Tsang, Y.F.; Kumar, V.; Samadar, P.; Yang, Y.; Lee, J.; Ok, Y.S.; Song, H.; Kim, K.H.; Kwon, E.E.; Jeon, Y.J. Production of Bioplastic through Food Waste Valorization. Environ. Int. 2019, 127, 625–644. [Google Scholar] [CrossRef]
  29. Alamanou, D.G.; Malamis, D.; Mamma, D.; Kekos, D. Bioethanol from Dried Household Food Waste Applying Non-Isothermal Simultaneous Saccharification and Fermentation at High Substrate Concentration. Waste Biomass Valorization 2015, 6, 353–361. [Google Scholar] [CrossRef]
  30. Kapanji, K.K.; Haigh, K.F.; Görgens, J.F. Techno-Economic Analysis of Chemically Catalysed Lignocellulose Biorefineries at a Typical Sugar Mill: Sorbitol or Glucaric Acid and Electricity Co-Production. Bioresour. Technol. 2019, 289, 121635. [Google Scholar] [CrossRef]
  31. Bolado-Rodríguez, S.; Toquero, C.; Martín-Juárez, J.; Travaini, R.; García-Encina, P.A. Effect of Thermal, Acid, Alkaline and Alkaline-Peroxide Pretreatments on the Biochemical Methane Potential and Kinetics of the Anaerobic Digestion of Wheat Straw and Sugarcane Bagasse. Bioresour. Technol. 2016, 201, 182–190. [Google Scholar] [CrossRef] [PubMed]
  32. Jung, D.U.; Yoo, H.Y.; Kim, S.B.; Lee, J.H.; Park, C.; Kim, S.W. Optimization of Medium Composition for Enhanced Cellulase Production by Mutant Penicillium brasilianum KUEB15 using Statistical Method. J. Ind. Eng. Chem. 2015, 25, 145–150. [Google Scholar] [CrossRef]
  33. Knoef, H.A.M. Handbook Biomass Gasification; Biomass Technology Group (BTG): Meppel, The Netherlands, 2005. [Google Scholar]
  34. Zerva, I.; Remmas, N.; Ntougias, S. Biocatalyst Potential of Cellulose-Degrading Microorganisms Isolated from Orange Juice Processing Waste. Beverages 2019, 5, 21. [Google Scholar] [CrossRef] [Green Version]
  35. Zerva, I.; Remmas, N.; Ntougias, S. Diversity and Biotechnological Potential of Xylan-Degrading Microorganisms from Orange Juice Processing Waste. Water 2019, 11, 274. [Google Scholar] [CrossRef] [Green Version]
  36. Kuo, C.-H.; Huang, C.-Y.; Shieh, C.-J.; Wang, H.-M.D.; Tseng, C.-Y. Hydrolysis of Orange Peel with Cellulase and Pectinase to Produce Bacterial Cellulose using Gluconacetobacter xylinus. Waste Biomass Valorization 2019, 10, 85–93. [Google Scholar] [CrossRef]
  37. Yoo, H.Y.; Yang, X.; Kim, D.S.; Lotrakul, P.; Prasongsuk, S.; Punnapayak, H.; Kim, S.W. Evaluation of the overall process on bioethanol production from miscanthus hydrolysates obtained by dilute acid pretreatment. Biotechnol. Bioprocess. Eng. 2016, 21, 733–742. [Google Scholar] [CrossRef]
  38. Sluiter, A.; Hames, B.; Ruiz, R.; Scarlata, C.; Sluiter, J.; Templeton, D.; Crocker, D. Determination of Structural Carbohydrates and Lignin in Biomass; Technical Report NREL/TP-510-42618; National Renewable Energy Laboratory: Golden, CO, USA, 2010. [Google Scholar]
  39. Senit, J.J.; Velasco, D.; Gomez Manrique, A.; Sanchez-Barba, M.; Toledo, J.M.; Santos, V.E.; Garcia-Ochoa, F.; Yustos, P.; Ladero, M. Orange Peel Waste Upstream Integrated Processing to Terpenes, Phenolics, Pectin and Monosaccharides: Optimization Approaches. Ind. Crops Prod. 2019, 134, 370–381. [Google Scholar] [CrossRef]
  40. Bustamante, D.; Tortajada, M.; Ramón, D.; Rojas, A. Production of D-Lactic Acid by the Fermentation of Orange Peel Waste Hydrolysate by Lactic Acid Bacteria. Fermentation 2020, 6, 1. [Google Scholar] [CrossRef] [Green Version]
  41. Lange, J.-P. Lignocellulose Conversion: An Introduction to Chemistry, Process and Economics. Biofuels Bioprod. Bioref. 2007, 1, 39–48. [Google Scholar] [CrossRef]
  42. Hussain, S.A.; Nazir, Y.; Hameed, A.; Yang, W.; Mustafa, K.; Song, Y. Optimization of Diverse Carbon Sources and Cultivation Conditions for Enhanced Growth and Lipid and Medium-Chain Fatty Acid (MCFA) Production by Mucor circinelloides. Fermentation 2019, 5, 35. [Google Scholar] [CrossRef] [Green Version]
  43. Bensah, E.C.; Kadar, Z.; Mensah, M.Y. Alkali and glycerol pretreatment of west african biomass for production of sugars and ethanol. Bioresour. Technol. Rep. 2019, 6, 123–130. [Google Scholar] [CrossRef]
  44. Ávila-Lara, A.I.; Camberos-Flores, J.N.; Mendoza-Pérez, J.A.; Messina-Fernández, S.R.; Saldaña-Duran, C.E.; Jimenez-Ruiz, E.I.; Sánchez-Herrera, L.M.; Pérez-Pimienta, J.A. Optimization of Alkaline and Dilute Acid Pretreatment of Agave Bagasse by Response Surface Methodology. Front. Bioeng. Biotechnol. 2015, 3, 146. [Google Scholar] [CrossRef] [Green Version]
  45. Wang, L.; Lu, W.; Li, J.; Hu, J.; Ding, R.; Lv, M.; Wang, Q. Optimization of Ultrasonic-Assisted Extraction and Purification of Zeaxanthin and Lutein in Corn Gluten Meal. Molecules 2019, 24, 2994. [Google Scholar] [CrossRef] [PubMed] [Green Version]
  46. Kucharska, K.; Rybarczyk, P.; Hołowacz, I.; Łukajtis, R.; Glinka, M.; Kamiński, M. Pretreatment of Lignocellulosic Materials as Substrates for Fermentation Processes. Molecules 2018, 23, 2937. [Google Scholar] [CrossRef] [Green Version]
  47. Vaughn, N.; Helseth, T. Design Expert 8 [Software]; Stat-Ease, Inc.: Minneapolis, MN, USA, 2016; Available online: https://www.statease.com/ (accessed on 15 September 2012).
  48. Osman, H. Model Prediction and Optimization of Waste Lube Oil Treated with Natural Clay. Processes 2019, 7, 729. [Google Scholar] [CrossRef] [Green Version]
  49. Yahaya Pudza, M.; Zainal Abidin, Z.; Abdul Rashid, S.; Md Yasin, F.; Noor, A.S.M.; Issa, M.A. Sustainable Synthesis Processes for Carbon Dots through Response Surface Methodology and Artificial Neural Network. Processes 2019, 7, 704. [Google Scholar] [CrossRef] [Green Version]
  50. Zheng, S.; Zhu, Y.; Jiao, C.; Shi, M.; Wei, L.; Zhou, Y.; Jin, Q.; Cai, Y. Extraction and Analysis of Gigantol from Dendrobium officinale with Response Surface Methodology. Molecules 2018, 23, 818. [Google Scholar] [CrossRef] [PubMed] [Green Version]
  51. Wang, H.; Liu, D.; Yu, H.; Wang, D.; Li, J. Optimization of Microwave Coupled Hot Air Drying for Chinese Yam Using Response Surface Methodology. Processes 2019, 7, 745. [Google Scholar] [CrossRef] [Green Version]
  52. Ahmad, A.L.; Derek, C.J.C.; Zulkali, M.M.D. Optimization of Thaumatin Extraction by Aqueous Two-Phase System (ATPS) using Response Surface Methodology (RSM). Sep. Purif. Technol. 2008, 62, 702–708. [Google Scholar] [CrossRef]
  53. Vepsäläinen, M.; Ghiasvand, M.; Selin, J.; Pienimaa, J.; Repo, E.; Pulliainen, M.; Sillanpää, M. Investigations of the Effects of Temperature and Initial Sample pH on Natural Organic Matter (NOM) Removal with Electrocoagulation using Response Surface Method (RSM). Sep. Purif. Technol. 2009, 69, 255–261. [Google Scholar] [CrossRef]
  54. Czyrski, A.; Sznura, J. The Application of Box-Behnken-Design in the Optimization of HPLC Separation of Fluoroquinolones. Sci. Rep. 2019, 9, 19458. [Google Scholar] [CrossRef] [PubMed] [Green Version]
  55. Choi, I.S.; Kim, J.-H.; Wi, S.G.; Kim, K.H.; Bae, H.-J. Bioethanol Production from Mandarin (Citrus unshiu) Peel Waste using Popping Pretreatment. Appl. Energy 2013, 102, 204–210. [Google Scholar] [CrossRef]
  56. Boluda-Aguilar, M.; López-Gómez, A. Production of Bioethanol by Fermentation of Lemon (Citrus limon L.) Peel Wastes Pretreated with Steam Explosion. Ind. Crops Prod. 2013, 41, 188–197. [Google Scholar] [CrossRef]
  57. Boluda-Aguilar, M.; García-Vidal, L.; González-Castañeda, F.P.; López-Gómez, A. Mandarin Peel Wastes Pretreatment with Steam Explosion for Bioethanol Production. Bioresour. Technol. 2010, 101, 3506–3513. [Google Scholar] [CrossRef] [PubMed]
  58. John, I.; Pola, J.; Thanabalan, M.; Appusamy, A. Bioethanol Production from Musambi Peel by Acid Catalyzed Steam Pretreatment and Enzymatic Saccharification: Optimization of Delignification Using Taguchi Design. Waste Biomass Valorization 2020, 11, 2631–2643. [Google Scholar] [CrossRef]
  59. Cho, E.J.; Lee, Y.G.; Chang, J.; Bae, H.-J. A High-Yield Process for Production of Biosugars and Hesperidin from Mandarin Peel Wastes. Molecules 2020, 25, 4286. [Google Scholar] [CrossRef]
  60. Santi, G.; Crognale, S.; D’Annibale, A.; Petruccioli, M.; Ruzzi, M.; Valentini, R.; Moresi, M. Orange Peel Pretreatment in a Novel Lab-Scale Direct Steam-Injection Apparatus for Ethanol Production. Biomass Bioenergy 2014, 61, 146–156. [Google Scholar] [CrossRef]
  61. Kim, D. Physico-Chemical Conversion of Lignocellulose: Inhibitor Effects and Detoxification Strategies: A Mini Review. Molecules 2018, 23, 309. [Google Scholar] [CrossRef] [PubMed] [Green Version]
  62. Naresh, M.; Rajarathinam, K.; Senniyappan, R.; Moorthy, T.; Kumar, R. Choice of Pretreatment Technology for Sustainable Production of Bioethanol from Lignocellulosic Biomass: Bottle Necks and Recommendations. Waste Biomass Valoriz. 2019, 10, 1693–1709. [Google Scholar] [CrossRef]
  63. Zhu, Y.; Huang, J.; Sun, S.; Wu, A.; Li, H. Effect of Dilute Acid and Alkali Pretreatments on the Catalytic Performance of Bamboo-Derived Carbonaceous Magnetic Solid Acid. Catalysts 2019, 9, 245. [Google Scholar] [CrossRef] [Green Version]
Figure 1. Three-dimensional (3D) response surfaces indicating the effects of thermal–alkaline pretreatment variables. The effects of X1 and X2 on glucan content (GC) (a); the effects of X1 and X3 on GC (b); the effects of X2 and X3 on GC (c). (X1: time, X2: KOH concentration and X3: solid loading).
Processes 09 00409 g001aProcesses 09 00409 g001b
Figure 2. Three-dimensional (3D) response surfaces indicating the effects of thermal–alkaline pretreatment variables. The effects of X1 and X2 on enzymatic digestibility (ED) (a); the effects of X1 and X3 on ED (b); the effects of X2 and X3 on ED (c). (X1: time, X2: KOH concentration and X3: solid loading).
Processes 09 00409 g002
Figure 3. Enzymatic hydrolysis of orange peel. Filled symbols represent pretreated group and not filled symbols represent control group (non-pretreatment).
Processes 09 00409 g003
Table 1. Variables and their levels in the central composite rotatable design for experimental conditions of pretreatment.
VariablesUnitSymbolLevels
−2−1012
TimeminX1010203040
KOH concentration%X201234
Solid loadingg/LX3406080100120
Table 2. The chemical composition of dried orange peel.
CompoundsContent %, w/w Dry Solid
Cellulose25.0
Hemicellulose17.0
Xylan11.3
Arabinan5.7
Table 3. Central composite design (CCD), experimental and estimated data for five-level-three-factor response surface analysis.
StdCoded ValueGlucan Content (%)Enzymatic Digestibility (%)
X1X2X3
1−1−1−128.340.3
21−1−132.448.6
3−11−127.191.0
411−132.887.8
5−1−1129.729.6
61−1129.935.8
7−11125.186.5
811128.880.1
9−20025.036.0
1020029.673.7
110−2033.231.5
1202028.095.1
1300−233.165.4
1400229.546.1
1500028.175.0
1600027.378.7
1700028.264.8
1800024.872.5
1900025.279.7
2000025.885.0
Table 4. Analysis of variance (ANOVA) for response surface quadratic model on GC.
SourceSum of SquaresDegree of FreedomMean SquaresF-Valuep-Value
Model128.78914.3110.240.0006
X132.45132.4523.220.0007
X218.30118.3013.090.0047
X312.98112.989.290.0123
X1X23.1013.102.220.1674
X1X34.3114.313.080.1097
X2X33.1213.122.230.1661
X121.2311.230.880.3709
X2227.35127.3519.570.0013
X3237.59137.5926.890.0004
Residual13.98101.40
Lack of fit3.0450.610.280.9071
Pure error10.9452.19
Total142.7619
Coefficients of variation (CV): 4.13%, Coefficient of determination (R2): 0.9021, Adjusted R2: 0.8140, Adequate precision: 10.355.
Table 5. ANOVA for response surface quadratic model on ED.
SourceSum of SquaresDegree of FreedomMean SquaresF-Valuep-Value
Model7945.409882.8221.58<0.0001
X1235.161235.165.800.0368
X26131.5816131.58151.25<0.0001
X3299.501299.507.390.0216
X1X2105.441105.442.600.1379
X1X30.01510.0153.594E-0040.9852
X2X34.7714.770.120.7387
X12746.021746.0218.400.0016
X22240.081240.085.920.0352
X32619.991619.9915.290.0029
Residual405.391040.54
Lack of fit334.87566.974.750.0562
Pure error70.52514.10
Total8350.7919
Coefficients of variation (CV): 9.75%, Coefficient of determination (R2): 0.9515, Adjusted R2: 0.9078, Adequate precision: 17.393.
Table 6. Numerical optimization and validation of pretreatment based on the regression models.
ParametersCoded Factor LevelsActual Factor Levels
time1.030 min
KOH concentration1.03%
solid loading–1.060.1 g/L
ResponsePredictedActual
glucan content (%)32.332.8
enzymatic digestibility (%)86.087.8
Table 7. Summary of the increase in glucose yield based on pretreatments and enzymatic hydrolysis.
FeedstockPretreatmentEnzymatic HydrolysisGlucose YieldRef.
PeelTypeTempTimeS/LEnzyme LoadingBef.Aft.
(°C)(min)ratio(Unit per g-Biomass)(g per kg-Biomass)
MandarinPopping15010-G (5.2 IU), P (1200 IU), X (13.25 XNU)248320[55]
LemonSteam explosion16051:2C (0.248 FPU),
G (1190 IU), P (5.46 IU)
-236.4[56]
MandarinSteam explosion16051:2C (0.248 FPU),
G (1190 IU), P (5.46 IU)
-153.4[57]
MusambiDilute acid
(0.25% H2SO4)
121601:4.9C (80 IU), G (100 IU),
P (120 IU)
258386[58]
MandarinSoxhlet (Diethyl ether)453001:13.3C (27.2 mg),
P (18.4 mg)
155175.2[59]
OrangeDirect steam injection (0.5% H2SO4)1802.51:6.7G (1.57 FPU)-34.9[60]
OrangeDilute acid (0.5% H2SO4)130601:6.7G (1.57 FPU)-94.8[60]
OrangeThermal–alkaline121301:16.7C (30 FPU), G (15 CBU), X (30 XNU)66.4316.7This study
C: cellulase. G: cellobiase. X: xylanase. P: pectinase. IU: international units.
Publisher’s Note: MDPI stays neutral with regard to jurisdictional claims in published maps and institutional affiliations.

