Article

High-Performance Mg–Al–Bi Alloy Anode for Seawater Batteries and Related Mechanisms

Department of Applied Chemistry, School of Chemical Engineering and Technology, Tianjin University, Tianjin 300072, China
*
Author to whom correspondence should be addressed.
Processes 2020, 8(11), 1362; https://doi.org/10.3390/pr8111362
Submission received: 20 September 2020 / Revised: 22 October 2020 / Accepted: 26 October 2020 / Published: 28 October 2020
(This article belongs to the Special Issue Nano-Hybrid Composite Membranes)

Abstract

:
Bi, a group 15 element, was added to magnesium alloys and applied to seawater batteries in marine operating machinery to improve the electrochemical performance and corrosion resistance of the battery. The electrochemical properties of as-cast pure Mg, Mg–8Al, and Mg–8Al–xBi alloy anodes in 3.5% NaCl solution were researched. Electrochemical impedance spectroscopy and an immersion test in 3.5% NaCl solution show that the Mg–8%Al–0.4%Bi alloy provides better corrosion resistance than Mg and the Mg–8Al alloy. The galvanostatic discharge results show that the Mg–8%Al–0.4%Bi alloy revealed better electrochemical properties and utilization efficiency in 3.5% NaCl solution. The Mg17Al12 and BiOCl phases formed during the discharge process of the Mg–8%Al–0.4%Bi alloy play an important role in improving the electrochemical performance and utilization efficiency of the alloy.

1. Introduction

Due to environmental pollution and energy issues, ocean research has attracted widespread attention and has become a hot topic; however, ocean research requires solutions to resolve its energy needs [1,2]. A seawater-activated battery was invented in the 1940s to solve the requirements of ocean exploration and research. This battery system applies active metal (e.g., magnesium, aluminum) as the battery anode; AgCl, CuCl, Cu2I2, and PbCl2 as the battery cathode; and natural seawater is used as the electrolyte, which is different from the lithium-ion battery system that normally uses porous carbon (e.g., graphite) as the anode [3] and metal oxide (e.g., LiMn2O4) as the cathode [4]. When the battery discharges, it uses seawater from the ocean as an electrolyte to enter the battery system [5,6,7]. The anode loses electrons and the anode metal continuously turns into metallic cations. At the cathode, metal chloride is reduced to metal and the battery forms a closed circuit [8]. Seawater-activated batteries can be used in a large number of marine operating equipment, such as ocean probes, submarines, ocean buoys, life jackets, and sonars [9,10,11]. As a new type of power source, seawater-activated batteries possess many strengths. Firstly, the electrolyte is seawater, so extra electrolytes and storage devices do not need to be found. For this reason, the weight of the appliance can be greatly reduced. Secondly, it is an open system, so the polarization phenomenon is avoided to a certain extent. With the continuous development of technology, seawater-dissolved oxygen batteries have begun to attract the attention of researchers in China and abroad [12]. In order to obtain high-performance seawater batteries, high-performance anode materials have become the focus of development [13].
The active metals used as chemical kinetic anodes are well known for their good performance. Magnesium is considered an ideal anode material for batteries due to its outstanding electrochemical properties. Firstly, magnesium has a negative standard electrode potential of −2.363 V (SHE), which is more negative than other active metals such as aluminum, zinc, iron, and titanium [14,15,16,17]. Thus, a magnesium anode can theoretically demonstrate higher battery voltage. Secondly, magnesium has a relatively high capacity of 2.205 A·h/g. As a consequence, a magnesium anode can theoretically provide higher battery capacity [18,19]. Thirdly, magnesium has a low density of 1.74 g/cm3, which can reduce the quality of the battery system. Fourthly, magnesium is rich in content and does not pollute the environment. Due to the above four advantages, magnesium is used as an excellent negative electrode material for seawater batteries [20,21].
Although magnesium is a good anode material for seawater batteries, there are still some problems to be solved. A Mg(OH)2 film will form on the anode surface during the discharge process. This Mg(OH)2 film covers the electrode surface and impedes battery discharge, so the actual potential of the magnesium anode is more positive than its theoretical potential. In addition, the electrode efficiency of the magnesium anode cannot reach 100%, owing to electrode self-discharge in the electrolyte. Finally, many metal particles fall off during the discharge process, and this part of magnesium cannot be used effectively, resulting in a reduction in active ingredients in the anode [22,23,24,25]. Now, magnesium alloy anode performance can be improved by alloying, heat treatment, hot extrusion [26], and electrolyte modification. Alloying is a simple and effective method [27,28,29,30]. According to reports, aluminum and zinc is added to magnesium to obtain better performance at the beginning. An AZ magnesium alloy has good corrosion resistance in NaCl solution but low discharge activity. Balasubramanian et al. [31] reported the performance of AZ31 magnesium alloy as a seawater battery anode. The cell voltage was close to 1.5 V for 400 mA at 30 °C. Jingling Ma et al. [32] studied the effect of Al content on properties of an AZ magnesium alloy. The AZ91 magnesium alloy has the best electrochemical performance of −1.193 V (vs. SHE) anode potential and 46% utilization at 20 mA cm−2. Wang et al. [33] researched the reaction mechanism of an AP magnesium alloy in 3.5% NaCl solution and found that the AP65 magnesium alloy has the best electrochemical performance of −1.686 V(vs. SHE) anode potential and 84% utilization at 180 mA cm−2. Yuasa et al. [26] reported that Ca can improve the capability of a Mg–Al–Mn alloy and thins discharge products. The Mg–6Al–0.3Mn–2Ca alloy’s anode potential increases by 0.088 V and its utilization rate increases by 10.6% compared to the Mg–6Al–0.3Mn anode at 10 mA cm−2. Feng et al. [34,35,36] reported that the Mg–Hg–Ga alloy can form Mg21Ga5Hg3 phases, which reduces the electron transfer resistance during discharge process. In addition, it reduces Hg pollution and Mg–1.6Hg–2Ga has good electrochemical performance of −1.897 V (vs. SHE) anode potential and 74% utilization at 180 mA cm−2. In order to obtain anodes with higher utilization efficiency, more negative discharge potential, and no pollution to the environment, a new composition magnesium alloy needs to be developed.
It has been reported that the self-corrosion rate of a magnesium alloy is reduced after adding group 14 and 15 elements [37]. In addition to this, aluminum plays an important role in inhibiting self-discharge and improving electrode utilization. Therefore, in order to obtain a high-performance seawater battery anode, this study prepared a Mg–Al–Bi ternary alloy. In order to understand the effect of elements Bi and Al in the magnesium alloy discharge process, a series of Mg–Al–Bi alloys were prepared by a high frequency induction furnace. The open circuit potential–time curves, galvanostatic discharging curves, and electrochemical impedance spectra curves were measured to display the impact on electrode performance of element Al and Bi. X-ray diffraction and scanning electron microscopy were used to analyze the changes in the structure and morphology of Mg–Al–Bi alloys in the galvanostatic discharging process. Based on the experimental data, a reaction mechanism is proposed to explain all the experimental phenomenon.

2. Materials and Methods

2.1. Preparation of Materials

A certain amount of commercial grade metal Mg (99.99%), metal Al (99.99%), and metal Bi (99.99%) were prepared to smelt the Mg–Al–Bi alloy. The addition amounts of Al and Bi are shown in Table 1. The investigated metals were melted in a graphite crucible in a high frequency induction furnace. The pressure in the induction furnace was −0.1 MPa at the beginning by vacuumizing and subsequently, the pressure recovered to 0.3 MPa by accessing argon. Then, the furnace started to heat at a stable heating power at 30% total power to 750 °C. This process lasted 3 min and stayed for 7 min at 750 °C, thus the uneven distribution of alloying elements reduced [38]. Finally, the molten alloys were poured into a preheated steel mold that was installed in the induction furnace and cooled down to 400 °C to remove from the induction furnace. The entire magnesium alloy preparation process is shown in Figure 1.

2.2. Electrochemical Measurements

A CHI660D electrochemical workstation was adopted to measure the electrochemical performance of the magnesium alloy anode. The electrochemical measurements were carried out at 25 ± 1 °C by a three-electrode system. Ruthenium titanium mesh and saturated calomel electrode (SCE) were used as the counter electrode and reference electrode, respectively. The electrolyte was composed of 3.5 wt% NaCl aqueous solution (250 mL for each test). The magnesium alloy anode with an area of 1 cm2 sealed glue was ground with 240, 400, 1000, and 2000 mesh abrasive paper. Electrochemical impedance spectroscopy (EIS) measurements were conducted in the open circuit potential + 20 mV and the measuring frequency was 0.1 Hz to 100 k Hz. Galvanostatic discharging tests were tested at current densities 30 and 120 mA/cm2, respectively. The anode utilization efficiency was acquired by calculating the theoretical weight loss and the actual weight loss in Equation (1).
U t i l i z a t i o n     e f f i c i e n c y = W t h e o r e t i c a l W a c t u a l × 100 %

2.3. Structural Characterization

The X-ray diffraction patterns of the Mg–Al–Bi alloys and pure Mg were recorded with a Rigaku MiniFlex II X-ray diffractometer. The 2θ angle regions between 20° and 80° were measured at a scan rate of 4° min−1. The grain size and lattice constant of Mg alloys were analyzed by JADE 6.5.
The scanning electron microscopy (SEM) observations were performed with a field-emission Hitachi s-4800 and SEM/energy dispersive spectrometer (EDS) spectroscopy mappings were undertaken at an acceleration voltage of 15 kV. X-ray photoelectron spectroscopy (XPS) was performed using a PHI5000 Versa Probe to analyze the chemical composition and valence state. The energy calibration of the spectrometer was performed using C 1s peak at 284.5 eV.

3. Results

3.1. Open Circuit Potential Analyses

Figure 2 shows the open circuit potential–time curves of Mg–8%Al–xBi alloys measured at 25 ± 1 °C. The open circuit potential gradually became stable after testing for 400 s. The relatively stable open circuit potential indicates that the electrochemical state on the electrode surface is relatively stable. The addition of Bi makes the open circuit potential of Mg–8%Al–xBi alloys negative from Bi content 0.2% to 0.4% and makes the open circuit potential positive from Bi content 0.6% to 1.0%. The Mg–8%Al–xBi alloys with Bi content of 0.4% have the most negative open circuit potential, so they have the possibility of generating a more negative potential during galvanostatic discharging.

3.2. Galvanostatic Discharging Analyses

Figure 3 displays the discharge curves and utilization efficiency–Bi content curves of Mg–8%Al–xBi alloys at 30 and 120 mA/cm2. The tests of Mg–8%Al–xBi alloys under different Bi content were investigated. The Mg–8%Al–xBi anodes have more negative potential than the Mg anode and Mg–8%Al anode. The Mg–Al–Bi anodes have relatively stable potential at 30 and 120 mA cm−2, but the Mg anode has serious polarization at 120 mA cm−2 and therefore, reduces its discharge performance. The potentials of Mg–8%Al–xBi, Mg, and Mg–8%Al alloys all shift positively at the beginning of the galvanostatic discharging, then shift negative fast over different periods, and then, continue to move positively. This process is due to the discharge products attached to the electrode surface, which blocks the discharge process. The consequent sudden change in potential indicates the cracking of the passivation film. Finally, a dynamic balance is established between the formation and desorption of discharge products. By comparing Figure 3a,b, the potential change during the steady discharge period becomes obvious as the discharge current increases. This is caused by the accelerated corrosion rate of the electrode and the shedding of α-Mg crystal grains. In general, the Mg–8%Al–0.2%Bi alloy has the most negative potential of −1.466 V and the highest utilization efficiency of 56.6% when it is discharged at the current density of 30 mA/cm2; the Mg–8%Al–0.4%Bi alloy has the most negative potential of −1.185 V and the highest utilization efficiency of 72.4% when it is discharged at the current density of 120 mA/cm2. By comparing Mg, the Mg–8%Al alloy, and the Mg–8%Al–xBi alloy, the potential of the Mg–8%Al–xBi alloy is more negative than that of Mg or the Mg–8%Al alloy and the utilization efficiency is higher. This effect is attributed to the intermetallic Mg17Al12 and Bi oxide, which can destroy the Mg(OH)2 film formed on the anode surface, making the electrolyte easy to contact with the matrix [37,39,40]. The Mg17Al12 phase is good for stripping of corrosion products, avoiding the polarization of the electrode. The addition of Bi makes the potential show a positive trend with the increase in Bi content at 30 mA/cm2. In addition, the potential shows a negative trend with the increase in Bi content from 0% to 0.4% and then, shows a positive trend with the increase in Bi content from 0.4% to 1.0% at 120 mA/cm2. The more negative the alloy discharge potential, the higher the utilization efficiency.

3.3. Microstructures

Figure 4 shows the XRD patterns of the Mg–8%Al and Mg–8%Al–0.4%Bi alloys and the 4N grade Mg. The peak positions of Mg are in accordance with the standard powder diffraction pattern of Mg (PDF#35-0821), but the peak positions shifted after adding the Al element compared with the standard powder diffraction pattern of Mg (PDF#35-0821). This is because the addition of a large amount of aluminum changes the lattice structure of magnesium and simultaneously forms the Mg17Al12 (PDF#73-1148) phase. The grain sizes and lattice constants from the XRD data are calculated in Table 2. The lattice parameters of Mg–8%Al–0.4%Bi alloys increase with the addition of elements Al and Bi. As shown in Table 2, the lattice parameters of pure magnesium change when alloying elements are added. The grain size is arranged in the following order: Mg–8%Al–0.4%Bi < Mg–8%Al < Mg, denoting the addition of Al and Bi is beneficial to reduce the grain size of Mg alloys. In the Mg–8%Al–0.4%Bi XRD pattern, the Bi element content is too low and therefore, cannot be reflected.

3.4. XPS Analyses

In order to further determine the chemical composition of the Bi element in the discharge product, XPS was used to prove the existence of the low-content element and to detect its valence. Figure 5 is the peak fitting curve of the XPS spectrum of Bi4f for Mg–8%Al–0.4%Bi alloy discharging for 30 min at 120 mA cm−2. It reveals that the XPS spectrum of Bi4f has two high peaks and two low peaks. By fitting data and comparing with standard binding energy, the peak of Bi4f5/2 has a peak of Bi with a binding energy of 157 eV and a characteristic peak of Bi3+ with a binding energy of 159 eV. Due to the presence of chloride ions and the neutral pH of the solution, Bi3+ exists in the form of BiOCl [41].

3.5. SEM and EDS Analyses

Figure 6a,b show the SEM image of Mg anode and Mg–8%Al–0.4%Bi anode surfaces after discharge at 120 mA/cm2 for 30 min. It is observed that the discharge products are distributed on the anode surface in Mg and Mg–8%Al–0.4%Bi anodes The discharge product of Mg anode is thicker and has fewer surface cracks, while the discharge product of Mg–8%Al–0.4%Bi anode is thinner and has more surface cracks. According to reports, the discharge performance of Mg batteries is related to their appearance during discharge. Cao et al. [42] proved that the discharge products attached to the surface of the Mg–Li-Al–Ce–Zn–Mn alloy are loose small pieces. These loose oxidation products allow the electrolyte to penetrate and maintain the anode discharge activity, while the bulk discharge products quickly fall off. Therefore, the cracks that appear on the discharge product shown in Figure 5 will also promote the penetration of the electrolyte into the discharge product and maintain contact with the substrate to maintain its discharge activity, while the thick one with fewer cracks formed on the surface of the magnesium anode blocks the contact between the electrolyte and the anode surface. Therefore, Mg–8%Al–0.4%Bi shows better discharge performance.
Figure 6c,d show the SEM image of the Mg anode and Mg–8%Al–0.4%Bi anode surfaces discharged at 120 mA/cm2 without discharge products. The Mg–8%Al–0.4%Bi anode surface is uniformly dissolved. In contrast, larger corrosion pits were observed on the magnesium anode. The deep pits observed in the Mg anode may be caused by the shedding of α-Mg grains from the anode during the discharge. These shed α-Mg grains cannot be used for discharge, resulting in a decrease in discharge capacity and anode utilization efficiency [43,44]. As shown in Figure 6, the surface of the Mg–8%Al–0.4%Bi anode was uniformly corroded, and no corrosion pits were observed. This is considered to be another reason why the discharge performance and anode efficiency of the Mg–8%Al–0.4%Bi anode are higher than those of the Mg anode under high current density.
Figure 7a shows the SEM image of the Mg–8%Al–0.4%Bi alloy and the EDS results of magnesium and the alloying elements’ distribution. According to Figure 7, most of the Al elements are evenly distributed on the surface, and the Bi element content is too low to be detected. No obvious second phase can be observed in the image. Figure 7b shows the SEM image of the corroded surface morphology and the related EDS results of the Mg–8%Al–0.4%Bi alloy after discharge at the current densities of 120 mAcm−2 for 30 min without discharge product. According to the EDS results in Figure 7b, Al elements gather together and basically exist in the form of Mg17Al12 phase, and at the same time, Bi elements are enriched on the anode surface after discharge in the form of BiOCl. They formed a protective layer on the surface of the anode to reduce self-discharge and strip the thick Mg(OH)2 passivation film. Therefore, the discharge performance and utilization efficiency of the battery were improved.

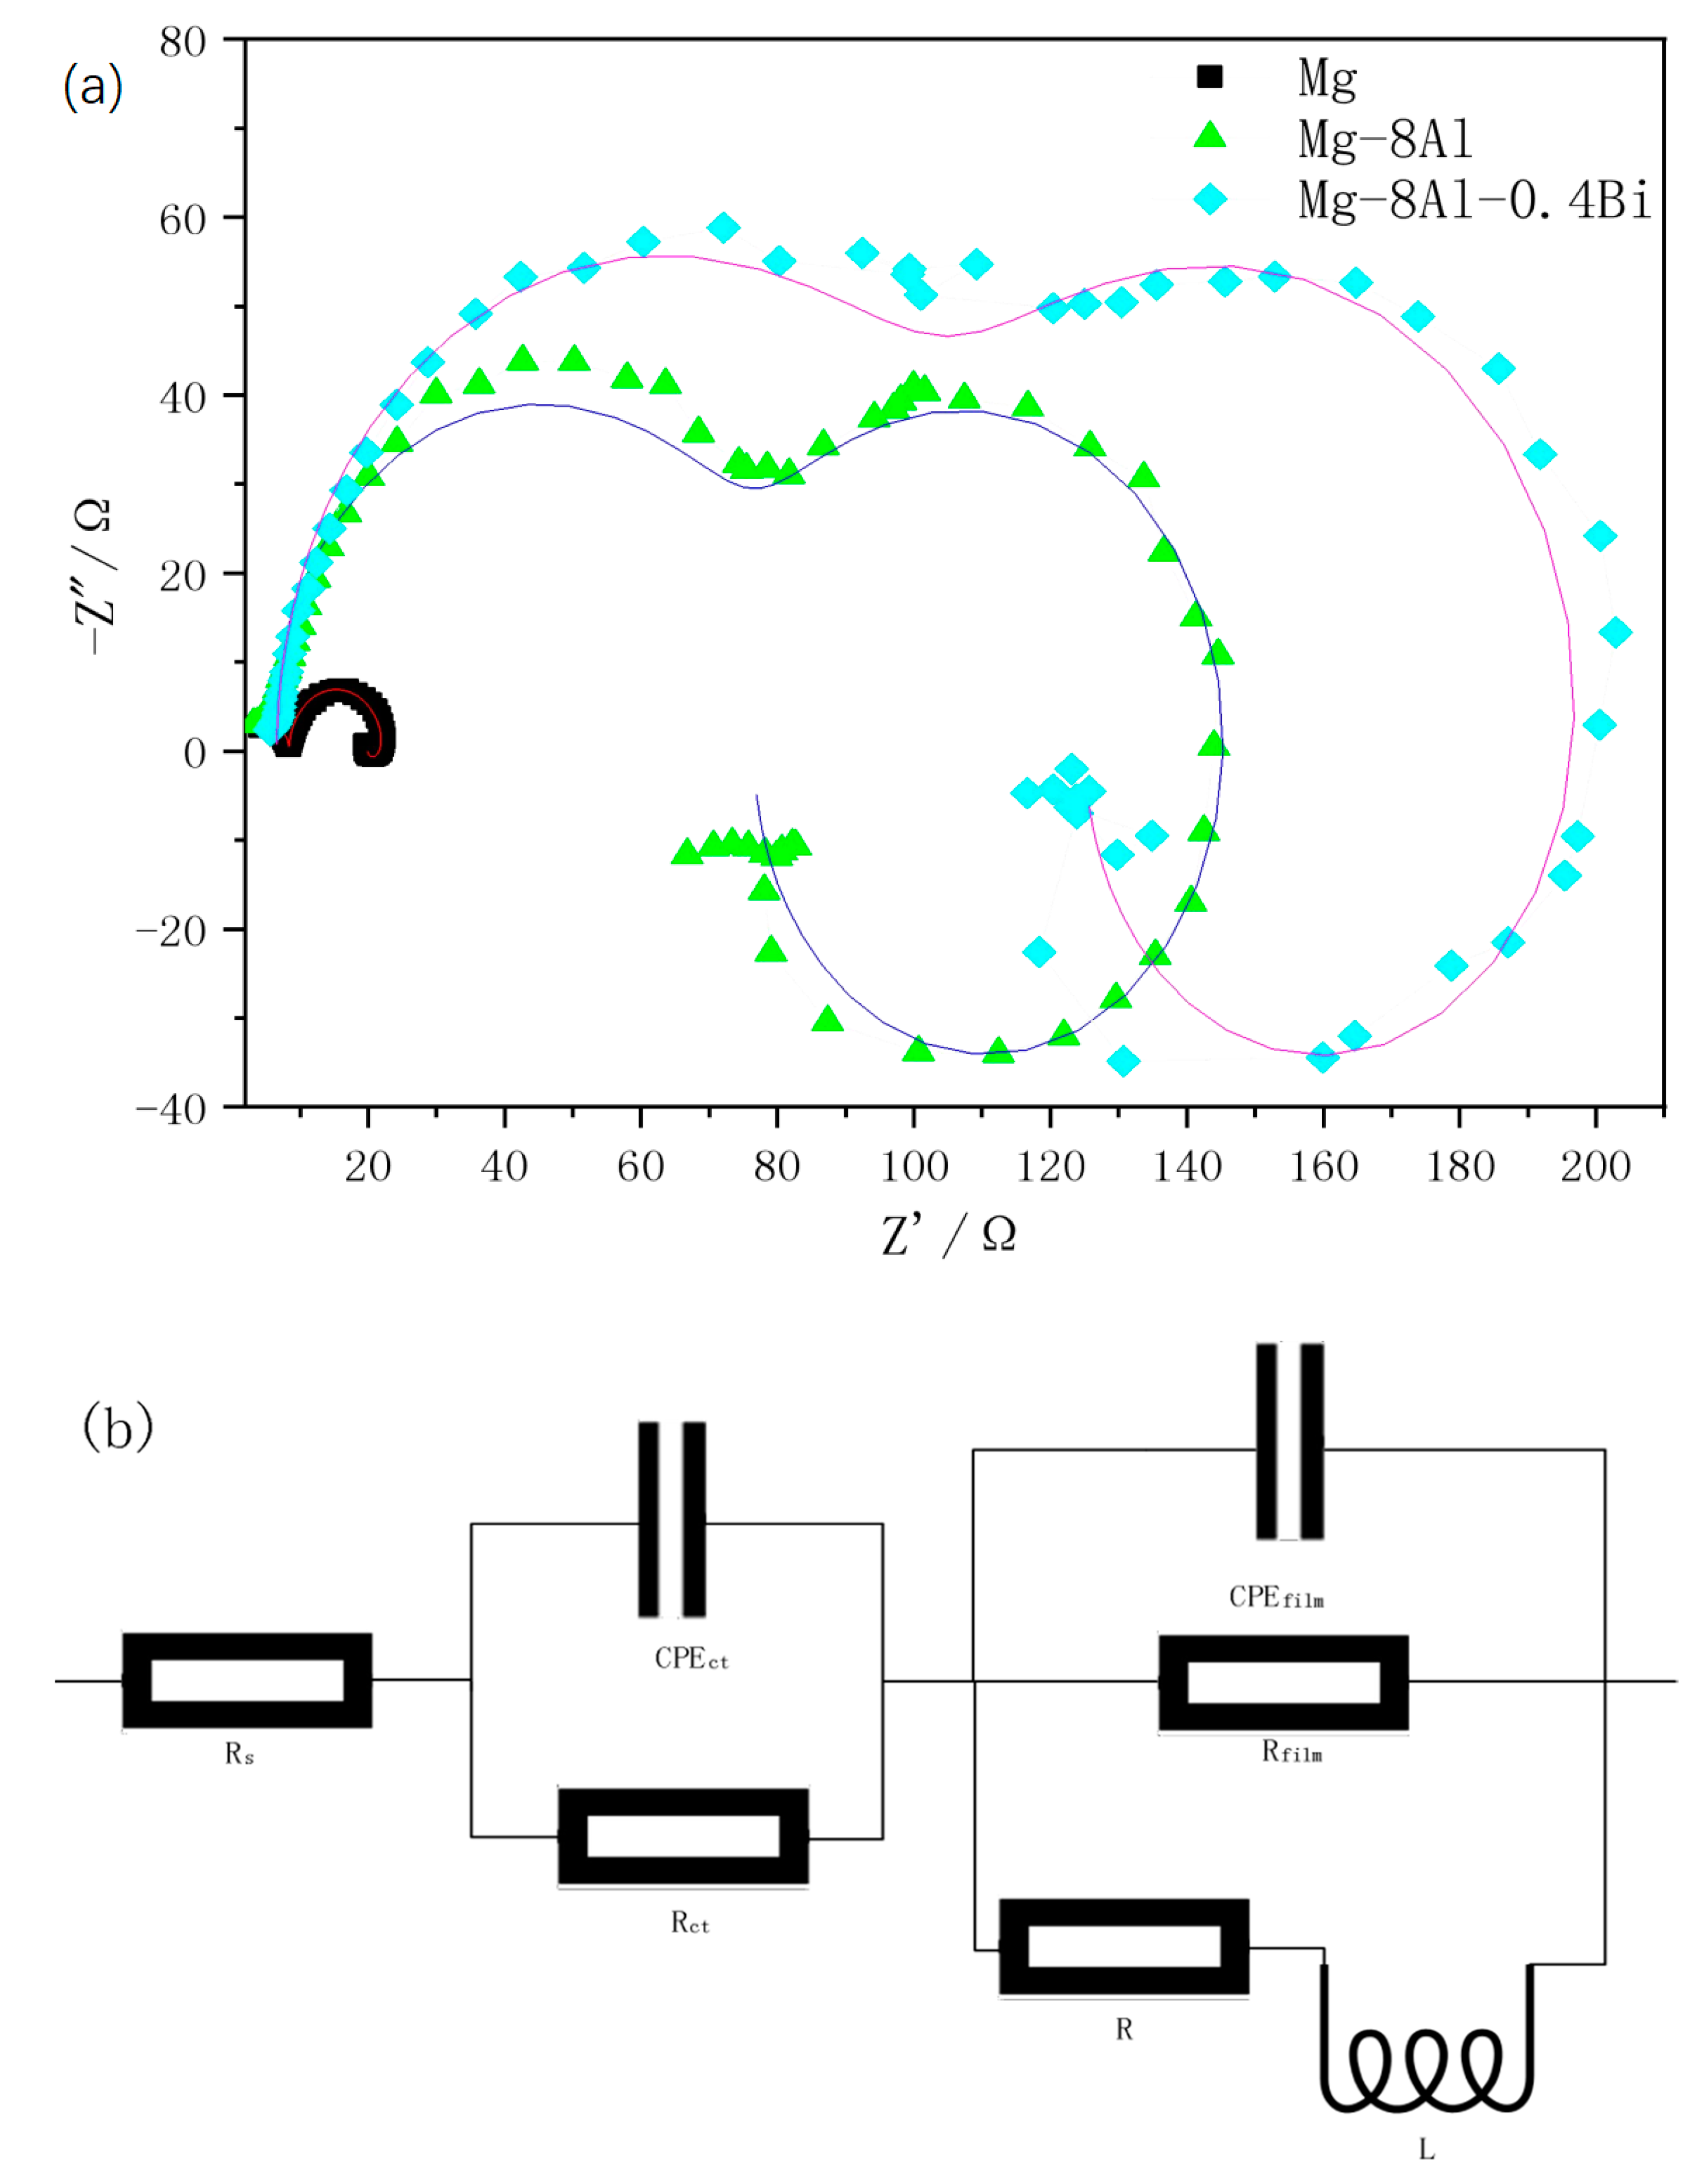
3.6. Electrochemical Impedance Spectroscopy (EIS) Analyses

Figure 8 displays the Nyquist plots of Mg, Mg–8%Al, and Mg–8%Al–0.4%Bi measured in 3.5% NaCl solution at 25 ± 1 °C. According to Figure 8, the interfacial processes and corrosion mechanisms are studied. The shapes of the Nyquist diagrams of all three samples are similar, so they have similar electrochemical behavior. All Nyquist plots have three parts: two capacitive semicircles at high frequency and medium frequency, and one inductive semicircle at low frequency. The capacitive semicircles at high frequency and medium frequency are related to electron transfer and the electrochemical double-layer. The larger the radius of the semicircle, the greater the corrosion resistance. The radius of the loops increases according to the order Mg < Mg–8%Al < Mg–8%Al–0.4%Bi. There is a low frequency induction semicircle in almost all magnesium alloys, which may be attributed to the interaction of corrosion products and the corroded alloy surface. The Mg–8%Al–0.4%Bi alloy possesses the highest impedance and it exhibits the optimal corrosion resistance, which is consistent with the results obtained in the immersion experiment. In order to explain the Nyquist plots, an equivalent circuit is used to model the impedance (Figure 8b). Table 3 lists the main EIS parameters of the equivalent circuit fitted by ZSimpWin software. In the equivalent circuit fitting parameters of the Mg alloy, CPEct and Rct describe the electrochemical double layer and the charge transfer resistance, respectively; CPEfilm and Rfilm describe the capacitance and resistance of the passivation film on the alloy, respectively. R and L, respectively, describe the low frequency inductance resistance and inductance resulting from the adsorption of corrosion products. Rs describes the resistance of the solution. The value of Rct + Rfilm determines the corrosion resistance of the material in the electrolyte. The larger the value of Rct + Rfilm, the better the corrosion resistance. The Rct + Rfilm of Mg–8%Al–0.4%Bi alloy reaches 205 Ω, while the Rct + Rfilm of pure Mg is 19.941 Ω. For the Mg–8%Al–0.4%Bi alloy, the observed Rct + Rfilm is much larger than that of the Mg and Mg–8%Al alloys. It shows the Mg–8%Al–0.4%Bi alloy has better corrosion resistance, which is consistent with the results of the immersion experiment.

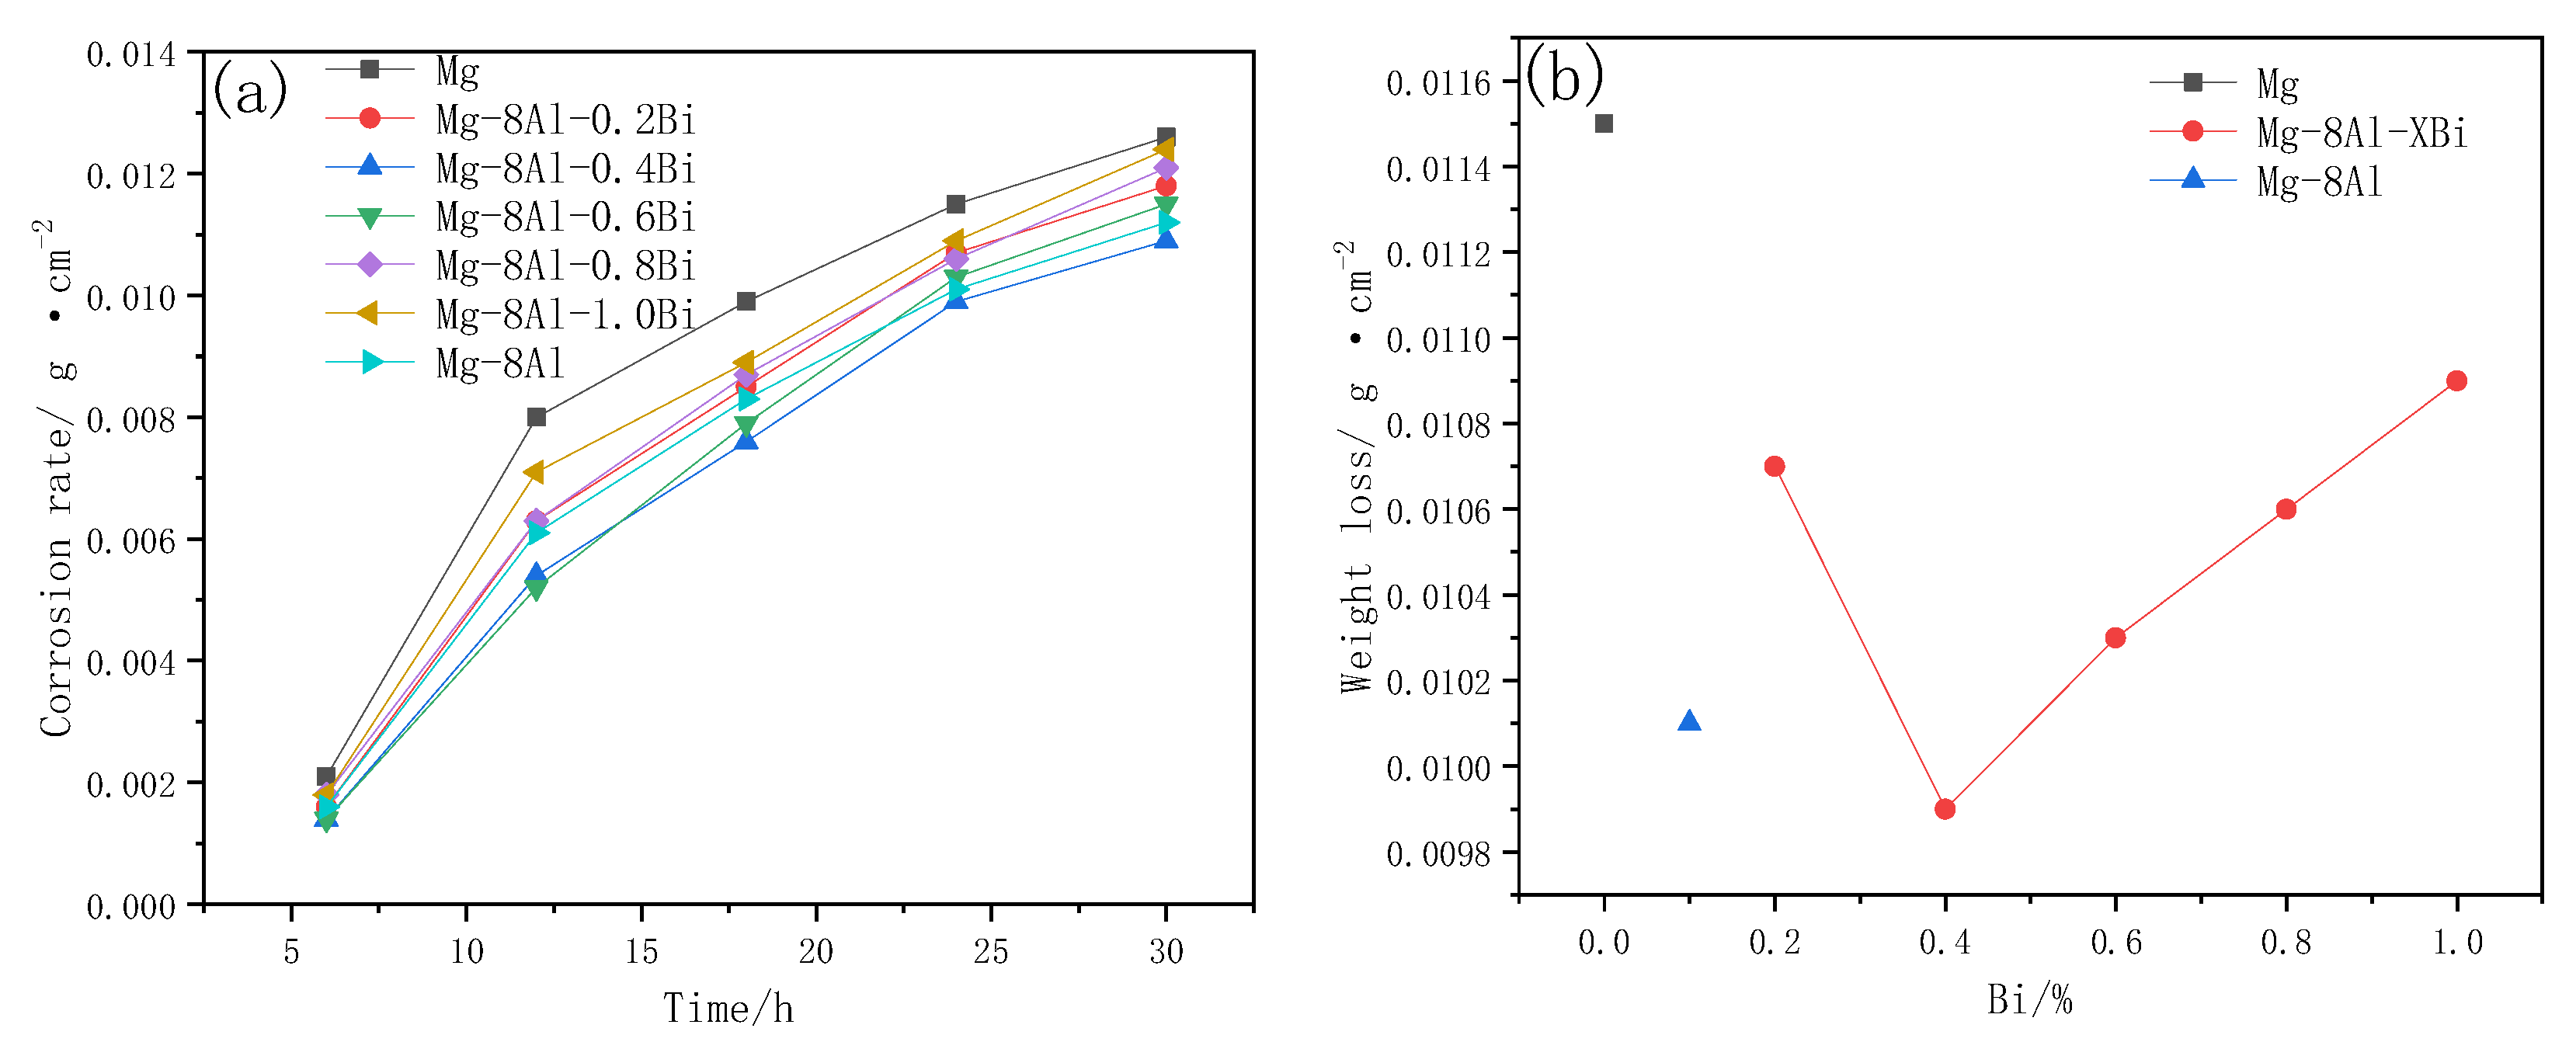
3.7. Immersion Test Analyses

The corrosion rate curves of the Mg, Mg–8%Al, and Mg–8%Al–xBi alloys were compared in Figure 9. It reflects that the Mg–8%Al–0.4%Bi alloy has the slowest corrosion rate and its chemical corrosion resistance is better than that of Mg and the Mg–8%Al alloy. The corrosion rate of all alloys is faster at the beginning of corrosion, then gradually slows down, and finally, tends to be constant. Because a passivation film is formed on the surface of the alloy, the protection of the passivation film and the hydrogen evolution overpotential of the alloy determine the alloy’s corrosion rate. The better protection of the passivation film, the higher the hydrogen evolution overpotential of the alloy, and the slower the corrosion rate. The results indicate that the addition of metal Bi slows down the evolution of hydrogen because Bi is a high hydrogen evolution overpotential metal. Therefore, the chemical corrosion rate of the Mg–Al–Bi alloy is lower than that of pure magnesium and pure aluminum [45].
The anode surface morphologies of pure Mg and Mg alloys immersed in 3.5 wt% NaCl solution for 12 and 24 h are shown in Figure 10. According to the microstructure and corrosion morphology, corrosion can be classified as either “dotted” or “flaky” corrosion type. The degree of corrosion at the center of the sample is determined by the alloy properties, while the corrosion at the edge of the sample is determined by the alloy properties and edge stress. The corrosion morphology of the Mg–8%Al alloy is similar to that of the Mg–8%Al–0.4%Bi alloy, which is mainly flaky. The metallographic photograph indicates that corrosion started to form small flaky corrosion areas and then, connected into a larger corrosion areas. The formation of larger “flaky” corrosion areas and deep pitting corrosion of pure Mg revealed that the occurrence and spread of corrosion was very fast. That is, pure magnesium can quickly initiate corrosion, but cannot prevent the spread of corrosion. The corrosion products exist in the form of individual large pieces and are not connected into flakes. This leads to a lower corrosion resistance of pure magnesium. The degree of corrosion increases in the order Mg–8%Al–0.4%Bi < Mg–8%Al < Mg. Hence, the Mg–8%Al–0.4%Bi alloy shows the best corrosion resistance, and the pure Mg exhibits the most serious corrosion. In Figure 10, the edge corrosion of pure magnesium is light, but the center corrosion is serious. It has good edge stress resistance, but the matrix has poor resistance to chemical corrosion. The pitting corrosion of pure magnesium spreads to the depths of the magnesium matrix, causing more serious corrosion. The corrosion of Mg–8%Al alloy and Mg–8%Al–0.4%Bi alloy is basically concentrated on the edge, and the corrosion resistance of the matrix is better. Mg–8%Al–0.4%Bi has the least degree of corrosion, so its corrosion resistance is the strongest in 3.5% NaCl without discharge.

4. Discussion

The mechanism diagram of the pure Mg and Mg–8%Al–0.4%Bi alloy discharge process and the cross-section of corrosion products are depicted in Figure 11. Song [46] found that during the discharge process of magnesium and magnesium alloys, a protective film of Mg(OH)2 is formed on the anode surface. Because the protective layer is loose in the presence of certain ions (such as Cl- etc.) and cannot peel off quickly, the protective performance of the film is poor and the discharge performance is reduced, as shown in Figure 11a. However, it can be clearly seen from Figure 6 that the surface of the pure Mg is corroded very seriously after discharging in 120 mA cm−2, while the surface of the Mg–8%Al–0.4%Bi alloy is very flat and shows good corrosion resistance, which means the protection of the film formed by the Mg–Al–Bi alloy is greater than that of the Mg(OH)2 film formed by pure Mg in discharge. It can be seen from Figure 6 that after the addition of Al and Bi, the corrosion resistance of the alloy becomes better and the alloy surface film becomes thin. This may be because Bi has a high hydrogen evolution overpotential. In general, the higher the hydrogen evolution overpotential, the greater the resistance of the hydrogen evolution reaction, thereby slowing down self-corrosion. At the same time, the Mg17Al12 and BiOCl produced in the discharge process peel off the Mg(OH)2 film, which improved the discharge performance of the anode, as shown in Figure 11b.

5. Conclusions

  • The electrode performance of the as-cast Mg–8%Al–0.4%Bi alloy shows that compared with pure Mg or Mg–8%Al alloy, it has a more negative discharge potential of −1.185 V and a higher utilization rate of 72.4%.
  • EIS research and immersion tests show that the chemical resistance of the Mg alloy surface protective film follows the following order: Mg < Mg–8%Al < Mg–8%Al–0.4%Bi. Therefore, the corrosion rate of the Mg–8%Al–0.4%Bi alloy in seawater is the slowest.
  • Different phases in the magnesium alloy play an important role in electrochemical performance. The Mg17Al12 and BiOCl phases in the as-cast Mg–8%Al–0.4%Bi alloy can increase the alloy utilization rate and promote the dissolution of α-Mg in seawater during discharge. Moreover, the Bi element is environmentally friendly and pollution-free, which means that Mg–8%Al–0.4%Bi alloy is a promising electrode material for the anode of seawater-activated batteries.

Author Contributions

Data curation, X.M.; writing—review and editing, C.W. and W.W. All authors have read and agreed to the published version of the manuscript.

Funding

This research received no external funding.

Conflicts of Interest

The authors declare no conflict of interest.

References

  1. Kerr, S.; Watts, L.; Colton, J.; Conway, F.; Hull, A.; Johnson, K.; Jude, S.; Kannen, A.; MacDougall, S.; McLachlan, C.; et al. Vergunst, Establishing an agenda for social studies research in marine renewable energy. Energy Policy 2014, 67, 694–702. [Google Scholar] [CrossRef] [Green Version]
  2. Skjong, E.; Volden, R.; Rodskar, E.; Molinas, M.; Johansen, T.A.; Cunningham, J. Past, Present, and Future Challenges of the Marine Vessel’s Electrical Power System. IEEE Trans. Transp. Electrif. 2016, 2, 522–537. [Google Scholar] [CrossRef] [Green Version]
  3. Zhou, W.; Hao, F.; Fang, D. The effects of elastic stiffening on the evolution of the stress field within a spherical electrode particle of lithium-ion batteries. Int. J. Appl. Mech. 2013, 5, 1350040. [Google Scholar] [CrossRef]
  4. Zhou, W. Effects of external mechanical loading on stress generation during lithiation in Li-ion battery electrodes. Electrochim. Acta 2015, 185, 28–33. [Google Scholar] [CrossRef] [Green Version]
  5. Wen, L.; Yu, K.; Xiong, H.; Dai, Y.; Yang, S.; Qiao, X.; Teng, F.; Fan, S. Composition optimization and electrochemical properties of Mg-Al-Pb-Zn alloys as anodes for seawater activated battery. Electrochim. Acta 2016, 194, 40–51. [Google Scholar] [CrossRef]
  6. Wang, N.; Wang, R.; Peng, C.; Feng, Y.; Chen, B. Effect of hot rolling and subsequent annealing on electrochemical discharge behavior of AP65 magnesium alloy as anode for seawater activated battery. Corros. Sci. 2012, 64, 17–27. [Google Scholar] [CrossRef]
  7. Yu, K.; Tan, X.; Hu, Y.; Chen, F.; Li, S. Microstructure effects on the electrochemical corrosion properties of Mg-4.1% Ga-2.2% Hg alloy as the anode for seawater-activated batteries. Corros. Sci. 2011, 53, 2035–2040. [Google Scholar] [CrossRef]
  8. Wilcock, W.S.D.; Kauffman, P.C. Development of a seawater battery for deep-water applications. J. Power Sources 1977, 66, 71–75. [Google Scholar] [CrossRef]
  9. Hasvold, Ø.; Størkersen, N. Electrochemical power sources for unmanned underwater vehicles used in deep sea survey operations. J. Power Sources 2001, 96, 252–258. [Google Scholar] [CrossRef]
  10. Hwang, S.M.; Park, J.S.; Kim, Y.; Go, W.; Han, J.; Kim, Y.; Kim, Y. Rechargeable Seawater Batteries—From Concept to Applications. Adv. Mater. 2019, 31, 1804936. [Google Scholar] [CrossRef]
  11. Shinohara, M.; Araki, E.; Mochizuki, M.; Kanazawa, T.; Suyehiro, K. Practical application of a sea-water battery in deep-sea basin and its performance. J. Power Sources 2009, 187, 253–260. [Google Scholar] [CrossRef]
  12. Hasvold, Ø.; Lian, T.; Haakaas, E.; Størkersen, N.; Perelman, O.; Cordier, S. CLIPPER: A long-range, autonomous underwater vehicle using magnesium fuel and oxygen from the sea. J. Power Sources 2004, 136, 232–239. [Google Scholar] [CrossRef]
  13. Feng, Y.; Wang, R.; Peng, C. Researches and applications of magnesium anode materials in seawater battery. Chin. J. Nonferrous Metals 2011, 21, 259–268. [Google Scholar]
  14. Feng, Y.; Xiong, W.; Zhang, J.; Wang, R.; Wang, N. Electrochemical discharge performance of the Mg–Al–Pb–Ce–Y alloy as the anode for Mg–air batteries. J. Mater. Chem. 2016, 4, 8658–8668. [Google Scholar] [CrossRef]
  15. Wang, N.; Li, W.; Huang, Y.; Wu, G.; Hu, M.; Li, G.; Shi, Z. Wrought Mg-Al-Pb-RE alloy strips as the anodes for Mg-air batteries. J. Power Sources 2019, 436, 226855. [Google Scholar] [CrossRef]
  16. Wu, J.; Wang, R.; Feng, Y.; Peng, C. Effect of hot rolling on the microstructure and discharge properties of Mg-1.6 wt%Hg-2 wt%Ga alloy anodes. J. Alloys Compd. 2018, 765, 736–746. [Google Scholar] [CrossRef]
  17. Wang, H.H.; Du, M.; Liang, H.; Gao, Q.Y. Study on Al-Zn-In Alloy as Sacrificial Anodes in Seawater Environment. J. Ocean Univ. 2019, 18, 889–895. [Google Scholar] [CrossRef]
  18. Liu, X.; Xue, J.; Zhang, D. Electrochemical behaviors and discharge performance of the as-extruded Mg-1.5 wt%Ca alloys as anode for Mg-air battery. J. Alloys Compd. 2019, 790, 822–828. [Google Scholar] [CrossRef]
  19. Li, J.; Wan, K.; Jiang, Q.; Sun, H.; Li, Y.; Hou, B.; Zhu, L.; Liu, M. Corrosion and Discharge Behaviors of Mg-Al-Zn and Mg-Al-Zn-In Alloys as Anode Materials. Metals 2016, 6, 65. [Google Scholar] [CrossRef] [Green Version]
  20. Wang, N.; Wang, R.; Peng, C.; Feng, Y.; Zhang, X. Influence of aluminium and lead on activation of magnesium as anode. Trans. Nonferrous Metals Soc. China 2010, 20, 1403–1411. [Google Scholar] [CrossRef]
  21. Lin, M.; Uan, J. Preparation of bcc Mg-Li-Al-Zn Alloy by Electrolysis in Molten Salt LiCl-KCl and the Alloy’s Electrochemical Performance as Anode Material for Magnesium Batteries. Electrochemistry 2009, 77, 604–607. [Google Scholar] [CrossRef] [Green Version]
  22. Liu, X.; Liu, S.; Xue, J. Discharge performance of the magnesium anodes with different phase constitutions for Mg-air batteries. J. Power Sources 2018, 396, 667–674. [Google Scholar] [CrossRef]
  23. Yu, Z.; Ju, D.; Zhao, H.; Hu, X. Effects of Zn-In-Sn elements on the electric properties of magnesium alloy anode materials. J. Environ. Sci. 2011, 23, S95–S99. [Google Scholar] [CrossRef]
  24. Yin, M.; Hou, L.; Liu, X.; Wang, Z.; Liu, B.; Jia, J.; Zhang, S.; Wei, Y. Tailoring the micromorphology of the as-cast Mg–Sn–In alloys to corrosion-resistant microstructures via adjusting In concentration. J. Alloys Compd. 2019, 811, 152024. [Google Scholar] [CrossRef]
  25. Baghni, I.M.; Wu, Y.S.; Li, J.Q.; Zhang, W. Corrosion behavior of magnesium and magnesium alloys. Trans. Nonferrous Metals Soc. China 2004, 14, 1–10. [Google Scholar]
  26. Zhou, W.; Lin, J.; Dean, T.A.; Wang, L. Feasibility studies of a novel extrusion process for curved profiles: Experimentation and modelling. Int. J. Mach. Tools Manuf. 2018, 126, 27–43. [Google Scholar] [CrossRef] [Green Version]
  27. Xiong, H.; Yu, K.; Yin, X.; Dai, Y.; Yan, Y.; Zhu, H. Effects of microstructure on the electrochemical discharge behavior of Mg-6wt%Al-1wt%Sn alloy as anode for Mg-air primary battery. J. Alloys Compd. 2004, 708, 652–661. [Google Scholar] [CrossRef]
  28. Malyi, O.I.; Tan, T.L.; Manzhos, S. In search of high performance anode materials for Mg batteries: Computational studies of Mg in Ge, Si, and Sn. J. Power Sources 2013, 233, 341–345. [Google Scholar] [CrossRef] [Green Version]
  29. Yuasa, M.; Huang, X.; Suzuki, K.; Mabuchi, M.; Chino, Y. Discharge properties of Mg–Al–Mn–Ca and Mg–Al–Mn alloys as anode materials for primary magnesium–air batteries. J. Power Sources 2015, 297, 449–456. [Google Scholar] [CrossRef]
  30. Deng, M.; Höche, D.; Lamaka, S.V.; Wang, L.; Zheludkevich, M.L. Revealing the impact of second phase morphology on discharge properties of binary Mg-Ca anodes for primary Mg-air batteries. Corros. Sci. 2019, 153, 225–235. [Google Scholar] [CrossRef]
  31. Balasubramanian, R.; Veluchamy, A.; Venkatakrishnan, N.; Gangadharan, R. Electrochemical characterization of magnesium/silver chloride battery. J. Power Sources 1995, 56, 197–199. [Google Scholar] [CrossRef]
  32. Ma, J.; Wang, G.; Li, Y.; Qin, C.; Ren, F. Electrochemical Investigations on AZ Series Magnesium Alloys as Anode Materials in a Sodium Chloride Solution. J. Mater. Eng. Perform. 2019, 28, 2873–2880. [Google Scholar] [CrossRef]
  33. Wang, N.; Wang, R.; Peng, C.; Feng, Y. Enhancement of the discharge performance of AP65 magnesium alloy anodes by hot extrusion. Corros. Sci. 2014, 81, 85–95. [Google Scholar] [CrossRef]
  34. Feng, Y.; Wang, R.; Yu, K.; Peng, C.; Zhang, J.; Zhang, C. Activation of Mg–Hg anodes by Ga in NaCl solution. J. Alloys Compd. 2009, 473, 215–219. [Google Scholar] [CrossRef]
  35. Feng, Y.; Wang, R.; Yu, K.; Peng, C.; Li, W. Influence of Ga and Hg on microstructure and electrochemical corrosion behavior of Mg alloy anode materials. Trans. Nonferrous Metals Soc. China 2009, 17, 1363–1366. [Google Scholar] [CrossRef]
  36. Feng, Y.; Wang, R.; Peng, C. Influence of aging treatments on microstructure and electrochemical properties in Mg–8.8Hg–8Ga (wt%) alloy. Intermetallics 2013, 33, 120–125. [Google Scholar]
  37. Liu, R.L.; Scully, J.R.; Williams, G.; Birbilis, N. Reducing the corrosion rate of magnesium via microalloying additions of group 14 and 15 elements. Electrochim. Acta 2018, 260, 184–195. [Google Scholar] [CrossRef] [Green Version]
  38. Xiong, H.; Zhu, H.; Luo, J.; Yu, K.; Shi, C.; Fang, H.; Zhang, Y. Effects of Heat Treatment on the Discharge Behavior of Mg-6wt.%Al-1wt.%Sn Alloy as Anode For Magnesium-Air Batteries. J. Mater. Eng. Perform. 2017, 26, 2901–2911. [Google Scholar] [CrossRef]
  39. Zhao, M.-C.; Schmutz, P.; Brunner, S.; Liu, M.; Song, G.-l.; Atrens, A. An exploratory study of the corrosion of Mg alloys during interrupted salt spray testing. Corros. Sci. 2009, 51, 1277–1292. [Google Scholar] [CrossRef]
  40. Song, G.; Atrens, A.; Dargusch, M. Influence of microstructure on the corrosion of diecast AZ91D. Corros. Sci. 1998, 41, 249–273. [Google Scholar] [CrossRef]
  41. Chen, F.; Leong, Z.Y.; Yang, H.Y. An aqueous rechargeable chloride ion battery. Energy Storage Mater. 2017, 7, 189–194. [Google Scholar] [CrossRef]
  42. Cao, D.; Wu, L.; Wang, G.; Lv, Y. Electrochemical oxidation behavior of Mg–Li–Al–Ce–Zn and Mg–Li–Al–Ce–Zn–Mn in sodium chloride solution. J. Power Sources 2008, 183, 799–804. [Google Scholar] [CrossRef]
  43. Wang, N.; Wang, R.; Peng, C.; Peng, B.; Feng, Y.; Hu, C. Discharge behaviour of Mg-Al-Pb and Mg-Al-Pb-In alloys as anodes for Mg-air battery. Electrochim. Acta 2014, 149, 193–205. [Google Scholar] [CrossRef]
  44. Andrei, M.; di Gabriele, F.; Bonora, P.L.; Scantlebury, D. Corrosion behaviour of magnesium sacrificial anodes in tap water. Mater. Corros. 2003, 54, 5–11. [Google Scholar] [CrossRef]
  45. Ramirez, O.M.P.; Queiroz, F.M.; Tunes, M.A.; Antunes, R.A.; Rodrigues, C.L.; Lanzutti, A.; Pogatscher, S.; Olivier, M.-G.; de Melo, H.G. Tartaric-sulphuric acid anodized clad AA2024-T3 post-treated in Ce-containing solutions at different temperatures: Corrosion behaviour and Ce ions distribution. Appl. Surf. Sci. 2020, 534, 147634. [Google Scholar] [CrossRef]
  46. Song, G.L.; Unocic, K.A. The anodic surface film and hydrogen evolution on Mg. Corros. Sci. 2015, 98, 758–765. [Google Scholar] [CrossRef] [Green Version]
Figure 1. Mg–8%Al–0.4Bi alloy preparation process
Processes 08 01362 g001
Figure 2. (a) Open circuit potential–time curves of Mg–8%Al–xBi alloys; (b) Open circuit potential–Bi content curves measured in 3.5% NaCl solution.
Processes 08 01362 g002
Figure 3. Discharge curves of Mg–8%Al–xBi electrode with different Bi content at (a) 30 mA/cm2 and (b) 120 mA/cm2; Discharge potential–Bi content curves at (c) 30 mA/cm2 and (d) 120 mA/cm2; Utilization efficiency–Bi content curves of Mg–Bi alloy at (e) 30mA/cm2 and (f) 120 mA/cm2, measured in 3.5% NaCl solution.
Processes 08 01362 g003aProcesses 08 01362 g003b
Figure 4. XRD patterns of pure Mg, Mg–8%Al, and Mg–8%Al–0.4%Bi alloy.
Processes 08 01362 g004
Figure 5. XPS spectrum of Bi4f for Mg–8%Al–0.4%Bi alloy discharged at 120 mA/cm2 for 30 min.
Processes 08 01362 g005
Figure 6. SEM images of (a) Mg and (b) Mg–8%Al–0.4%Bi discharged at 120 mA/cm2 for 20 min with discharge products; (c) Mg and (d) Mg–8%Al–0.4%Bi discharged at 120 mA/cm2 for 20 min without discharge products.
Processes 08 01362 g006
Figure 7. Element mapping of elements Mg, Al, and Bi for (a) as-cast Mg–8%Al–0.4%Bi and (b) Mg–8%Al–0.4%Bi alloy discharged at 120 mA/cm2 for 30 min without discharge products.
Processes 08 01362 g007
Figure 8. (a) Nyquist curves of Mg and Mg alloys. (b) Equivalent circuit diagram of Figure 7a measured in 3.5% NaCl solution.
Processes 08 01362 g008
Figure 9. (a) Corrosion rate–time curves of Mg–8%Al–xBi alloys measured in 3.5% NaCl solution. (b) Weight loss–Bi content of Mg–8%Al–xBi alloys soaked in 3.5% NaCl solution for 24h.
Processes 08 01362 g009
Figure 10. Metallographic microscope images of (a) Mg,(b) Mg–8%Al, and (c) Mg–8%Al–0.4%Bi soaked in 3.5% NaCl solution for 12h; (d) Mg, (e) Mg–8%Al, and (f) Mg–8%Al–0.4%Bi soaked in 3.5% NaCl solution for 24h.
Processes 08 01362 g010aProcesses 08 01362 g010b
Figure 11. Discharge mechanism diagram of (a) Mg and (b) Mg–8%Al–0.4%Bi alloy for seawater battery anode.
Processes 08 01362 g011
Table 1. Sample content of Mg–Al–Bi alloys.
SampleBiAlMg
10%0%100%
20%8%92.0%
30.2%8%91.8%
40.4%8%91.6%
50.6%8%91.4%
60.8%8%91.2%
71.0%8%91.0%
Table 2. Grain size and lattice parameters of the Mg–Al–Bi alloys.
SampleGrain Size/ÅLattice Parameters/Å
abc
Mg7533.22943.22945.1599
Mg–8%Al2513.18253.18255.3346
Mg–8%Al–0.4%Bi2443.19713.19715.3540
Table 3. Parameter values of the equivalent elements in Figure 7.
SampleRs/ΩCPEct/μFRctCPEfilm/mFRfilmL/HR/Ω
Mg3.0080.44935.7510.232214.190.63586.6100
Mg–8Al5.6625.67670.920.120068.746.68560.0641
Mg–8Al–0.4Bi6.6129.877106.50.112098.5010.174.8830
Publisher’s Note: MDPI stays neutral with regard to jurisdictional claims in published maps and institutional affiliations.

