1. Introduction
The rapidly growing interest in plant extracts for the components of functional foods, nutritional supplements, and herbal medicines is due to the high pace of development of the food, cosmetic, and pharmaceutical industry [
1]. Extraction is one of the best-known methods for isolating target substances from plant sources. The efficiency of any solid-liquid extraction (in addition to the degree of grinding of raw materials, temperature, pressure, or the choice of solvent) significantly depends on the plant matrix structure. Plant material, a complex structured system with several levels of the organization, consists of cellulose, hemicellulose, and lignin. These components interact with each other at the molecular and supramolecular levels to form cell walls. In turn, cell walls form the meshwork of plant tissue.
The particle structure obtained by the destruction of gramineous straw consists of two types of cells. The first type is isometric cells that perform most of the basic functions. The second type is non-isometric elongated cells whose main function is to ensure the transport of substances inside the plant [
2]. Extraction from plant raw materials can be considered to be a process of consecutive diffusion of secreted substances from isometric cells into elongated cells (channels), followed by diffusion of substances in the channels and removal of the extracted substance into the extractant solution [
3].
Several theories have been developed for the extraction of substances from cellular bodies [
4]. Most of them use the Fick’s second law of diffusion (Equation (1)) as an initial equation. It is justified to use this equation from a physical point of view, since it is obvious that extraction inside the particles occurs in the diffusion mode, and the difference in concentrations of the extracted substances in the solution and inside the particle is a driving force of this process.
with the boundary conditions:
The general analytical solution is written as:
where
C0 is the initial concentration of the substance in the solid phase (mg/mL);
is the average concentration in the solid phase (mg/mL);
D is the mass transfer constant in the pores of the solid phase (1/s);
R is the size of the solid particles (μm);
t is the time (s);
β = (dimensionless quantity);
is the equilibrium concentration in the liquid phase (mg/mL);
µn is the roots of the characteristic Bessel equation (a tabular constant that is dependent on the form factor) (a dimensionless quantity); and
ν is the shape factor for the solid phase (a dimensionless quantity).
For the stationary process, the convergence of this equation becomes fast-growing with increasing
Dt/R2 (and therefore
t), and the equation can practically be reduced to the first member. For the boundary case
Bi →
,
β →
[
5] this equation is also known as the Axelrud equation [
6]:
where
is the concentration in a solid state (body) at time point t (mg/mL);
C0 is the initial concentration of the substance in the solid phase (mg/mL);
C1 is the concentration in the solution at time point t (mg/mL);
Bi is the constant particle form factor (a dimensionless quantity).
Since a large number of interdependent parameters of the process and matrix characteristics need to be taken into account, the extraction kinetics are often described by equations with a large number (>4) of input variable parameters. Direct calculation of diffusion parameters using the experimental data often yields results that have no physical meaning.
Based on the well-known models, a number of poorly controlled parameters that make it difficult to study the kinetics of extraction from plant materials have been determined:
- -
the polydispersity of plant materials, which significantly complicates the model and increases the variability of particle shape (Bi-factor);
- -
differences in the diffusion coefficient in pores having different diameters;
- -
the indeterminacy of the ratio between the external and internal diffusion and the hydrodynamic situation on the capillary edge (the Reynolds criterion);
- -
the possibility of the extracted substances to interact with each other;
- -
air retention in the pores taking place as the raw material is impregnated with the extractant, which affects the extraction kinetics.
Only if the above factors are kept constant will extraction take place in a regular mode, when the extraction kinetics curves are straightened using the semilogarithmic scale and it is possible to properly compare the calculated diffusion coefficients and control the Bi criterion (particle form factor).
It was shown that channel diffusion is the rate-limiting stage for particles larger than 1 mm. The influence of mass transfer on the process occurring inside the channels (e.g., via applying pulsating pressure) can significantly increase the extraction rate [
7]. Moreover, for each system there is an optimal particle size below which the extraction yield is significantly reduced due to a decrease in the extraction rate [
8]. For example, particle size significantly affects the extraction process under exposure to ultrasound, which can also be explained by changes in the internal structure of particles and changes in the diffusion mechanism [
9].
Therefore, in this research we decided to take one type of plant raw material that obviously contains no flavonoids, remove all extractable substances in order to avoid their potential interactions with the flavonoid, change the matrix of plant raw materials by mechanical treatment [
10], and then add the flavonoid to the “pure” matrices and investigate its extraction.
Resveratrol was chosen as a model extractable substance among a number of flavonoids: quercetin, taxifolin, rutin, piceatannol, etc. Resveratrol C
14H
12O
3, a natural phytoalexin exhibiting a number of promising nutritional and pharmacological values (antioxidant, anti-inflammatory, neuroprotective, cardioprotective, and antidiabetic activities) [
11,
12], carries two arene rings linked by an ethylene chain, and three phenolic functional groups (
Figure 1) [
13]. We suggest that, in a manner similar to catechin [
14], resveratrol interacts with cellulose through the formation of hydrogen bonds between phenolic groups and oxygen-containing groups of glucan cellulose monomers. Resveratrol is sufficiently soluble and easily determined by HPLC [
15]. On the other hand, its dissolution and extraction last several hours, making it possible to reliably select and analyze the extracts.
The purpose of this work was to determine the influence of particle size and the crystallinity degree of plant raw material cellulose on the diffusion constants as exemplified by the extraction of a polyphenol compound, resveratrol, from the model plant raw material (wheat straw particles). The study of these dependencies will allow one to find the optimal conditions for increasing the rate extraction. In some cases (for example, when carrying out extraction processes in flow-through apparatuses or when target substances are unstable), the task of intensifying the extraction rate process is fundamental for increasing the yield of the extraction process.
2. Materials and Methods
2.1. Materials
The reagents used in this study were as follows: acetonitrile (SIGMA-Aldrich, Moscow, Russia), distilled water, ethanol (SIGMA-Aldrich, Moscow, Russia), hexane (SIGMA-Aldrich, Moscow, Russia), and resveratrol (3,4′,5-trihydroxy-trans-stilbene) (99%, SIGMA-Aldrich, Moscow, Russia).
2.2. Preparation of Plant Matrices
Wheat straw was chosen as the matrix because it has the most regular structure and average chemical composition. Wheat straw Triticum durum L. was collected in September 2019 in the Siberian central botanical garden (Novosibirsk, Russia).
The plant material was subjected to grinding in a Desi-11 disintegrator (Disintegrator, Tallinn, Estonia). To prevent changes in the structure of cellular tissues, the raw materials were pre-frozen at liquid nitrogen temperature. Particles of the same size but varying in their cellulose crystallinity index were obtained by mechanical treatment in an Activator laboratory-scale mill of the attritor type (manufactured by the ISSCM SB RAS, Novosibirsk, Russia) with a rotor speed of 600 rpm, equipped with a thermostat system. Fractions with a certain size were selected by sieve analysis using an Analysette-3 Pro vibratory sieve shaker equipped with a set of sieves (mesh size, 30–400 µm).
All the straw fractions were purified to remove the soluble substances by serial exhaustive extraction with hexane, ethanol, and distilled water. This stage is required to eliminate the effect of soluble substances on extraction from the model matrix of plant material.
2.3. Studying the Extraction Kinetics
To adsorb resveratrol, the washed matrices were placed into a saturated alcohol solution of resveratrol for 2 h. After saturation, the matrices were filtered from the solution and washed with a small amount (1 mL/1 g of solid) of ice-cold ethanol. The dried samples were used for kinetic studies.
To study the extraction kinetics of resveratrol from matrix saturated by resveratrol, a sample of 0.2 g was placed into flasks containing 200 mL of distilled water. The sample was kept in the solution for 5 min under reduced pressure to remove air bubbles from the particles in order to prevent air from being trapped inside the pores. At specified time points, 2 mL of the solution containing solid particles was sampled from the extract that had been stirred well. No more water was added to the flask so that the ratio between the solid sample and the extractant was not changed. Solid particles were separated by centrifugation; the supernatant fluid after centrifugation was studied by HPLC. The extraction kinetics were investigated by sampling at 15, 30, 60 min and then every hour and measuring the amount of resveratrol released into the solution.
2.4. HPLC Analysis
The analysis was performed using a Milichrom A-02 high-performance liquid chromatography system (Econova Co., Novosibirsk, Russia) with UV-Vis detection and a ProntoSil 120–5 C18 AQ column (5 μm particle sizes, 2.0 × 75 mm I.D.; Econova Co., Novosibirsk, Russia). The injection volume was 2 μL; the column temperature was 40 °C. The elution was performed in the gradient mode; eluent A—distilled water; eluent B—acetonitrile. Gradient of B was 0–2200–3000 μL/5–55–100% B. The flow rate was 150 μL/min. Detection was performed photometrically by a UV-Vis detector at wavelengths of 210 nm and 300 nm.
2.5. Matrix Structure and Morphology Analysis
The particle size of wheat straw after grinding, fractionation, and purification was measured by laser diffraction scattering (LDS) on a Microsizer 201 particle size analyzer (VA Instalt, St. Petersburg, Russia) equipped with an ultrasonic disperser and a CAMSIZER X2 optical analyzer (Retsch GmbH, Haan, Germany) with a detection threshold of 0.8–8000 μm and compressed air dispersion module (pressure 50 kPa).
The particle morphology of wheat straw was studied by scanning electron microscopy (SEM) on a TM-1000 microscope (Hitachi, Tokyo, Japan) at an accelerating voltage of 15 kV. A gold coating was deposited on the sample surface to remove the accumulated charge (ion current 30 mA, spray time 60 s).
The changes in the crystal structure of wheat straw cellulose under study were determined by X-ray diffraction (XRD) analysis. X-ray studies were performed on a D8 Advance powder diffractometer (Bruker, Germany) with monochromatic CuKα radiation in the Bragg–Brentano geometry (reflection mode) at a voltage of 40 kV and current of 40 mA.
3. Results and Discussion
3.1. Mathematical Model Validation
Wheat straw was chosen as a model plant material that has a regular structure (
Figure 2a). The particles 350 μm in size consisted of cells with the average size of 22 μm and the wall thickness varying within 0.5–2 μm. Long conductive cells (channels) in the particles were parallel to each other at a distance of 80–90 μm. Particles with a size of 32 μm (the fraction between the sieve mesh size of 30 and 35 μm) usually do not contain long conductive cell channels (
Figure 2b). Thus, it can be assumed that diffusion through cell walls will be the limiting stage of extraction from such particles. For particles 350 μm in size (the fraction between the sieve mesh size of 300 and 400 μm) (
Figure 2c), channel diffusion is the limiting stage of extraction [
4]. For the particles 130 μm in size (100–160 μm), extraction apparently takes place in the mixed mode (
Figure 2d). No significant changes in the cell wall structure with simultaneous reduction of particle sizes were detected in the experiments with the samples obtained at low temperatures.
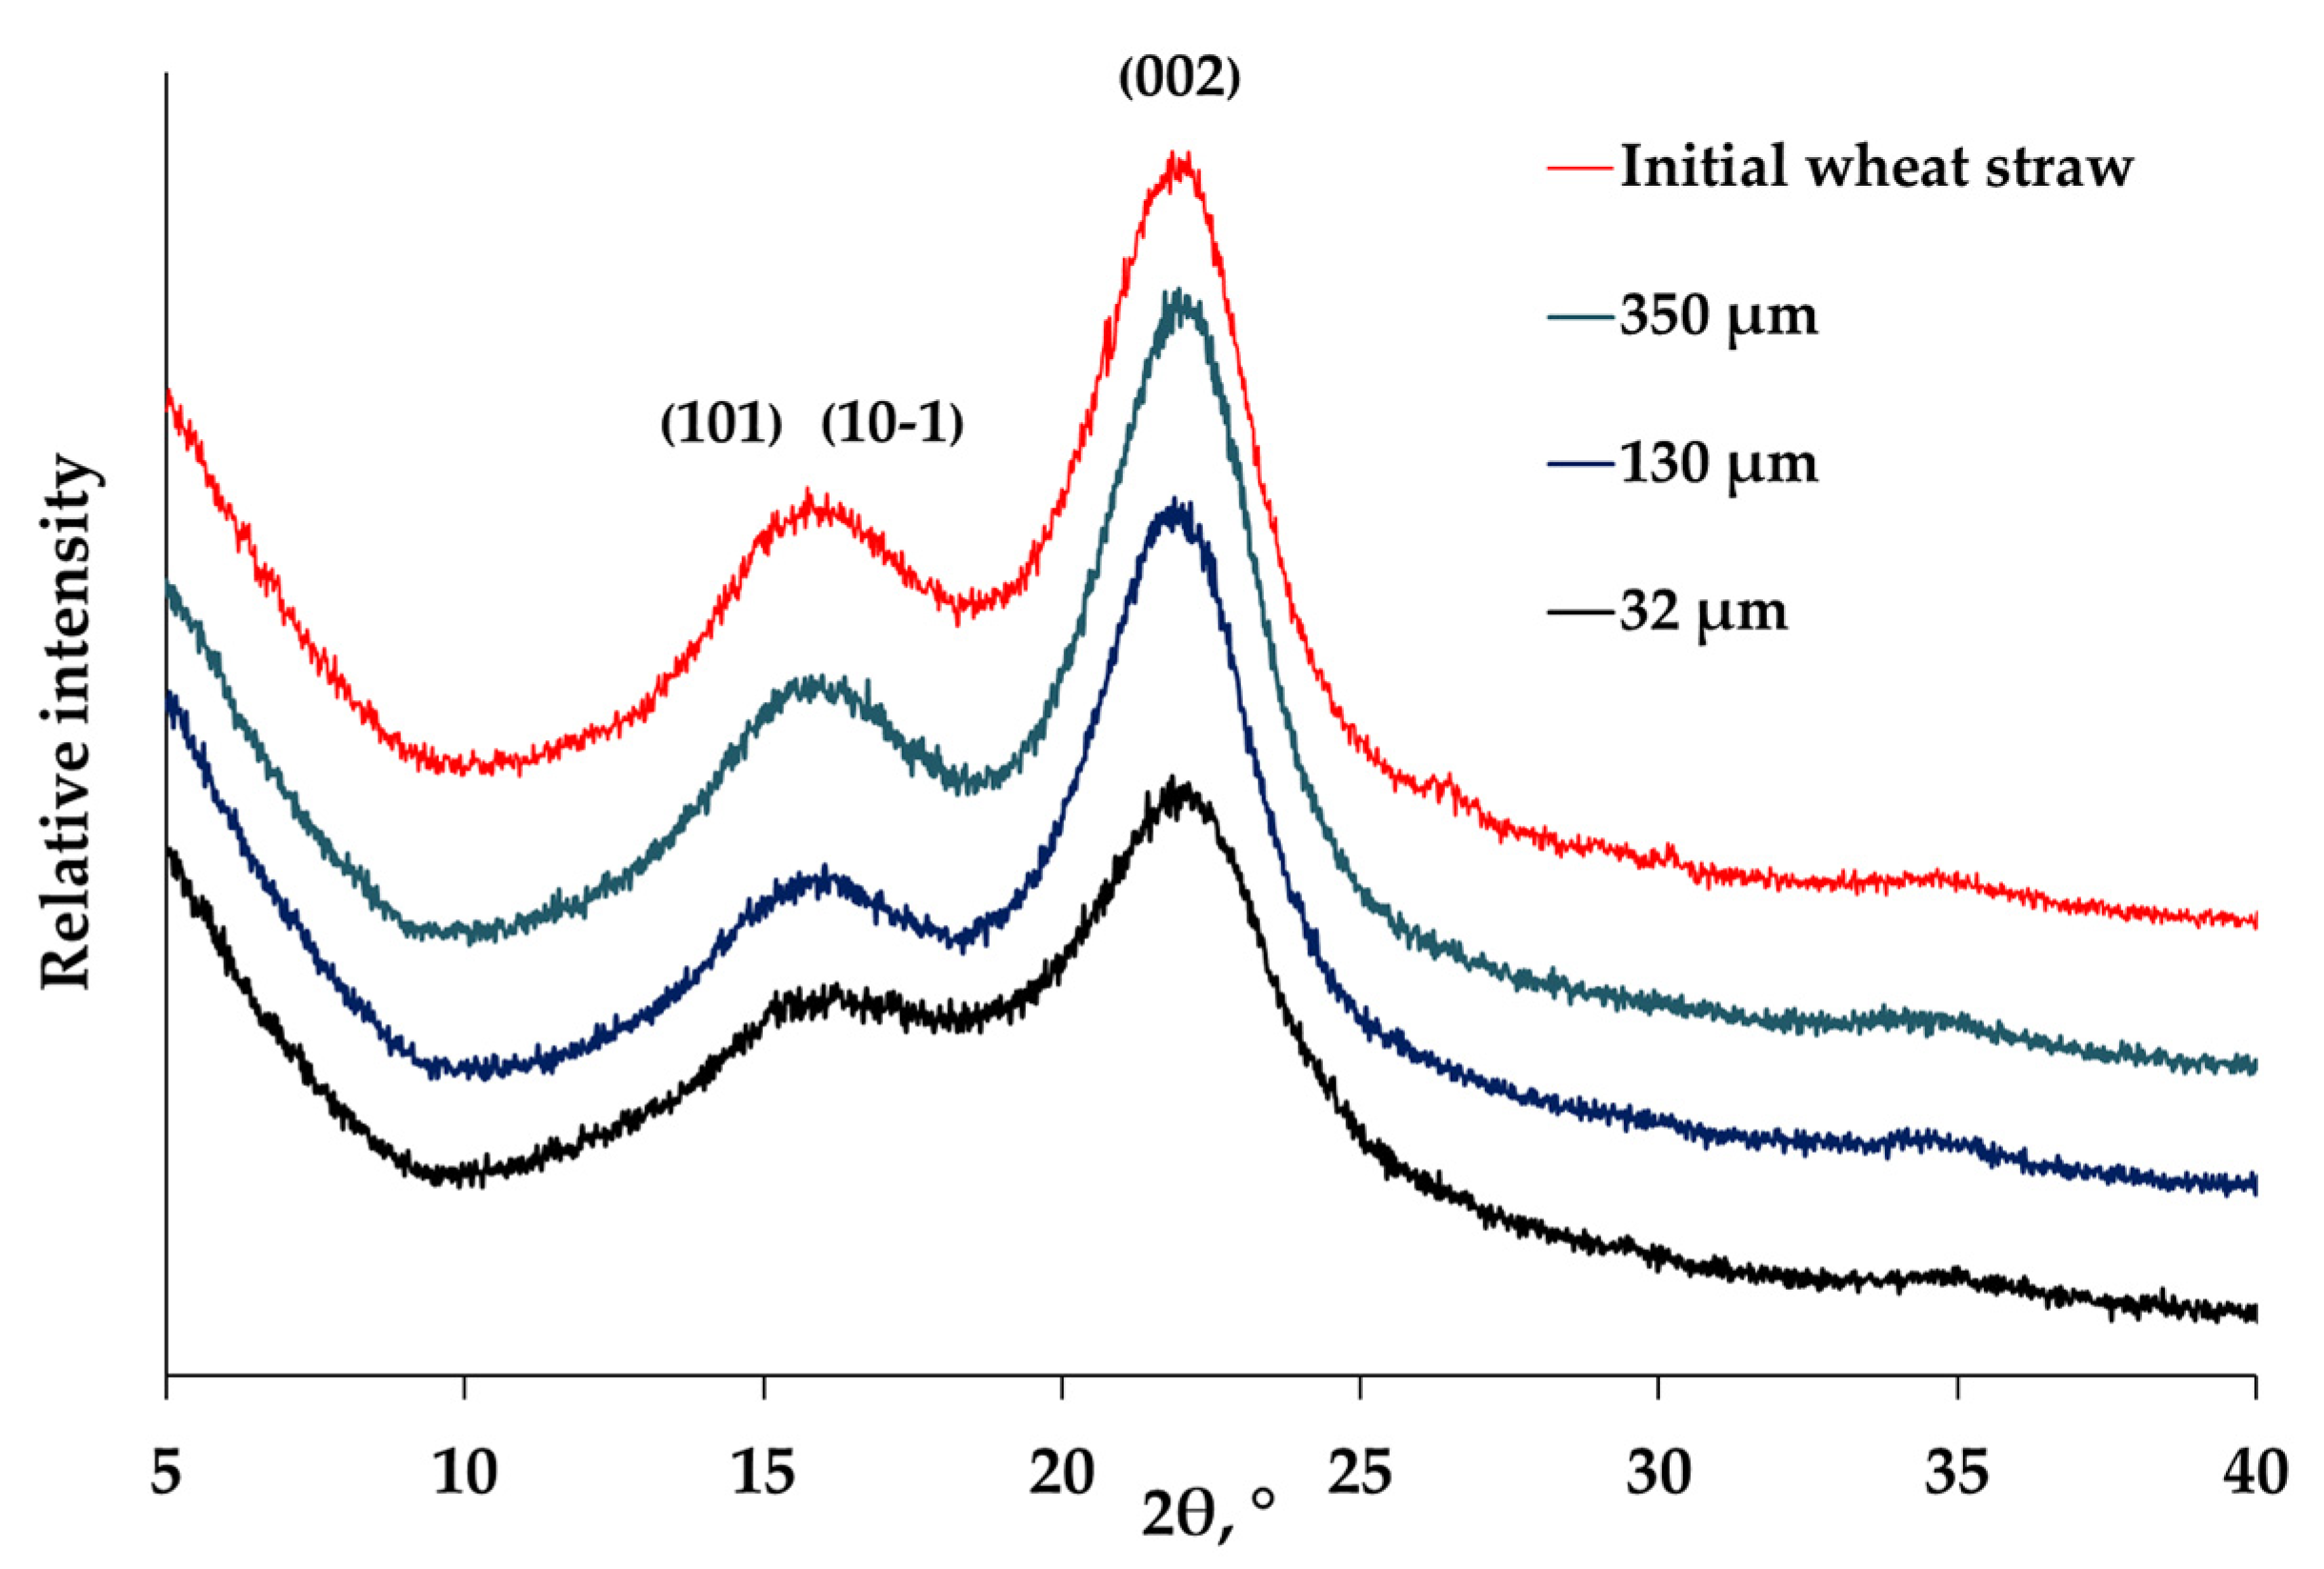
An analysis of the XRD patterns of the samples obtained at low temperatures revealed no significant changes; the crystallinity index remained within 60–65%. This proves that no significant changes are observed in the structure under the grinding conditions used, both at the level of the cell wall and its component, cellulose (
Figure 3). In special experiments involving grinding in a mill, changes in the crystalline structure of cellulose were determined and the crystallinity index of plant raw material cellulose was calculated using the Segal method. The crystallinity index was calculated from the ratio between the intensity of (002) reflection (crystallinity peak) and the intensity of the minimum between the (101) and (10–1) reflections (amorphism peak) as shown in ref [
16].
The obtained samples were saturated with resveratrol, and the kinetics of resveratrol extraction were studied (
Figure 4).
The data were calculated in rectifying coordinates using the Axelrud equation (Equation (5)) [
6,
17]. This equation is rather attractive because linearization in the indicated coordinates allows one to calculate the constant
Bi directly from the equation. Then it is possible to calculate the second constant,
µi. Consequently, by knowing the initial concentration of the substance in a particle
C0 and the concentration at time point
t (
C1), one can directly calculate
D without introducing additional variables. The constants obtained are presented in
Table 1.
Simeonov et al. [
18] used a similar mathematical approach to study the extraction of tobacco leaves and red geranium roots and obtained comparable constants of the processes. They mentioned that extraction inside the pores is one of the rate-limiting stages. The particle size (and, therefore, the pore size) is changed in our case, so it can be expected that characteristics of the process will also be changed. For small particles, the mass transfer constant is three orders of magnitude smaller than that for large particles. This suggests that at the quasi-equilibrium stage, resveratrol extraction is governed by different mechanisms depending on particle size. We assume that the main difference of extraction is that for large particles the main substance flow diffuses through conductive pores (cells of the conductive tissues) that are present in the plant material. It is the diffusion stage in the pores that is limiting. In small particles with a size of 32 μm, conductive tissue plays a smaller role, and diffusion through the cell wall to the solution is the main stage of the process (
Figure 5).
It was assumed in the model that the conductive pores (the channels) are located at a distance of 80 μm from each other as confirmed by the microscopic data. Based on this scheme, the mass transfer constant of resveratrol was calculated for average-size (130 μm) particles of average size using the equation:
where
R is the particle radius (μm);
RW is the distance traveled by resveratrol molecules in the wall (μm);
RP is the distance traveled in the pore and inside the cell (μm);
D is the mass transfer constant for a particle of a given size (1/s);
DW is the mass transfer constant for 32 μm particles (1/s);
DP is the mass transfer constant for 350 μm particles (1/s).
The diffusion constant of 3.1 × 10⁻² calculated using Equation (6) is slightly different from the experimental value (3.5 × 10⁻²). This confirms our assumption that the extraction mechanism is different.
3.2. Studying the Effect of the Degree of Cellulose Structure Disordering on the Mass Transfer Constants
Since the extraction mechanisms differ for small and large particles, cell wall disordering can affect them in different ways. The influence of the disordering degree of cellulose, the crystalline component of the cell wall, on the mass transfer constants was studied. Particles having the same size but varying in their crystallinity index were obtained by mechanical processing of plant materials, followed by separation of particle fractions with a certain size. The disordering degree was controlled by XRD. The data are listed in
Table 2.
Table 2 demonstrates that for small particles, the effective mass transfer constant increases approximately eightfold as the cellulose crystallinity index decreases from 65% to 33%. The decrease in the cellulose crystallinity index apparently characterizes disordering of the entire cell wall. The limiting stage of mass transfer for small particles is diffusion through the cell wall, whose disordering accelerates the mass transfer. For large particles, conversely, reduction of the crystallinity index of cellulose leads to a drop in the mass transfer constant. Since mass transfer in the pores (channels) is the limiting stage of mass transfer for large particles, it is fair to assume that these channels collapse upon prolonged mechanical processing of large particles. This explanation is consistent with the fact that fragile cellulose is the predominant component of elongated conductive cells compared to other cells in the straw tissue, so these cells are less strong.
The mass transfer constants are virtually comparable for large and small particles at high degrees of disordering (CI = 30%). After such mechanical treatment and the respective cellulose disordering, conducting pores (channels) disappear almost completely, and diffusion through cell walls becomes the main stage.
Therefore, two contra directional processes were identified. The first one is cell wall disordering facilitating the diffusion; the second one is the collapse of conductive pores, which impedes the diffusion.
Miller et al. [
19] demonstrated that the interaction between polyphenols and cell wall components during diffusion through the cell wall is the most plausible mechanism causing an abrupt decline in the mass transfer constant in non-porous structures.
3.3. Mathematical Modeling of the Extraction Process
In accordance with the data on changes in mass transfer constants depending of the cellulose crystallinity index for particles with sizes of 32 and 350 μm, linear dependences were plotted in the range of observed crystallinity indices of 25–65%. The dependence between the diffusion coefficient and the cellulose crystallinity index for particles 130 μm in size was calculated using these dependences.
Figure 6 shows that the dependence has a maximum corresponding to the crystallinity index of 42%. At higher crystallinity indices, the mass transfer decreases as diffusion through the cell wall is impeded. A drop in mass transfer is observed at crystallinity indices <42% due to the disappearance of pores.
The disappearance of pores for particles with a crystallinity index lower than 42% is an assumption made from the resulting model. So, the diffusion constant for small particles is comparable to that of substances in the solid phase. This suggests that diffusion through the cell wall is the limiting stage of the process.
It should be noted that it was experimentally shown in refs [
7,
20] that during extraction under conditions of pulsating pressure, extraction acceleration takes place only for particles larger than 300–400 μm. On the contrary, this effect is not observed for smaller particles. This fact additionally confirms that diffusion mechanism in plant raw materials changes as particle size decreases below 300 μm. We have shown that the mass transfer constant in plant raw materials also correlates with the crystallinity index of cellulose, one of the most common parameters of the degree of ordering of plant raw materials. Therefore, we make an assumption that it is the disordering of the pore walls and their subsequent collapse that lead to a drop in the mass transfer constant.
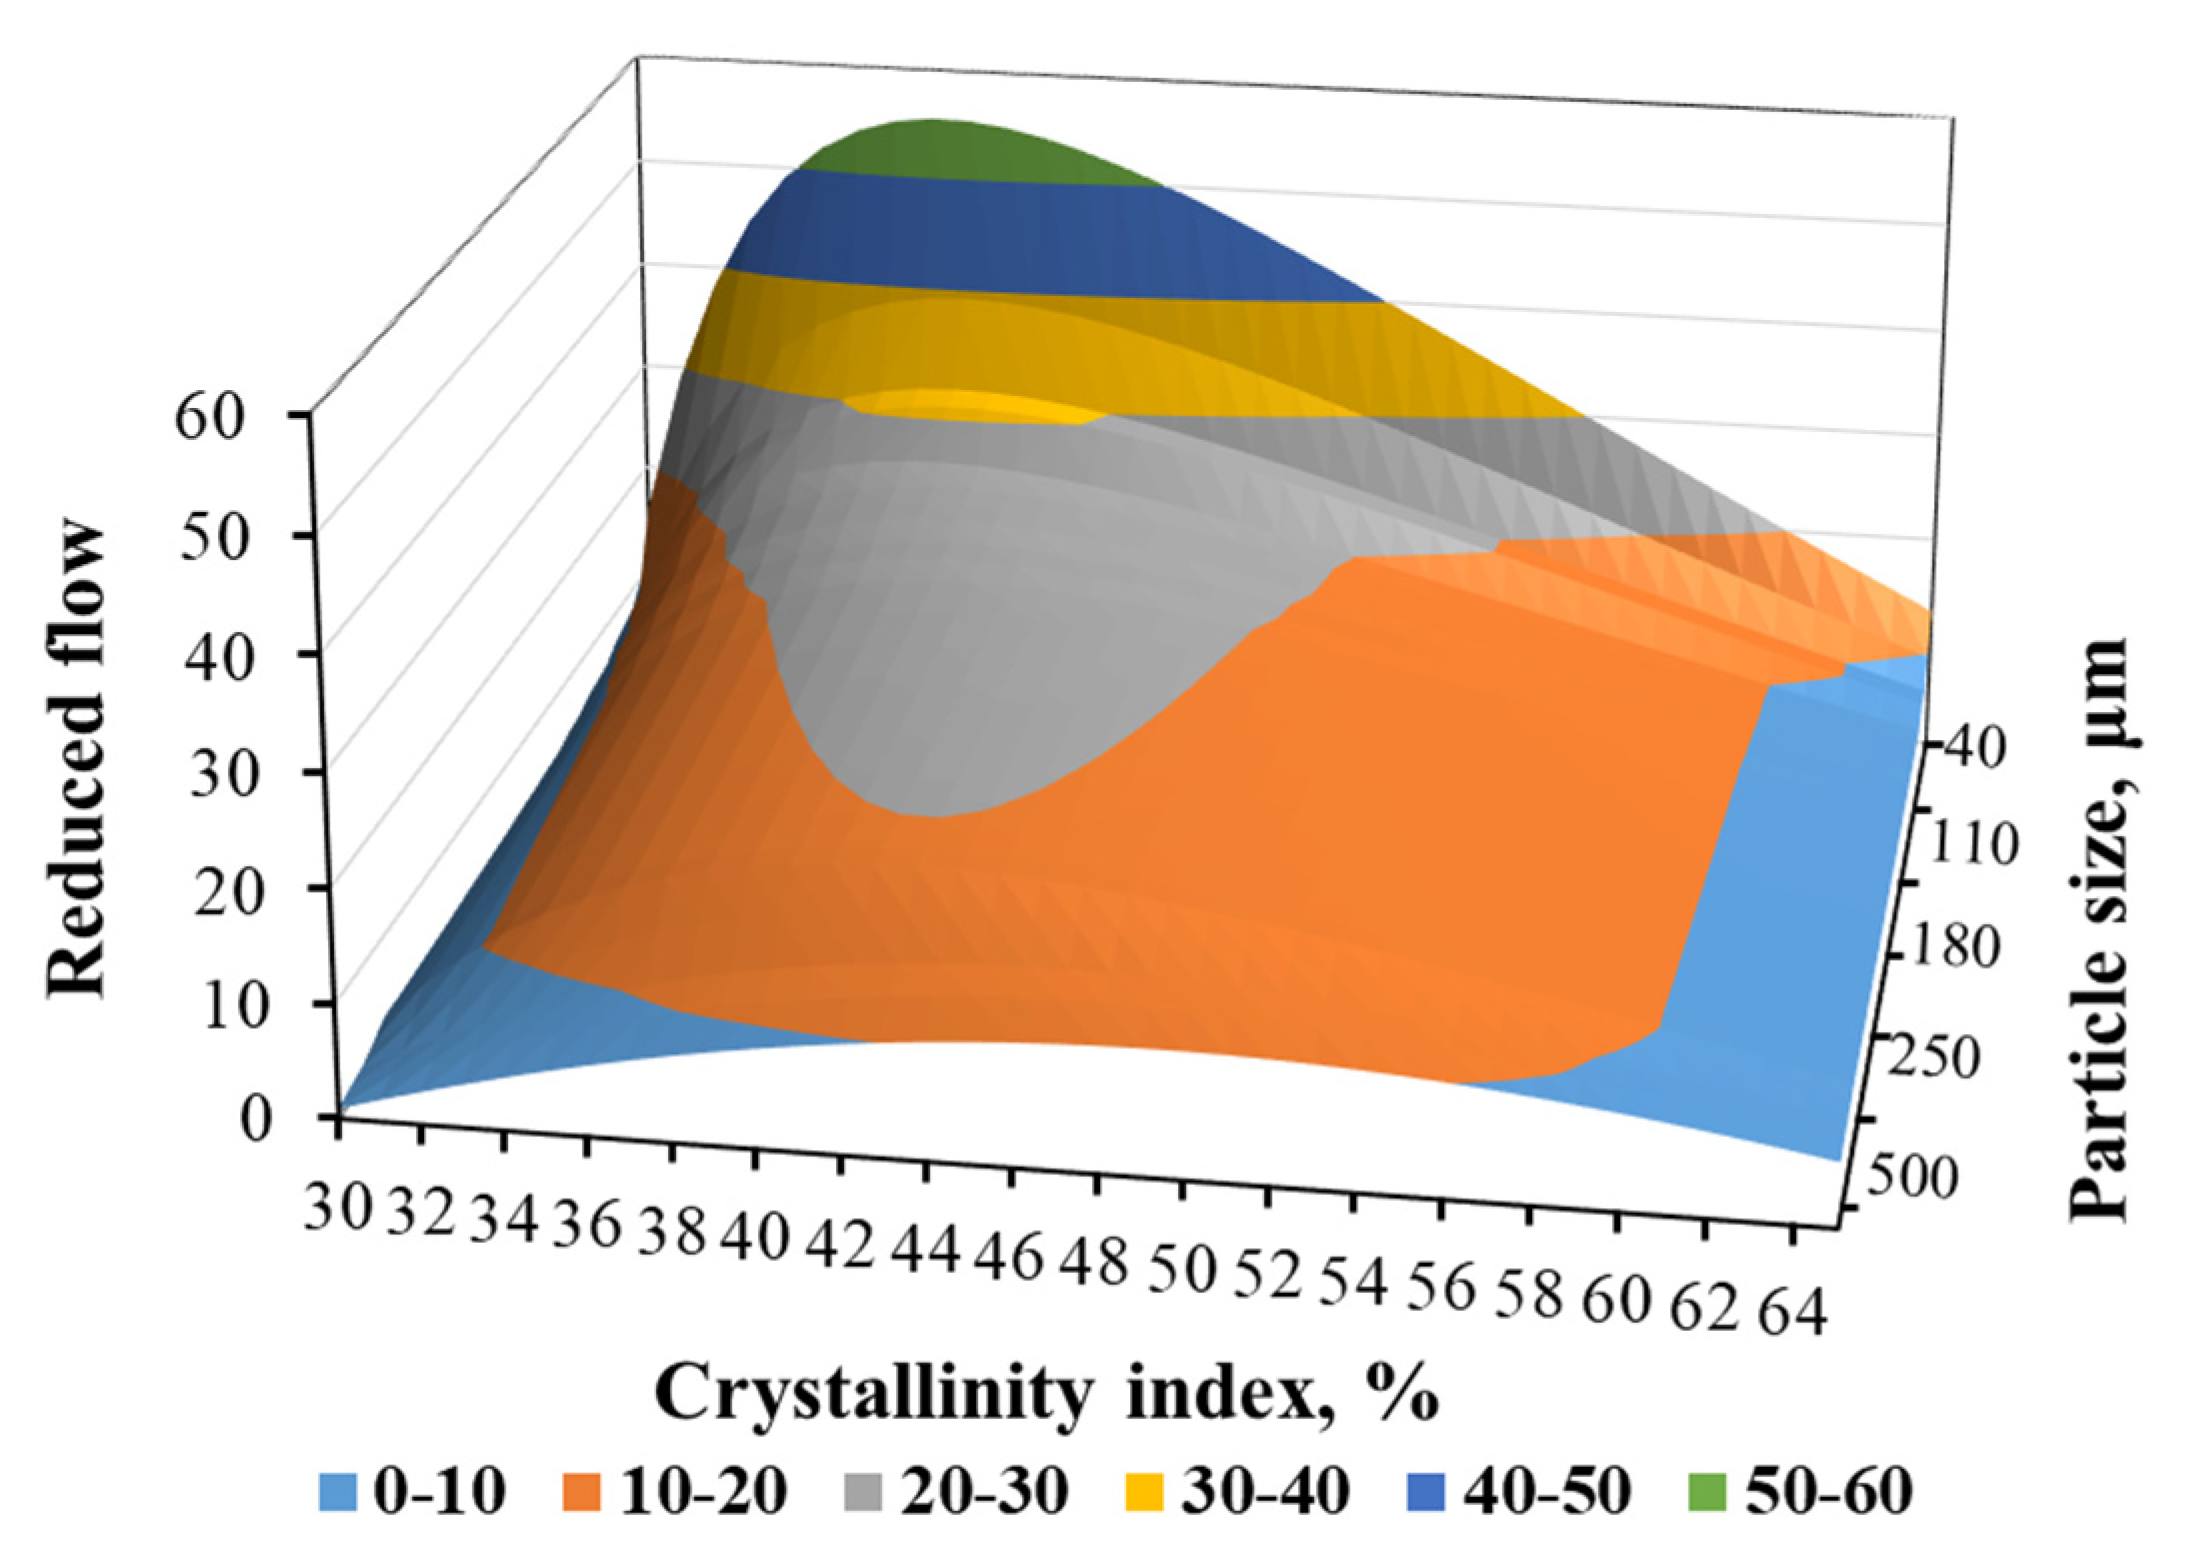
The mass transfer constant depending on the particle size (40–350 μm) and the cellulose crystallinity index (25–65%) was calculated. According to the data obtained, the substance flow of 1 g of particles of a certain size was calculated under the assumption that particles have an identical density. This dependency is shown in
Figure 7.
One can also see that the dependence between the flow and the crystallinity index is dome-shaped within the entire simulated range. There is also an inverse dependence between the flow and the particle size, being consistent with the conventional observations that the smaller the particles, the better the extraction (with the optimal particle size) is.
The particle size and crystallinity index of cell wall cellulose influences the mass transfer constant to various extent. Particle size begins to significantly affect only small particles (<80 μm), while the crystallinity index strongly influences mass transfer constant within the entire range. Apparently, the pores (channels) for diffusion through the entire volume of the particle disappear as the crystallinity index decreases to 42%, and the scheme of diffusion flows changes.
4. Conclusions
It has been shown that resveratrol can be used to study the kinetics of extraction from porous plant matrices due to its stability and moderate dissolution rate. Particle size and the degree of cell wall disordering significantly affect the process of mass transfer in the particle during extraction. The proportion between the effects of these two parameters varies with particle size. For large particles, the limiting stage of the process is diffusion through conductive pores. For small particles, the limiting stage is diffusion through the cell wall. For particles of medium size (about 130 μm), both stages of the process—diffusion through the cell wall and diffusion in the pore—make an equivalent contribution. Under conditions of an optimal balance of these factors, an increase in the flow of matter by 3–7 times is observed compared with ordered initial particles. The discovered effect can be used in the technology of plant extraction to increase the rate and yields of extractable substances.
Thus, it is shown that during mechanical treatment of plant raw materials one needs to take into account both the particle size and the changes in the internal structure of the raw material. This becomes especially important for particles smaller than 300 μm (in this case, it is almost impossible to perform grinding without changing the raw material structure). The too vigorous mechanical treatment can dramatically reduce the extraction rates.
It is also worth noting that the approach for adding an endogenous substance and studying its extraction described in this article can be used not only to investigate the extraction rates of the components from raw materials but also to characterize the raw material structure. The obtained diffusion constants characterize the structure of the raw material and can be used for other processes (e.g., when modeling the diffusion of chemical reagents into particles, during chemical modification of lignocellulosic materials, or hydrolysis). The described approach is an additional technique for characterizing plant raw materials along with the microscopic, Brunauer–Emmett–Teller (BET), and diffraction methods. In the future, the authors of the article plan to study the correlation between the resultingdiffusion constants and the reactivity of the materials obtained during hydrolysis.


