Article

Improving the Inner Surface State of Thick-Walled Tubes by Heat Treatments with Internal Quenching Considering a Simulation Based Optimization

Institute for Applied Materials (IAM-WK), Karlsruhe Insitute of Technology (KIT), Engelbert-Arnold-Str. 4, 76131 Karlsruhe, Germany
*
Author to whom correspondence should be addressed.
Processes 2020, 8(10), 1303; https://doi.org/10.3390/pr8101303
Submission received: 15 September 2020 / Revised: 2 October 2020 / Accepted: 5 October 2020 / Published: 16 October 2020
(This article belongs to the Section Materials Processes)

Abstract

:
Internal Quenching is an innovative heat treatment method for difficult to access component sections. Especially, the microstructure, as well as the residual stress state at inner surfaces, of thick-walled tubes can be adjusted with the presented flexible heat treatment process. Based on multiphysical FE-models of two different steels, a simulative optimization study, considering different internal quenching strategies, was performed in order to find the optimal cooling conditions. The focus hereby was on the adjustment of a martensitic inner surface with high compressive residual stresses. The simulatively determined optimal cooling strategies were carried out experimentally and analyzed. A good agreement of the resulting hardness and residual stresses was achieved, validating the presented Fe-model of the Internal Quenching process. The shown results also indicate that the arising inner surface state is very sensitive to the transformation behavior of the used steel. Furthermore, the presented study shows that a preliminary simulative consideration of the heat treatment process helps to evaluate significant effects, reducing the experimental effort and time.

Graphical Abstract

1. Introduction

1.1. State of the Art

In high pressure technology, the use of high-strength steels, as well as precision machining, is necessary to ensure a reliable performance of pressurized components. At the end of a complex manufacturing process, parts of common rail systems, high pressure hydraulic lines, gun barrels, or water jet cutting systems are usually strengthened through the autofrettage process [1,2,3]. Here, compressive residual stresses are induced at inner surfaces by plastification, enhancing the fatigue life. Due to its relatively simple handling the autofrettage is one of few established strengthening treatment of difficult to access inner surfaces. Considering strengthening techniques of steels, the contribution of compressive residual stresses in the critical components sections is only one of many others. Regarding conventional surface heat treatment methods, like case hardening, induction hardening, or laser hardening, surfaces are strengthened not only by inducing compressive stress in the surface. Here, the material properties are also improved by creating a martensitic microstructure, which results in a higher tensile strength. In case hardening, the parts are carburized between 850 C and 950 C in a CO-emitting atmosphere. After quenching, high carbon martensite and also high residual stresses can be achieved, which result in good fatigue and wear properties [4]. A disadvantage of this process is that no accurate and reproducible surface state can be achieved due to the fact that parts are carburized in a batch, which can lead to different process conditions [5,6]. In contrary, parts are treated separately during induction and laser hardening. One main advantage of these processes is the localized heating provided by induction or the high intensity laser beam resulting in efficient short austenitization times [7,8]. So far, none of the mentioned heat treatment methods is applicable to hard accessible inner surfaces. Furthermore, a standard quench and tempering process of the entire component will not lead to the desired inner surface states and entails possible quench cracks. The presented heat treatment method Internal Quenching, focusing on hard accessible inner surfaces, derives from the heat treatment Intensive Quenching developed by [9,10], where parts are homogenous austenitized and quenched over extremely high cooling rates, decreasing the probability of cracks and distortion. By using a high pressure water flow during quenching, heat transfer coefficients over 20.000   W / m 2 K can be reached, enabling beneficial heat treatment methods, increasing/inducing compressive residual stress at the surface [11,12]. The Internal Quenching heat treatment method bases on induction heating and a local intensive water quenching process at the inner surface of thick-walled tubes. The beneficial effect of this process is based on a hardened martensitic microstructure in combination with compressive residual stresses. Due to that, the effort of the mechanical finishing is reduced or the fatigue resistance of high pressure steel components can be increased as it is shown in [13], where the development and the influence on fatigue properties of residual stresses induced by heat treating is described.

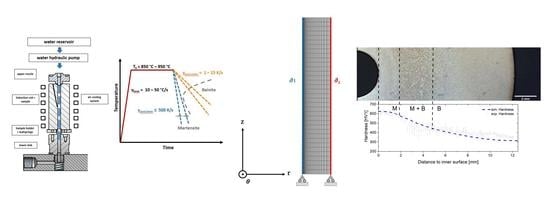
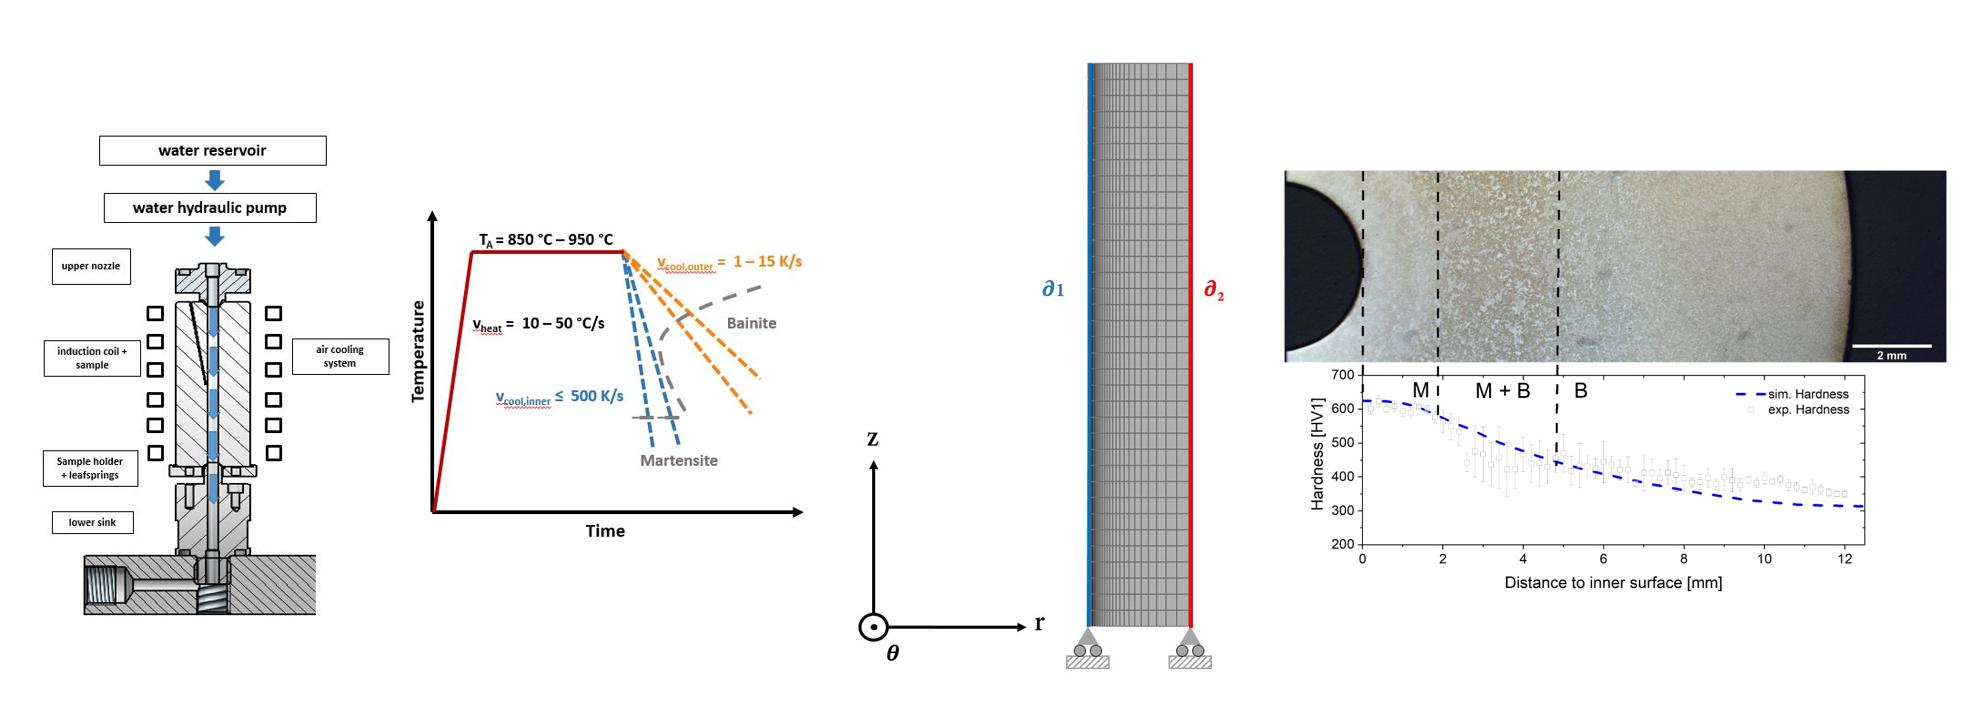
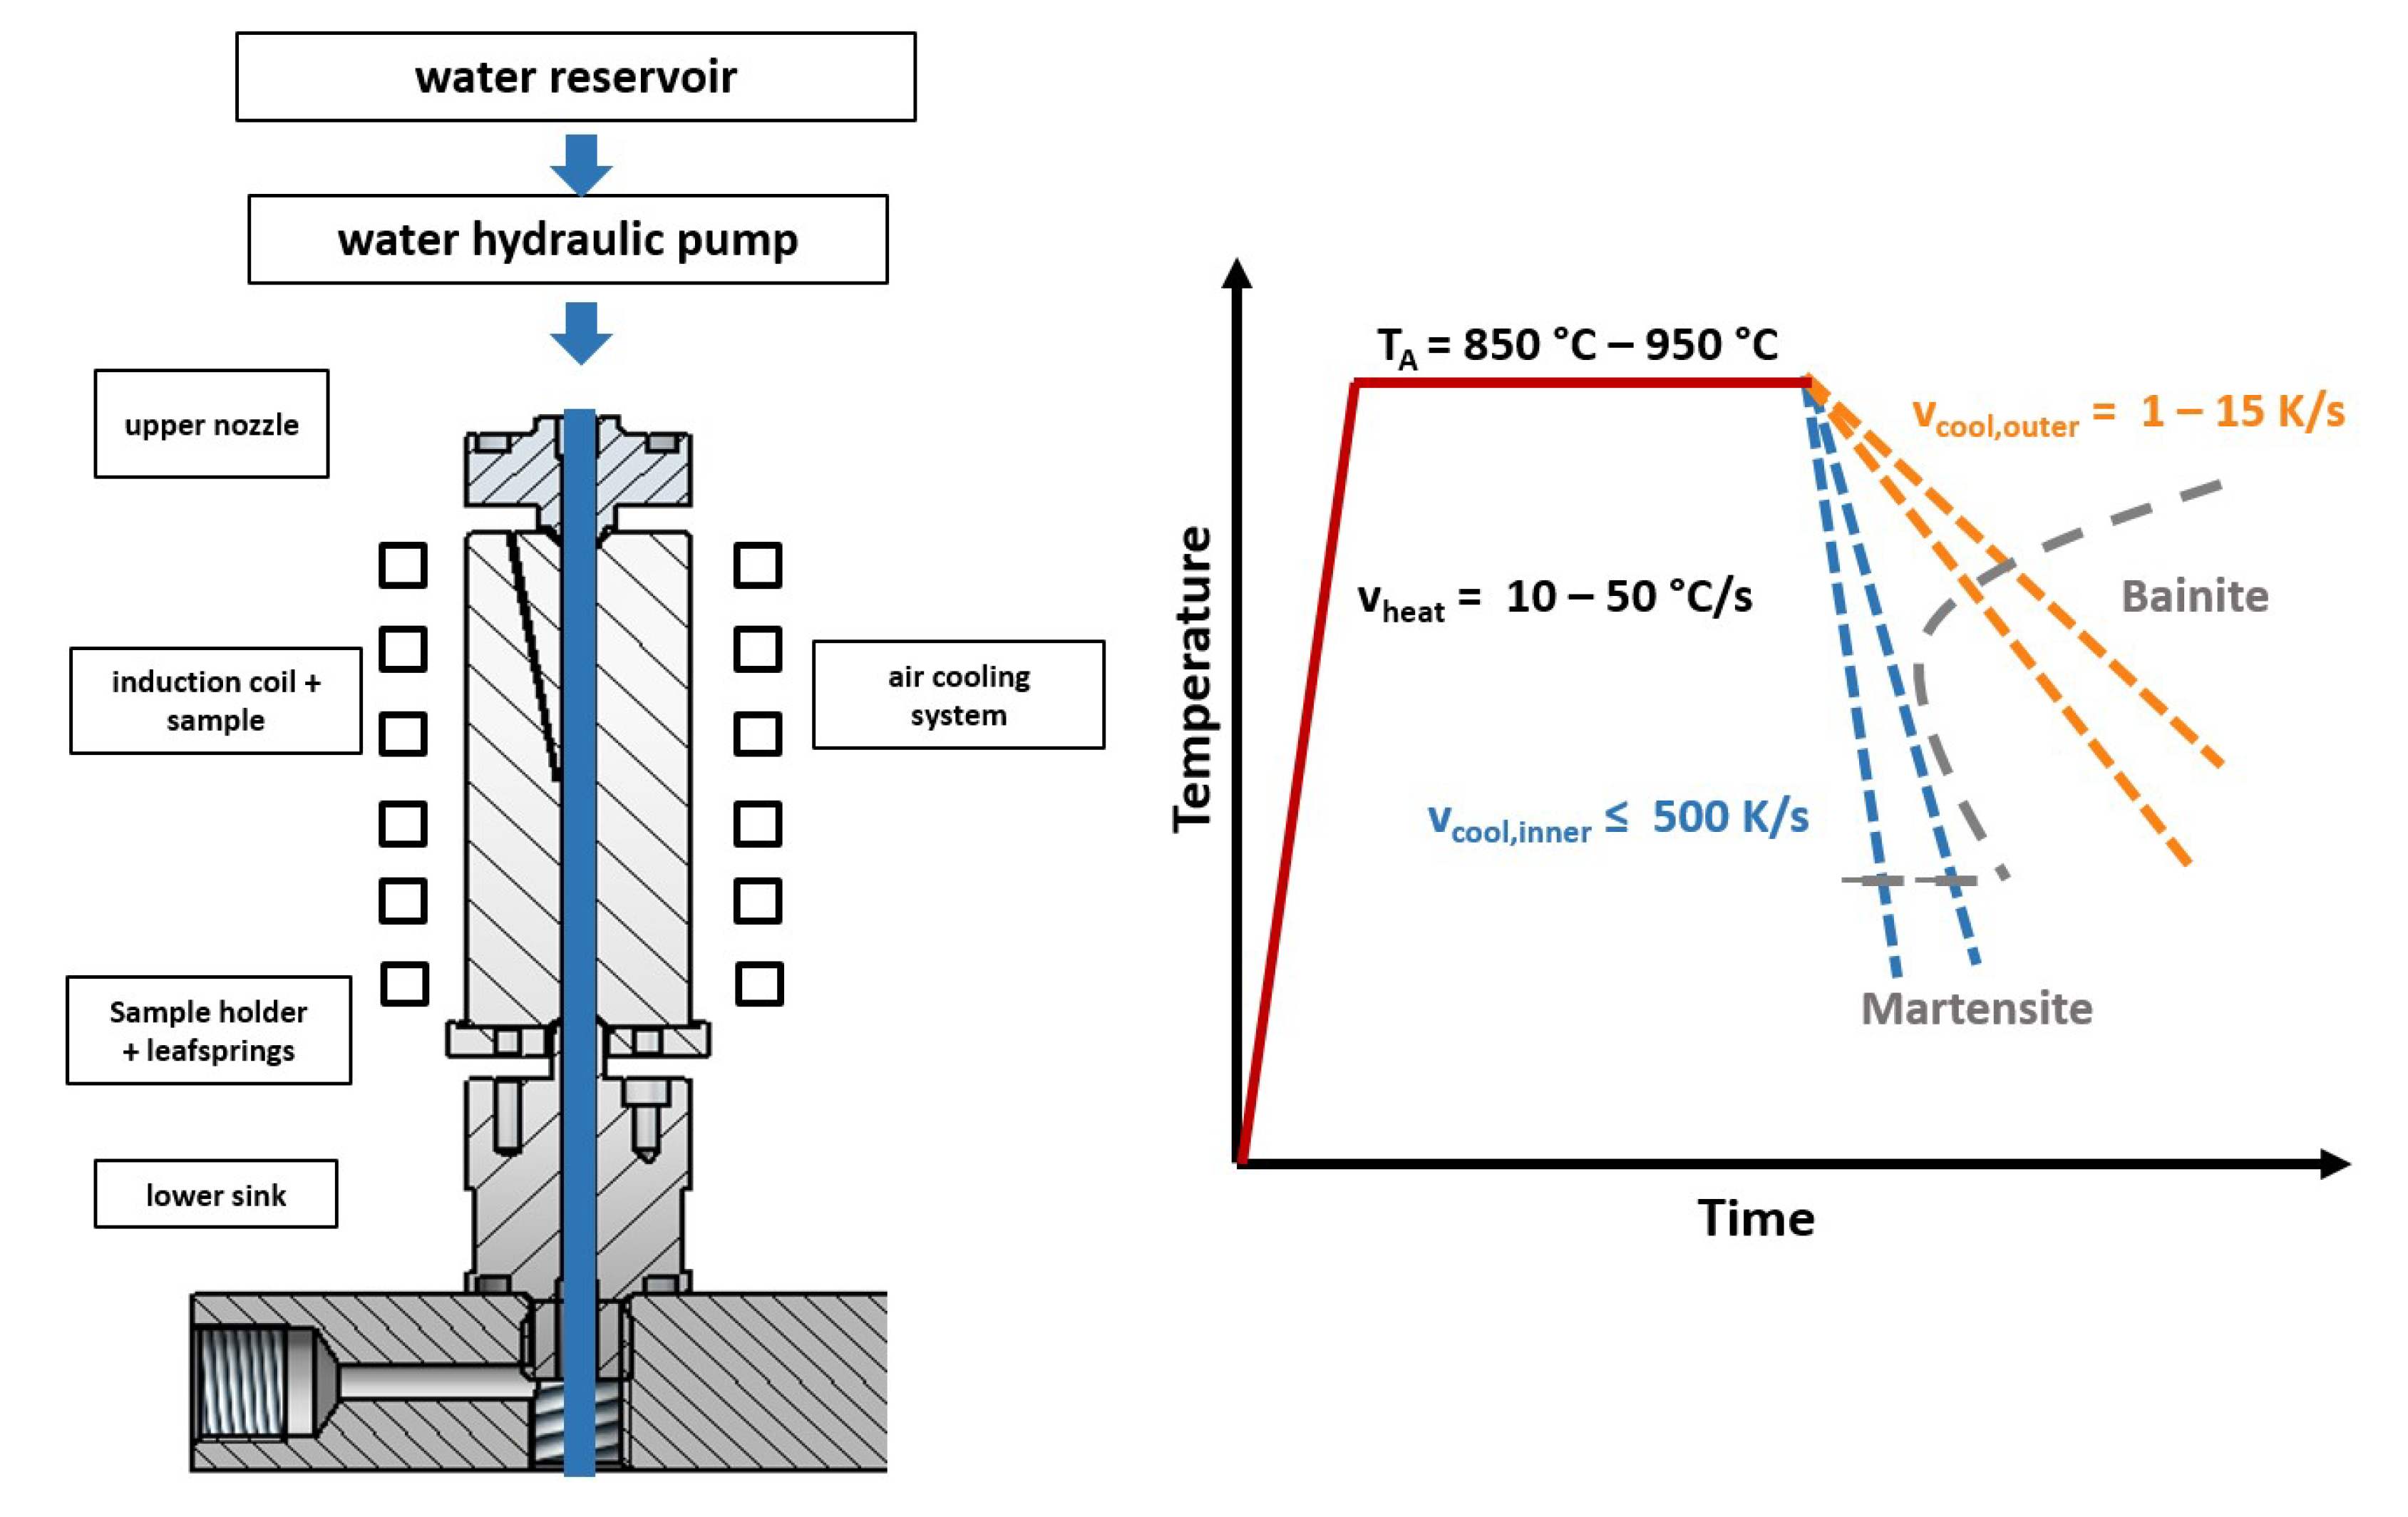
1.2. Internal Quenching

During the Internal Quenching process, inductively austenitized thick-walled tubes are cooled down from the inside by pressurized water, flowing through the drilling by a proportional valve (see Figure 1). During the inner cooling, a simultaneous heating/cooling of the outer surface is possible via inductive heating and an air cooling system. With these control possibilities, the process becomes very flexible and various heat treatment strategies can be realized to adjust the microstructure, as well as the residual stress state at the inner surface.
A detailed description of the Internal Quenching device and experimental results of a feasibility study using a Chromium-Molybdenum steel AISI 4140 are shown in [14]. On the one hand, very high cooling rates can be achieved by adapting the flow rate of the water, resulting in a through hardened sample with hardening cracks at the inner surface. On the other hand, it was shown that a completely controlled cooling of the inner and outer surface results in a crack-free martensitic inner surface and a nearly bainitic structure in the outer sections. Besides the experimental results, first simulative results were shown to understand the stress development and the crack probability during the process. First comparisons of the experimentally determined residual stresses with the simulative results indicate that compressive residual stresses can be achieved by optimizing the cooling conditions. Considering the residual stress state at the inner surface, it was shown that the most influencing factors are the bainite content in the outer sections, as well as the cooling conditions at the inner surface. Considering further investigations, it was mentioned that the simulation model can be used as an optimization tool to adjust the inner surface state. In order to make reliable predictions, a comprehensive validation of the heat treatment simulation, regarding the residual stress analysis, as well as the metallographic investigations, is necessary.

1.3. This Work

This work will describe the Internal Quenching heat treatment simulation model, based on the thermal, mechanical and metallurgical models. In addition, dilatometry was used to investigate the relevant metallurgical properties. With the presented simulation model, an optimization of the Internal Quenching process parameters is made. With the simulative parameter variation, different cooling strategies are developed to achieve a hardened inner surface with maximimum compressive stresses. The simulative optimization is done with the Chromium-Molybdenum steel AISI 4140 and the unalloyed steel AISI 1045, which differ mainly in their hardenability. The optimal cooling strategies of both steels are then implemented on the Internal Quenching device and the heat-treated samples are characterized and compared to the simulative results.

2. Materials and Methods
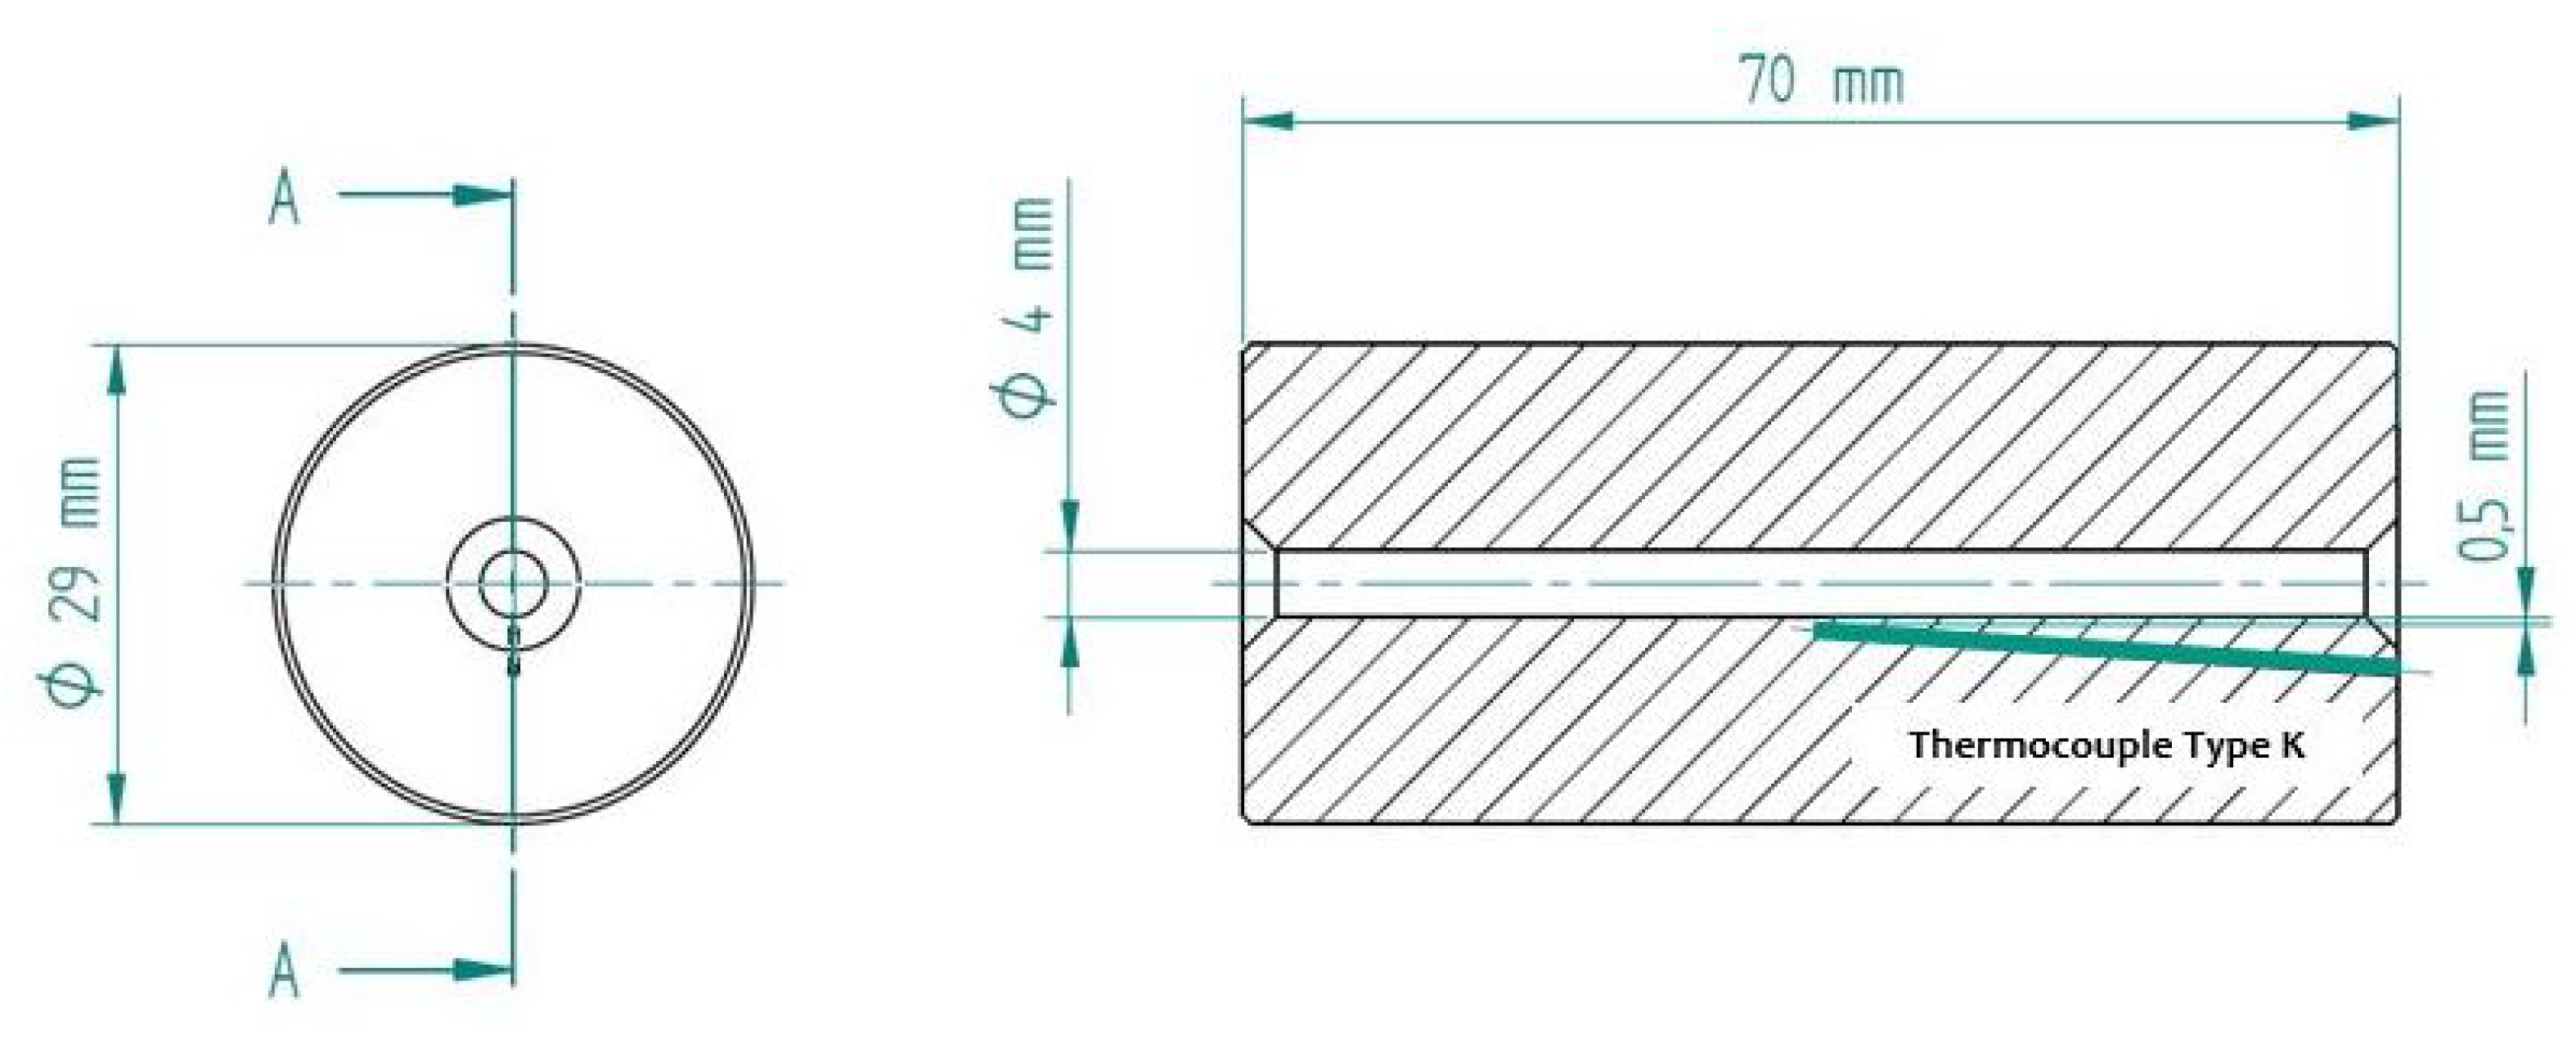
2.1. Samples

For the Internal Quenching experiments thick walled tubes with a length of 70 mm were used. The sample geometry is shown in Figure 2. The shown thermocouple with a distance of 0.5 mm to the inner surface was used to control the temperature at the inner surface. The chemical compositions of both steels are given in Table 1.

2.2. Internal Quenching Heat Treatment

The Internal Quenching heat treatments were carried out on a prototypic device using a Huettinger Axio 10/450 M high-frequency generator with a frequency range from 50 kHz up to 450 kHz and a maximum power of 10 kW. The quenching of the inner surface was realized by using a high pressure piston pump with a maximum pressure of the quenching media of 100 bar. The temperature of the outer surface was measured with a spot-welded thermocouple type K at a height of 35 mm.

2.3. Metallographic Characterization

The heat-treated samples were cut in the middle and the resulting cross section was ground with P320 paper and subsequently polished with diamond suspensions. The hardness was measured after a polishing step of 3 μ m using the hardness tester Qness Q10A with a testing load of 10 N. The microstructure was analyzed after polishing with 0.04 μ m, followed by an etching step with 2% Nital etchant.

2.4. Residual Stress Measurement

2.4.1. X-ray Diffraction Analysis

The residual stress states were determined at the outer surface along a path over the height of the sample. Additionally, depth resolved analyses were performed at the inner surface of a cut sample in the center of the borehole. The depth resolved residual stress analyses were carried out by sub-sequential electrochemical material removal using the STRUERS LectroPol-5 polishing device. The residual stresses in axial, as well as in tangential direction were determined using the sin 2 ( ψ ) X-ray diffraction method with E 211 = 219,911 MPa and ν 211 = 0.28 extracted from [15]. A ψ -diffractometer and V-filtered C r K α radiation were used to measure the 211 α -Fe diffraction line at 15 ψ angles between 60 and 60 . In the case of the measurements on the outer surface, the primary beam was collimated using a pinhole with a diameter of 1 mm. On the secondary side, a scintillation counter with a 4-mm symmetrizing slit was used. For precise measurements in the borehole, a focusing polycapillary optics with a nominal focus diameter of 0.1 mm was used.

2.4.2. Sachs Boring/EDM
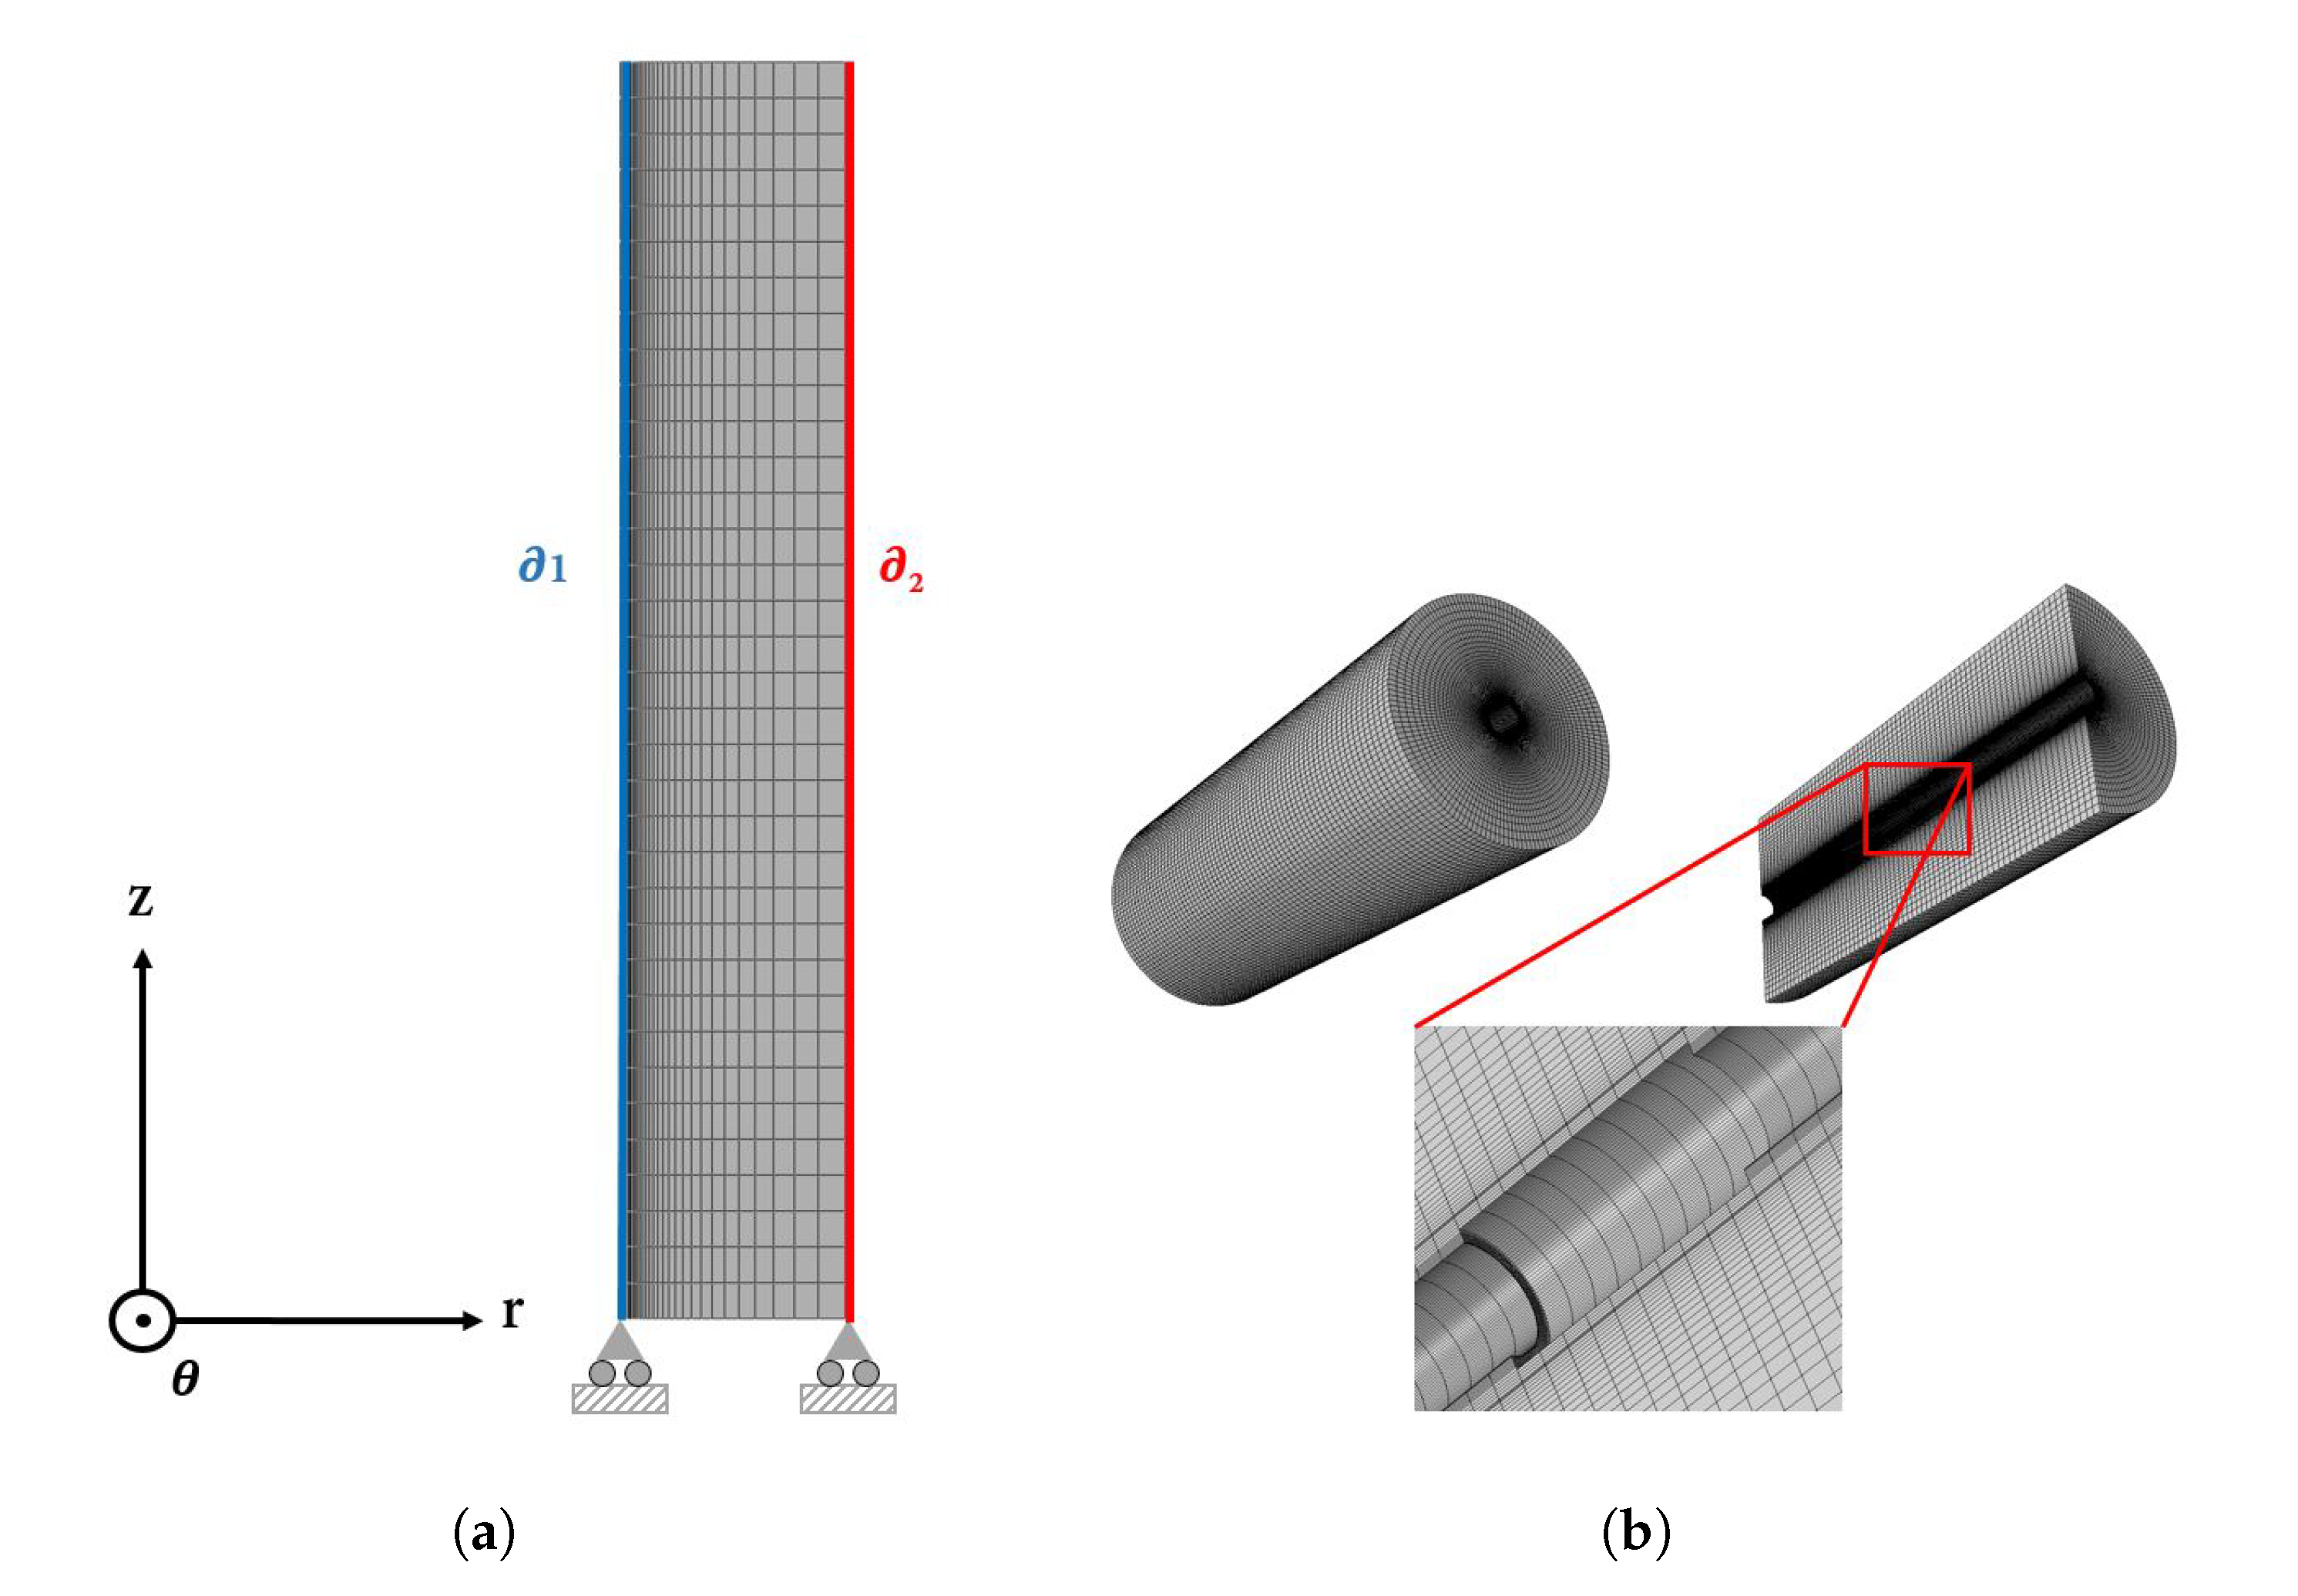
The Sachs Boring method is a widely used destructive method to determine axisymmetric residual stresses in tubes. During the Sachs method, tubes are sequentially bored to a larger diameter. After each bore step, the tangential and axial strains on the outer cylindrical surface are measured. With the measured strains, the Young’s modulus, Poisson’s ratio and resulting area of the cross sections, the residual stresses in axial and tangential, as well as in radial direction can be calculated using formulae given in [16]. Due to the fact that the inner surface will have a hardness over 600 HV after the quenching process, it is hard to remove material with conventional drilling. Given that, the incremental material removal was realized over wire electro-discharge machining with the advantage that the borehole is not mechanically and less thermally loaded during the material removal. The removal was realized using a wire with a diameter of 0.25 mm. Up to a diameter of 8 mm, the borehole was drilled out with incremental steps of 0.5 mm. Afterwards, the steps were increased to 1 mm and after reaching a diameter of 12 mm, they were increased once again to 2 mm. The strains were measured over three 2-element strain gauges from TML Ltd., Japan (Type: FCAB-2-11-3LJB-F), which were applied in the middle of the sample every 120 . The strain gauges were protected with a polyurethane coating and silicon.

3. FE-Simulation

3.1. Model

The commercial FE-solver Abaqus/Standard was used for the simulation of the Internal Quenching heat treatment. All relevant models considering the thermal, metallurgical and mechanical phenomena were used to reveal an accurate tool to predict the phase and residual stress distribution due to the Internal Quenching process. The mechanical and thermal models were used in the same manner as presented in [17,18], where the process of induction hardening in a simulative, as well as in an experimental manner for AISI 4140 was regarded. Here, the heat transfer during heat treatment is described using the heat conduction equation
ρ c T ˙ = · ( ( λ T ) ) + Q ,
where ρ , c and λ are density, specific heat and thermal conductivity of the current phase mixture. The arising transformation heat are considered over Q, which is a function of the transformation rate. The mechanical model bases on the sum of the strain increments occurring during a quenching process. The total strain increment ϵ ˙ i j t o t is given as
ϵ ˙ i j t o t = ϵ ˙ i j e + ϵ ˙ i j p + ϵ ˙ i j t h + ϵ ˙ i j t p + ϵ ˙ i j t r ,
with ϵ ˙ i j e , ϵ ˙ i j p , ϵ ˙ i j t h , ϵ ˙ i j t p , ϵ ˙ i j t r as the elastic, plastic, thermal, transformation induced plasticity and the transformation strain rate. Considering the elasto-plastic material behavior, the elastic strain increment is described by
ϵ ˙ i j e = 1 E [ ( ( 1 + ν ) σ i j δ i j ν σ m m E ) E ˙ + ( σ i j δ i j ν σ m m ) ν ˙ + ( 1 + ν ) σ ˙ i j δ i j ν σ ˙ m m ] .
The plastic strain rate is calculated using the consistent tangent operator via a radial return mapping algorithm and the non-linear Voce hardening law (Equation (4)) for the phase-dependent flow stress in a UMAT subroutine. σ 0 , R 0 , R 1 and e in the hardening law are hereby phase-dependent parameters for the hardening behavior.
σ y = σ 0 + R 0 ε p l + R 1 ( 1 exp ( e ε p l ) ) .
The thermal strain increment ϵ ˙ i j t h is calculated via
ϵ ˙ i j t h = k = 1 p ( f ˙ i 0 T α k · d T + f k α k T ˙ ) ,
where α i represents the phase specific thermal expansion coefficient, f ˙ k the phase increment and f k the current phase fraction, respectively. The volumetric strain increments ϵ ˙ i j t r due to phase transformation are considered by
ϵ ˙ i j t r = k = 1 p 1 3 δ i j Δ ε k f ˙ k ,
with the phase specific transformations strain Δ ε k . The transformation induced plasticity increment is calculated by using the approach of [19]
ϵ ˙ i j t p = 3 k = 1 p K k ( σ ) f ˙ k ( 1 f k ) σ i j ,
with K k as the phase-dependent linear TRIP constant. An axisymmetric 2D-model with elements of the type C3D8T was used (see Figure 3a). At the inner surface, the elements have a size of 10 μ m in radial and 1 mm in axial direction. In radial direction, the size of the elements increases gradually up to 1   mm . To reduce the simulative effort, the model only considers the cooling process, with the assumption of a homogeneous temperature distribution after the austenitization process. So, the initial temperature in the model is set to 850   C starting from the austenitic phase. The cooling of the inner borehole and the cooling/re-heating of the outer surface was realized using the temperature boundaries ϑ 1 and ϑ 2 (see Figure 3). In the case of an uncontrolled cooling of the inner surface, the heat flux q ˙ from the inner surface was modeled using Equation (8), with the surface temperature T s , the quenchant temperature T q and the heat transfer coefficient α . Based on the findings in [14], a constant heat transfer coefficient was chosen. To validate the simulative residual stress state at the borehole with the results of the X-ray analysis, the cutting process, as well as the electrolytic removal, were simulated. Here, a purely elastic model of the complete tube was assumed and the simulated residual stresses were applied using the Abaqus subroutine SIGINI (see Figure 3b).
q ˙ = α · ( T s T q )

3.2. Material Parameters

For both investigated steels, most of the phase specific thermal, metallurgical and mechanical properties were extracted from literature [20,21,22,23]. The used material parameters for AISI 4140 considering the mechanical model were extracted from [21], who investigated laser hardening by a numerical model. The influence of the heat transfer coefficient on residual stresses and warpage for AISI 1045 are discovered in [22] and [23]. The former focused on discontinuous and continuous heat treatments, whereas the latter investigates the effects of evaporating liquids. Most material parameters for AISI 1045 were extracted out of these two works. Especially for the diffusive phase transformations, showing a high sensitivity to the carbon content, additional experiments considering the transformation behavior and also the hardness prediction were carried out. The experimental results are shown in the following. The resulting model parameters and the ones from literature are given in the Appendix A. Here, the parameters are indicated with γ for the austenitic phase, with α F / P for the ferritic/perlitic phase, with α B for the bainitic phase and with α M for martensite. In the case of a temperature dependent material parameter, the temperature dependence was modeled with a third order polynomial. If more than one phase existed, a linear rule of mixture was used to homogenize the property.
For the Chromium-Molybdenum steel AISI 4140, additional dilatometric studies had to be conducted to determine the isothermal bainitic transformation behavior and the resulting transformation strain of the used steel batch. Here, the bainite formation is modeled using Equation (9) proposed by [24], with the nucleation factor κ and the auto-catalytic factor λ . Due to the fact that the later shown heat treatment strategies will not cause a ferritic/perlitic transformation, the kinetic parameters have less weight and can be extracted from [21] using the JMAK equation (Equation (10)) developed in [25]. In the case of AISI 1045, the isothermal transformation behavior of the bainitic, as well as of the ferritic/perlitic, phase were investigated and modeled using the JMAK equation (Equation (10)). The comparison of the used models with the experimental results in Figure 4 and Figure 5 show a good agreement. The used temperature dependent model parameter n i , b i , λ , κ are given in Table A1.
f α V B = 1 exp ( κ ( 1 + λ ) t ) λ exp ( κ ( 1 + λ ) t ) + 1 ,
f α J M A K = 1 exp ( b ( t ) n ) .
To predict the hardness distribution after the Internal Quenching process, hardness measurements were carried out using the dilatometric samples. The measured hardness of the bainitic and the ferritic/perlitic phases in dependence of the isothermal formation temperature T i s o is shown in Figure 6 for both steels. Due to the fact that the ferritic/perlitic phase will not be an issue considering AISI 4140, the hardness calculation is neglected. For both steels, a linear behavior can be assumed and the hardness of each phase is modeled via Equations (3)–(5),
H V B ; 4140 = 928.17 1.23 T i s o , 315   C < T i s o < 525   C ,
H V B ; 1045 = 683.68 0.8 T i s o , 350   C < T i s o < 525   C ,
H V F / P ; 1045 = 427.3 0.3 T i s o , 525   C < T i s o < 700   C .
In a continuous cooling process, the resulting hardness H V i of bainite and ferrite/perlite is calculated incrementally with the following formula.
H V i = H V i f α i + H V i ( T i s o ) f ˙ α i f α i + f ˙ α i ,
in which f α i is the current phase fraction and f ˙ α i the phase increment during a time increment at the temperature T i s o .
Concerning the self-tempering effect of martensite due to slow cooling below the martensite start temperature, the hardness H V M is calculated using the incremental form of the Holomon-Jaffe parameter P H J and the hardness calculation for AISI 4140 extracted from [26].
H V M = 1079.8 0.0396 × P H J ,
P H J , i = P H J , i 1 + T × d t 2.303 × 10 P H J , i 1 T C .
Herein, T is the temperature and C a material constant, which is a function of the carbon content. In the case of AISI 4140, it is assumed that a self tempering starts while reaching an inner quenching temperature T i n and the initial parameter P H J , 0 is calculated via the Holomon-Jaffe equation. In the case of AISI 1045, a constant martensite hardness of 700 HV is assumed.

4. Simulative Optimization Study

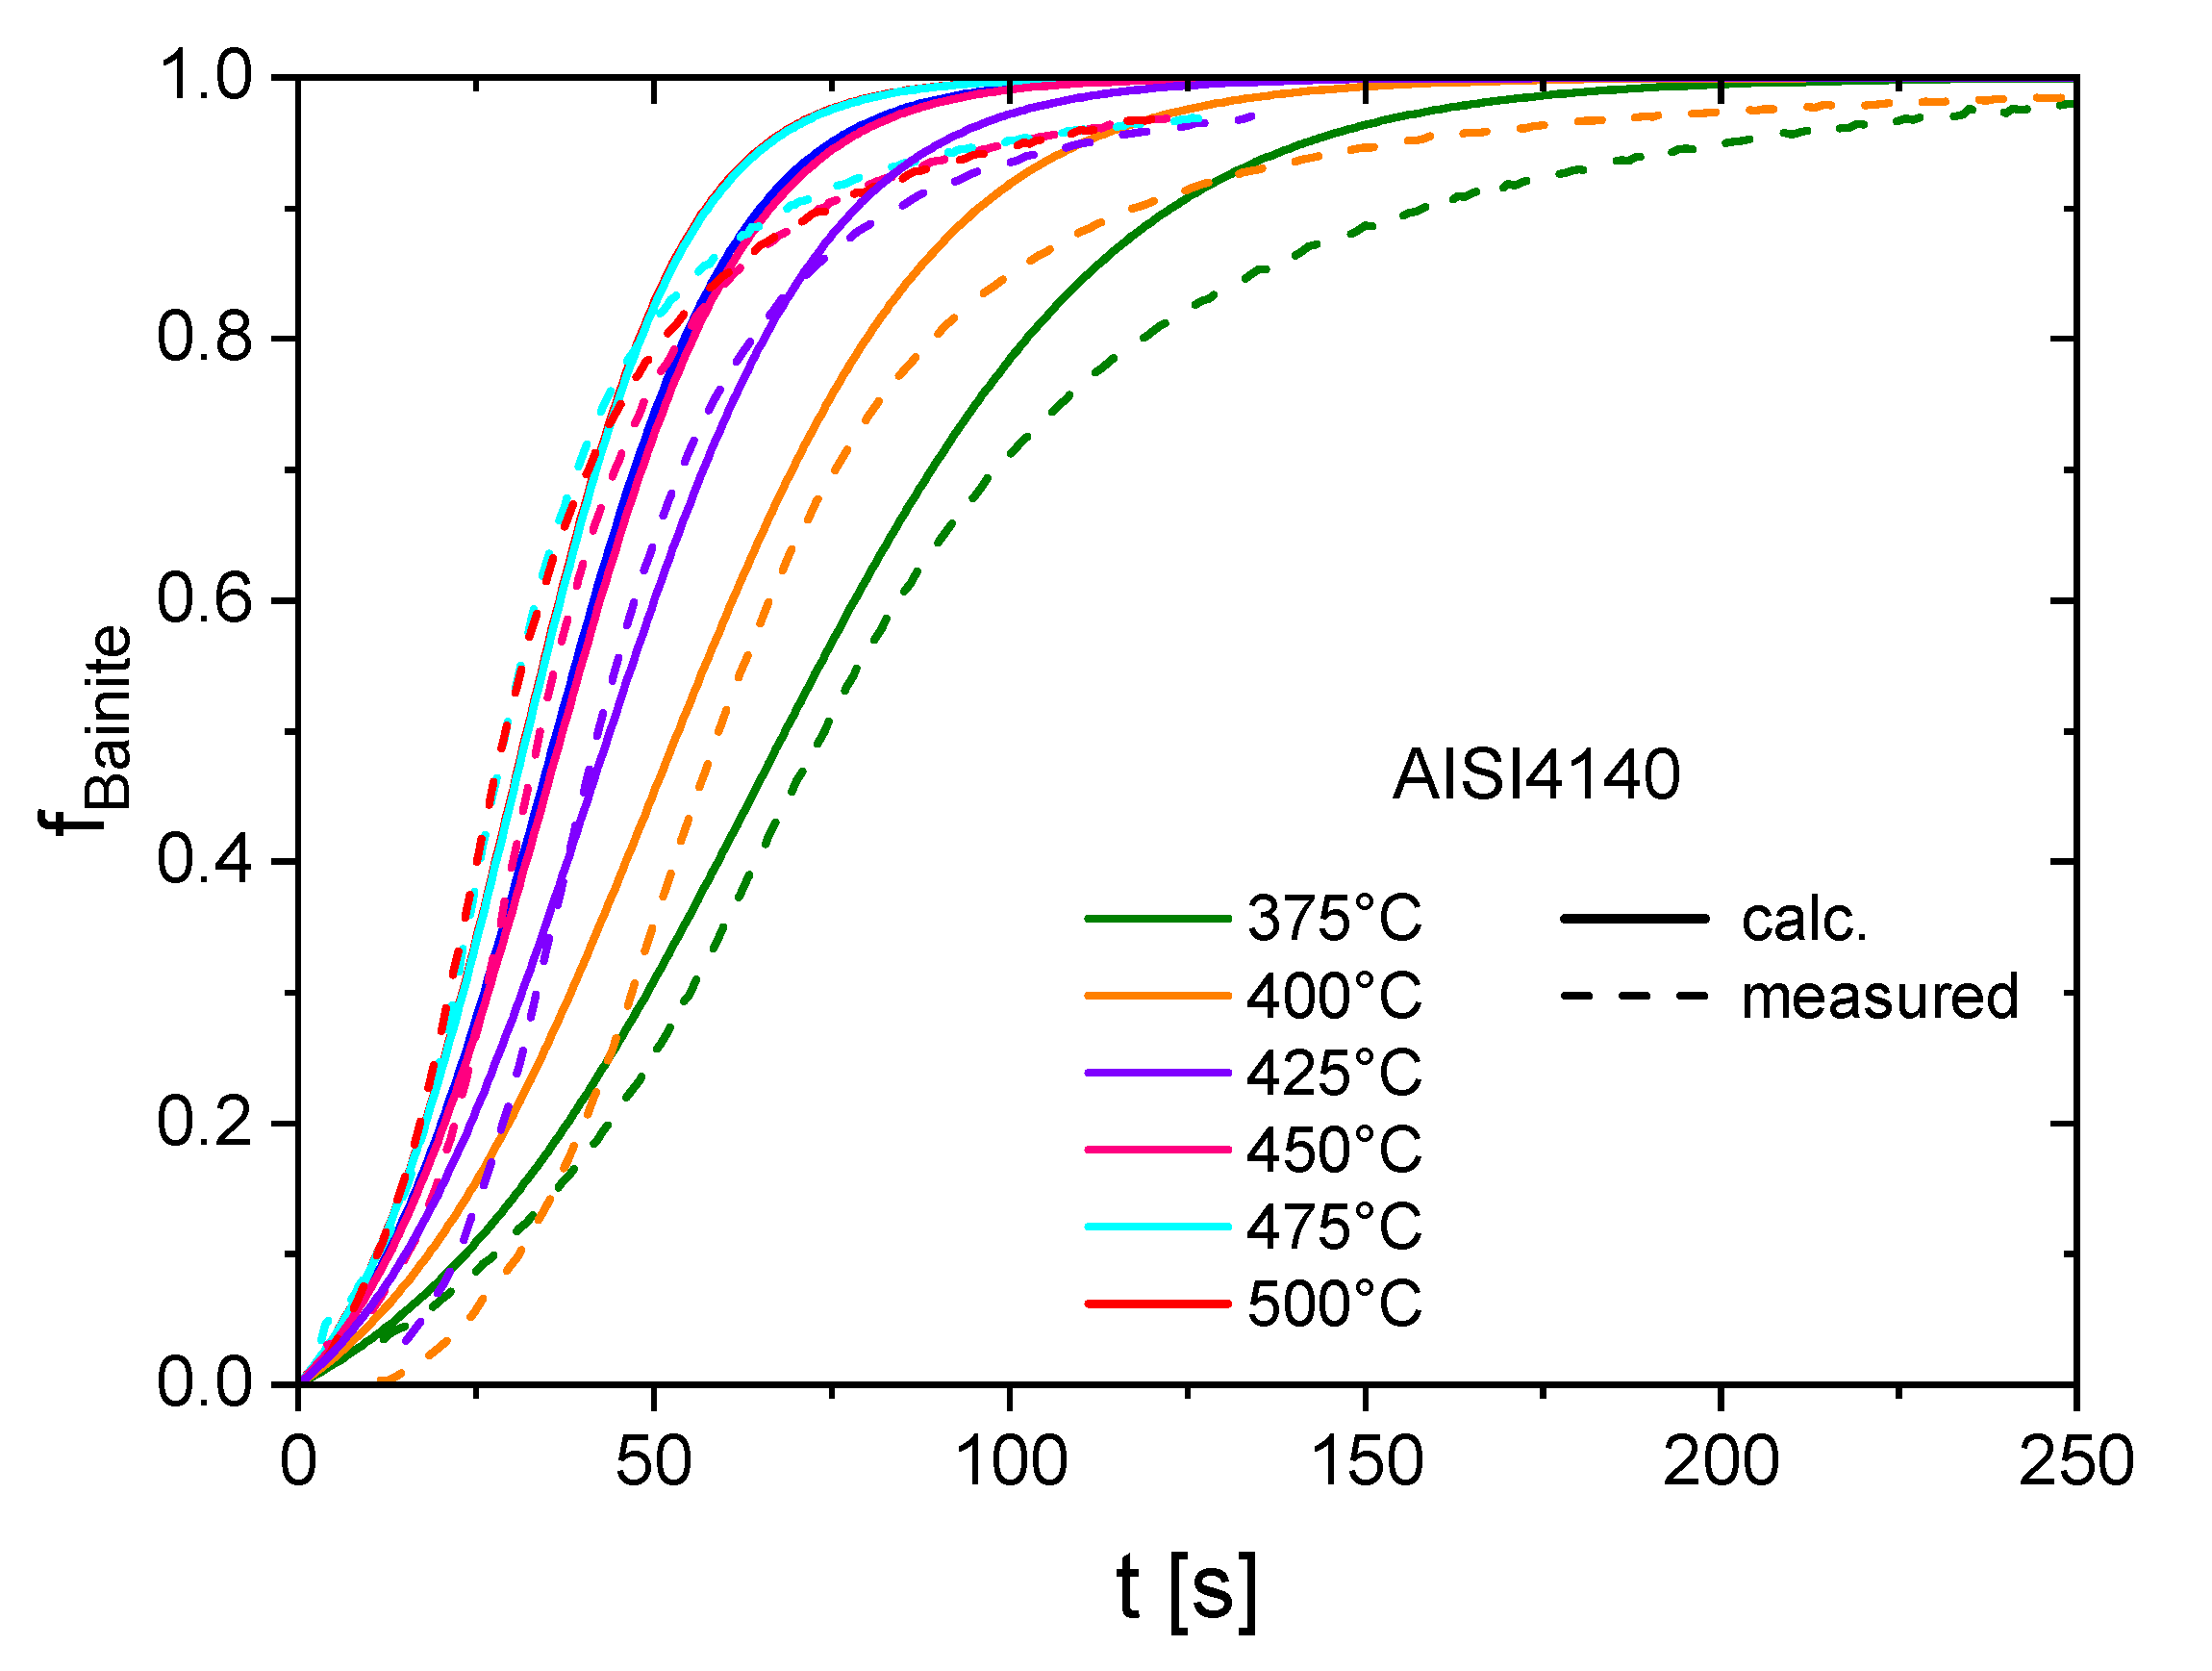
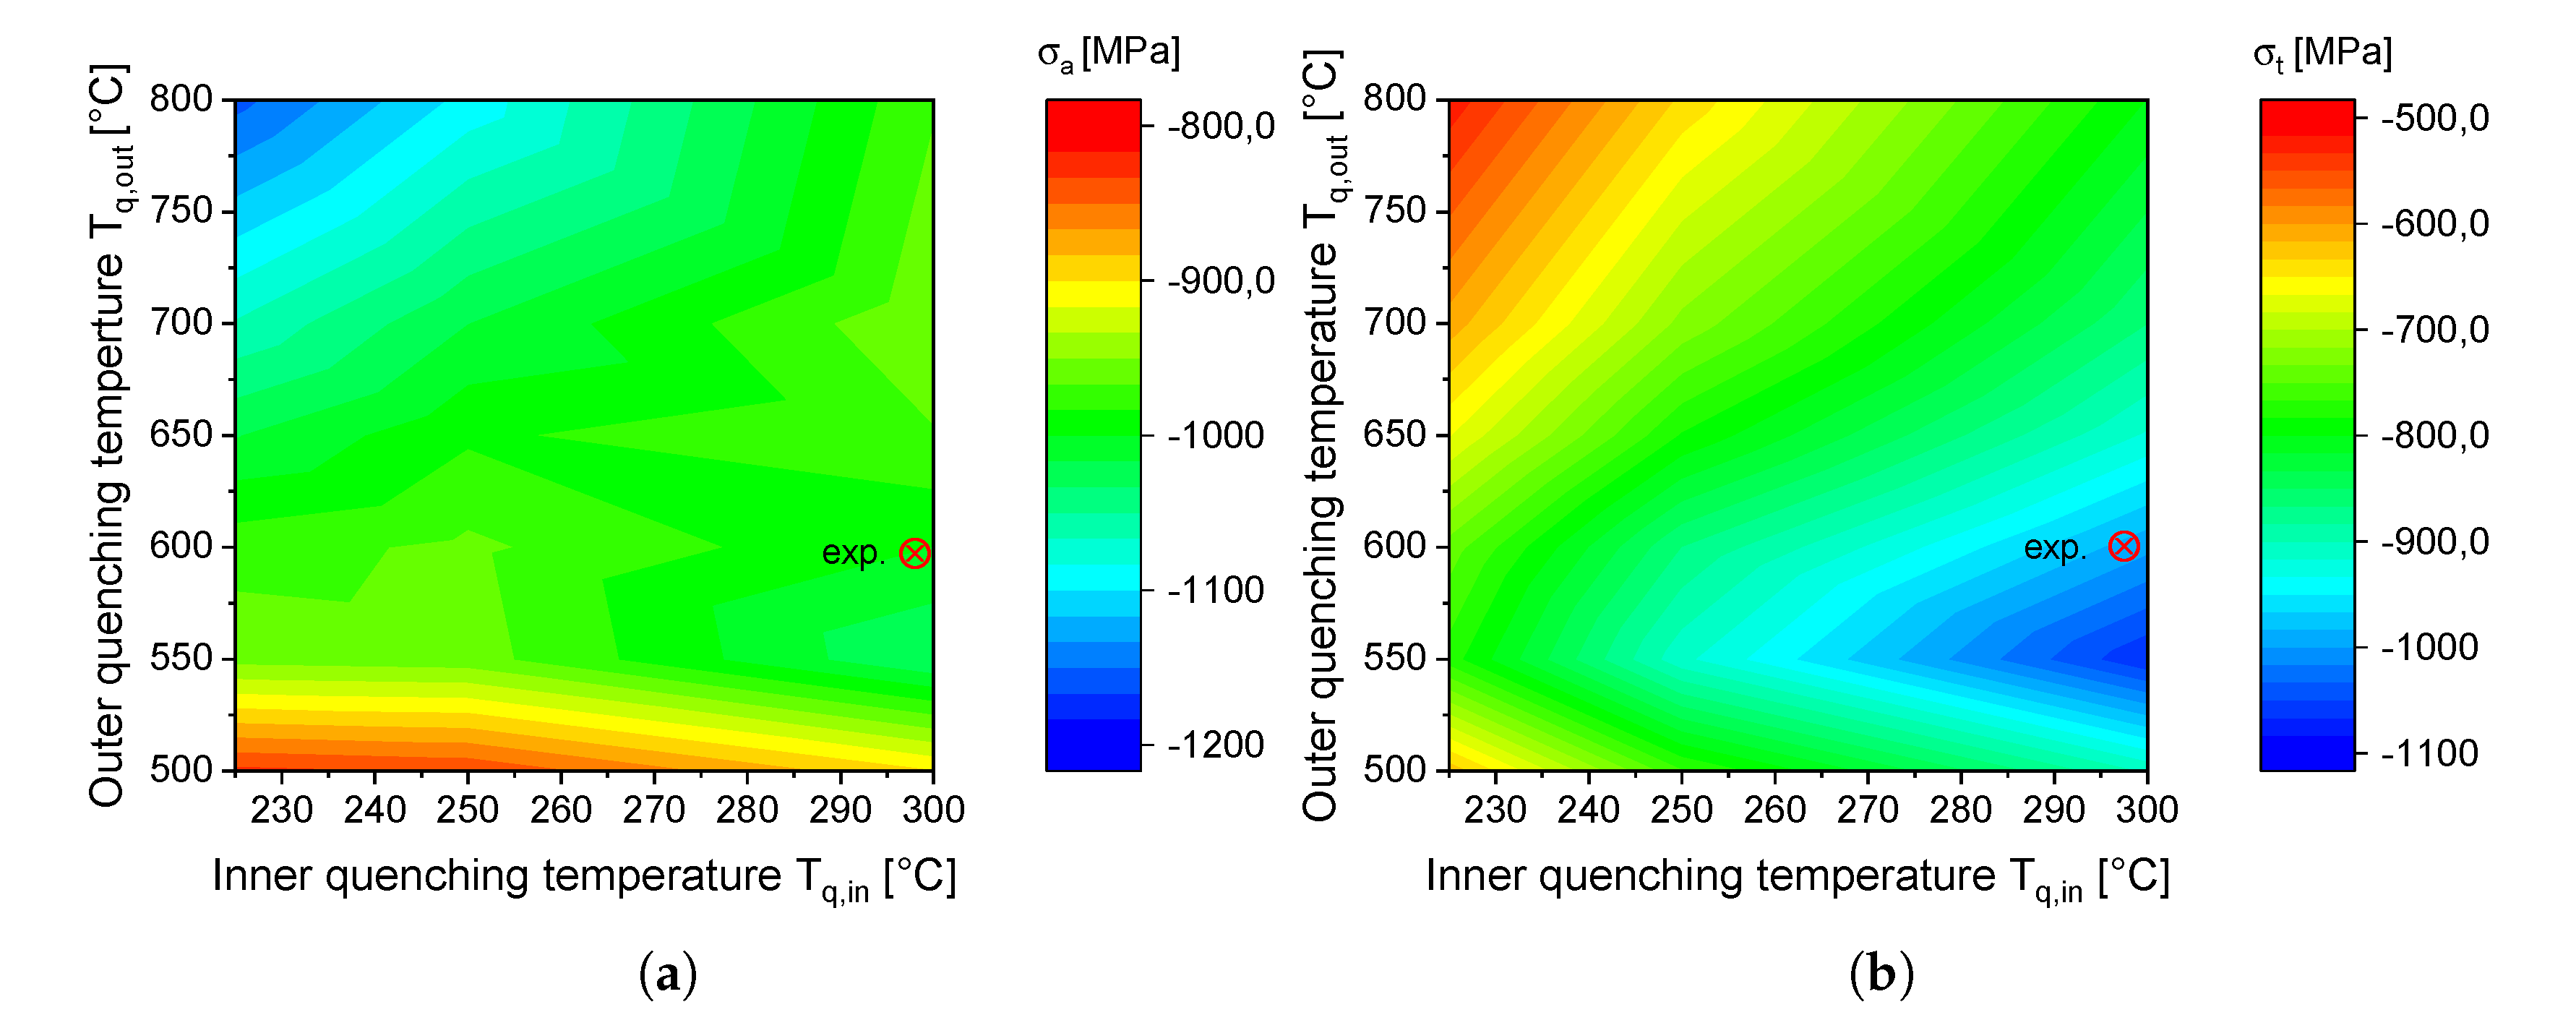
4.1. Parameter Field for AISI 4140

The results of the feasibility study in [14] show that a crack-free inner surface with compressive residual stresses can be created only by regulating the inner surface temperature. A crack-free hardened inner surface can be realized with internal cooling rates lower than 60   K / s to an internal quenching temperature T i n of 150   C , followed by a slow cooling down to 100   C with a cooling rate of 1   K / s . Simultaneously, the external surface was cooled down quickly to an external quenching temperature T o u t of 550   C and then cooled down with 2   K / s to the martensite start temperature. Finally, the sample was cooled down as quick as possible to room temperature. Considering this thermal histories, the presented simulation study investigates the influence of the internal and external quenching temperatures using a cooling rate at the inner surface T i n , c o o l of 50   K / s and cooling times t c o o l of 100   s and 200   s on the residual stress state at the internal surface after the heat treatment process. To ensure a hardened inner surface, the inner quenching temperature was varied between 225   C and 300   C with outer quenching temperatures of 500   C up to 800   C . Furthermore, different continuous cooling conditions of the external surface were performed with a concurrent variation of the inner quenching temperature. In this case, the impact of the inner cooling rate v i n , c o o l was also taken into account by varying the cooling rates between 50   K / s and 400   K / s . The explained process parameter and the resulting investigated temperature fields are summarized in Figure 7.

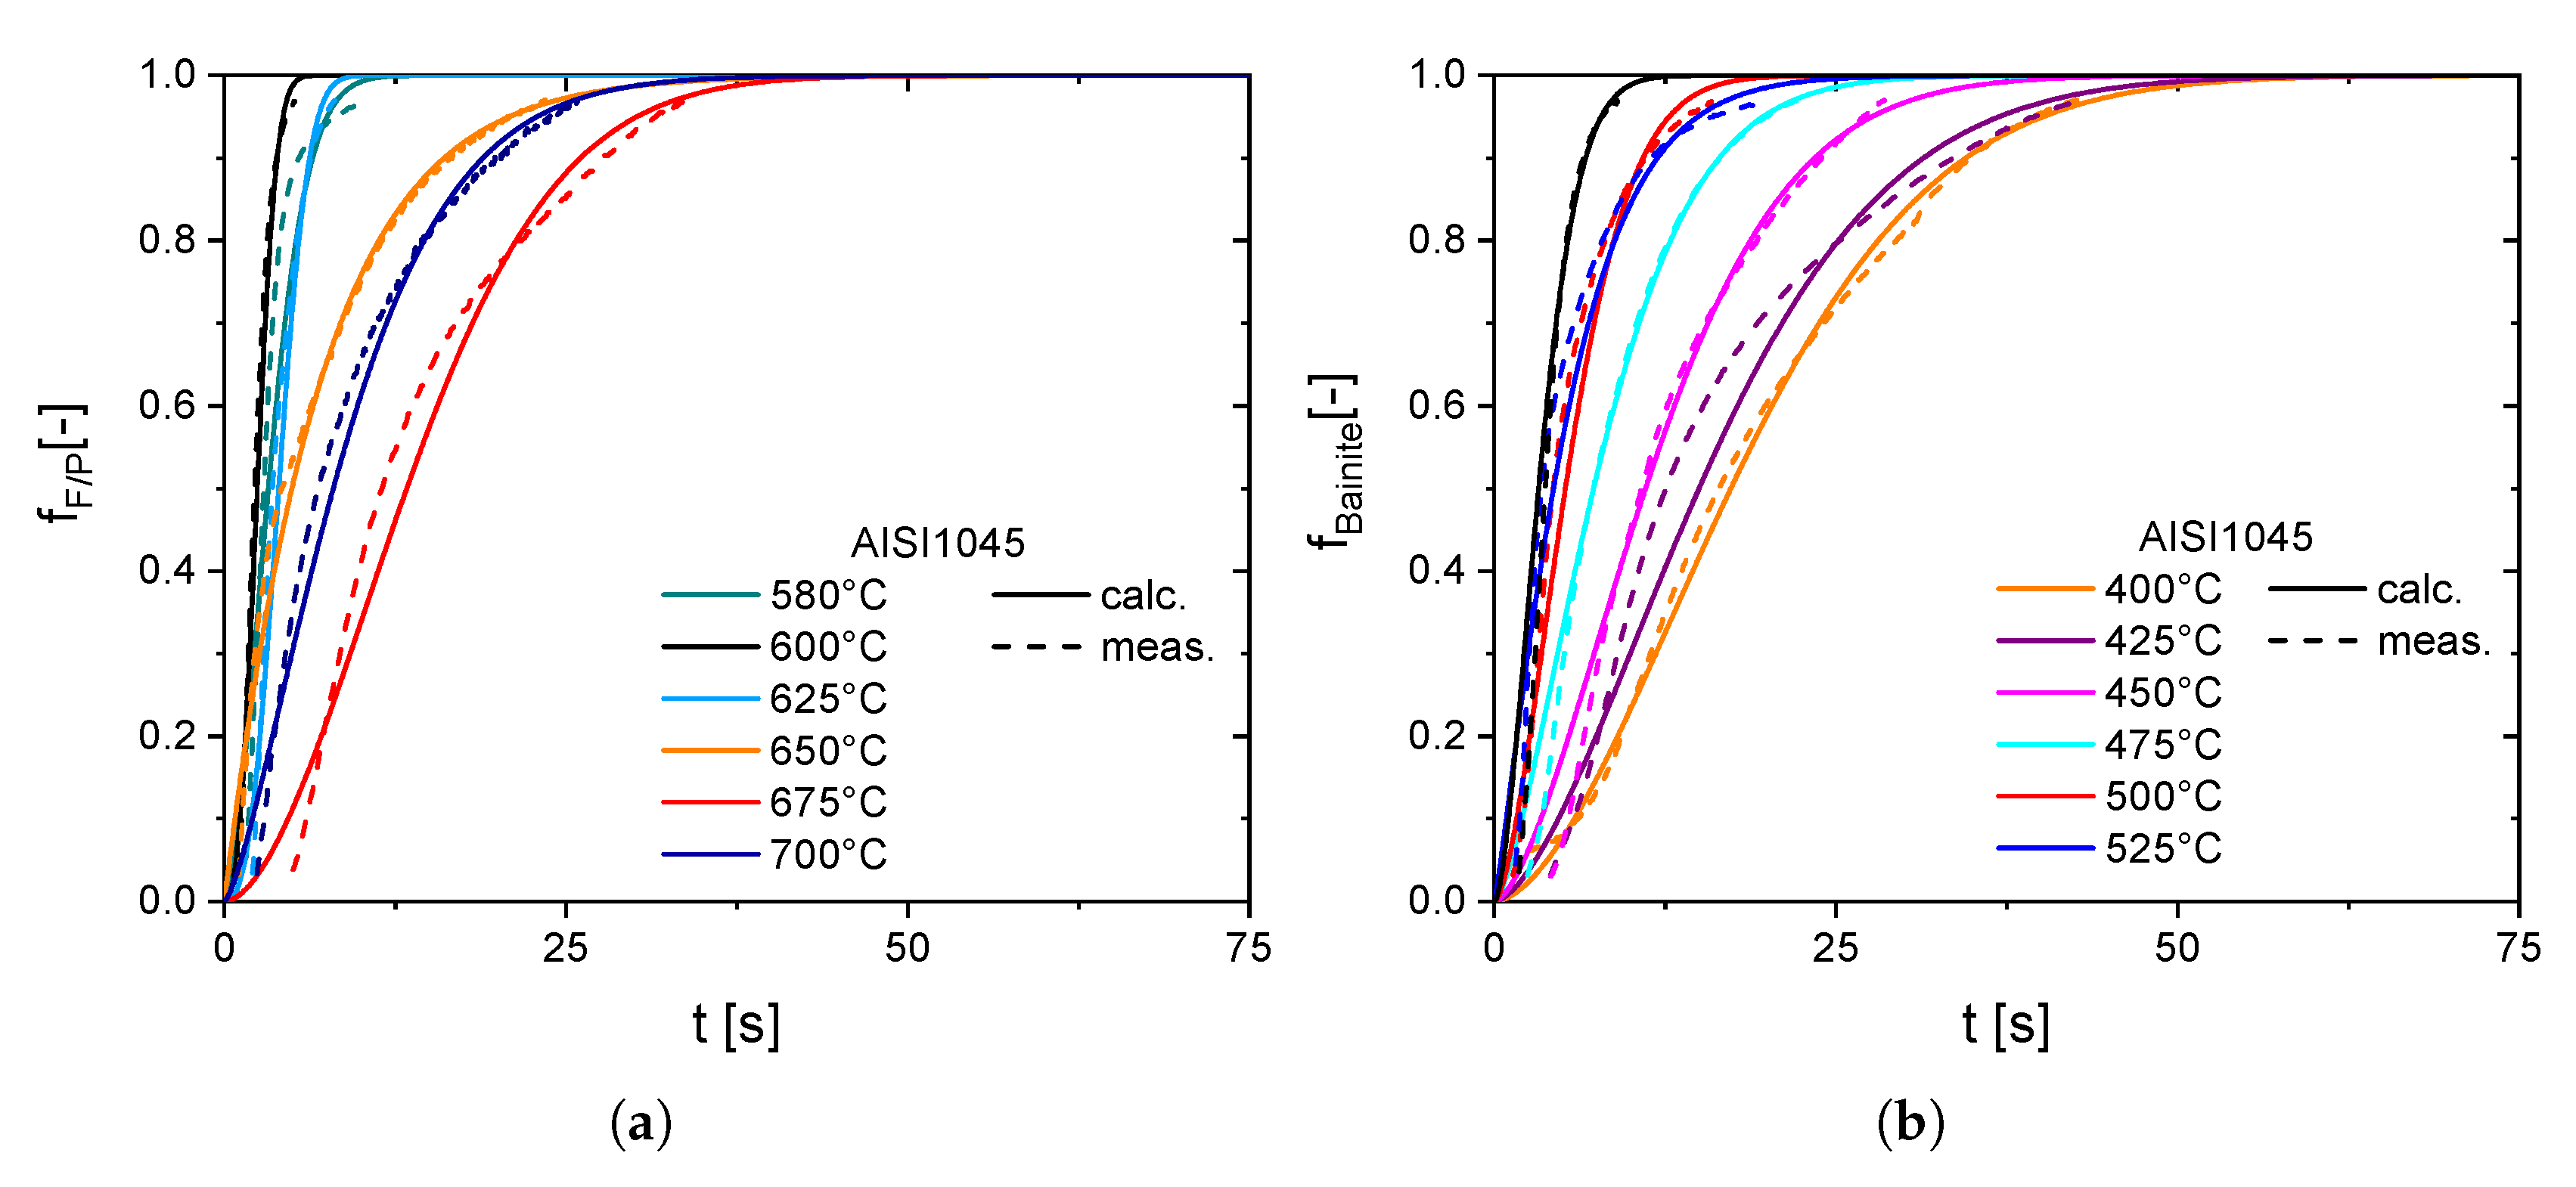
4.2. Parameter Field for AISI 1045

Due to the fact that the steel AISI 1045 shows a low hardenability because of very fast phase transformations, it is expected that there is no risk of through hardening compared to AISI 4140 and the heat treatment strategy can be easier. Hence, the simulation study only investigates the influence of the inner and outer cooling rate. The inner surface was hereby cooled down continuously to room temperature using different different heat transfer coefficients based on the findings in [14]. The heat transfer coefficient was varied in the experimentally feasible range between 10   k W / m 2 K and 80   k W / m 2 K . Simultaneously, the outer surface was cooled down continuously with cooling rates from 3   K / s up to 8   K / s .

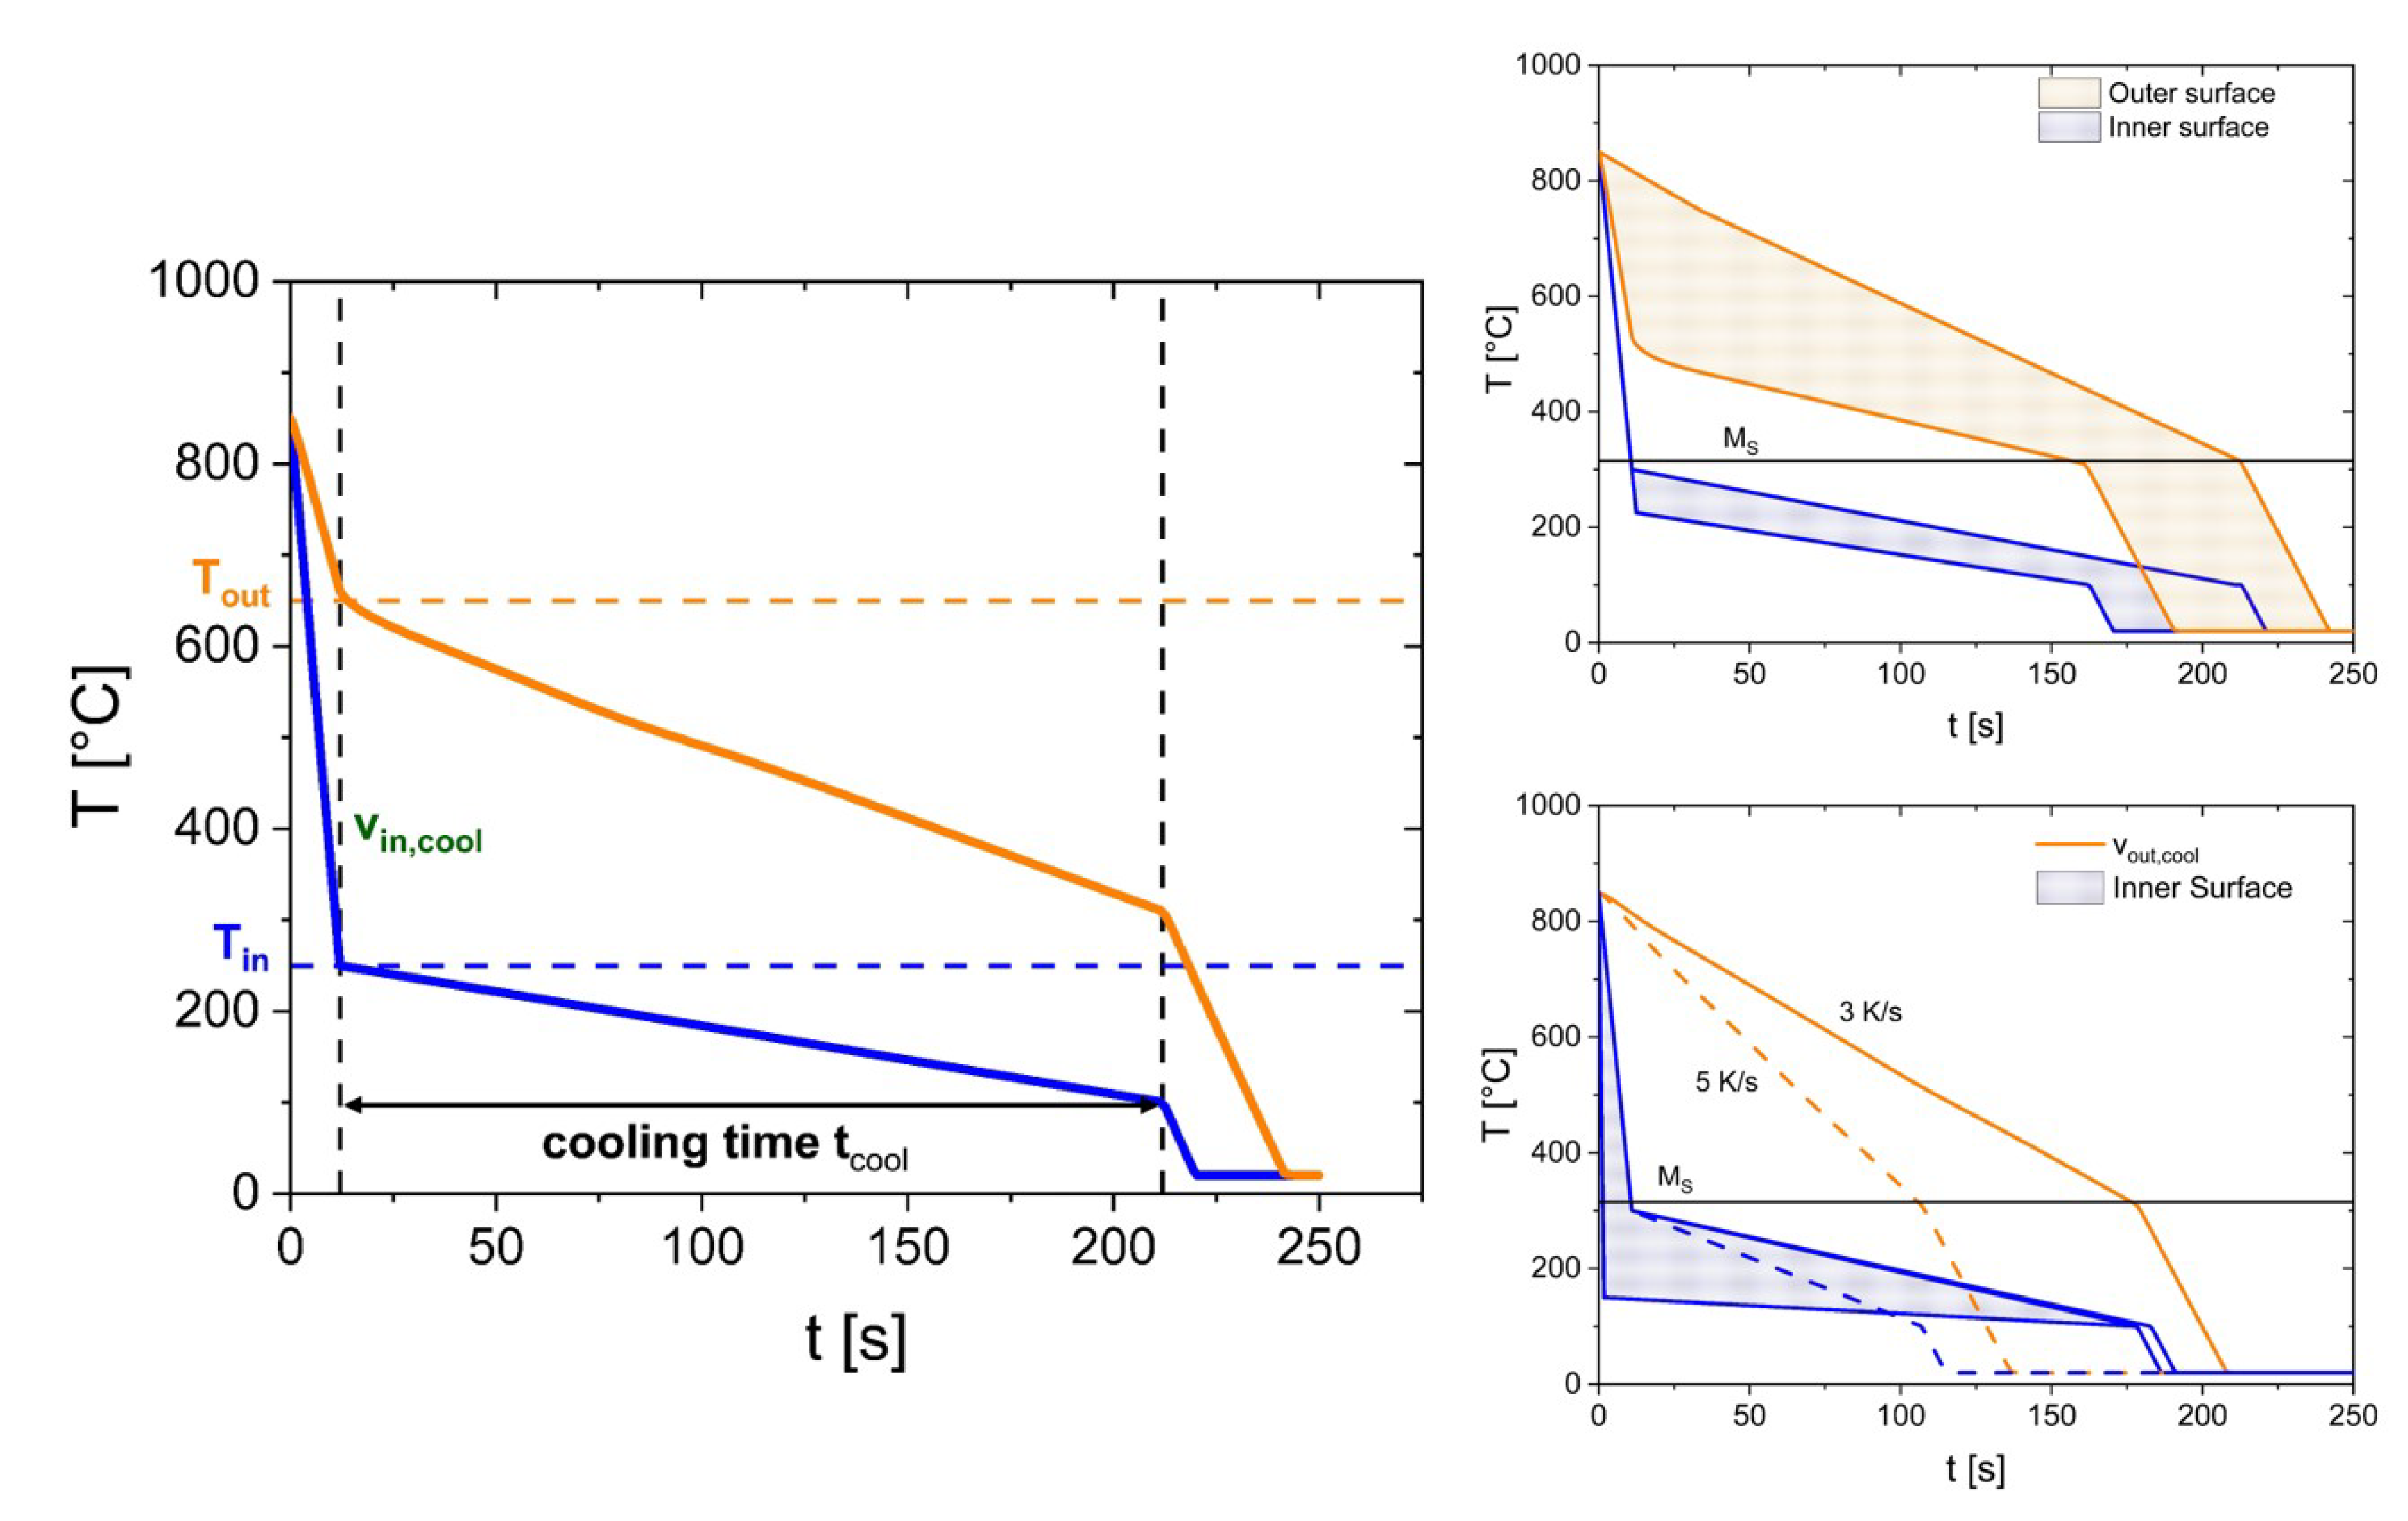
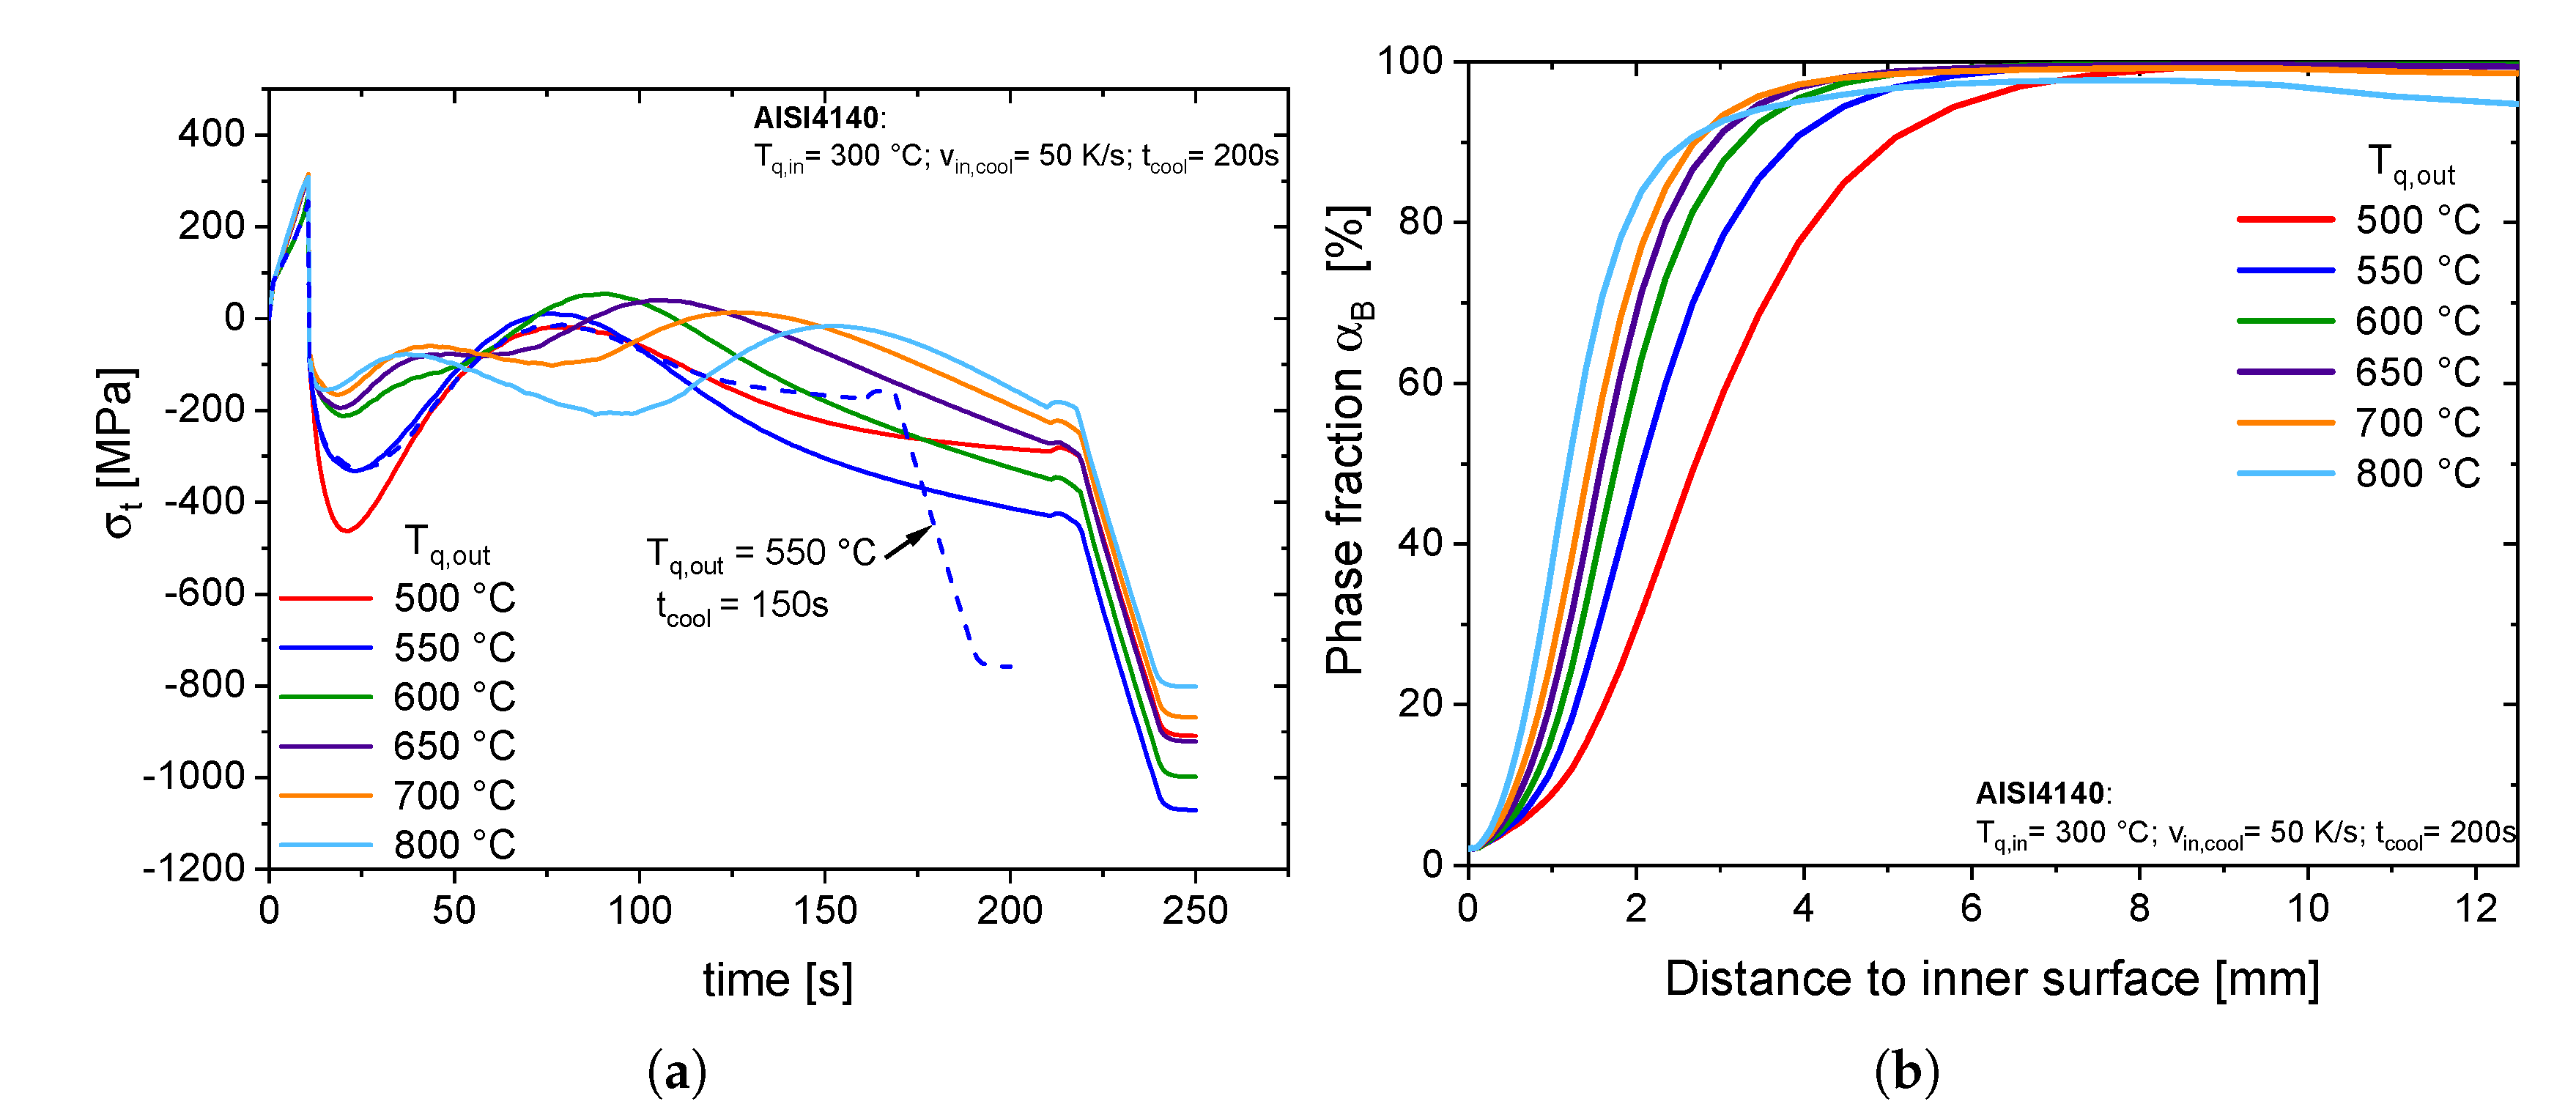
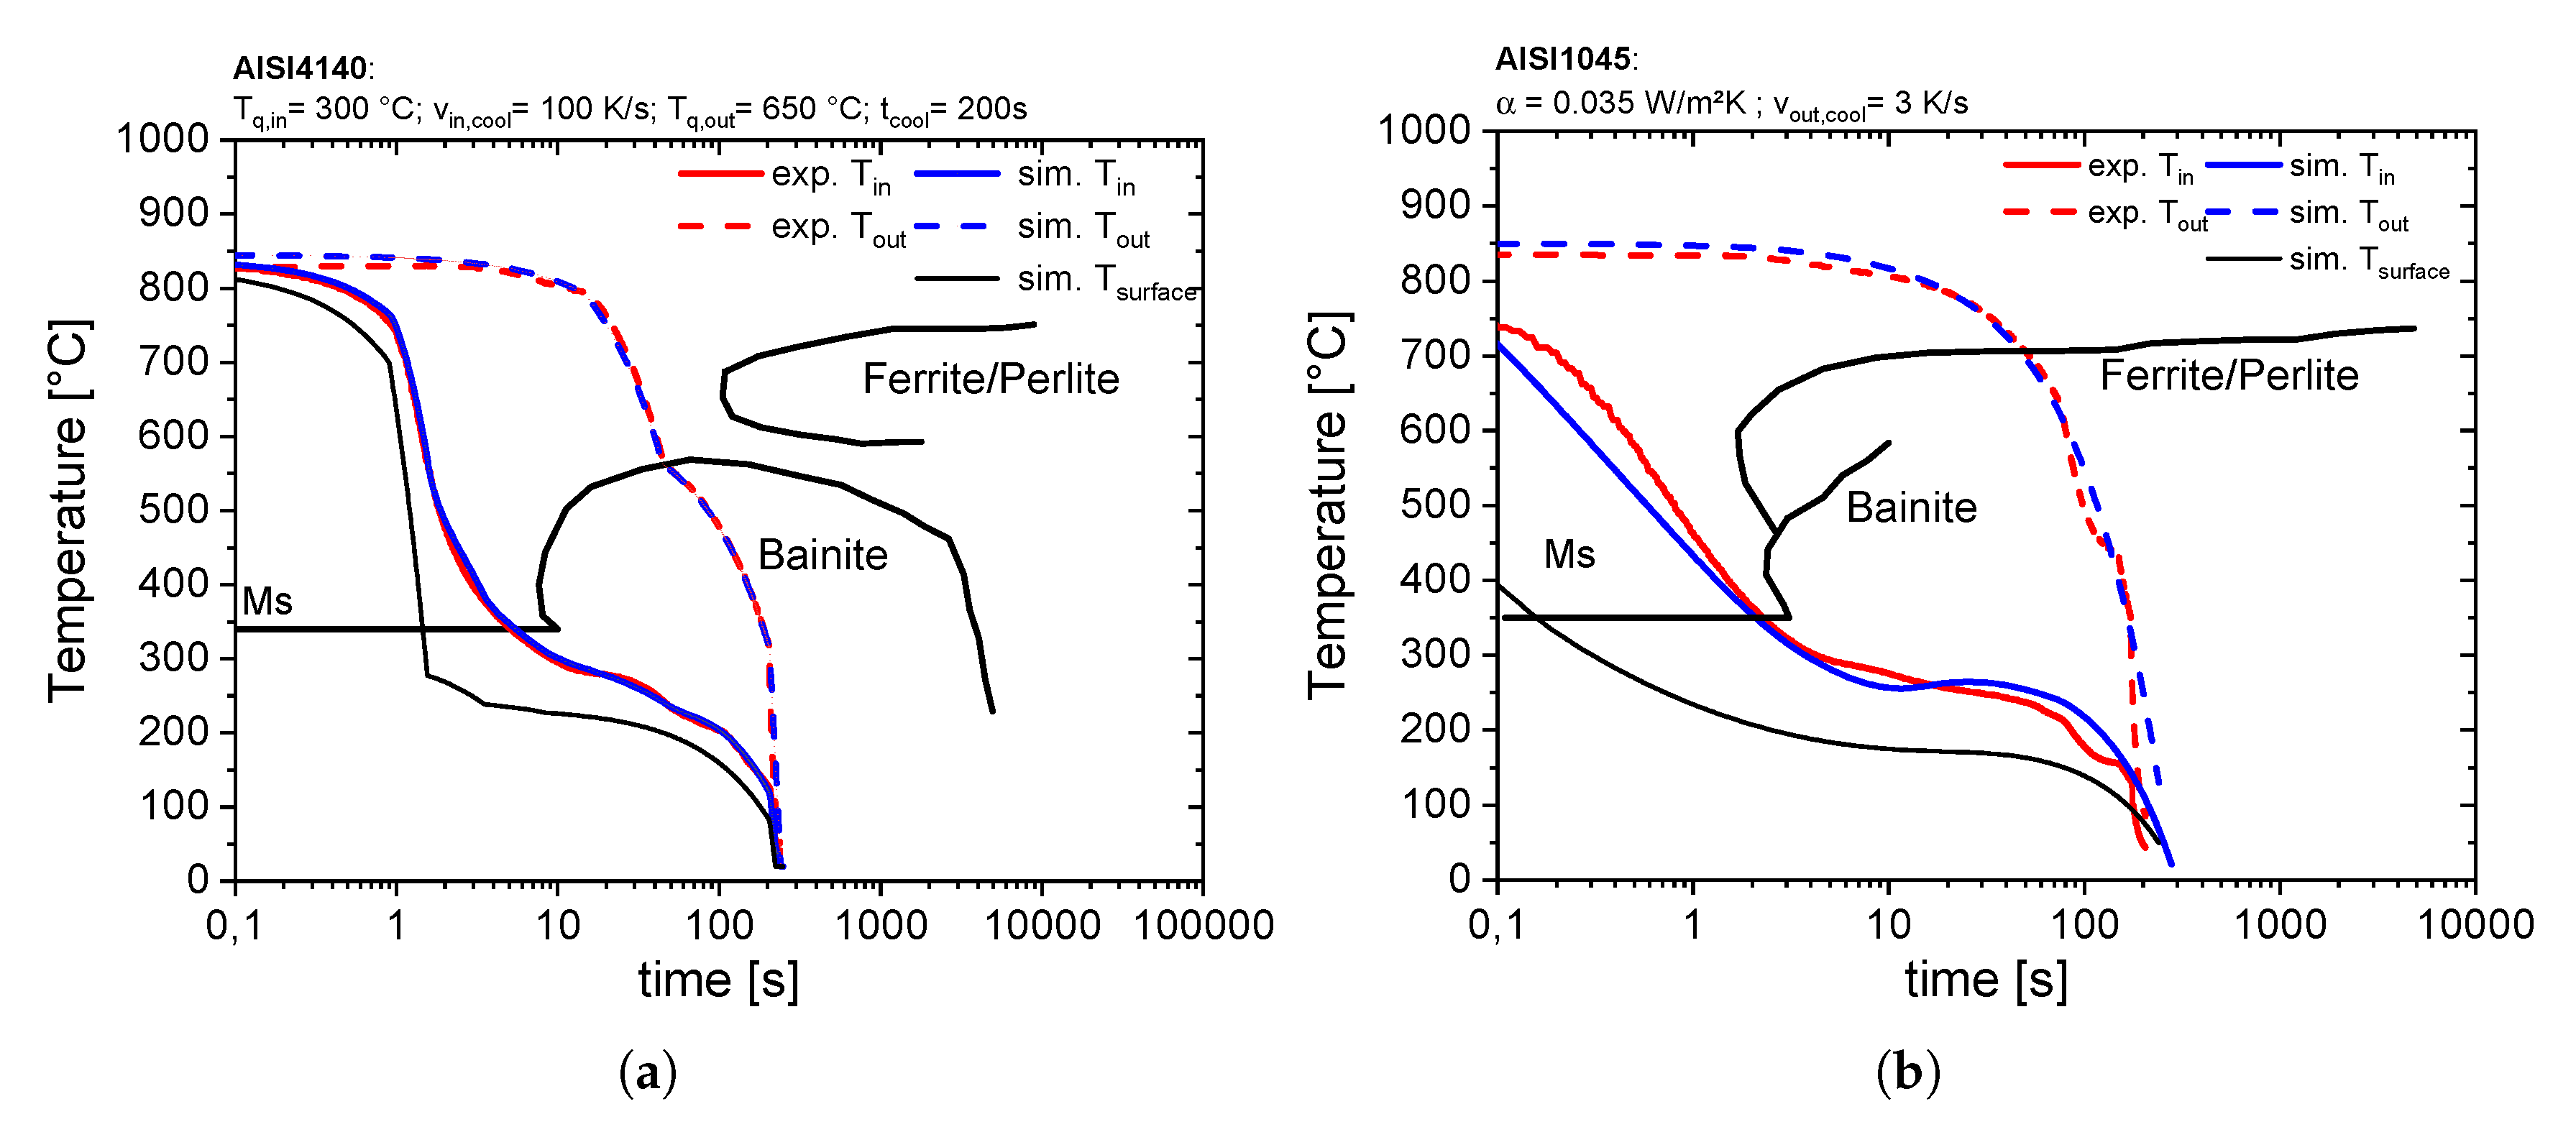
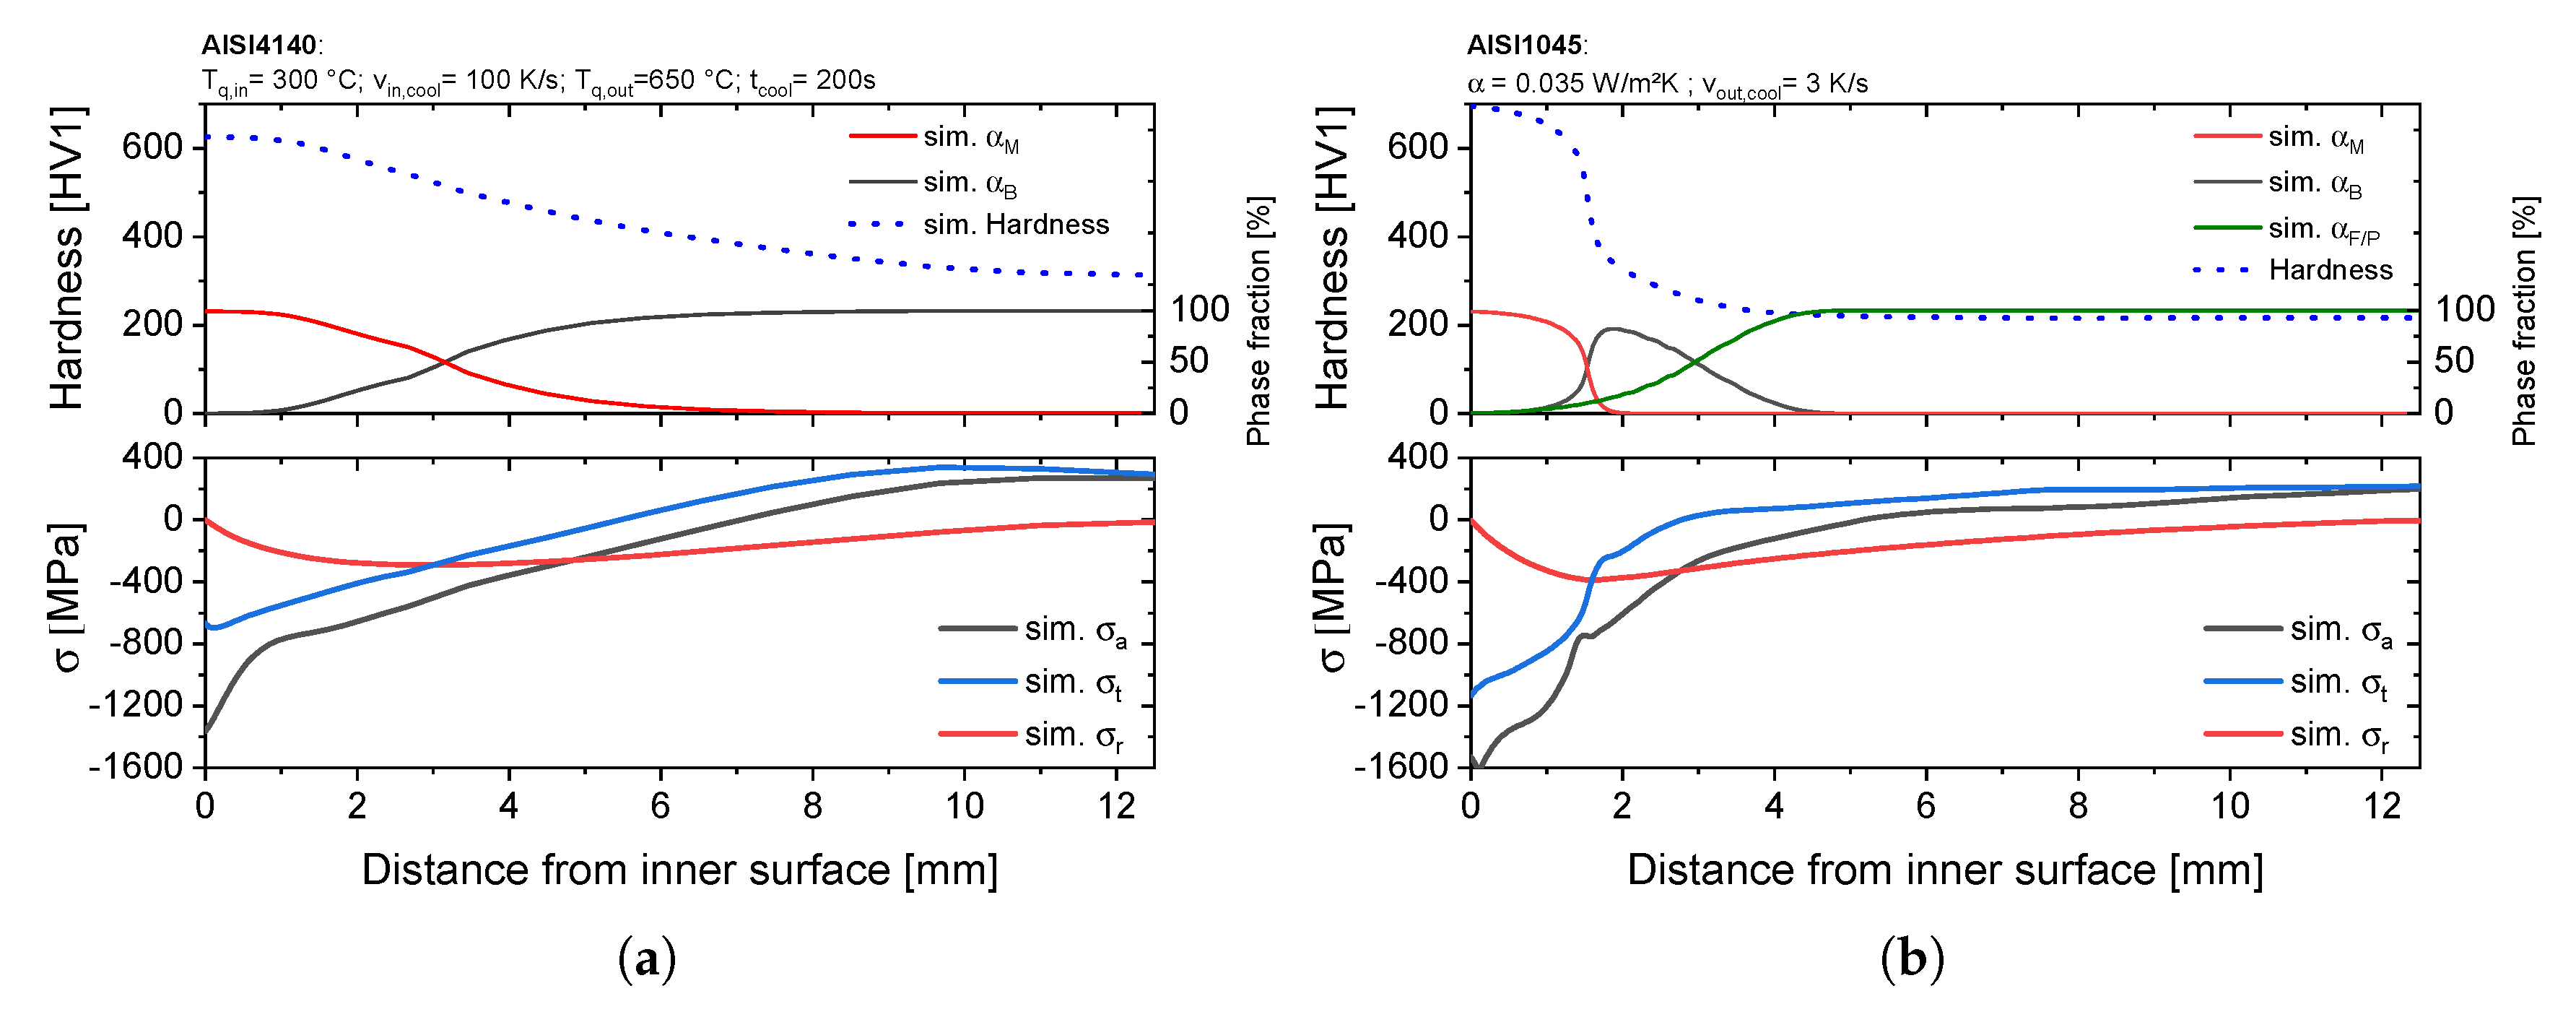
4.3. AISI 4140, Discontinuous Cooling

In this section, the influence of the inner and and outer cooling temperature including two different cooling times are discussed and compared. The following results will focus on the simulated residual stresses in axial and tangential direction at the internal surface in the middle of the sample. Figure 8 depicts the contour plot of the axial and tangential residual stresses in dependence of the different simulated combinations of the outer and inner surface temperature. Regarding the absolute values in both stress directions it can be noted that the tangential direction is more affected in the shown parameter field. The axial residual stress is nearly independent of the internal quenching temperature at external quenching temperatures between 550   C and 700   C .
Maximum axial compressive residual stresses with a value of 940   MPa are achieved over high outer quenching temperature intervals and low inner quenching temperature intervals. In contrast, the tangential residual stresses reflect precisely the contrary, by showing the lowest compressive residual stresses in this combination. Here, the maximum residual stresses are achieved at an inner quenching temperature of 300   C and an outer quenching temperature of 550   C . The optimum of the compressive residual stresses at an outer quenching temperature of 550   C can be explained by taking a look at the temporal evolution of the tangential stress component at different cooling conditions of the outer surface with an inner quenching temperature of 300   C and a cooling time of 200   s during the process (see Figure 9a). It is obvious that lower outer quenching temperatures up to 550   C will increase the arising compressive stresses at the inner surface due to the formation of martensite. This can be explained by the temperature level of the outer sections influencing the strength of the under-cooled austenite, which is the limiting factor considering the arising compressive stress during martensite formation. On the other hand, a lower temperature level will increase the hardening depth, resulting in a reduction of the compressive stresses (see Figure 9b). This effect becomes dominant with an outer quenching temperature of 500   C , leading to a hardening depth of over 2   mm and reduced tangential compressive residual stresses. Regarding the influence of cooling time on the residual stress state in Figure 9a, where the cooling times of 150 s and 200 s are compared, a similar behavior can be observed. Higher cooling times result in lower cooling rates and a higher temperature level in the sample decreases the hardening depth and therefore increases the compressive residual stresses.

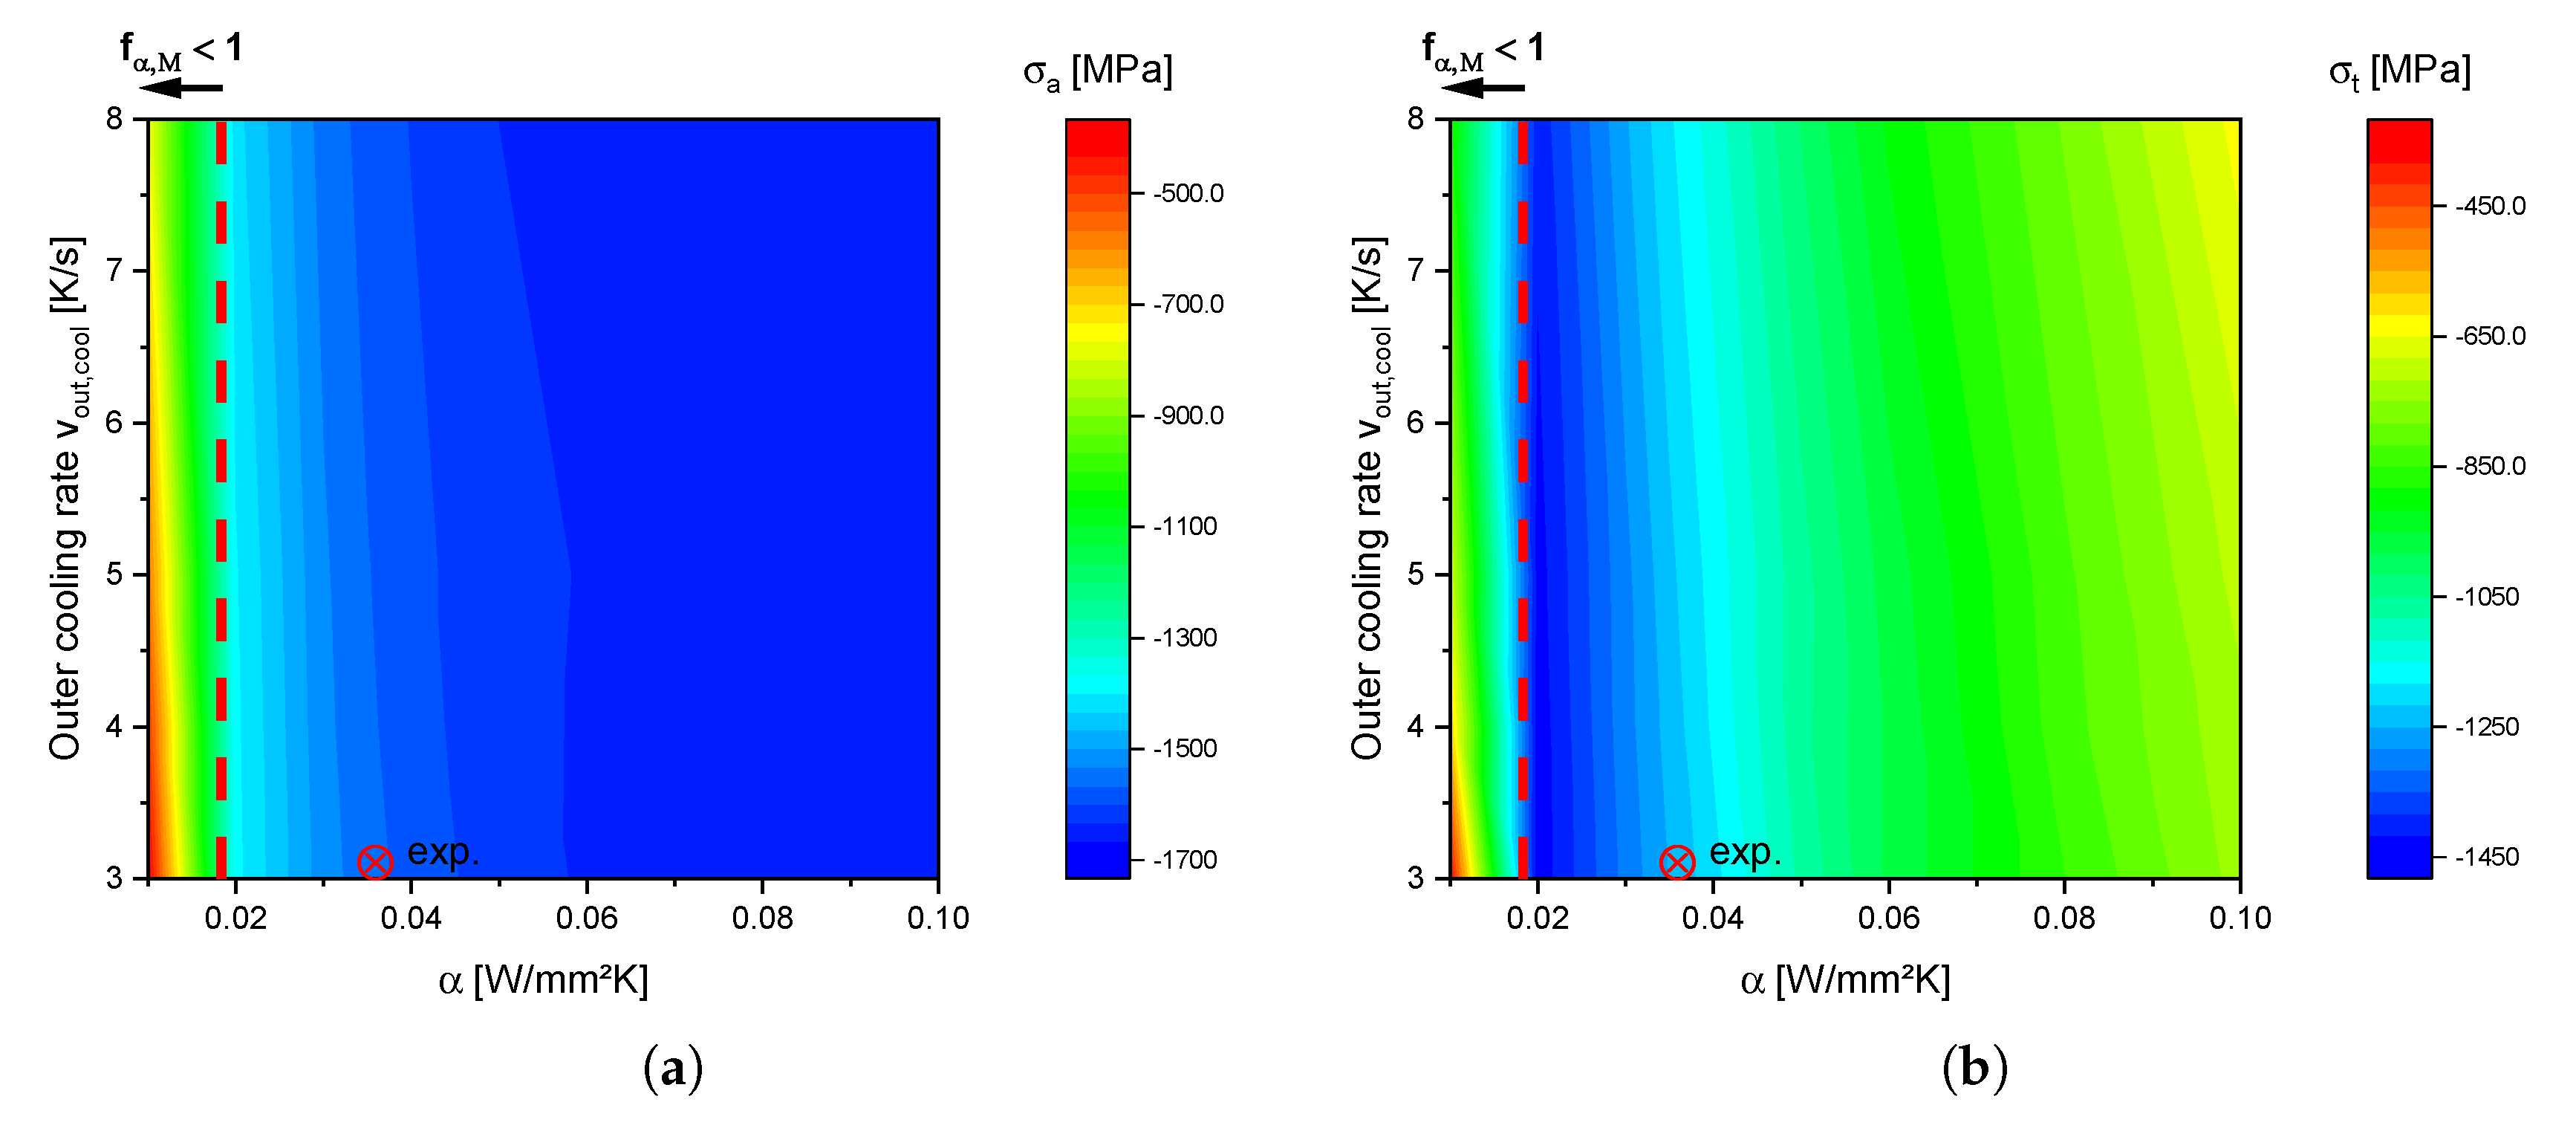
4.4. AISI 4140, Continuous Cooling

The impact of the inner quenching temperature T i n and cooling rate v i n , c o o l during a continuous cooling of the outer surface with 3   K / s is depicted in Figure 10. Regarding the tangential stress direction, the results confirm the findings in Section 4.3 showing higher tangential compressive residual stresses with an increasing inner quenching temperature and only a slight dependency on the inner cooling rate. On the one hand, in comparison to the study with a discontinuous cooling, the tangential residual stress state shows a very sensitive dependency on the inner quenching temperature, changing into tensile residual stresses at quenching temperatures under 180   C . On the other hand, the axial stress component shows an optimum at high inner cooling rates and an inner quenching temperature of 200   C . However, compressive axial residual stresses over 300   MPa are always achieved in the studied parameter range. The influence of the outer cooling rate on the microstructure and stress distribution is depicted in Figure 11, where the cooling rates of 5   K / s and 3   K / s are compared using an inner quenching temperature of 300   C and an inner cooling rate of 50   K / s . Obviously, the cooling rate of the outer surface affects mainly the bainite content in the outer surface. A cooling rate of 3   K / s results in a nearly full bainitic microstructure, leading to higher compressive stresses due to the lower transformation strain of the bainitic phase (see [14]) by an almost constant hardening depth.

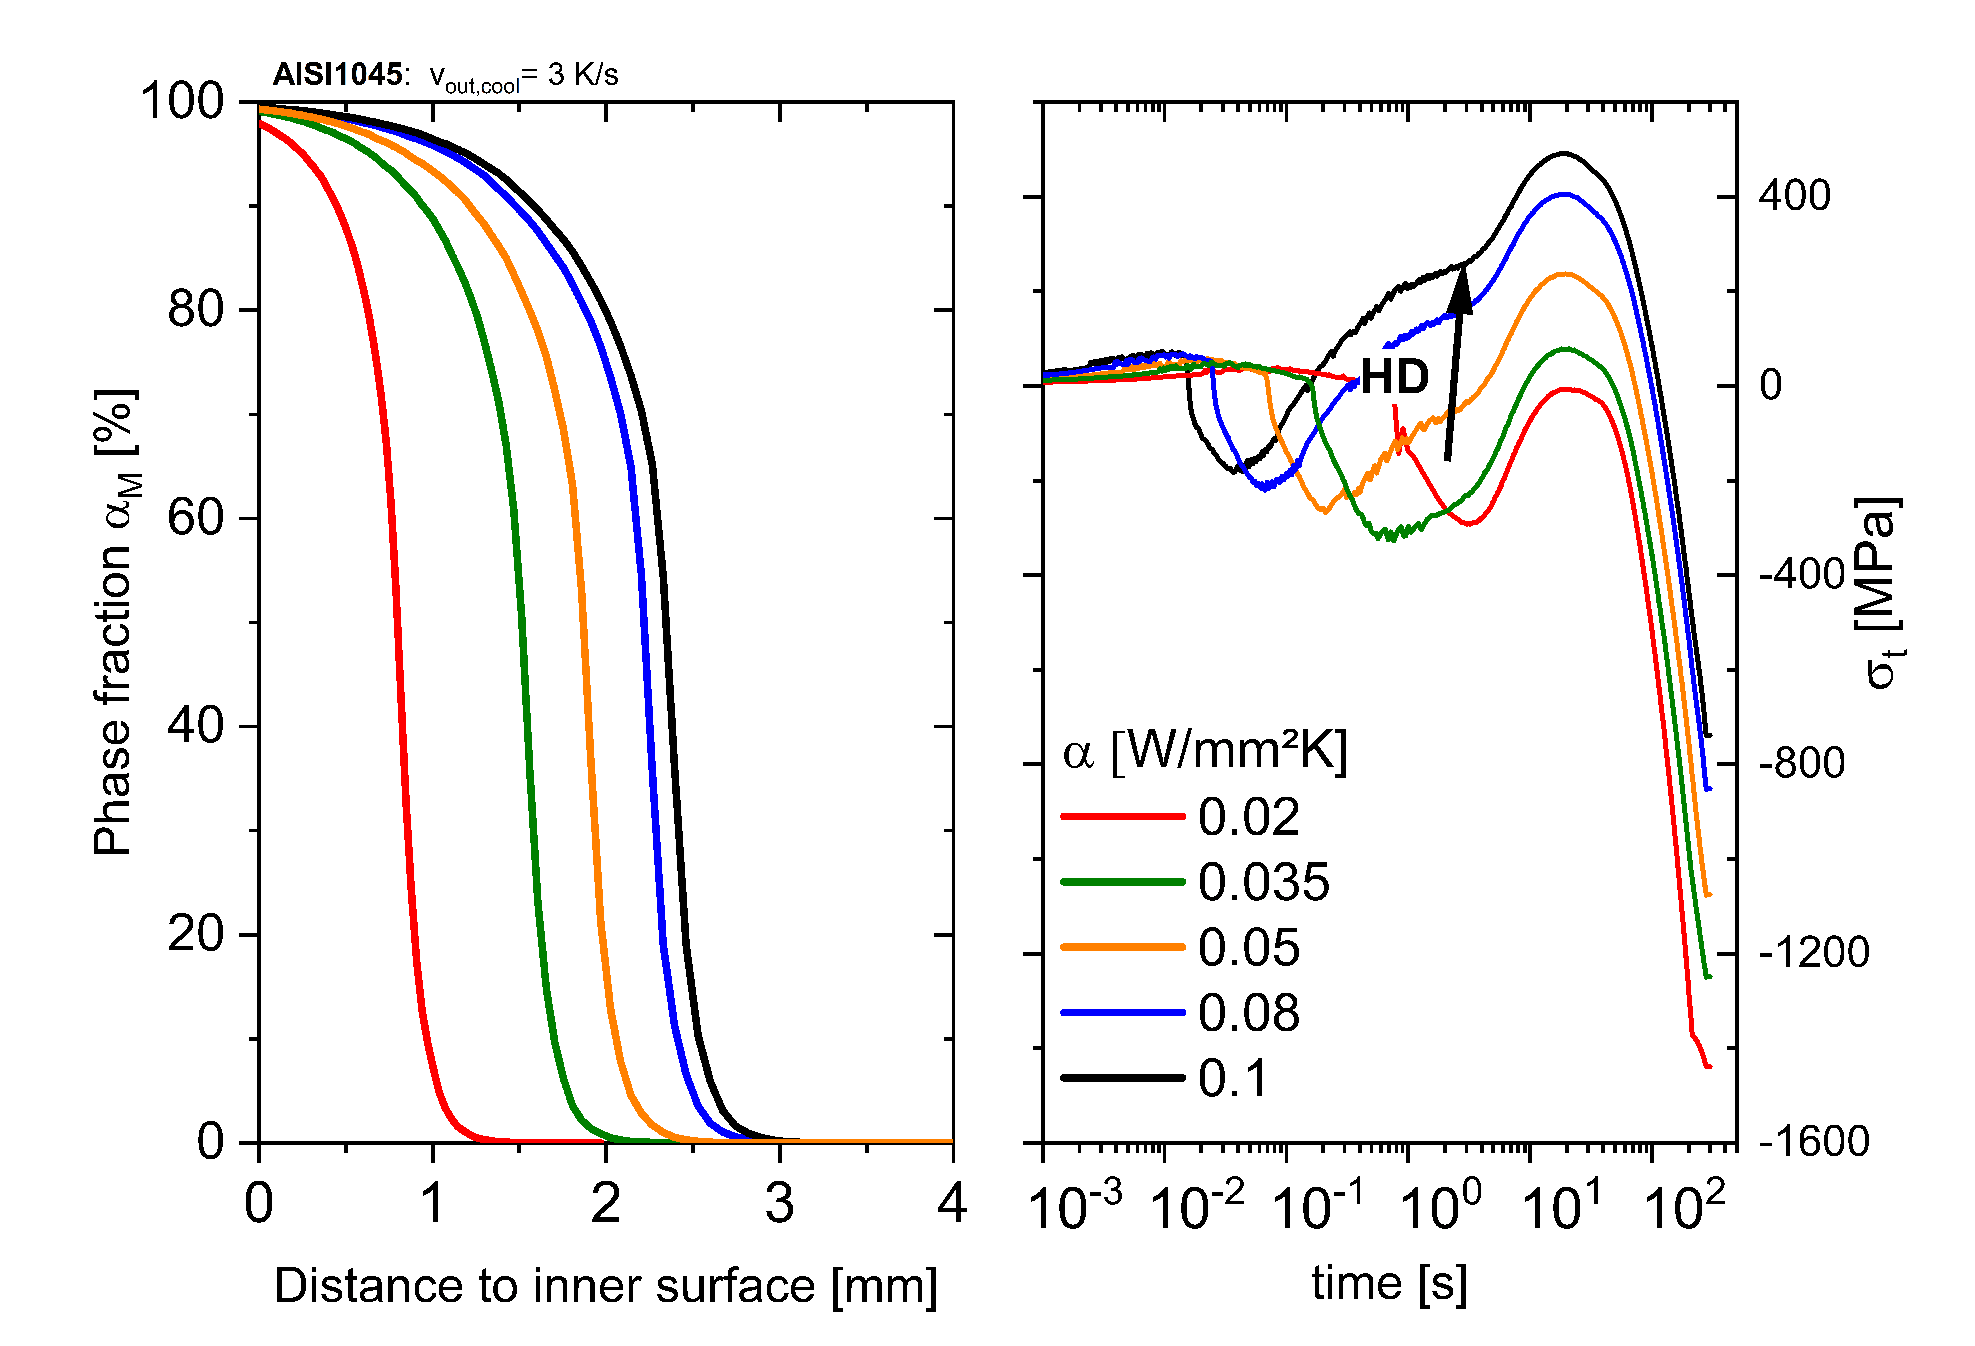
4.5. AISI 1045, Continuous Cooling

The contour plots of Figure 12 show the influence of internal and external cooling rate on the residual stresses at the inner surface. Both stress components show a nearly independent behavior considering the outer cooling rate v o u t , c o o l . The tangential residual stresses (Figure 12b) show a maximum at a heat transfer coefficient α of 0.02   W / m 2 K , whereas the residual stresses in axial direction show only a slight increase with higher heat transfer coefficients. The correlation of the tangential residual stresses with the inner cooling conditions can be explained from Figure 13. Here, the martensite distribution at the inner surface after different heat transfer coefficients is shown. The hardening depth HD decreases with smaller heat transfer coefficients and results in higher compressive residual stresses. The effect of increasing compressive stresses with decreasing hardening depths can also be detected in induction hardened parts. With increasing hardening depths, the arising compressive stresses at the inner surface decrease due to the martensitic transformation combined with its volume change at inner sections. The residual stresses in axial direction, sustained by volume sections with the same inner surface distance, do not show a notable dependence on the final hardening depth as can be noticed in Section 4.3, as well. With maximum compressive stresses of 1450   MPa in tangential and 1700   MPa in axial direction, more favorable stress states can be realized with the unalloyed steel.

5. Results and Discussion of Experiments and Validation

For both steels, a heat treatment resulting in high compressive residual stresses at the inner surface was experimentally carried out. For AISI 4140, a process route with an inner quenching temperature T i n of 300   C and a cooling rate v i n , c o o l of 100   K / s combined with a discontinuous cooling of the outer surface to a quenching temperature T o u t of 650   C was chosen (marked in Figure 8). The cooling time was 200   s . It has to be said that an outer quenching temperature of 550   C , inducing higher simulative compressive stresses, was experimentally not feasible due to the fact that a high inner quenching temperature T i n of 300   C is not achievable with a too low overall temperature level in the sample. An inner cooling rate v i n , c o o l of 100   K / s was chosen. In the case of AISI 1045, the inner surface was quenched with a water pressure of 60   bar which corresponds to a heat transfer coefficient of around 30   k W / mm 2 (see [14]). The outer surface was subsequently cooled down with a cooling rate v o u t , c o o l of 3   K / s . The chosen process route is marked in Figure 12. During the heat treatment, the borehole temperature was experimentally measured and controlled over a thermocouple with a distance of 500 μ m to the surface. This means that the true inner surface temperature differs to the simulated one. Therefore, the temperature boundary θ 1 was adopted in such a way that the simulated temperature with a distance of 500 μ m to the inner surface corresponds to the measured temperature. The following simulative results of the experimental performed cooling strategies will refer to this adaptation. The final investigated cooling strategies of both steels in context with their corresponding TTT-diagrams are presented in Figure 14.
It is obvious that the identified optimal heat treatments have been realized very well with the Internal Quenching device. Due to the accurate adjustment of the simulated temperature profiles, the cooling rates at the inner surface can be estimated. In the case of AISI 4140, an averaged cooling rate of v i n , c o o l 300   K / s to the martensite start temperature can be determined. Regarding the inner surface temperature during an uncontrolled quenching (Figure 14a) to the martensite start temperature an averaged cooling rate v i n , c o o l over 2000   K / s is achieved. Despite a continuous flow of the pressurized water, the cooling rate drops down after reaching the martensite start temperature and a nearly isothermal state is reached due to the outer inductive heat input. The simulated microstructure, hardness distribution and the residual stresses are presented in Figure 15. The results for AISI 4140 show a hardened martensitic inner surface with a smooth transition into fully bainitic outer sections, inducing wide ranged compressive residual stresses up to a distance of 5   mm . The arising compressive stresses are compensated by tensile residual stresses of about 250   MPa at the outer surface. In comparison to that, a sharp transition from a hardened martensitic inner surface into a bainitic microstructure can be detected in the case of AISI 1045. Due the sharp phase transition, the resulting residual stresses, especially in tangential direction, show higher gradients at the inner sections. With the simulated cooling conditions, a fully ferritic/perlitic microstructure is achieved at a distance of around 5   mm from the inner surface leading to a nearly constant hardness up to the outer surface.

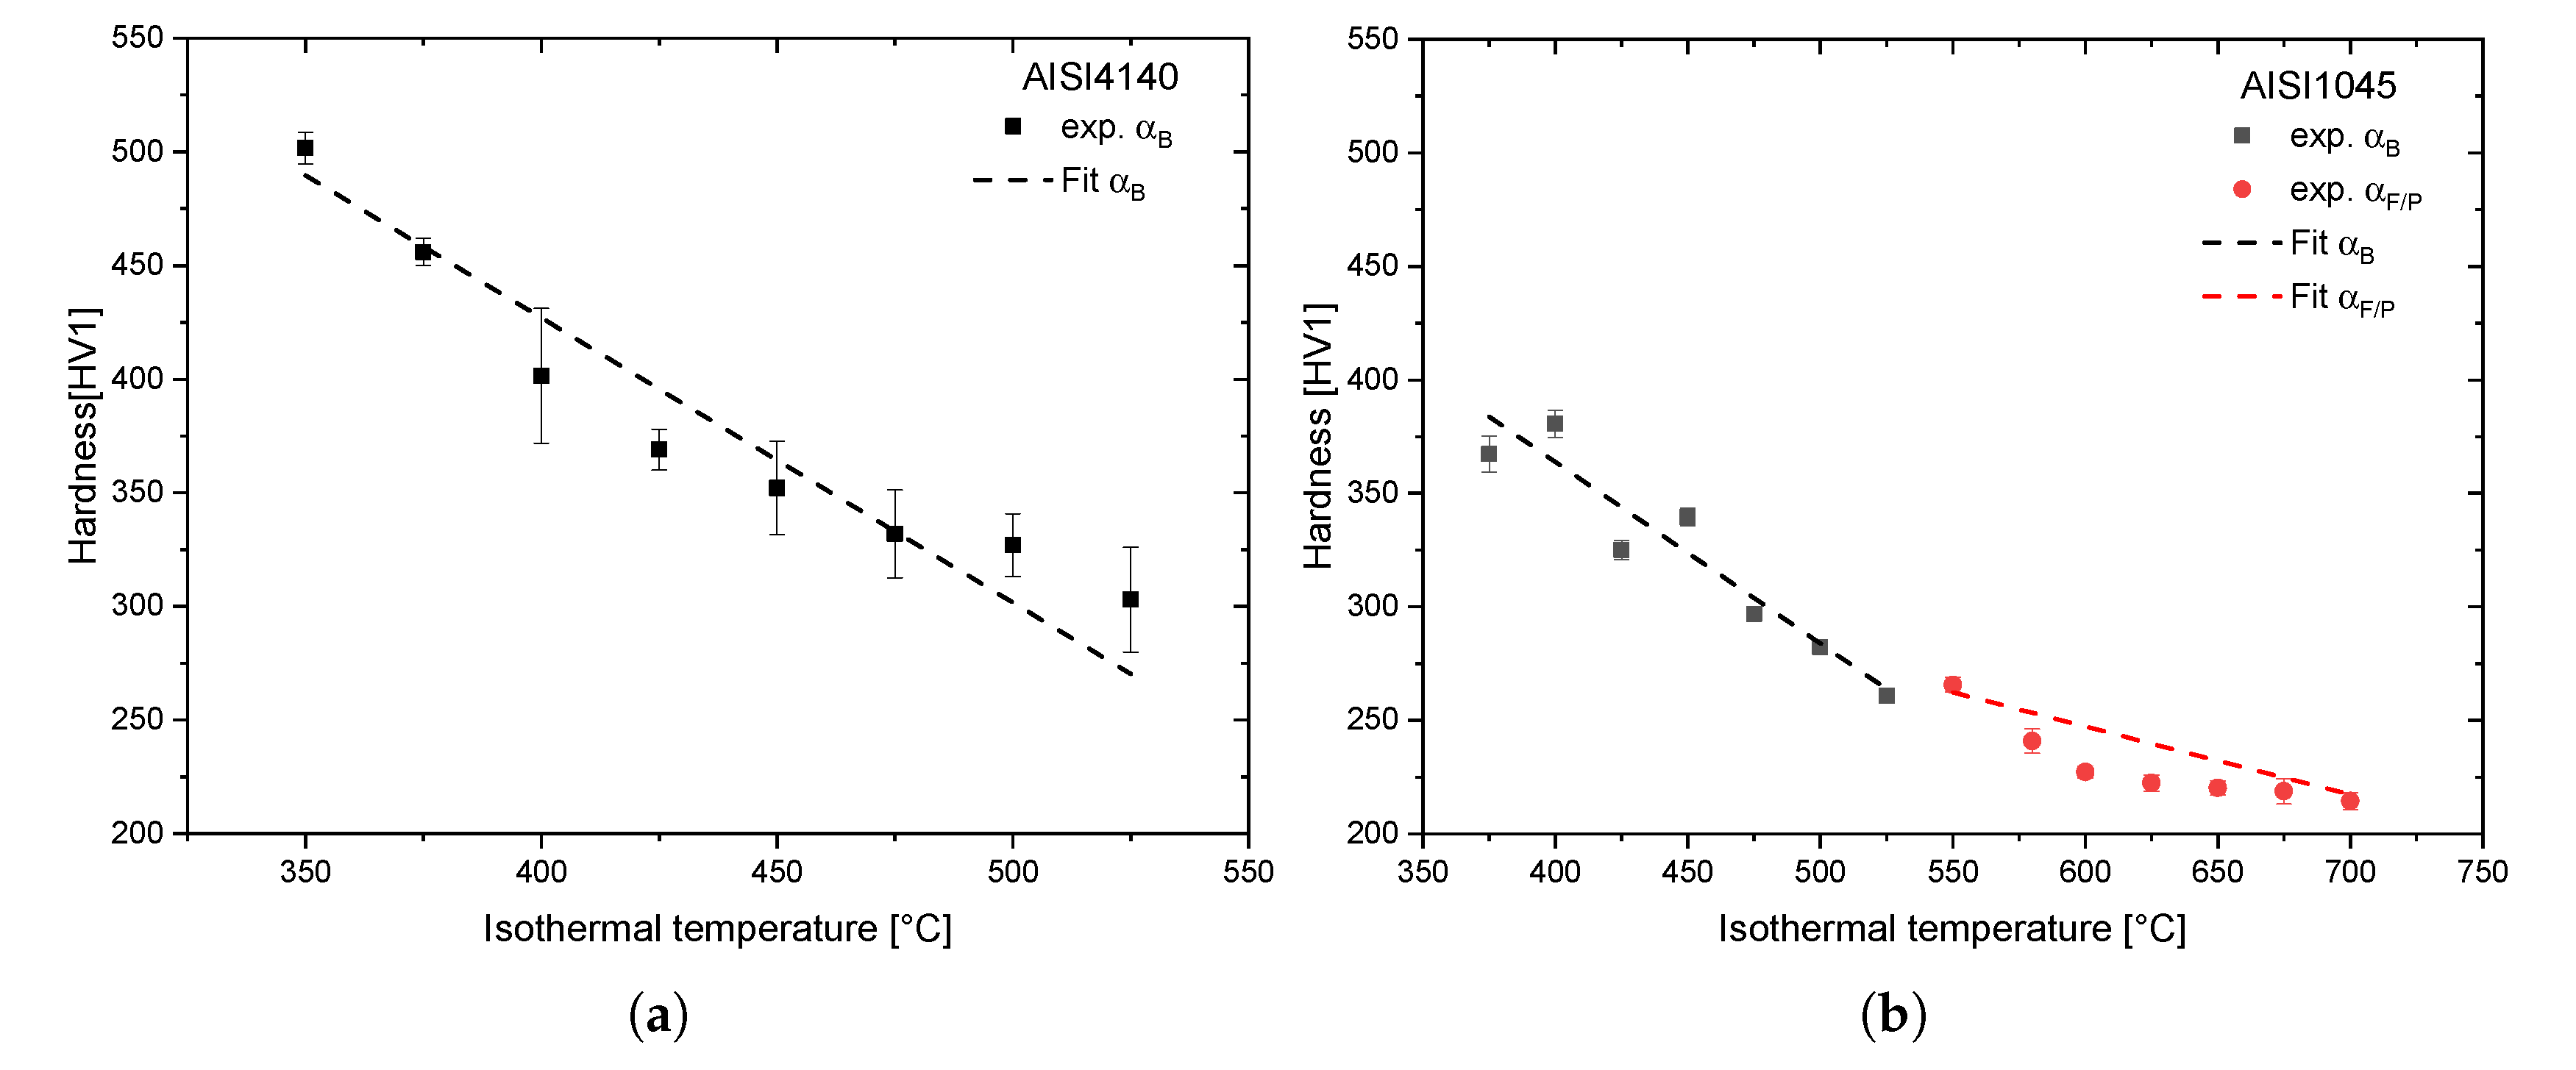
5.1. Microstructure and Hardness

The resulting microstructure of both steels after the heat treatments is shown in Figure 16. In the case of AISI 4140 (Figure 16a), the inner surface shows a martensitic microstructure up to 2   mm , which passes into a mixed microstructure up to 5   mm and a fully bainitic outer surface. The hardness distribution confirms the metallographic results with a hardness of 600   HV at the inner surface up to 2   mm . The following mixed bainitic/martensitic microstructure decreases the hardness to 450   HV and causes higher standard deviations. A very smooth transition of the hardened inner surface to the softer outer surface, showing a hardness of around 350   HV , is achieved. The simulated hardness profile after the quenching process correlates very well with the experimental results. A slight simulative overestimation of the hardness at the transition zone and an underestimation at the outer surface can be noticed. The overestimation of the hardness at the transition zone indicates a martensite content, which is too high in the simulation. The simulative neglection of a stress-dependent bainite transformation, already investigated by [28], which would lead to lower martensite contents, is one explanation for this discrepancy. In the work of [28], the interaction of stress and phase transformation is discussed for various steels. Their findings of a accelerated phase transformations due to stresses where confirmed for a bainitic transformation at the steel 22MnB5 by [29]. In addition, a lower martensite start temperature due to a carbon enrichment of the austenitic phase during bainite formation can affect the bainite content in the transition zone, which was investigated in the work of [30,31] for a Si-steel regarding an incomplete bainite formation. The simulated hardness values at the outer section are smaller than the experimental values since the model is based on isothermal experiments with longer process times leading to bigger grain sizes and a therefore reduced hardness.
A hardened inner surface up to a distance of 2   mm can also be detected for the unalloyed steel AISI 1045 (Figure 16b). Here, the resulting hardness profile confirms the sharp transition into a ferritic perlitic microstructure. This is because of the low amount of bainite and a small transition zone with mixed microstructure of martensite and bainite. Interestingly, the maximum hardness is above the hardness of AISI 4140. A possible reason for the lower hardness of the AISI 4140 is the higher temperature at the inner surface during the controlled cooling causing self annealing effects in the hardened section. Furthermore, the regulation itself can cause annealing due to more temperature fluctuations, which is not the case during the continuous quenching at the inner surface for AISI 1045. All in all, the hardness profile and the transition into a mixed microstructure, respectively, into a ferritic perlitic microstructure at a distance from the inner surface of 2   mm is predicted precisely with the presented transformation models.

5.2. Residual Stresses

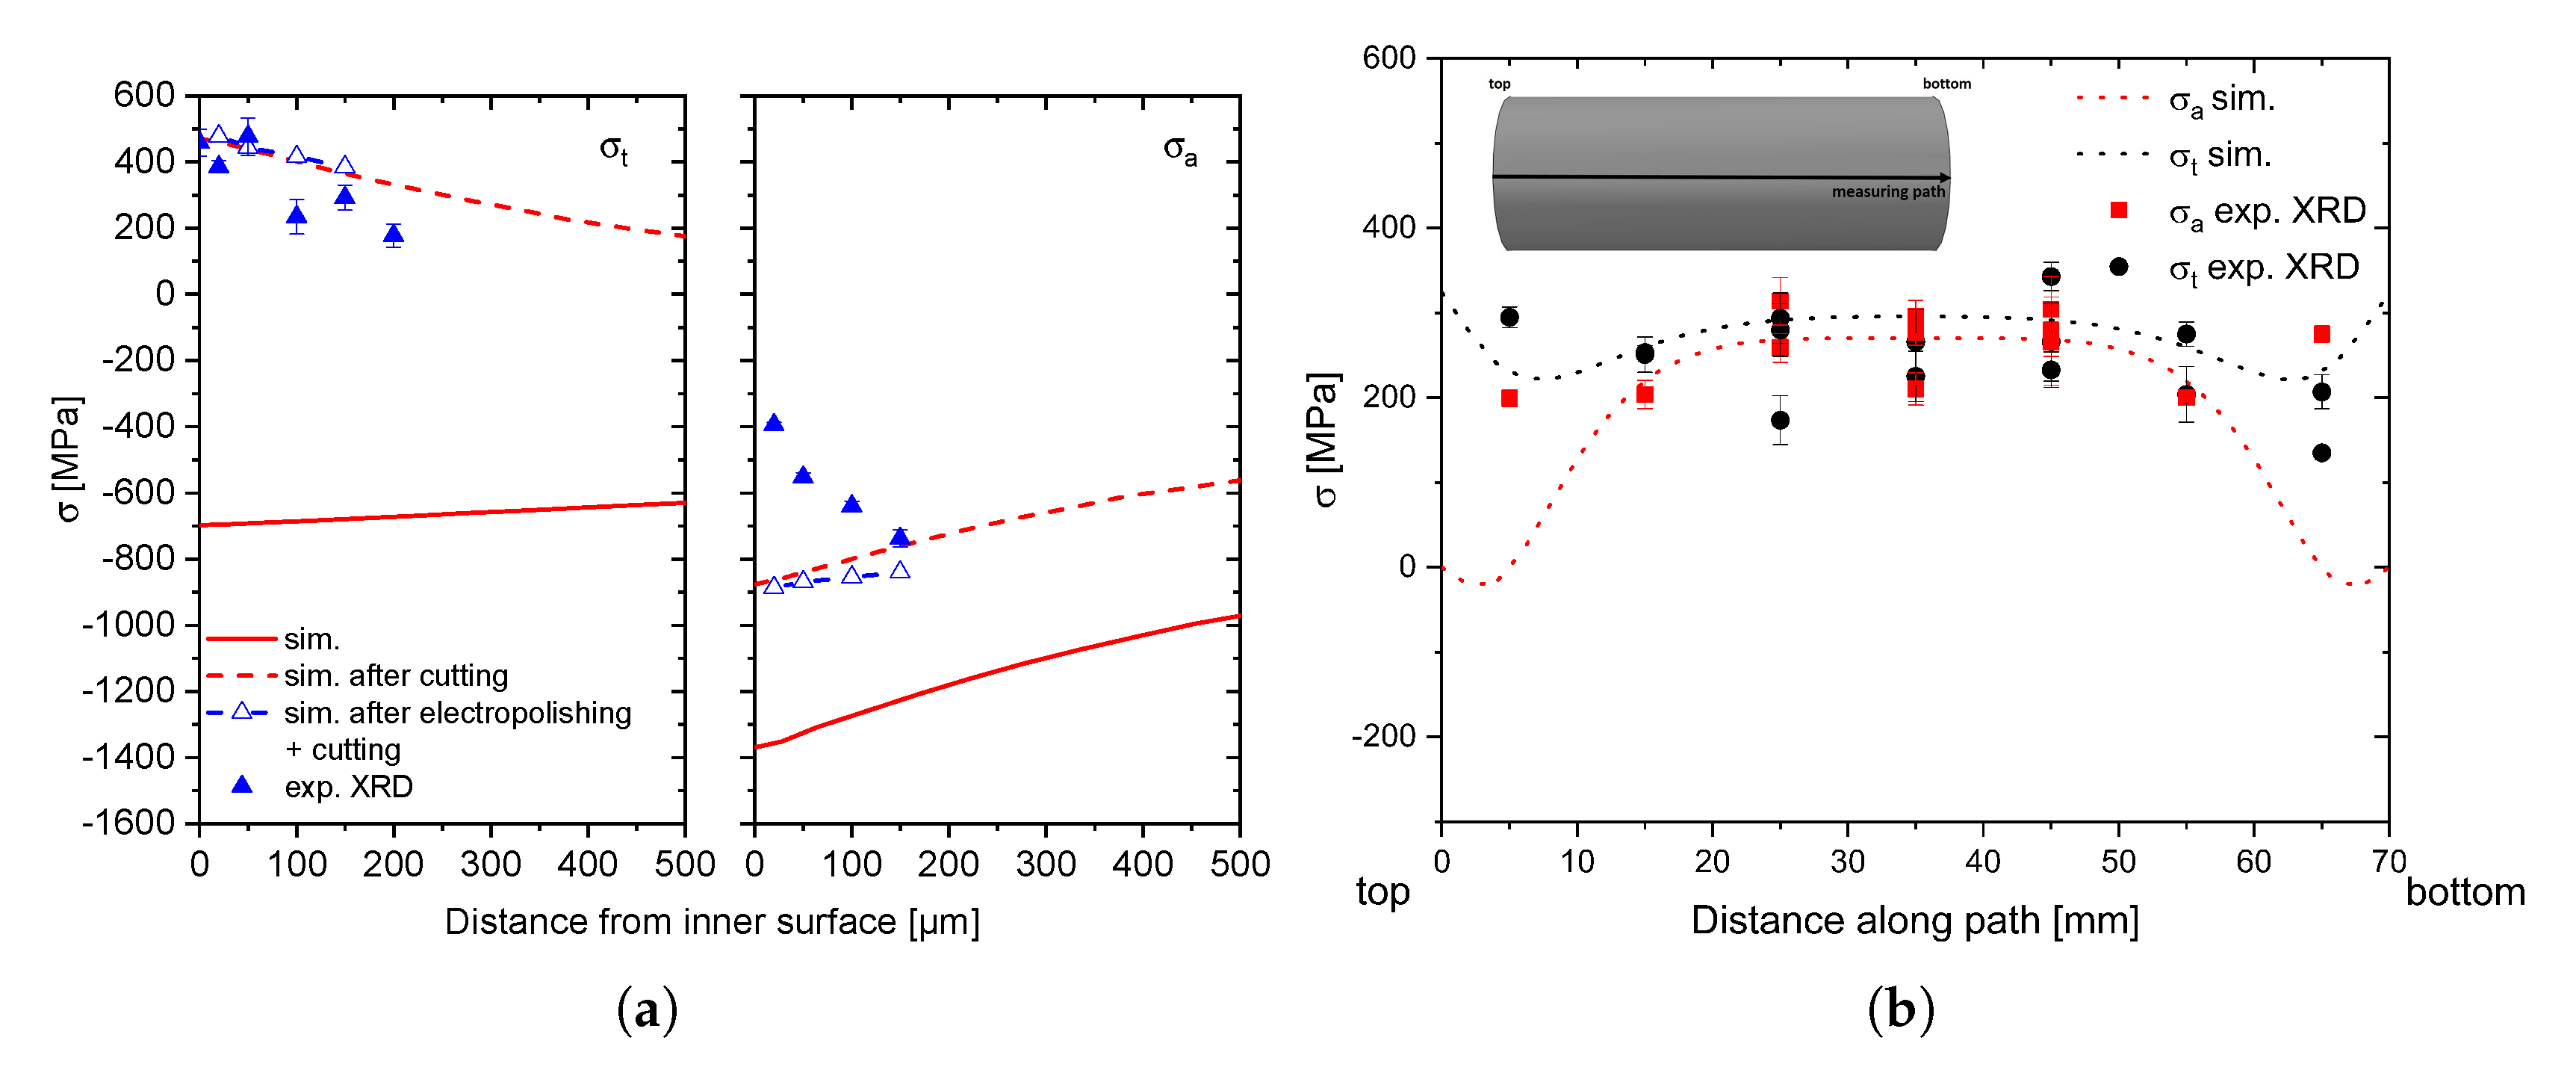
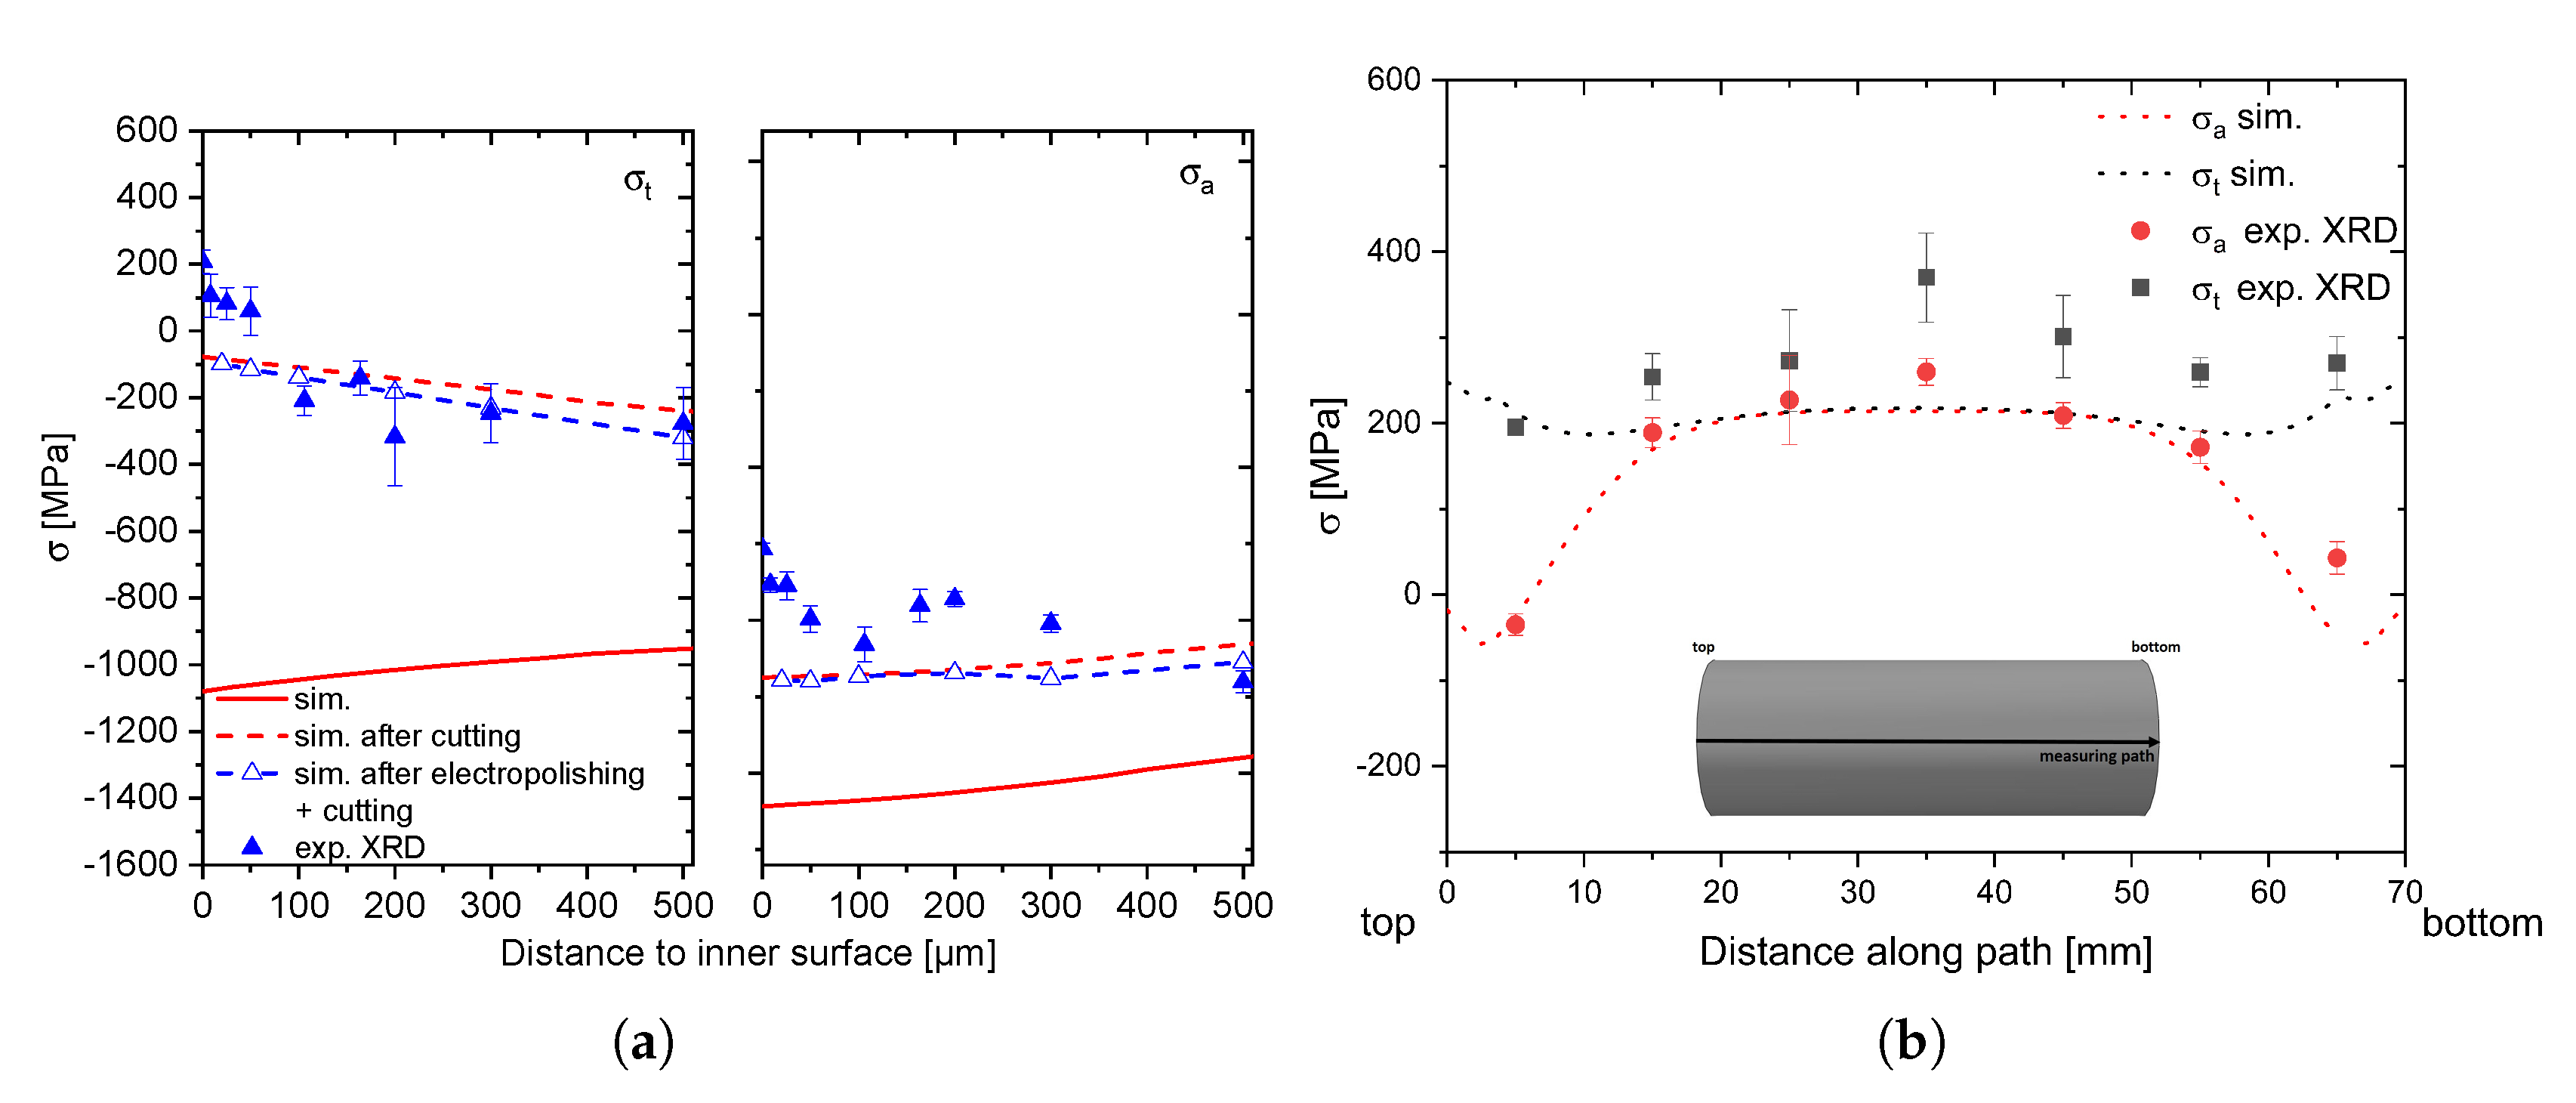
5.2.1. X-ray Diffraction Analysis

The validation of the residual stress simulations is shown in Figure 17 and Figure 18. Here, the measured residual stresses at the inner surface in the center of the borehole after cutting (a) up to a distance of 200 μ m and at the outer surface along the height of the sample (b) are presented. Considering the stress state at the inner sections the simulative results, including the cutting and the electrolytic removal process, show that the cutting process has a significant effect on the residual stresses. Especially in tangential direction, a switch of the compressive residual stresses into tensile stresses for both investigated stress states can be detected. Comparing the measurements and the corrected simulative results, a good accordance of the tangential stresses can be seen. In the case of AISI 4140, tensile residual stresses of 500 MPa at the inner surface were measured, decreasing to 200 MPa at a depth of 200 μ m. In the case of the unalloyed steel, maximum tensile residual stresses of 170   MPa were measured, indicating higher compressive residual stresses in the uncut sample compared to AISI 4140, which is also predicted by the simulation. Regarding the simulated and experimentally measured axial residual stress, notable discrepancies can be seen. Especially, for the alloyed steel (Figure 17a, right), the experimental results show a increase of the axial compressive stresses with increasing surface distance from 400   MPa to 800   MPa , whereas the simulative results show compressive residual stresses of 900   MPa with a slight decreasing trend. The lower axial compressive residual stresses at the surface indicate increasing compressive stresses up to 100 μ m in the uncut sample. A better qualitative and quantitative agreement of the axial residual stresses can be noticed for AISI 1045 (Figure 18a, right). Here, the experimental, as well as the simulative, results show nearly constant axial compressive residual stresses between 800   MPa and 1000   MPa . The simulative overestimation of the axial residual stresses in both cases can be caused by annealing effects at the inner surface during the heat treatment, which are not taken into account in the simulation. Tempering processes can reduce the residual stresses due to the arising transformation strains, as well as the transformation induced plasticity as it was shown in [17]. Because of the slow cooling rates after reaching the martensite start temperature these effects, which decrease the residual stresses, can also be an issue during the Internal Quenching heat treatment. Especially for AISI 4140, where the inner surface shows a nearly constant temperature of 250   C during the cooling of the outer sections, the formation of cementite can reduce the present residual stresses. The hardness measurements affirm this by showing hardness values of 600   HV indicating tempering effects at the inner surface [26]. With an unregulated continuous cooling the tempering effects are smaller expressed by higher hardness values and compressive residual stresses in axial direction at the inner surface of the unalloyed steel.
The results of the measurements at the outer surface correlate very well with the simulation, showing tensile stresses between 200   MPa and 300   MPa for both steels, compensating the inner compressive residual stresses. Furthermore, a good reproducibility of the process can be seen in Figure 17b, where measured values at the same height derive from different samples with the same heat treatment. The homogenous tangential stress state along the height indicates that similar cooling conditions over the entire sample can be reached with the Internal Quenching device. In addition, the decrease of the axial stresses to the front surfaces can be predicted precisely for AISI 1045, whereas a nearly homogenous axial stress state is measured along the path of AISI 4140. This indicates a sharper gradient to the front surfaces, which does not agree with the simulative results. Possible temperature inhomogeneities along the z-axis of the sample due to the inductive reheating and the regulation of the inner surface temperature could be the reason for these discrepancies between simulation and experiment. In the case of an uncontrolled inner quenching, the residual stresses at the outer surface correlate very well with the simulative results.

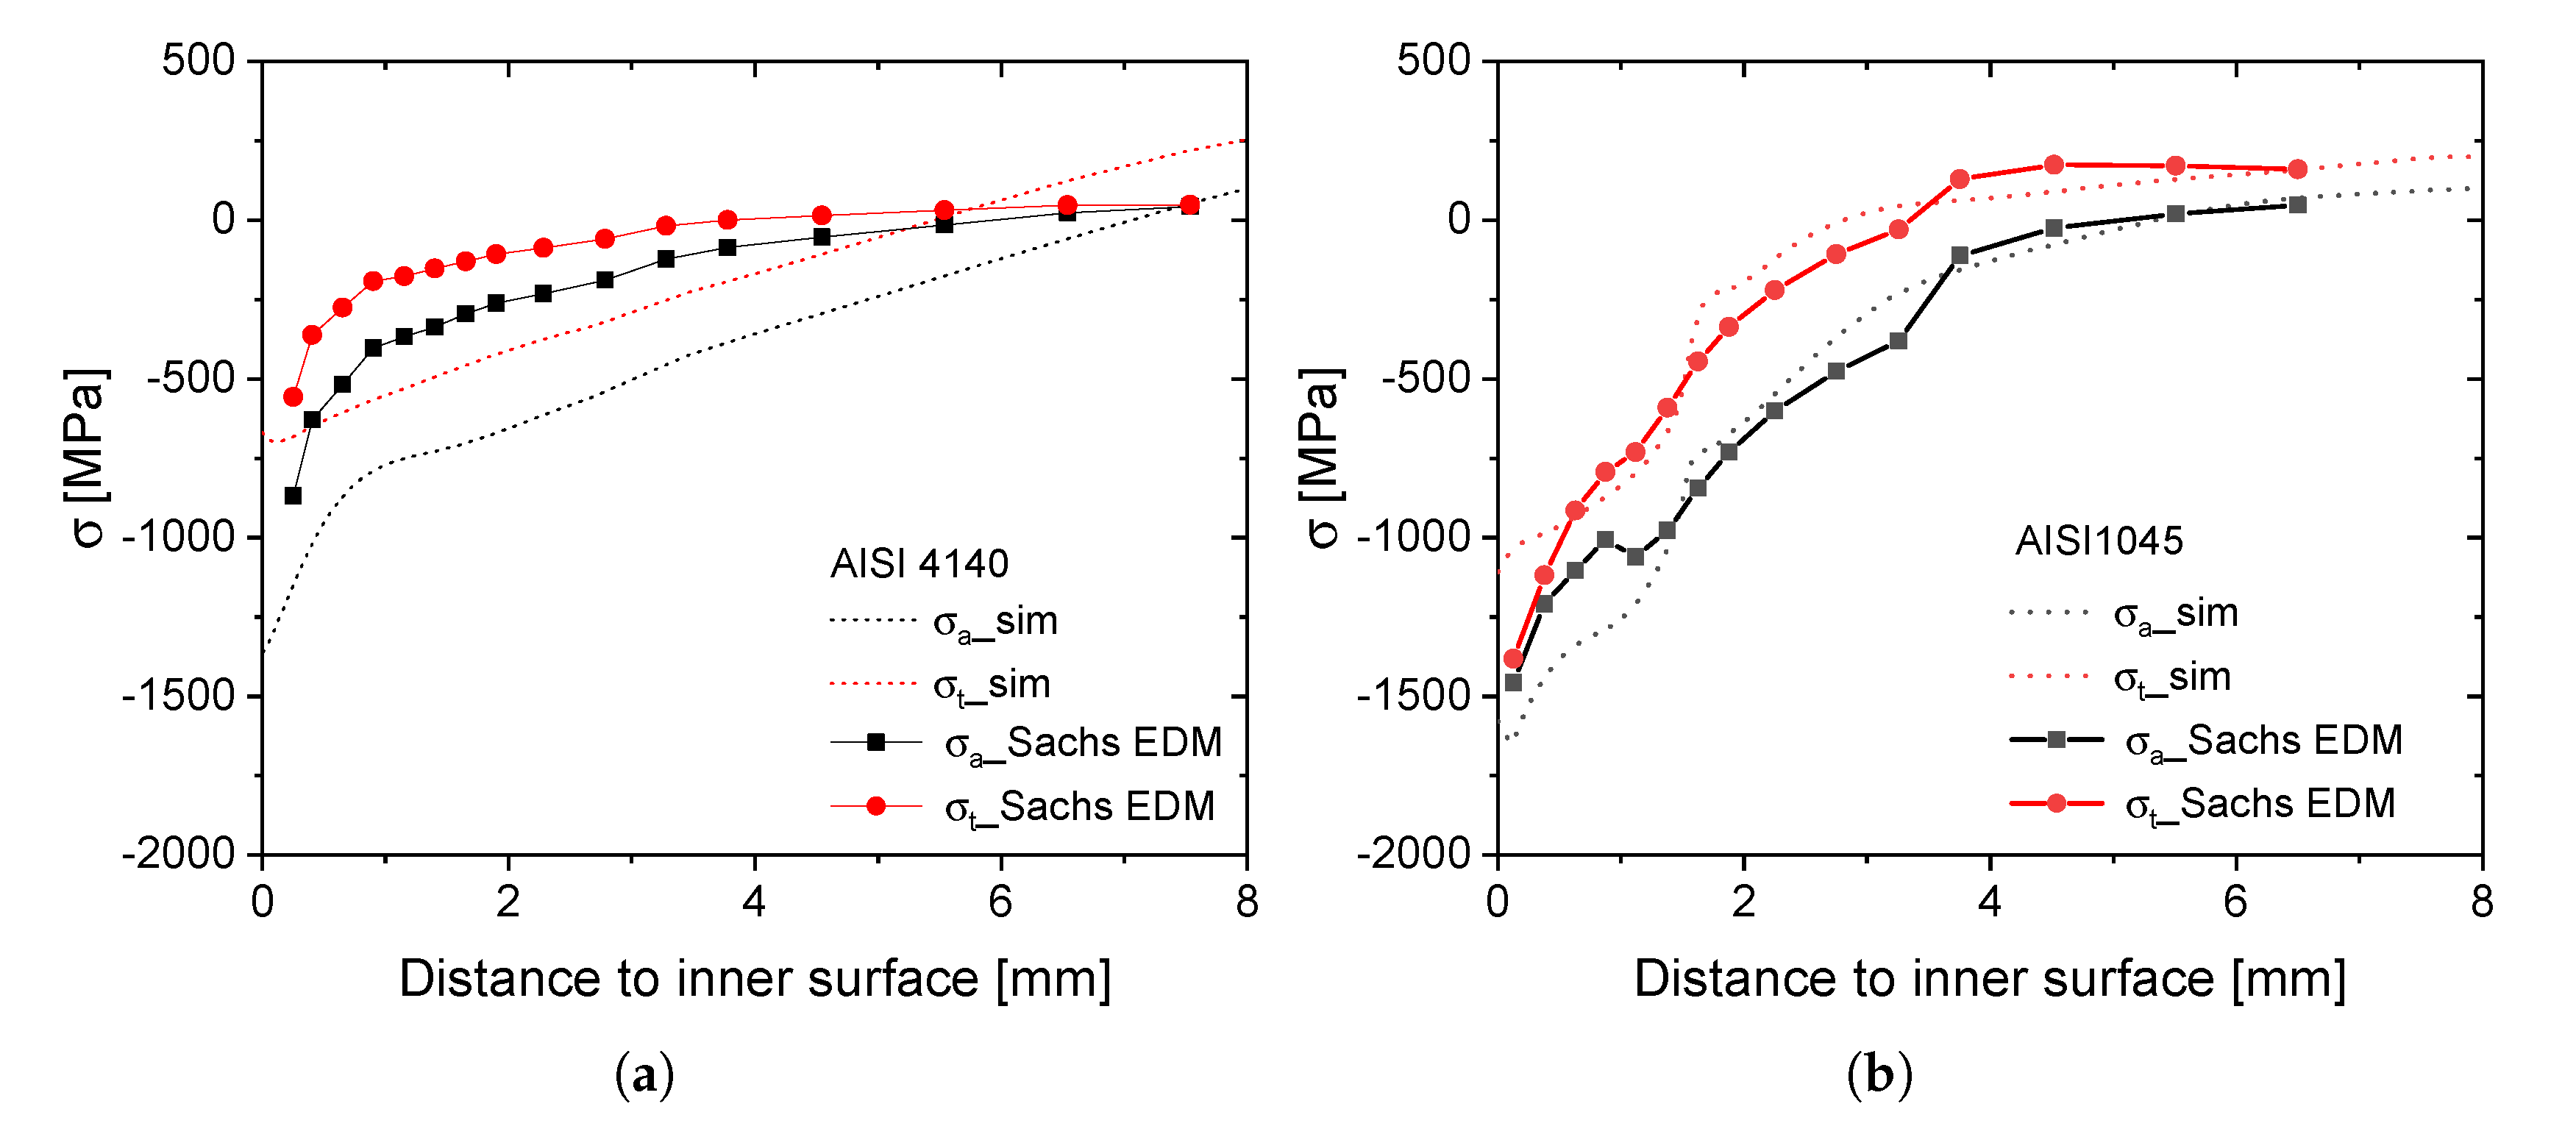
5.2.2. Sachs EDM Measurements

The results obtained from the Sachs method in Figure 19 confirm the simulative predicted compressive stress state at the inner surface for both steels. Especially for AISI 1045, there is a good qualitative, as well as a quantitative accordance between simulation and experiment. In the case of AISI 4140, the measured residual stress development shows only an accordance in a qualitative manner. Here, the experimental result shows an overall lower residual stress level compared to the simulative predictions. This confirms the results of the metallographic and XRD analysis, indicating annealing effects due to the regulated process.

6. Conclusions

The presented work includes simulative, as well as experimental investigations of the newly developed heat treatment method Internal Quenching in order to improve the inner surface state of thick walled tubes. The aim was to use a comprehensive multiphysical FE-model for the Internal Quenching process to elaborate optimal heat treatment strategies resulting in a hardened inner surface with high compressive residual stresses. Two different heat-treatable steels, which differ mainly in their hardenability, were considered. On the one hand, the alloyed steel AISI 4140 and on the other the unalloyed steel AISI 1045. Most of the thermal and mechanical material properties could be extracted from literature. Concerning the metallurgical properties, additional isothermal dilatometric experiments were carried out and the investigated phase transformations were modeled with established models from literature showing a very good accordance to the experimental results. Additional hardness measurements were conducted extending the FE-model to predict the resulting hardness distribution precisely. Using the developed FE-Model, the influence of different cooling strategies was investigated and elaborated in a simulation study. An overall statement of the study is that the tangential compressive residual stresses are more sensitive to changes in the heat treatment strategy than the ones in axial direction. In the case of the alloyed steel AISI 4140, the study clarified that the arising compressive stresses at the inner surface strongly depend on the bainite content and the temperature level in the outer sections at the time when the inner surface temperature T i n drops below the martensite start temperature M s . It was shown that in a discontinuous cooling process inner quenching temperatures just below M s in combination with an outer quenching temperature T o u t of 550   C results in maximum compressive residual stresses. The impact of the inner cooling rate v i n , c o o l on the residual stress state is less important compared to the inner quenching temperature T i n , whereas the outer cooling rate T o u t , defining the bainite content in the outer sections has a significant influence. For the unalloyed steel, the simulative study showed surprisingly the contrary. Due to the fast diffusive phase transformation, the outer cooling conditions are less sensitive to the final residual stress state at the inner surface. Here, the residual stresses strongly depend on the hardening depth, which can be adjusted over the inner cooling rate.
The presented simulation study allows a selection of an ideal heat treatment for both steels, resulting in a hardened inner surface with high compressive residual stresses. The microstructure, as well as the residual stresses, were therefore analyzed after an optimal heat treatment with the Internal Quenching device. The experimental results, validating the simulative predictions of microstructure and residual stresses very precisely, affirm Internal Quenching as a promising and flexible heat treatment method for inner surfaces of thick-walled tubes. To sum up, this work showed the possiblities of an accurate heat treatment simulation model to predict new and innovative heat treatment strategies. Besides getting a deeper process understanding of the Internal Quenching process, the FE-Model was used as an optimization tool, predicting the most promising heat treatment strategies for two different steels. Furthermore, possible improvements of the simulation model have been indentified considering stress-dependent phase transformations and annealing effects.

Author Contributions

Conceptualization, F.M. and S.D.; methodology, F.M.; investigation, F.M. and M.K.; data curation, M.K.; writing–original draft preparation, F.M.; writing–review and editing, F.M.; supervision, S.D. and V.S.; All authors have read and agreed to the published version of the manuscript

Funding

This research was supported by the German Research Foundation (DFG) program with the grant number 299152500.

Acknowledgments

The authors want to thank J. Gibmeier for providing the X-ray diffractometer and D. Kiefer for supporting the X-ray measurements.

Conflicts of Interest

The authors declare no conflict of interest.

Appendix A. Input Parameters

Table A1. Input parameters for the FE-model of A I S I 4140 .
QuantityUnitPhase i = 0 i = 1 i = 2 i = 3 Source
λ W / ( m K ) γ 21.1 3.14 × 10 2 2.87 × 10 5 0[32]
λ W / ( m K ) α F / P , α B , α M 44.23 5.97 × 10 4 1.79 × 10 5 0[32]
c p J / ( k g K ) γ 476 0.103 00[32]
c p J / ( k g K ) α F / P , α B , α M 233 0.586 00[32]
Δ Q α γ J / k g - 8.3 × 10 4 000this work
Δ Q γ α J / k g - 8.3 × 10 4 000this work
E GPa γ 283.0 0.211 00[33]
E GPa α F / P , α B , α M 284.5 0.456 7.29 × 10 4 4.43 × 10 7 [20]
α K 1 γ 2.3 × 10 5 000[32]
α K 1 α B 7.9 × 10 6 1.25 × 10 8 00this work
α K 1 α M 8.9 × 10 6 1.09 × 10 8 00this work
K γ α B MP a 1 - 7.4 × 10 4 000this work
K γ α M MP a 1 - 6.04 × 10 5 000this work
κ T 490   C -- 0.01845 3.29 × 10 5 --this work
κ 490   C T 535   C -- 0.028 2.94 × 10 5 --this work
λ -- 12.44 000this work
Δ ε α γ -- 0.092 000this work
Δ ε γ α B -- 0.0076 000this work
Δ ε γ α M -- 0.0093 000this work
σ y , γ MPa γ 427.2 0.405 7.60 × 10 5 0[32]
R 0 , γ MPa γ 351.1 7.51 0.0062 0[32]
R 1 , γ MPa γ 32.3 9.66 × 10 4 00[32]
e γ - γ 410.5 0.277 00[32]
σ y , α B MPa α B 1907.83 6.76 0.014 9.82 × 10 6 [21]
R 0 , α B MPa α B 2000.0 000[21]
R 1 , α B MPa α B 300000[21]
e α B - α B 250000[21]
σ y , α M MPa α M 1650.0 0.77 00[21]
R 0 , α M MPa α M 0000[21]
R 1 , α M MPa α M 0000[21]
e α M - α M 0000[21]
Table A2. Input parameters for the FE-model of A I S I 1045 .
QuantityUnitPhase i = 0 i = 1 i = 2 i = 3 Source
λ W / ( mK ) γ 11.68 0.01155 00[22]
λ W / ( mK ) α F / P , α B , α M 49.17 0.21 00[22]
c p J / ( k g K ) γ 491 0.115 00[22]
c p J / ( k g K ) α F / P , α B , α M 401.95 0.285 00[22]
Δ Q α γ J / k g - 8 × 10 4 000[22]
Δ Q γ α J / k g - 8 × 10 4 000[22]
E GPa γ 283.0 0.211 00[33]
E GPa α F / P , α B , α M 284.5 0.456 7.29 × 10 4 4.43 × 10 7 [20]
α K 1 γ 2.1 × 10 5 000this work
α K 1 α B 14.73 × 10 6 1.25 × 10 8 00this work
α K 1 α M 6.2 × 10 6 000this work
K γ α F / P MP a 1 - 5.2 × 10 5 000this work
K γ α B MP a 1 - 5.2 × 10 5 000this work
K γ α M MP a 1 - 5.2 × 10 5 000this work
n γ α F / P T 650   C -- 3.6 0.004 00this work
n γ α F / P 580   C T 650   C -- 8445.5 42.409 0.071 × 10 5 3.95 × 10 5 this work
ln b γ α F / P T 650   C -- 5.76 0.0058 00this work
ln b γ α F / P 580   C T 650   C -- 20756.967 102.60798 0.1689 9.26 × 10 5 this work
n γ α B -- 13.33 0.048 4.91 × 10 5 0this work
ln b γ α B -- 56.34 0.203 1.93 × 10 4 0this work
Δ ε γ α F / P -- 0.0069 000this work
Δ ε γ α B -- 0.00851 000this work
Δ ε γ α M -- 0.0093 000this work
σ y , γ MPa γ 174.91 0.152 00[22]
R 0 , γ MPa γ 351.1 7.51 0.0062 0[21]
R 1 , γ MPa γ 32.3 9.66 × 10 4 00[21]
e γ - γ 410.5 0.277 00[21]
σ y , α F / P MPa α F / P 392.18 0.33 00[22]
R 0 , α F / P MPa α F / P 2000000[21]
R 1 , α F / P MPa α F / P 300000[21]
e α F / P - α F / P 410.5 000[21]
σ y , α B MPa α B 645.27 0.676 00[22]
R 0 , α B MPa α B 2000000[21]
R 1 , α B MPa α B 300000[21]
e α B - α B 250000[21]
σ y , α M MPa α M 1598 0.636 00[22]
R 0 , α M MPa α M 0000[21]
R 1 , α M MPa α M 0000[21]
e α M - α M 0000[21]

References

  1. Vormwald, M.; Schlitzer, T.; Panic, D.; Beier, H.T. Fatigue strength of autofrettaged Diesel injection system components under elevated temperature. Int. J. Fatigue 2018, 113, 428–437. [Google Scholar] [CrossRef]
  2. Dewangan, M.K.; Panigrahi, S.K. Residual stress analysis of swage autofrettaged gun barrel via finite element method. J. Mech. Sci. Technol. 2015, 29, 2933–2938. [Google Scholar] [CrossRef]
  3. Perl, M.; Saley, T. Swage and hydraulic autofrettage impact on fracture endurance and fatigue life of an internally cracked smooth gun barrel Part I – The effect of overstraining. Eng. Fract. Mech. 2017, 182, 372–385. [Google Scholar] [CrossRef]
  4. Krug, T.; Lang, K.H.; Fett, T.; Löhe, D. Influence of residual stresses and mean load on the fatigue strength of case-hardened notched specimens. Mater. Sci. Eng. A 2007, 468–470, 158–163. [Google Scholar] [CrossRef]
  5. Liu, H.; Liu, H.; Bocher, P.; Zhu, C.; Sun, Z. Effects of case hardening properties on the contact fatigue of a wind turbine gear pair. Int. J. Mech. Sci. 2018, 141, 520–527. [Google Scholar] [CrossRef]
  6. Bepari, M. 2.3 Carburizing: A Method of Case Hardening of Steel. In Comprehensive Materials Finishing; Hashmi, S., Ed.; Elsevier: Oxford, UK; Waltham, MA, USA, 2017; pp. 71–106. [Google Scholar] [CrossRef]
  7. Kiefer, D.; Schüssler, P.; Mühl, F.; Gibmeier, J. Experimental and Simulative Studies on Residual Stress Formation for Laser-Beam Surface Hardening. HTM J. Heat Treat. Mater. 2019, 74, 23–35. [Google Scholar] [CrossRef] [Green Version]
  8. Areitioaurtena, M.; Segurajauregi, U.; Urresti, I.; Fisk, M.; Ukar, E. Predicting the induction hardened case in 42CrMo4 cylinders. Procedia CIRP 2020, 87, 545–550. [Google Scholar] [CrossRef]
  9. Kobasko, N.I.; Aronov, M.A. 12.07—Intensive Quenching. In Comprehensive Materials Processing; Hashmi, S., Ed.; Elsevier: Oxford, UK, 2014; pp. 253–269. [Google Scholar] [CrossRef]
  10. Kobasko, N.I. Intensive Quenching Systems: Engineering and Design; ASTM MNL; ASTM International: West Conshohocken, PA, USA, 2010; Volume 64. [Google Scholar]
  11. Rath, J. Maximierung der Randnahen Druckeigenspannung von Stählen mit Hilfe einer Hochgeschwindigkeits-Abschreckanlage. Ph.D. Thesis, Universität Bremen, Bremen, Germany, 2012. [Google Scholar]
  12. Kobasko, N. Intensive Steel Quenching Methods. In Theory and Technology of Quenching—A Handbook; Springer: New York, NY, USA, 1992; pp. 367–389. [Google Scholar]
  13. Habschied, M.; de Graaff, B.; Klumpp, A.; Schulze, V. Fertigung und Eigenspannungen. HTM J. Heat Treat. Mater. 2015, 70, 111–121. [Google Scholar] [CrossRef]
  14. Muehl, F.; Dietrich, S.; Schulze, V. Internal Quenching: Ideal Heat Treatment for Difficult to Access Component Sections. HTM J. Heat Treat. Mater. 2019, 74, 191–201. [Google Scholar] [CrossRef]
  15. Eigenmann, B.; Macherauch, E. Röntgenographische Untersuchung von Spannungszuständen in Werkstoffen. Tl. 3. Mater. Wiss. u. Werkstofftech. 1996, 27, 426–437. [Google Scholar] [CrossRef]
  16. Peiter, A. Eigenspannungen 1. Art: Ermittlung und Bewertung; Triltsch: Düsseldorf, Germany, 1966. [Google Scholar]
  17. Kaiser, D.; Damon, J.; Mühl, F.; de Graaff, B.; Dietrich, S.; Schulze, V. Experimental investigation and finite-element modeling of the short-time inductive quench-and-temper process. J. Mater. Process. Technol. 2019, 279, 116485. [Google Scholar]
  18. Liščić, B. (Ed.) Quenching Theory and Technology, 2nd ed.; CRC Press: Boca Raton, FL, USA; IFHTSE: Zurich, Switzerland, 2010. [Google Scholar]
  19. Desalos, Y. Comportement Dilatométrique et Mécanique de L’austénite Métastable d’un Acier A 533; Rapport Technique N • 95349401; IRSID: Saint-Germainen-Lay, France, 1981. [Google Scholar]
  20. Kaiser, D. Experimentelle Untersuchung und Simulation des Kurzzeitanlassens unter Berücksichtigung Thermisch randschichtgehärteter Zustände am Beispiel von 42CrMo4. Ph.D. Thesis, Karlsruhe Institute of Technology, Karlsruhe, Germany, 2019. [Google Scholar]
  21. Mioković, T. Analyse des Umwandlungsverhaltens bei ein- und mehrfacher Kurzzeithärtung bzw. Laserstrahlhärtung des Stahls 42CrMo4. In Schriftenreihe Werkstoffwissenschaft und Werkstofftechnik; Vol. Band 25/2005; Shaker Verlag: Aachen, Germany, 2005. [Google Scholar]
  22. Graja, P. Rechnerische und Experimentelle Untersuchungen zum Einfluß Kontinuierlicher und Diskontinuierlicher Wärmebehandlungsverfahren auf die Wärme- und Umwandlungseigenspannungen und Verzüge von un- und Niedriglegierten Stählen. Ph.D. Thesis, Karlsruhe Institute of Technology, Karlsruhe, Germany, 1987. [Google Scholar]
  23. Majorek, A. Der Einfluärmeübergangs auf die Eigenspannungs- und Verzugsausbildung beim Abschrecken von Stahlzylindern in Verdampfenden Flüssigkeiten. Ph.D. Thesis, Karlsruhe Institute of Technology, Karlsruhe, Germany, 1996. [Google Scholar]
  24. Van Bohemen, S.M.C.; Sietsma, J. Modeling of isothermal bainite formation based on the nucleation kinetics. Int. J. Mater. Res. 2008, 99, 739–747. [Google Scholar] [CrossRef]
  25. Avrami, M. Kinetics of Phase Change. I General Theory. J. Chem. Phys. 1939, 7, 1103–1112. [Google Scholar] [CrossRef]
  26. De Graaff, B.; Autenrieth, H.; Hoffmeister, J.; Schulze, V. Investigation on Short Time Tempering by Induction Heating of the low alloyed AISI 4140 steel. In Proceedings of the European Conference on Heat Treatment, Munich, Germany, 12–15 May 2014. [Google Scholar]
  27. Wever, F.; Rose, A. (Eds.) Atlas zur Wärmebehandlung der Stähle; Verl. Stahleisen: Düsseldorf, Germany, 1961. [Google Scholar]
  28. Denis, S.; Gautier, E.; Simon, A.; Beck, G. Stress–phase-transformation interactions—basic principles, modelling and calculation of internal stresses. Mater. Sci. Technol. 1985, 1, 805–814. [Google Scholar] [CrossRef]
  29. Said Schicchi, D.; Hunkel, M. Effect of Pre-strain and High Stresses on the Bainitic Transformation of Manganese-boron Steel 22MnB5. Metall. Mater. Trans. A 2018, 49, 2011–2025. [Google Scholar] [CrossRef]
  30. Van Bohemen, S.M.C.; Hanlon, D.N. A physically based approach to model the incomplete bainitic transformation in high-Si steels. Int. J. Mater. Res. 2012, 103, 987–991. [Google Scholar] [CrossRef]
  31. Ravi, A.M.; Sietsma, J.; Santofimia, M.J. Exploring bainite formation kinetics distinguishing grain-boundary and autocatalytic nucleation in high and low-Si steels. Acta Mater. 2016, 105, 155–164. [Google Scholar] [CrossRef] [Green Version]
  32. Schwenk, M. Numerische Modellierung der Induktiven Ein- und Zweifrequenzrandschichthärtung. Ph.D. Thesis, Karlsruhe Institute of Technology, Karlsruhe, Germany, 2012. [Google Scholar]
  33. Ahrens, U. Beanspruchungsabhängiges Umwandlungsverhalten und Umwandlungsplastizität Niedrig Legierter Stähle mit Unterschiedlich Hohen Kohlenstoffgehalten. Ph.D. Thesis, Universität Paderborn, Paderborn, Germany, 2003. [Google Scholar]
Figure 1. Internal Quenching device and schematical temperature evolution during the process overlaid on a schematic TTT-diagram.
Processes 08 01303 g001
Figure 2. Geometry of the specimen used for Internal Quenching heat treatment.
Processes 08 01303 g002
Figure 3. FE-model for the Internal Quenching heat treatment, including the mesh and boundary conditions (a) and 3D model for the simulation of the cutting process and electrolytic removal (b).
Processes 08 01303 g003
Figure 4. Experimental and modeled bainite volume fractions at different isothermal temperatures for AISI 4140.
Processes 08 01303 g004
Figure 5. Experimental and modeled ferrite/perlite (a) and bainite (b) volume fractions at different isothermal temperatures for AISI 1045.
Processes 08 01303 g005
Figure 6. Experimentally measured hardness as a function of the isothermal temperatures for AISI 4140 (a) and AISI 1045 (b).
Processes 08 01303 g006
Figure 7. Varied process parameters (left) and the investigated temperature fields of the internal and the external surface in the case of a continuous (bottom right) and a discontinuous (top right) cooling of the external surface for AISI 4140.
Processes 08 01303 g007
Figure 8. Simulated axial (a) and tangential (b) residual stresses at the inner surface in dependence of the internal and external quenching temperature.
Processes 08 01303 g008
Figure 9. Simulated stress development during the Internal Quenching heat treatment in tangential direction (a) and the resulting bainite content in the sample (b) at different external quenching temperatures (b).
Processes 08 01303 g009
Figure 10. Simulated axial (a) and tangential (b) residual stresses at the inner surface in dependence of the internal quenching temperature and internal cooling rate during a continuous cooling of the external surface with 3   K / s .
Processes 08 01303 g010
Figure 11. Influence of two different outer cooling rates on the resulting bainite content and residual stresses as a function of distance from surface using the same cooling conditions at the inner surface.
Processes 08 01303 g011
Figure 12. Simulated axial (a) and tangential (b) residual stresses at the inner surface in dependence of the heat transfer coefficient α and the outer cooling rate.
Processes 08 01303 g012
Figure 13. Simulated martensite distribution and the corresponding development of the tangential stresses in dependence of the heat transfer coefficient α using an outer cooling rate of 3   K / s .
Processes 08 01303 g013
Figure 14. Experimental measured and simulated temperatures at the inner and outer surface of the optimal heat treatment strategies for both investigated steels in the corresponding TTT-diagrams ((a): AISI 4140; (b): AISI 1045) [27].
Processes 08 01303 g014
Figure 15. Simulated phase, hardness and residual stress distribution after the described heat treatments for both AISI 4140 (a) and AISI 1045 (b).
Processes 08 01303 g015
Figure 16. Comparison between measured and simulated hardness as a function of the surface distance after the described optimal heat treatments for AISI 4140 (a) and AISI 1045 (b).
Processes 08 01303 g016
Figure 17. AISI 4140: Comparison between measured and simulated residual stresses at the inner surface as a function of the surface distance (a) and the outer surface along the height (b) of the sample after the described heat treatment.
Processes 08 01303 g017
Figure 18. AISI 1045: Comparison between measured and simulated residual stresses at the inner surface as a function of the surface distance (a) and the outer surface along the height (b) of the sample after the described heat treatment.
Processes 08 01303 g018
Figure 19. Comparison of the Sachs EDM measurements and the simulated residual stress development for AISI 4140 (a) and AISI 1045 (b).
Processes 08 01303 g019
Table 1. Chemical compositions of the used steels.
CSiMnCrMoFe
AISI 41400.43 ± 0.010.21 ± 0.0030.82 ± 0.0141.13 ± 0.0150.18 ± 0.002bal.
AISI 10450.48 ± 0.020.25 ± 0.0030.612 ± 0.0110.162 ± 0.0180.01 ± 0.001bal.
Publisher’s Note: MDPI stays neutral with regard to jurisdictional claims in published maps and institutional affiliations.

