Article

Photochemical Oxidation Process of Copper from Electroplating Wastewater: Process Performance and Kinetic Study

Department of Chemical Engineering, Faculty of Engineering, Diponegoro University, Jl. Prof. Soedarto S.H., Tembalang, Semarang 50275, Indonesia
*
Author to whom correspondence should be addressed.
Processes 2020, 8(10), 1276; https://doi.org/10.3390/pr8101276
Submission received: 21 September 2020 / Revised: 6 October 2020 / Accepted: 8 October 2020 / Published: 12 October 2020

Abstract

:
An investigation of the process of ozone combined with ultraviolet radiation has been carried out in order to establish the kinetics for photochemical oxidation of copper (Cu) from electroplating wastewater. The effects of operating parameters, including initial Cu concentration, ozone dosage, UV irradiation intensity, and pH value on the photochemical oxidation of Cu have been studied comprehensively. The Cu concentration during the reaction was identified using atomic absorption spectroscopy (AAS) method. The solid product was analyzed using X-ray diffraction (XRD) and scanning electron microscope–energy-dispersive X-ray (SEM–EDX) methods. It was found that the UV-Ozone process has high performance on Cu removal compared to UV and Ozone processes due to the high production rate of HO• radicals. It was also found that the solid product from the UV-Ozone process was CuO monoclinic crystal phase. The initial Cu concentration, ozone dosage, and pH value were significantly affected the Cu removal efficiency. On the other hand, the UV irradiation intensity was not significant; however, it has responsibility in promoting the ozone photolysis. The kinetics model for the photochemical oxidation of Cu was established following the first-order kinetic model. Furthermore, the reaction mechanism was also developed.

Graphical Abstract

1. Introduction

Heavy metals have become a global issue of environmental and public health concern because of their toxicity and bioaccumulation in the human body and food chain [1]. The effects of urbanization and industrialization cause an increase in heavy metal pollution to the environment [2]. High toxicity and nonbiodegradability of heavy metals caused a number of environmental problems [3]. The accumulation of heavy metals in the atmosphere is responsible for both natural and anthropogenic activities [4]. Copper (Cu), as an essential trace element, is required by biological systems for the activation of some enzymes during photosynthesis. However, at higher concentrations, it shows harmful effects on the human body. Continuous exposure may lead to kidney damage and even death. Cu is also toxic to a variety of aquatic organisms even at very low concentrations. Mining, metallurgy, and industrial applications are the major sources of Cu exposure in the environment [5].
There were several techniques for the treatment of industrial wastewater containing heavy metals, including chemical precipitation, ion exchange, coagulation–flocculation, flotation, membrane filtration, electrochemical treatment, magnetic separation and purification, biosorption, and nanotechnology [6]. Advanced oxidation processes (AOPs) are promising, efficient, and environmentally friendly methods for the removal of wastewater contaminants [7]. The AOPs can be photochemical AOP, sonochemical AOP, and electrochemical AOP [7]. The basic principles of AOPs are the in situ generations of hydroxyl radicals (HO•) during the oxidation process. The hydroxyl radicals can be produced from hydrogen peroxide (H2O2), ozone, photocatalysis, or oxidants in combination with ultraviolet (UV) radiation [8].
Ozone is an active oxidant, which is commercially available and widely used in municipal water treatment and wastewater treatment. Moreover, wastewater treatment with ozone is an environment-friendly method. The pollutants such as color, odor, and microorganisms are oxidized directly without generating harmful chlorinated by-products or substantial residues [9]. In order to increase the effectivity of the ozonation process, it is necessary to combine the ozone process with another process that can increase the reaction efficiency between ozone and pollutant. The promising process is the combination of ozone and UV irradiation that could enhance the production of hydroxyl radicals (HO•) as the main oxidant compounds in AOP [10]. The combination of UV-Ozone process has been reported as a promising process for HO• radical formation [11,12,13]. Therefore, the oxidation process could be accelerated. Based on this characteristic, the combination of UV-Ozone process has a potential option for wastewater treatment [14].
Since the UV-Ozone process has high beneficial result in wastewater treatment, it is important to investigate this process comprehensively. However, the utilization of the UV-Ozone process for Cu removal from electroplating wastewater is still limited. Therefore, the comparison of UV, Ozone, and UV-Ozone processes is investigated in this study. Furthermore, the effect of several operating parameters, including initial Cu concentration, ozone dosage, UV irradiation intensity, and pH value, on the Cu removal process from electroplating wastewater through photochemical (UV-Ozone) oxidation process is also comprehensively studied. In addition, the kinetic study of this process is important for scale-up processing. The study of the kinetics of wastewater treatment with a combination of UV-Ozone process for organic compound degradation has been investigated by several previous researchers [15,16]. However, to the best of our knowledge, there are no previous studies concerning the kinetic study in Cu removal from electroplating wastewater by UV-Ozone process. Some previous studies on Cu or other metals removal from wastewater are focused on investigating the process parameters affecting the process [17,18]. Based on these understandings, in this study, the kinetic models of the Cu removal process are investigated in order to determine the order of the kinetic rate. In addition, the relation of operating parameters with the kinetic parameter is also investigated comprehensively. Extendedly, the correlation between process parameters and kinetic parameter is developed. This correlation accommodates the prediction of the kinetic parameter on different process conditions. Therefore, the kinetic rate of Cu removal through photochemical oxidation can be easily predicted. The possible reaction mechanism of Cu removal using UV-Ozone process is also addressed in this study.

2. Materials and Method

2.1. Materials

This experiment was carried out using synthetic wastewater with an initial copper concentration of 145.73 mg/L. The initial concentration of samples was prepared based on the composition of copper from industrial electroplating wastewater from a plant located at Juwana, Pati, Central of Java Indonesia which has copper concentration of 145.73 mg/L. Synthesized wastewater with varying copper concentrations (145.73, 72.86, and 36.9 mg/L) was prepared by dissolving the corresponding amount of CuSO4·5H2O (>98%, Merck) in deionized (DI) water. The initial pH value of the solution was adjusted using HCl (37%, Merck) and NaOH (>98%, Merck).

2.2. Experimental System Setup

The experimental study on photochemical oxidation of copper by ozone combined with UV irradiation was conducted in a bubble column reactor made of borosilicate glass. The reactor was equipped with a low-pressure mercury UV light (Philips–TUV 8 Watt, Koninklijke Philips N.V., Amsterdam, The Netherlands) with main emission line at 253.7 nm. Ozone gas generated from ozone generator type dielectric barrier discharge (Dipo Technology, Diponegoro University, Jawa Tengah, Indonesia) connected to reactors UV-Ozone (Figure 1). The ozone dosage was varied at 5, 10, and 15 mg/h. The UV-Ozone photoreactor was performed under a semibatch condition reaction. The reactor was an open-top cylindrical tank with a fixed top suspension with a low-pressure mercury UV light. UV irradiation intensity was varied at 20, 40, and 60 mW/cm2. The UV irradiation intensity was adjusted by varying the number of UV light. The UV irradiation intensity was measured using a J-225 Black Ray intensity meter (Analytik Jena US, Upland, CA, USA). A fritted glass diffuser was placed at the bottom of the reactor to allow the continuous injection of ozonized gas. Ozone was produced from the air, which flows into the ozone generator. The reaction was adjusted for different time periods (i.e., 10, 20, 30, 40, 50, and 60 min) and initial pH (3, 6, 8, and 10) during UV-Ozone treatment. All oxidation reaction processes were conducted at room temperature and atmospheric pressure. The initial pH was adjusted using NaOH and HCl solutions.

2.3. Analytical Methods

A pH meter analyzer (EZDO PH-5011A) was used during the procedure for assessing the pH of the response solution. An atomic absorption spectroscopy (AAS) (Shimadzu AA 6300, Kyoto, Japan) was used to analyze Cu concentration and wastewater samples. Even though the UV-VIS method can be used to analyzed Cu concentration in the solutions, the shift on maximum wavelength absorbance at different pH could affect the inaccuracy in the measurement [19,20,21] since we variated the pH as one of the process parameters investigated. The solid product was also analyzed using X-ray diffraction (XRD) (Shimadzu XRD-7000, Kyoto, Japan) method. The Cu Kα radiation (λ = 1.54 Å) was operated at 30 mA and 30 kV. The diffraction patterns were generated at 2θ angle ranges of 20−70° with a scanning speed of 4° min−1. The surface morphology and metal oxide composition of the solid product were analyzed using scanning electron microscope–energy dispersive X-ray (SEM–EDX) (SEM-EDX JEOL JSM-6510LA, Tokyo, Japan) method. The removal efficiency was calculated using Equation (1), when η is the Cu removal efficiency (%), C0 is the initial Cu concentration (mg/L), and Ct (mg/L) is the Cu concentration at time t.
η ( % ) = C 0 C t C 0 × 100 .

3. Results and Discussions

3.1. Comparation of UV, Ozone. and Combination UV-Ozone

In order to study the different effects of UV, Ozone, and UV-Ozone combination processes on Cu removal from electroplating wastewater, these three processes are compared. The result is shown in Figure 2.
Figure 2 depicted the comparison of UV, Ozone, and combined UV-Ozone treatment on Cu removal efficiency from electroplating wastewater. As can be seen, at 60 min of reaction, the Cu removal efficiency obtained from the UV irradiation process is 69.08%, whereas the Cu removal efficiency obtained from Ozone treatment is 72.64%. Interestingly, the Cu removal efficiency can be increased up to 78.8% when the UV and Ozone processes are combined. This high Cu removal efficiency can be obtained by the enhancement of hydroxyl radicals (HO•) during the combination of UV and Ozone processes. As reported by Hanela et al. [10], the combination of UV irradiation and ozone could enhance the production of hydroxyl radicals; therefore, the oxidation process could be accelerated. Furthermore, it is suggested that the combination of UV irradiation and Ozone treatment can increase the Cu removal efficiency in the Cu removal process from electroplating wastewater. It is true since the mechanism of Cu oxidation through AOP is initiated by the presence of HO• radicals. Equations (2) and (3) represent the oxidation process of Cu through AOP. As can be seen in Equation (2), the Cu2+ ion is oxidized by HO• radicals producing solid CuO and water molecules.
C u 2 + + 2 H O C u O + H 2 O
C u 2 + + O 3 C u O + O 2 .
Based on Equation (2), the important thing in Cu removal through AOP is the presence of HO• radicals. Therefore, it is suggested that the process of producing more HO• radicals is the preferred process. As can be seen in Figure 2, the Cu removal efficiency obtained by the UV irradiation process is the lowest compared to the other processes. It is true since the UV irradiation process without the presence of ozone in the system only produces HO• radicals through the photolysis of the H2O molecule [12,22]. The photolysis of the H2O molecule by UV irradiation is shown in Equation (4) [12]. The other possible mechanisms in HO• production through the UV irradiation process are shown in Equations (5) and (6) [23].
H 2 O + h v H O + H
H 2 O + h v H 2 O
H 2 O + h v H O + H .
For the Ozone treatment, as depicted in Figure 2, the Cu removal efficiency is higher than the Cu removal efficiency obtained by the UV irradiation process. This is due to the fact that the Cu oxidation through Ozone treatment can be initiated by HO• radicals and directly oxidized by the ozone molecule (Equation (3)). These two reactions occurred in Ozone treatment, therefore; the Cu removal efficiency obtained by Ozone treatment is higher than obtained by UV treatment. The chemical reaction of HO• radicals formation through Ozone treatment is shown in Equation (7) [12].
3 O 3 + H 2 O 2 H O + 4 O 2 .
As mentioned before, the highest Cu removal efficiency is obtained by the UV-Ozone process due to the high HO• radical formation during the combination of the UV irradiation process and the Ozone process. Besides, the presence of ozone can also increase the oxidation process due to the direct oxidation process. The formation of HO• radicals in the UV-Ozone process has been widely reported. Some proposed HO• radical formation during the UV-Ozone process follow the reaction mechanism as described in Equations (8)–(10) [12,24]:
O 3 + H 2 O + h v O 2 + H 2 O 2
H 2 O 2 + h v 2 H O
H 2 O 2 + H 2 O H 3 O + + H O 2
O 3 + H O 2 H O + O 2 + O 2
O 3 + O 2 O 2 + O 3
O 3 + H 2 O H O + H O + O 2
O 3 + H 2 O 2 H O + O 2 + H O 2
H 2 O 2 + H O H O 2 + H 2 O .
As can be seen, in the UV-Ozone process, an additional oxidant, H2O2, is generated through O3 photolysis (Equation (8)) [12]. O3 reacts with H2O to form H2O2 under UV irradiation. This oxidant can produce more HO• radicals. H2O2 absorbs UV light to generate HO• radicals. It should be noted that this process can occur only at the presence in light sources with wavelength below 300 nm [17]. Therefore, UV light is preferred rather than visible light in this study. By this fact, the Cu removal efficiency can be increased following the reaction shown in Equation (2) in the combination of UV and Ozone process. This finding is in accordance with several previous studies. In dyehouse wastewater subjected to the combination of UV-Ozone treatment, a significant color reduction, up to 98.3%, was obtained [13]. For another reason, Bes-Piá et al. [11] studied the UV-Ozone process for textile wastewater treatment. They reported that the combination of UV irradiation with ozone could significantly reduce the operating time to reach the same COD removal efficiency.

3.2. Characterization of the Solid Product

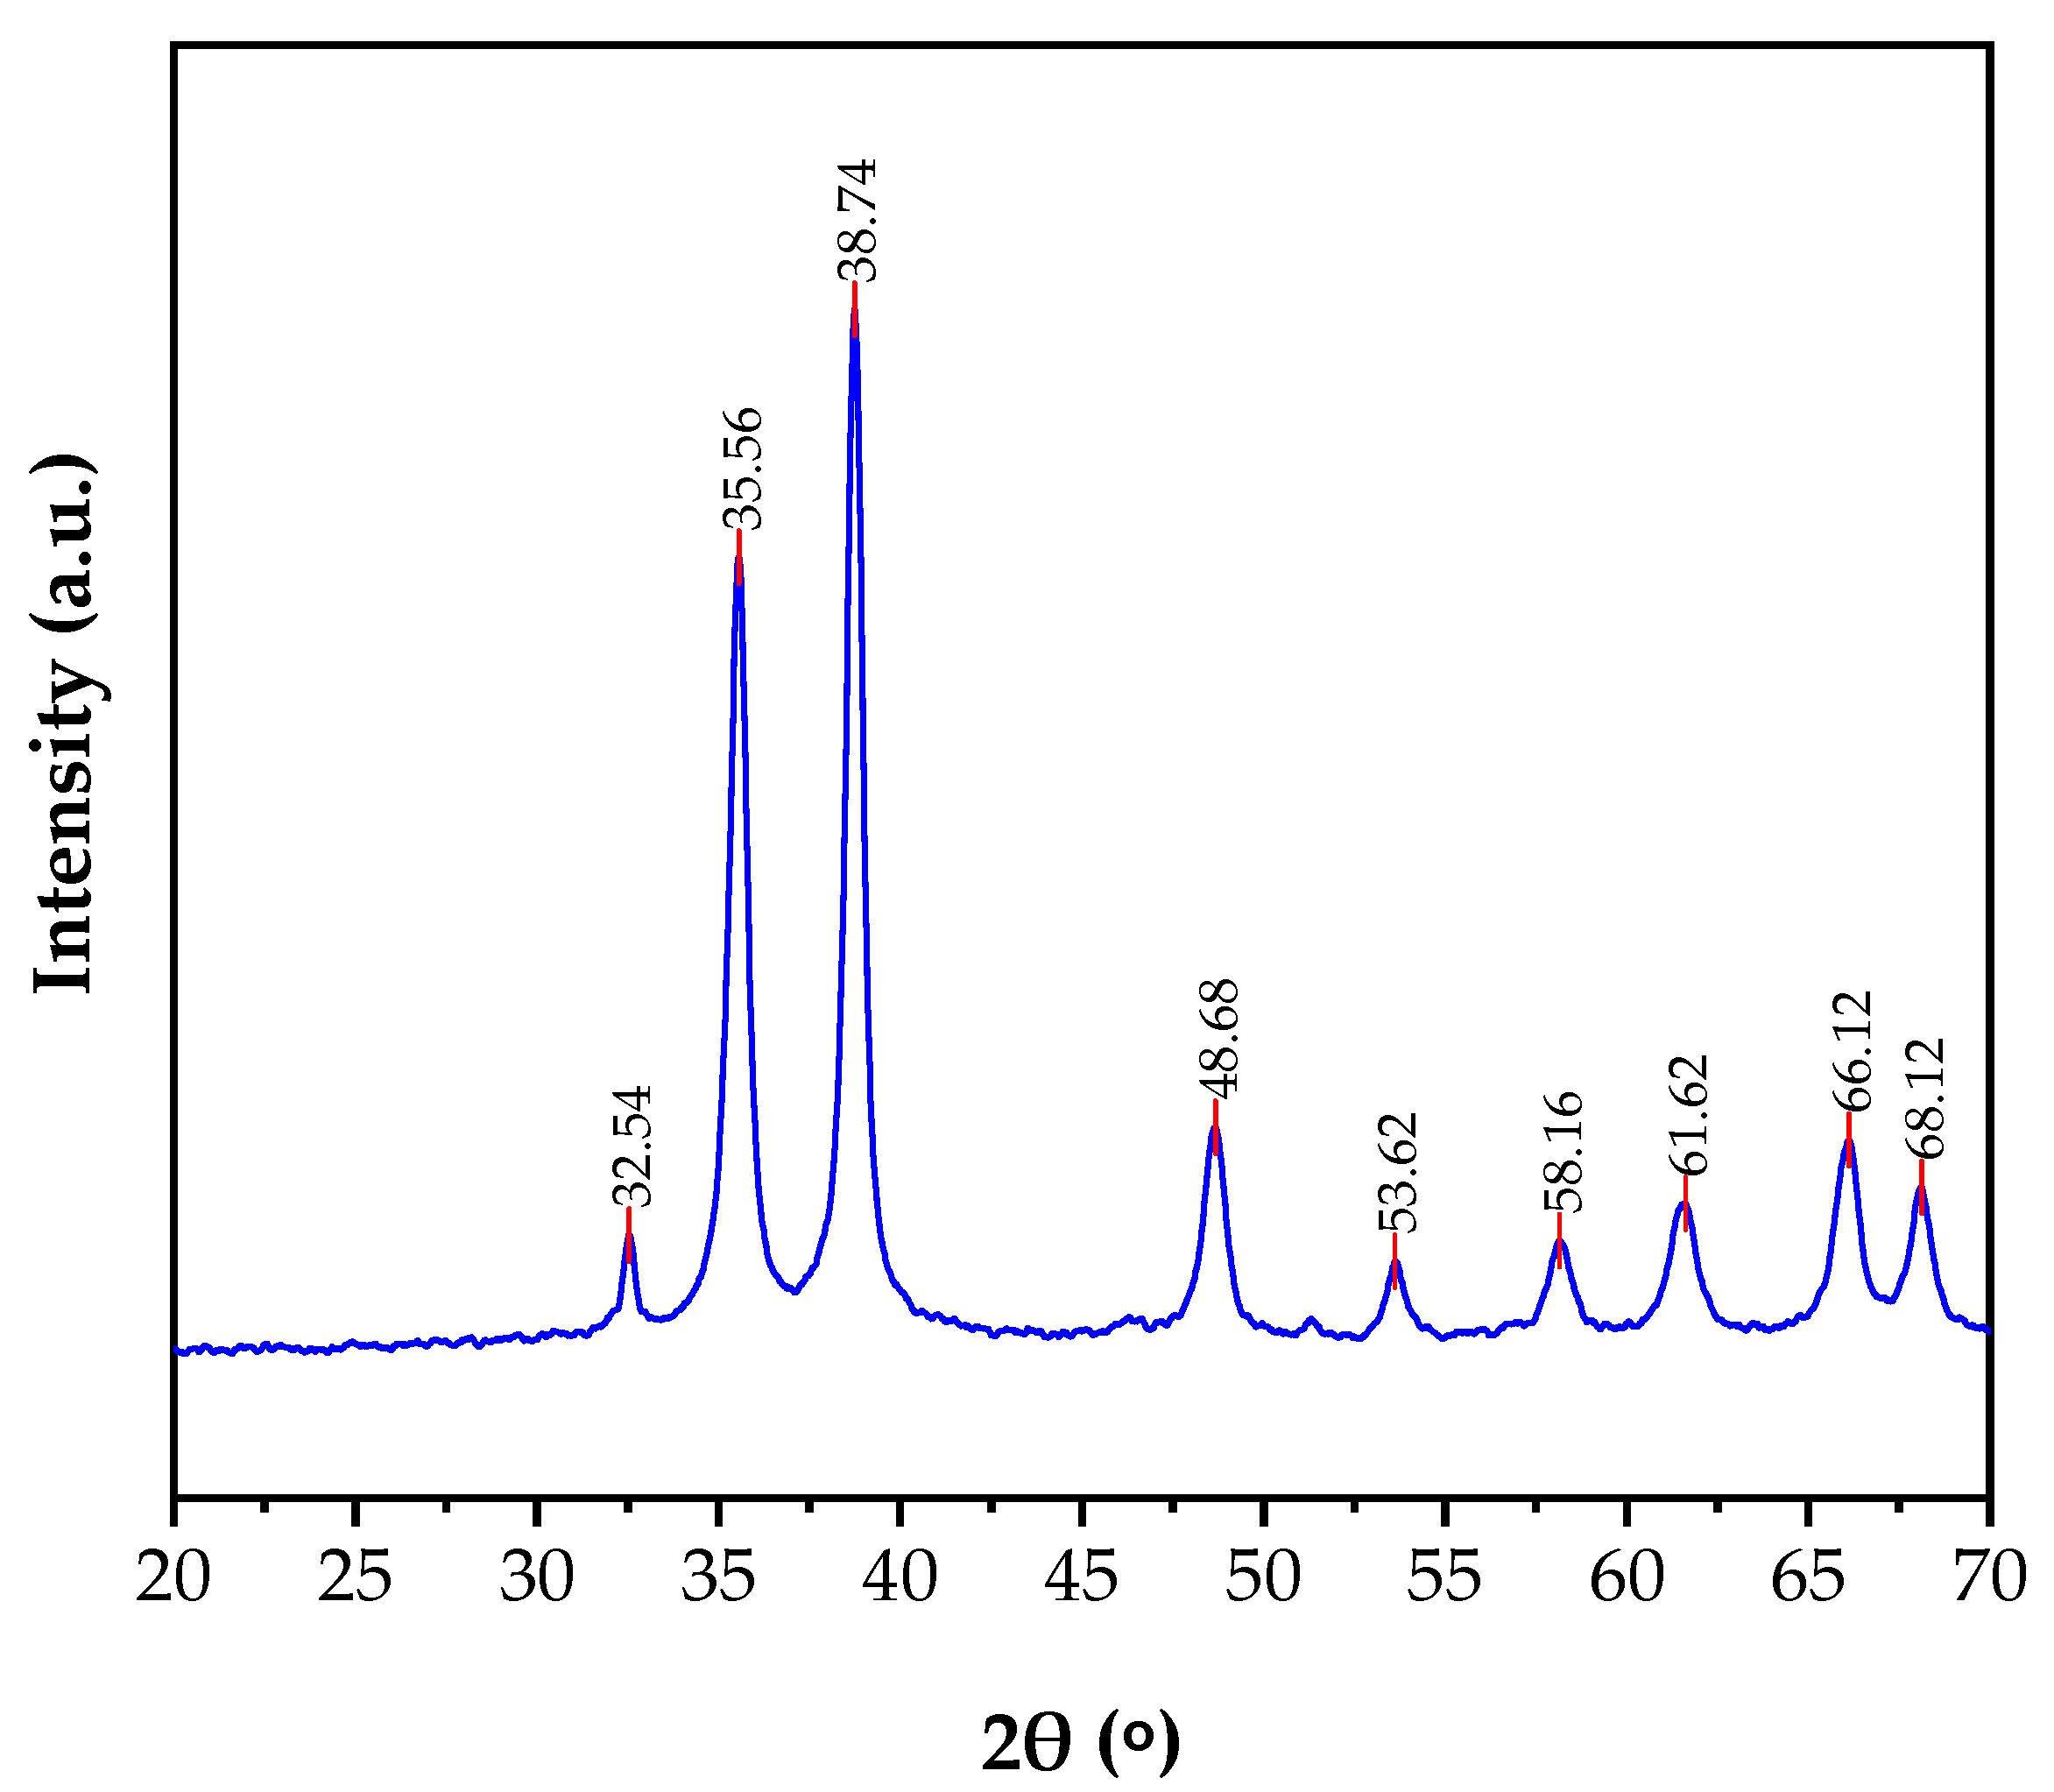
As reported in Section 3.1, the UV-Ozone process has the highest Cu removal efficiency compared to the other processes. The Cu removal through this process produces a solid product that is proposed as CuO, as shown in Equations (2) and (3). In order to prove that the solid product is CuO, the solid product was analyzed. Figure 3 shows the XRD pattern of the solid product obtained from the UV-Ozone process. Based on Figure 3, the characteristic peaks appear at 2θ of 32.54°, 35.56°, 38.74°, 48.68°, 53.62°, 58.16°, 61.62°, 66.12°, and 68.12°. These peaks correspond to the CuO (tenorite phase) according to the JCPDS card number 96-900-8962. These also indicate that the formation of monoclinic crystal structure [25]. On the other hand, several studies reported that two peaks at 2θ = 35.6° (002) and 2θ = 38.8° (111) observed in the diffraction patterns are ascribed to the formation of the CuO (space group C2/c) monoclinic crystal phase [26,27]. In this study, these peaks appear at 2θ = 35.56° and 2θ = 38.74°. Therefore, it is confirmed that the solid product produced from the UV-Ozone process is CuO in the monoclinic crystal phase.
The morphology and the metal oxide composition of the solid product from the UV-Ozone process are identified using SEM analysis. Based on the result of SEM-EDX analysis (Figure 4a), it is confirmed that the most metal oxide present in the solid product is CuO. The CuO content detected by SEM-EDX analysis in the solid product is 83.52%. The other components detected may be produced from the impurities in the wastewater. However, it is confirmed that the solid product is CuO. Figure 4b shows the appearance of the solid product surface (right) and the model of the CuO monoclinic crystal structure (left). As can be seen, the surface morphology of the CuO is agglomerated nanorods. Manyasree et al. [28] reported that the surface morphology of the CuO nanoparticle, which was synthesized from copper sulfate and sodium hydroxide through the coprecipitation process, is a flower-shaped structure.

3.3. The Effect of Operating Parameters

3.3.1. Effect of Initial Concentration

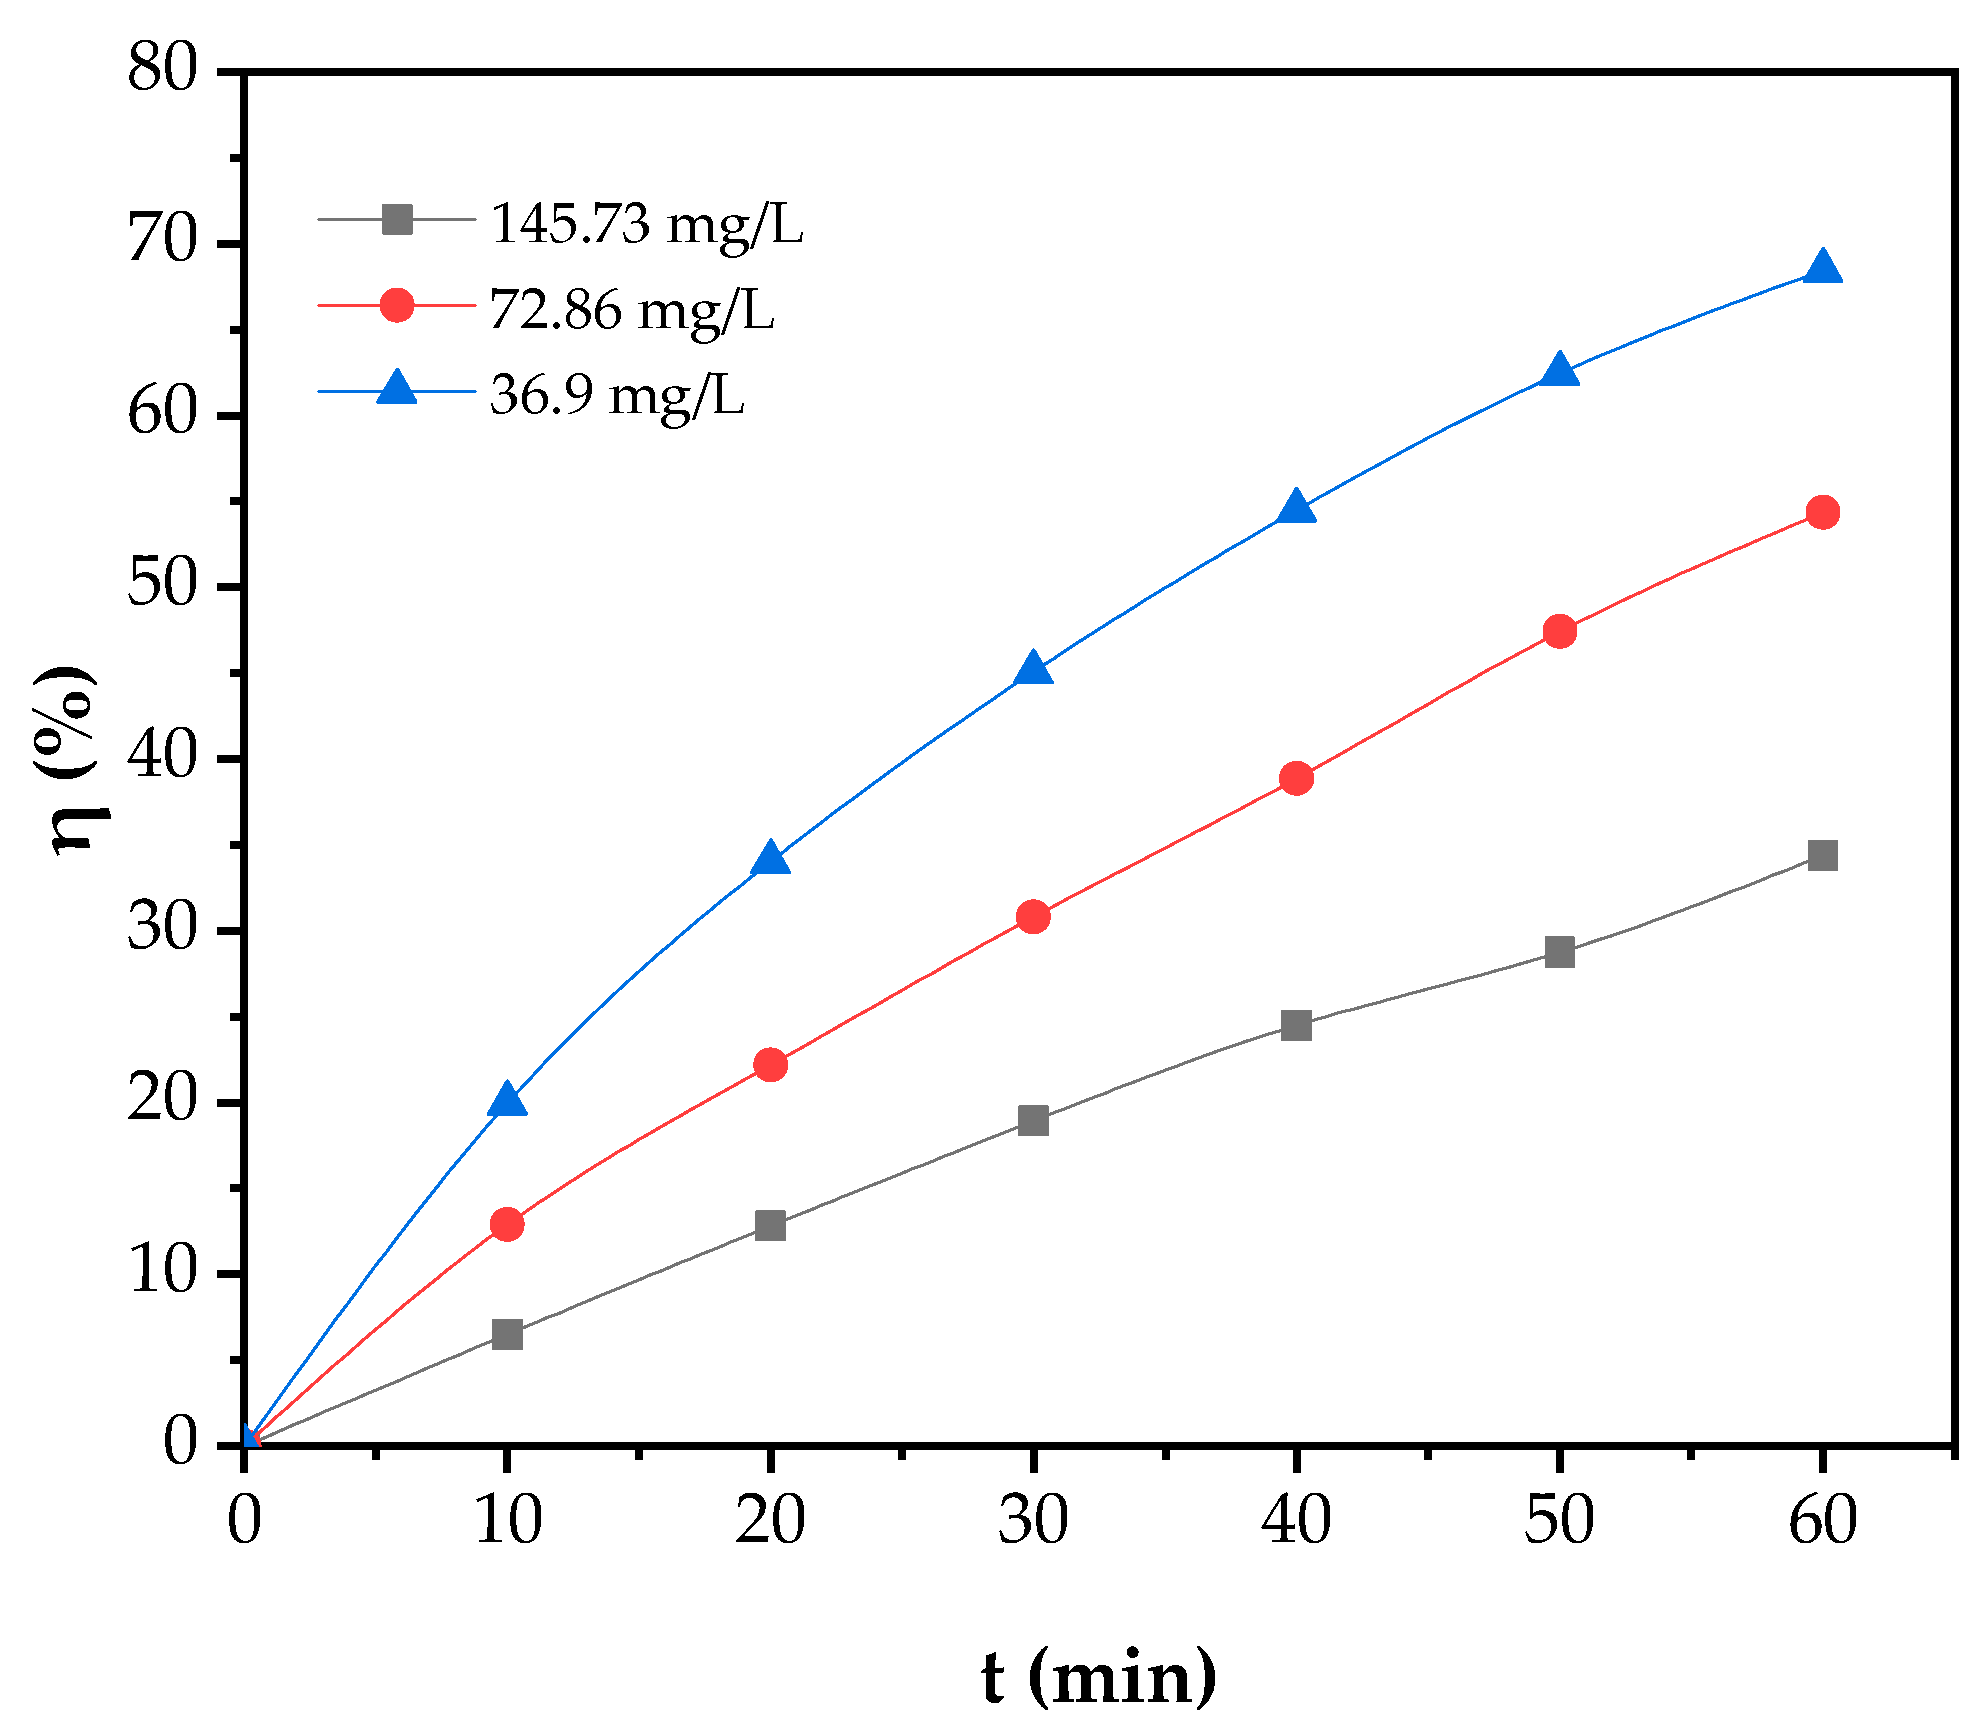
In order to study the effect of the initial Cu concentration, the photochemical oxidation process was conducted with the variation of the initial Cu concentration. The initial Cu concentration was varied at 145.73, 72.86, and 36.9 mg/L. The monitored parameter is the Cu removal efficiency. The effect of initial Cu concentration on Cu removal efficiency is depicted in Figure 5.
As can be seen in Figure 5, the Cu removal efficiency is significantly affected by the initial Cu concentration. During the oxidation process for 60 min, the Cu removal efficiency obtained at the initial Cu concentration of 145.73 mg/L is 34.39%, the Cu removal efficiency obtained at the initial Cu concentration of 72.86 mg/L is 54.36%, while the Cu removal efficiency obtained at the initial Cu concentration of 36.9 mg/L is 68.46%. Based on these results, it is suggested that the initial Cu concentration has a significant effect on the Cu removal efficiency in the Cu removal process from electroplating wastewater. Furthermore, the Cu removal efficiency decreases significantly with the increase in the initial Cu concentration from 36.9 to 145.73 mg/L. The decrease in Cu removal efficiency at high initial Cu concentration is due to the presence of a high amount of hydroxyl radical scavengers. When the initial Cu concentration is high, the photochemical oxidation process is overloaded. As a result, the Cu in the solution competes with each other during the oxidation reaction process [29]. On the other hand, in the UV irradiation process, the permeation of photons is reduced at high solution concentration; therefore, the concentration of hydroxyl radical produced is low [29]. Therefore, the oxidation of Cu decreases at high initial Cu concentration. This finding is in accordance with several previous studies in AOP. Hassan et al. [30] reported that the decolorization of Direct Yellow 50 dye in seawater through the UV-Ozone process was highly affected by the initial dye concentration, i.e., the decolorization rate decreased by increasing the dye concentration. Dai et al. [31] also reported a similar finding in the degradation of carbamazepine in water through AOP. They reported that the degradation percentage of carbamazepine decreased from 34% to 13% with an increase in the initial carbamazepine concentration from 4.2 to 42.3 μM. Jing et al. [32] also reported that the initial aniline concentration affected the aniline degradation process through ozonation. They reported that aniline degradation decreased with the increase in the initial aniline concentration due to the overload of the ozonation process.

3.3.2. Effect of Ozone Dosage

In this study, the effect of ozone dosage on the Cu removal process through the photochemical oxidation process is studied by varying the ozone dosage. The ozone dosage was varied at 5, 10, and 15 mg/h. Cu removal efficiency was monitored to study this matter. The effect of ozone dosage on Cu removal efficiency is depicted in Figure 6.
As can be seen in Figure 6, the Cu removal efficiency increases significantly with increasing the ozone dosage. At 60 min reaction, the Cu removal efficiency obtained at ozone dosage of 5 mg/h is 48.31%, the Cu removal efficiency obtained at ozone dosage of 10 mg/h is 68.46%, while the Cu removal efficiency obtained at ozone dosage of 15 mg/h is 78.80%. Based on these results, it is suggested that the Cu removal efficiency in Cu removal from electroplating wastewater through the photochemical oxidation process is highly affected by the ozone dosage. As the ozone dosage increases, the Cu removal efficiency increases. It is true since in the ozonation process, the oxidation of Cu can occur through two different mechanisms, i.e., oxidation by HO• radicals (Equation (2)) and direct oxidation by ozone (Equation (3)). As reported by Wang et al. [33], in the ozone-based oxidation process, there are two methods, namely, indirect reaction of free radicals and direct reaction.
Pertaining to the effect of ozone dosage on HO• radical formation, when ozone dosage increases, more HO• radicals are formed. Under UV irradiation, H2O2 can be formed through the reaction of ozone with H2O (Equation (8)). Furthermore, this H2O2 molecule absorbs the UV light to generate the HO• radicals (Equation (9)) [24]. Ozone molecules also can react with H2O2 molecules to produce HO• radicals. Besides, the ozone also can also directly react with H2O to generate HO• radicals (Equation (7)). Then, Cu is oxidized by HO• radicals. Therefore, the photochemical oxidation rate of Cu increases with the increase in ozone dosage. As a comparison, Wang et al. [33] reported that the decomplexation of electroplating wastewater by the ozone-based oxidation process increased with the increase in ozone dosage. Ren et al. [24] reported that the removal efficiency of polyacrylamide through the photochemical oxidation process increased with the increase in ozone dosage. Guo et al. [34] also reported the same result in the degradation process of sulfadiazine in water by the UV-Ozone process.

3.3.3. Effect of UV Irradiation Intensity

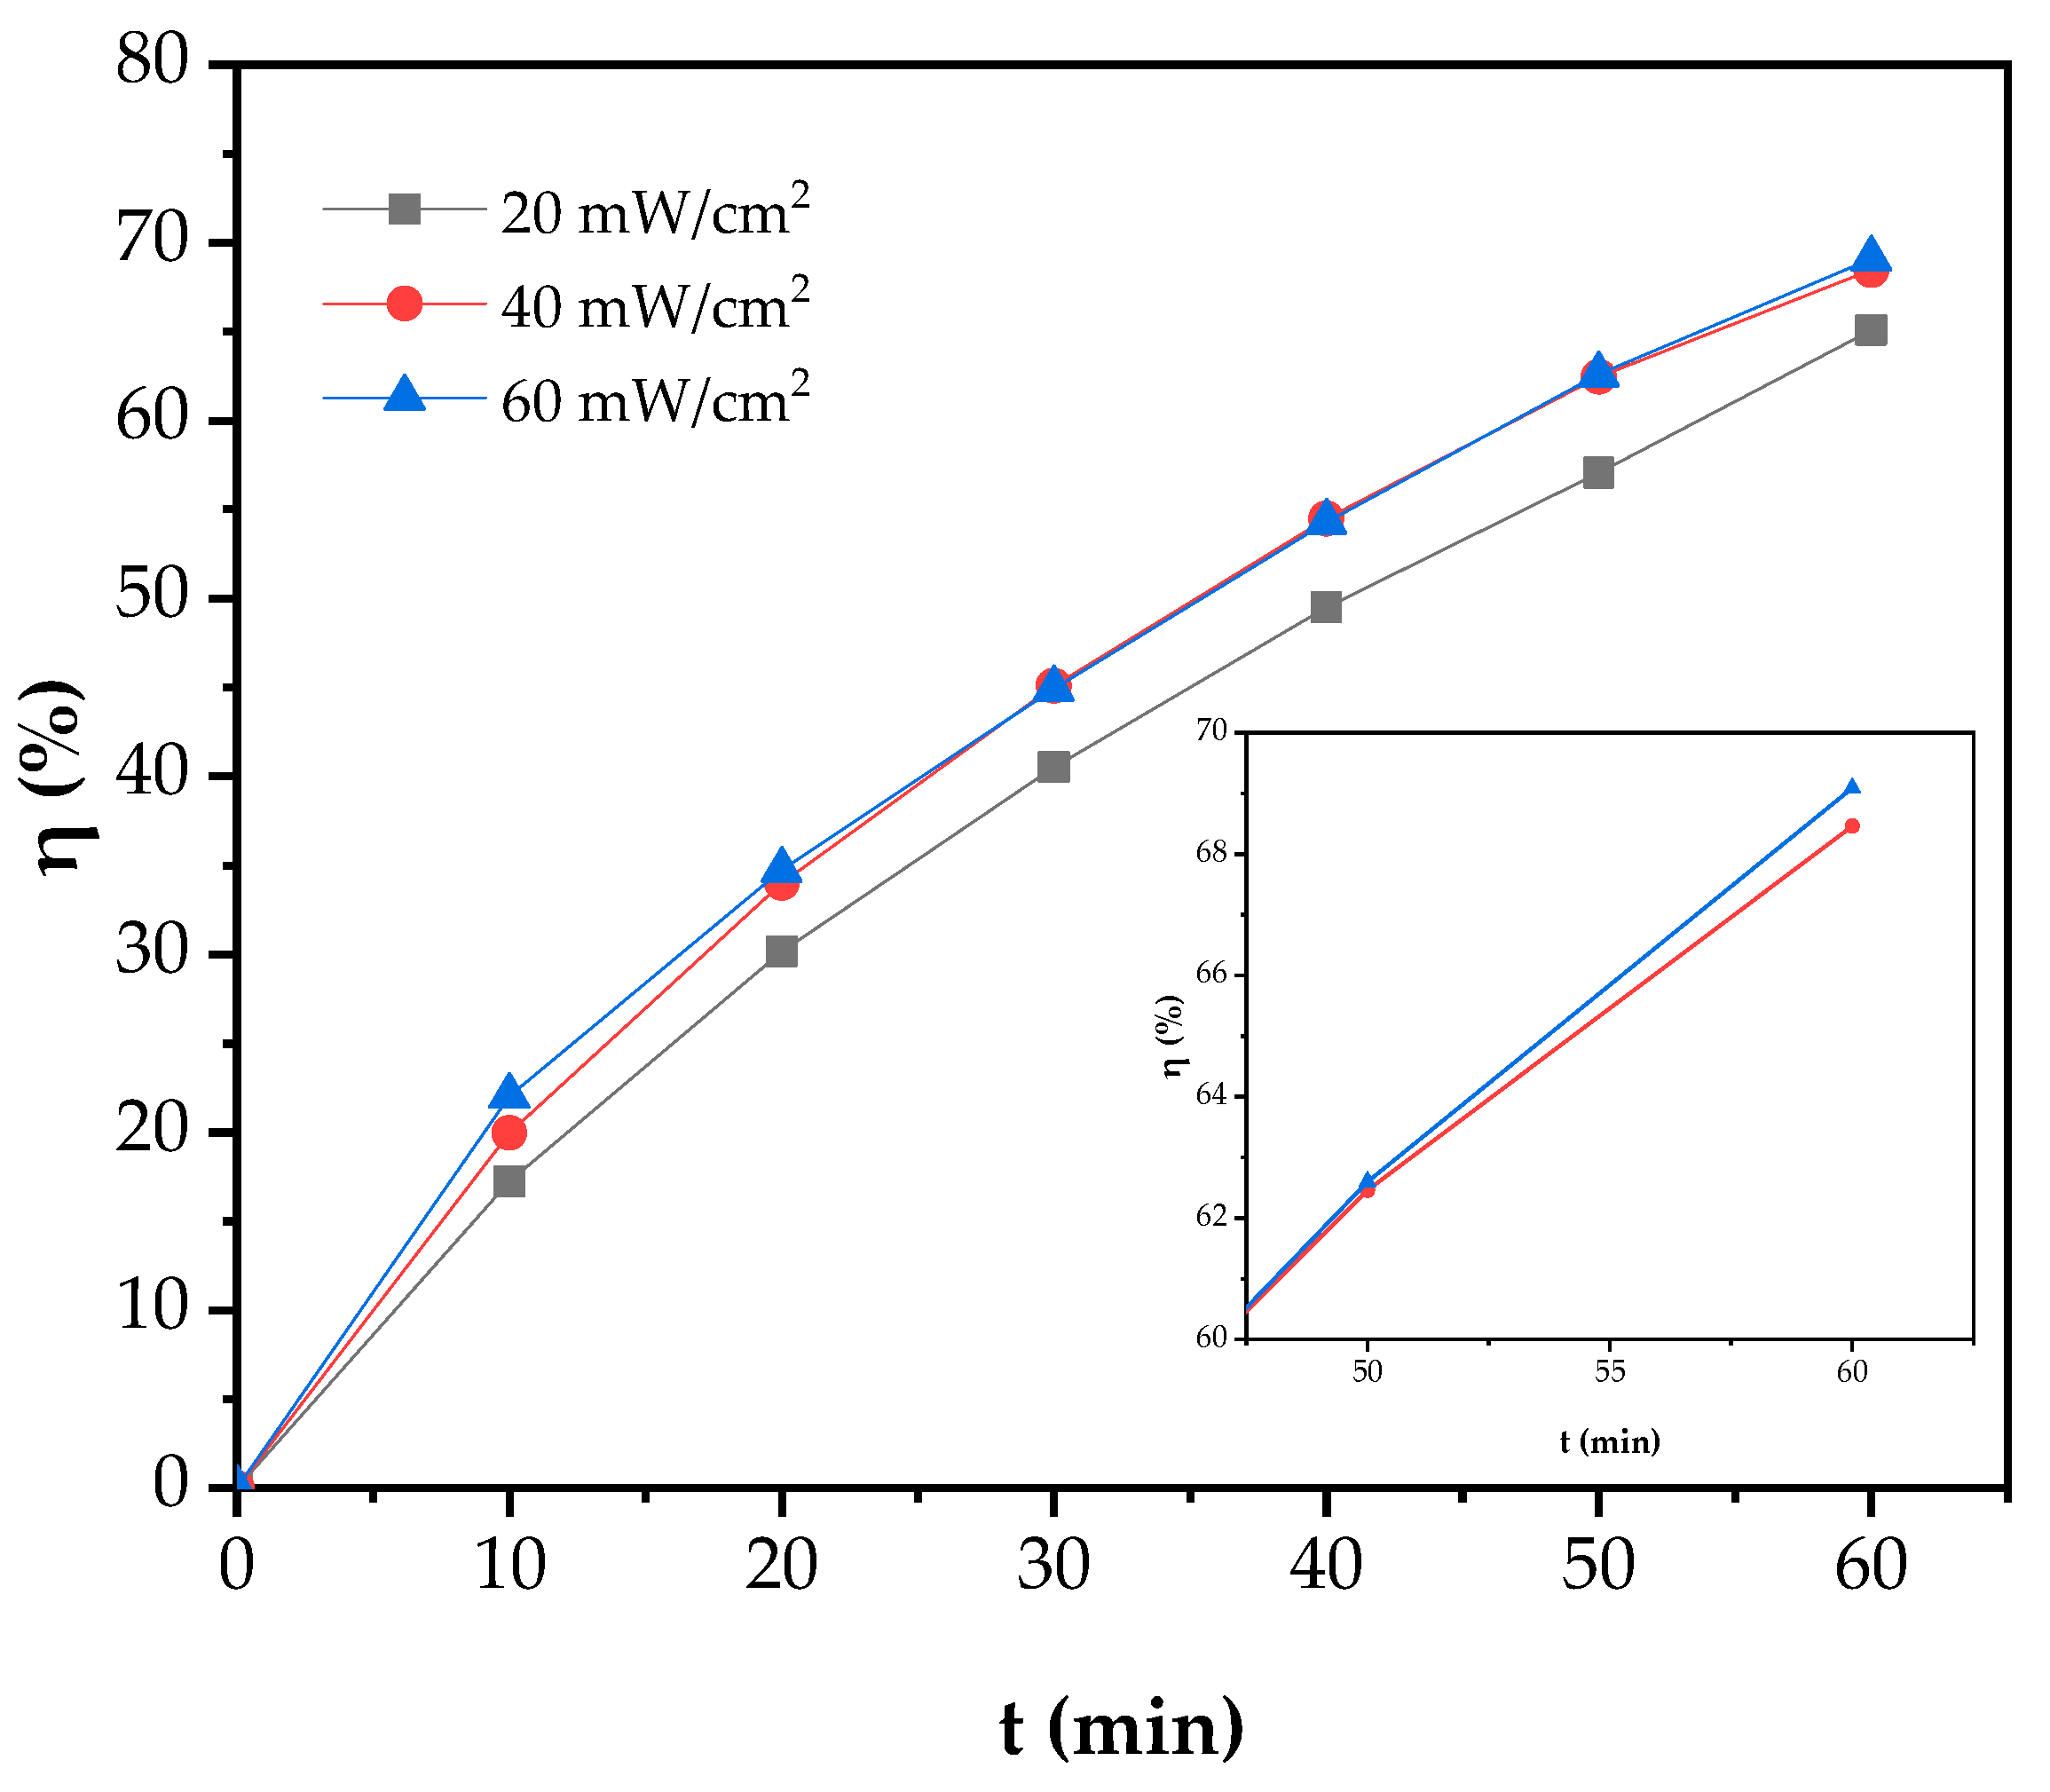
In order to study the effect of UV irradiation intensity on Cu removal from electroplating wastewater, the photochemical process was conducted by varying the UV irradiation intensity. The UV irradiation intensity was varied at 20, 40, and 60 mW/cm2. Figure 7 shows the result of the effect of UV irradiation intensity on Cu removal efficiency.
As shown in Figure 7, at 60 min reaction, the Cu removal efficiency obtained at a UV irradiation intensity of 20 mW/cm2 is 65.09%, the Cu removal efficiency obtained at UV irradiation intensity of 40 mW/cm2 is 68.46%, while the Cu removal efficiency obtained at UV irradiation intensity of 60 mW/cm2 is 69.08%. It can be concluded that the Cu photochemical oxidation rate slightly increases with the increase in UV radiation intensity. The Cu removal efficiency slightly increases for UV irradiation of 20–40 mW/cm2. Furthermore, the Cu removal efficiency remains unchanged for UV irradiation intensity of 40–60 mW/cm2.
The increase in Cu removal efficiency with the increase in UV irradiation intensity is due to the high possibility to produce HO• radicals at high UV irradiation intensity. The possible process of HO• radical formation during UV irradiation is the photolytic dissociation of water by UV irradiation at a wavelength of 254 nm [35]. However, this process is still unclear since some studies reported that the photolytic dissociation of water to HO• radicals only can be conducted at a wavelength of less than 242 nm. Deng and Zhao [12] claimed that this process occurs at a wavelength of less than 242 nm. Furthermore, Jin et al. [22] reported that the HO• radicals could be formed through irradiation on liquid water by UV light in the range of 150–200 nm. As the UV irradiation wavelength used in this study is around 253.7 nm, the increase in Cu removal efficiency with the increase in UV irradiation intensity from 20 to 40 mW/cm2 is attributed to the formation of HO• radicals through ozone photolysis producing H2O2 (Equation (8)). However, high UV irradiation intensity in the ozonation process is not good. It is true since, at high UV irradiation intensity, the ozone molecule could be degraded to oxygen [36]. Therefore, the formation of HO• radicals is low at high UV irradiation intensity. Furthermore, it is suggested that the unchanged Cu removal efficiency at a UV irradiation intensity of 60 mW/cm2 is due to the degradation of the ozone molecule resulting in the low formation of HO• radicals.

3.3.4. Effect of pH

The efficiency of AOP can be influenced by various factors, such as the pH of the solution [37,38,39]. In order to study the effect of pH on the Cu removal process from electroplating wastewater through the photochemical oxidation process, the pH of solution was varied at 3, 6, 8, and 10. The result is depicted in Figure 8.
As can be seen in Figure 8, at 60 min reaction, the Cu removal efficiency obtained at pH of 3 is 46.02%, the Cu removal efficiency obtained at pH of 6 is 68.46%, the Cu removal efficiency obtained at pH of 8 is 80.09%, while the Cu removal efficiency obtained at pH of 10 is 70.46%. It can be seen that the highest Cu removal efficiency is obtained at a pH of 8. Hence, it can be concluded that the photochemical oxidation of Cu from electroplating wastewater increases with the increase in pH from 3 to 8, then it decreases with a further increase in pH to 10.
The increase in Cu removal efficiency with the increase in pH value is attributed to the high rate of HO• radical formation at high pH conditions. As reported by Muniyasamy et al. [39], in the oxidation process, pH influences the process by altering the chemical nature of ozone. At low pH conditions (acidic conditions), the decomposition of the ozone molecule to produce HO• radicals is relatively slow [40]. It was reported that the decomposition rate of ozone was sluggish below the pH of 4 [41]. Furthermore, ozone tends to remain in the molecular state at acidic conditions; however, ozone can react directly as ozone radical with the contaminants at alkaline conditions [38,42]. Therefore, the Cu removal efficiency is low at a low pH value. Furthermore, the higher the pH value, the higher the Cu removal efficiency. This tendency is attributed to the high formation of HO• radicals at the alkaline conditions. It was reported that the decomposition rate of ozone in water is better at higher pH values [43]. At alkaline conditions, ozone is unstable and rapidly decomposes into HO• radical [39,40]. The HO• radical formation through ozone decomposition occurs as follows:
O 3 + O H H O 2 + O 2
2 O 3 + H O 2 H O + O 2 + O 2 .
As can be seen in Equations (16) and (17), the HO• radical, which is the primary oxidant in indirect oxidation [39], is produced at high pH level represented as OH. Therefore, the Cu removal efficiency increases with the increase in pH value since the HO• radical formation is favored at a high pH level. However, the Cu removal efficiency decrease at a pH of 10. At higher pH value, CuO can dissolve to the aqueous phase due to the formation of soluble hydroxy and hydroxide complexes [44]. Therefore, Cu removal efficiency decreases. The possible dissolution mechanism of CuO at high pH value was proposed by Khan et al. [44] as follows:
C u O ( s ) + O H ( a q ) + H 2 O ( l ) C u ( O H ) 3 ( a q )
C u O ( s ) + 2 O H ( a q ) + H 2 O ( l ) C u ( O H ) 4 2 ( a q ) .

3.4. Kinetic Study

3.4.1. Determination of the Kinetic Rate Order

Three classical kinetic models are proposed to describe the Cu removal process and to determine the order or kinetic rate. These kinetic models include first-order model, second-order model, and pseudo-first-order model. The compatibility of these models is evaluated by the R2 value as reported elsewhere [45]. In this work, the kinetic study of Cu removal from electroplating wastewater is considered for various initial Cu concentration (C0), ozone dosage (CO3), UV irradiation intensity (IUV), and initial pH condition.
In this advanced oxidation process for Cu removal from electroplating wastewater, the mass conservation of Cu in the process can be generally expressed as:
d C t d t = ( r ) ,
where Ct (mg/L) is the concentration of Cu at time t (min) and (−r) (mg/L.min) is the rate of Cu removal. For first order model (−r = k1Ct), integration of Equation (20) at the initial concentration of C0, gives:
ln ( C t C 0 ) = k 1 t ,
where k1 (1/min) is the kinetic rate constant for first order. Further simplification of Equation (21) will give the time-dependent concentration of Cu (Equation (22)).
C t = C 0 e k 1 t .
For second-order model (−r = k2Ct2), the integration of Equation (20) will give:
1 C t = k 2 t + 1 C 0 ,
where k2 (L/mg·min) is the kinetic rate constant of the second-order model. For the pseudo-first-order model (−r = kp(CtCe)), the time-dependent concentration of Cu through the integration of Equation (20) is obtained as:
C t = C e + ( C 0 C e ) e k p t ,
where Ce (mg/L) is the concentration of Cu at equilibrium condition and kp (1/min) is the kinetic rate constant of pseudo-first-order model.
The kinetic parameters were determined using the least-square method. As can be seen, the obtained equation for first-order and second-order kinetic models (Equations (21) and (23)) are linear equations. Therefore, the kinetic parameters (k1 and k2) can be obtained from the linear plot relating to these equations using the linear regression method. However, the equation derived from the pseudo-first-order kinetic model is not linear. Therefore, the kinetic parameters of the pseudo-first-order kinetic model (Ce and kp) are calculated using a nonlinear regression method. On the other hand, to measure the goodness of the kinetic models proposed, the squared-correlation coefficient, R2, was used as the parameter [40,41]. The obtained kinetic parameters and R2 values for first-order, second-order, and pseudo-first-order kinetic models are shown in Table 1.
As can be seen in Table 1, all proposed models fit the data as the R2 values are close to unity. However, compared to the other proposed models, the R2 value of the second-order model is far enough from unity. Besides, the values of R2 obtained are not uniform for all data. Therefore, it is suggested that the second-order model is excluded as the proposed model to describe the kinetic rate of Cu removal. Hence, the first order and pseudo-first-order models are then considered as the most suitable proposed models to describe the kinetics of Cu removal. Considering the R2 values of the first order and pseudo-first-order models, both these two models have high goodness in describing the kinetic rate of Cu removal. However, at the initial Cu concentration, C0, of 145.73 and 72.86 mg/L, the value of the equilibrium concentrations, Ce, obtained are zero. It indicates that at a high initial concentration of Cu in the wastewater, the kinetic rate will be increased. Furthermore, some of the Ce values are relatively low. In some cases, the theoretical value of Ce might be negative when the pseudo-first-order kinetic model is forcibly used [46]. In those cases, the pseudo-first-order model cannot be used to describe the kinetic rate. Obviously, if the value of the equilibrium concentration is zero or low enough, the pseudo-first-order model gets back to the first-order model [45,46]. Therefore, it is suggested that the most suitable model to describe the kinetic rate of Cu removal from electroplating wastewater through the photochemical oxidation process, combined UV-Ozone process, is the first-order model.
The kinetic study of Cu removal using an advanced oxidation process has been widely reported. However, the kinetic study of Cu removal using the photochemical oxidation process, UV-Ozone process, is still limited. The most-reported process is the electrochemical/electrocoagulation process. Al-Shannag et al. [45] reported that the electrocoagulation of heavy metals from wastewater, including Cu, followed a pseudo-first-order model. Using the same method, Vasudevan and Lakshmi [47] reported that the electrocoagulation of Cu from water follows the second-order model. Furthermore, Khattab et al. [48] reported that Cu removal through the electrochemical process follows the first-order kinetic model.

3.4.2. The Effect of Operating Parameters on Kinetic Rate Constant

The kinetic rate behavior of Cu removal using the photochemical oxidation process, combined UV-Ozone process, follows the first-order kinetic model as reported in Section 3.3.1. The value of the kinetic rate constant of the first-order model, k1, is presented in Table 1. As can be observed, the value of k1 is varied as the variation of operating parameters, including C0, CO3, IUV, and pH. The value of k1 increases with a decrease in C0. Furthermore, the value of k1 increases with the increase in CO3, IUV, and pH. However, at a pH of 10, the value of k1 decreases. These phenomena indicate that the value of the observed k1 is affected by the operating parameters. This is in accordance with some previous studies that the kinetic rate constant of the advanced oxidation process, especially the UV-Ozone process, is affected by the operating parameters [24,49]. The operating parameters-dependent of the kinetic rate constant can be mathematically written as Equations (25) and (26) where ε is the pre-exponent constant, whereas a, b, c, and d are the exponent constant characteristic of C0, CO3, IUV, and pH, respectively. The linear form of Equation (26) is shown as Equation (27).
k 1 = f ( C 0 , C O 3 , I U V , p H )
k 1 = ε C 0 a C O 3 b I U V c p H d
ln k 1 = ln ε + a ln C 0 + b ln C O 3 + c ln I U V + d ln p H .
Based on Equation (27), the value of ε, a, b, c, and d can be obtained using multiple regression analysis which also has been used elsewhere [49]. However, the value of k1 at a pH of 10 is not included in this calculation because it does not follow the tendency. Table 2 shows the result of the multiple regression analysis. As can be seen, the p-value of the coefficients obtained for each parameter is lower than 0.05. This indicates that the coefficients obtained are significant. However, the p-value of ln IUV coefficient is higher than 0.05, which indicates that this coefficient is not significant. Table 3 shows the result of the analysis of variance (ANOVA) of the multiple regression analysis. As can be observed, the value of multiple R, R2, and adjusted R2 is close to unity. These indicate that the obtained regression equation fits the data. Furthermore, the obtained F-value (113.4928) is higher than the F-table or theoretical F-value. The theoretical F-value (F0.05(4,7)) is 6.09.
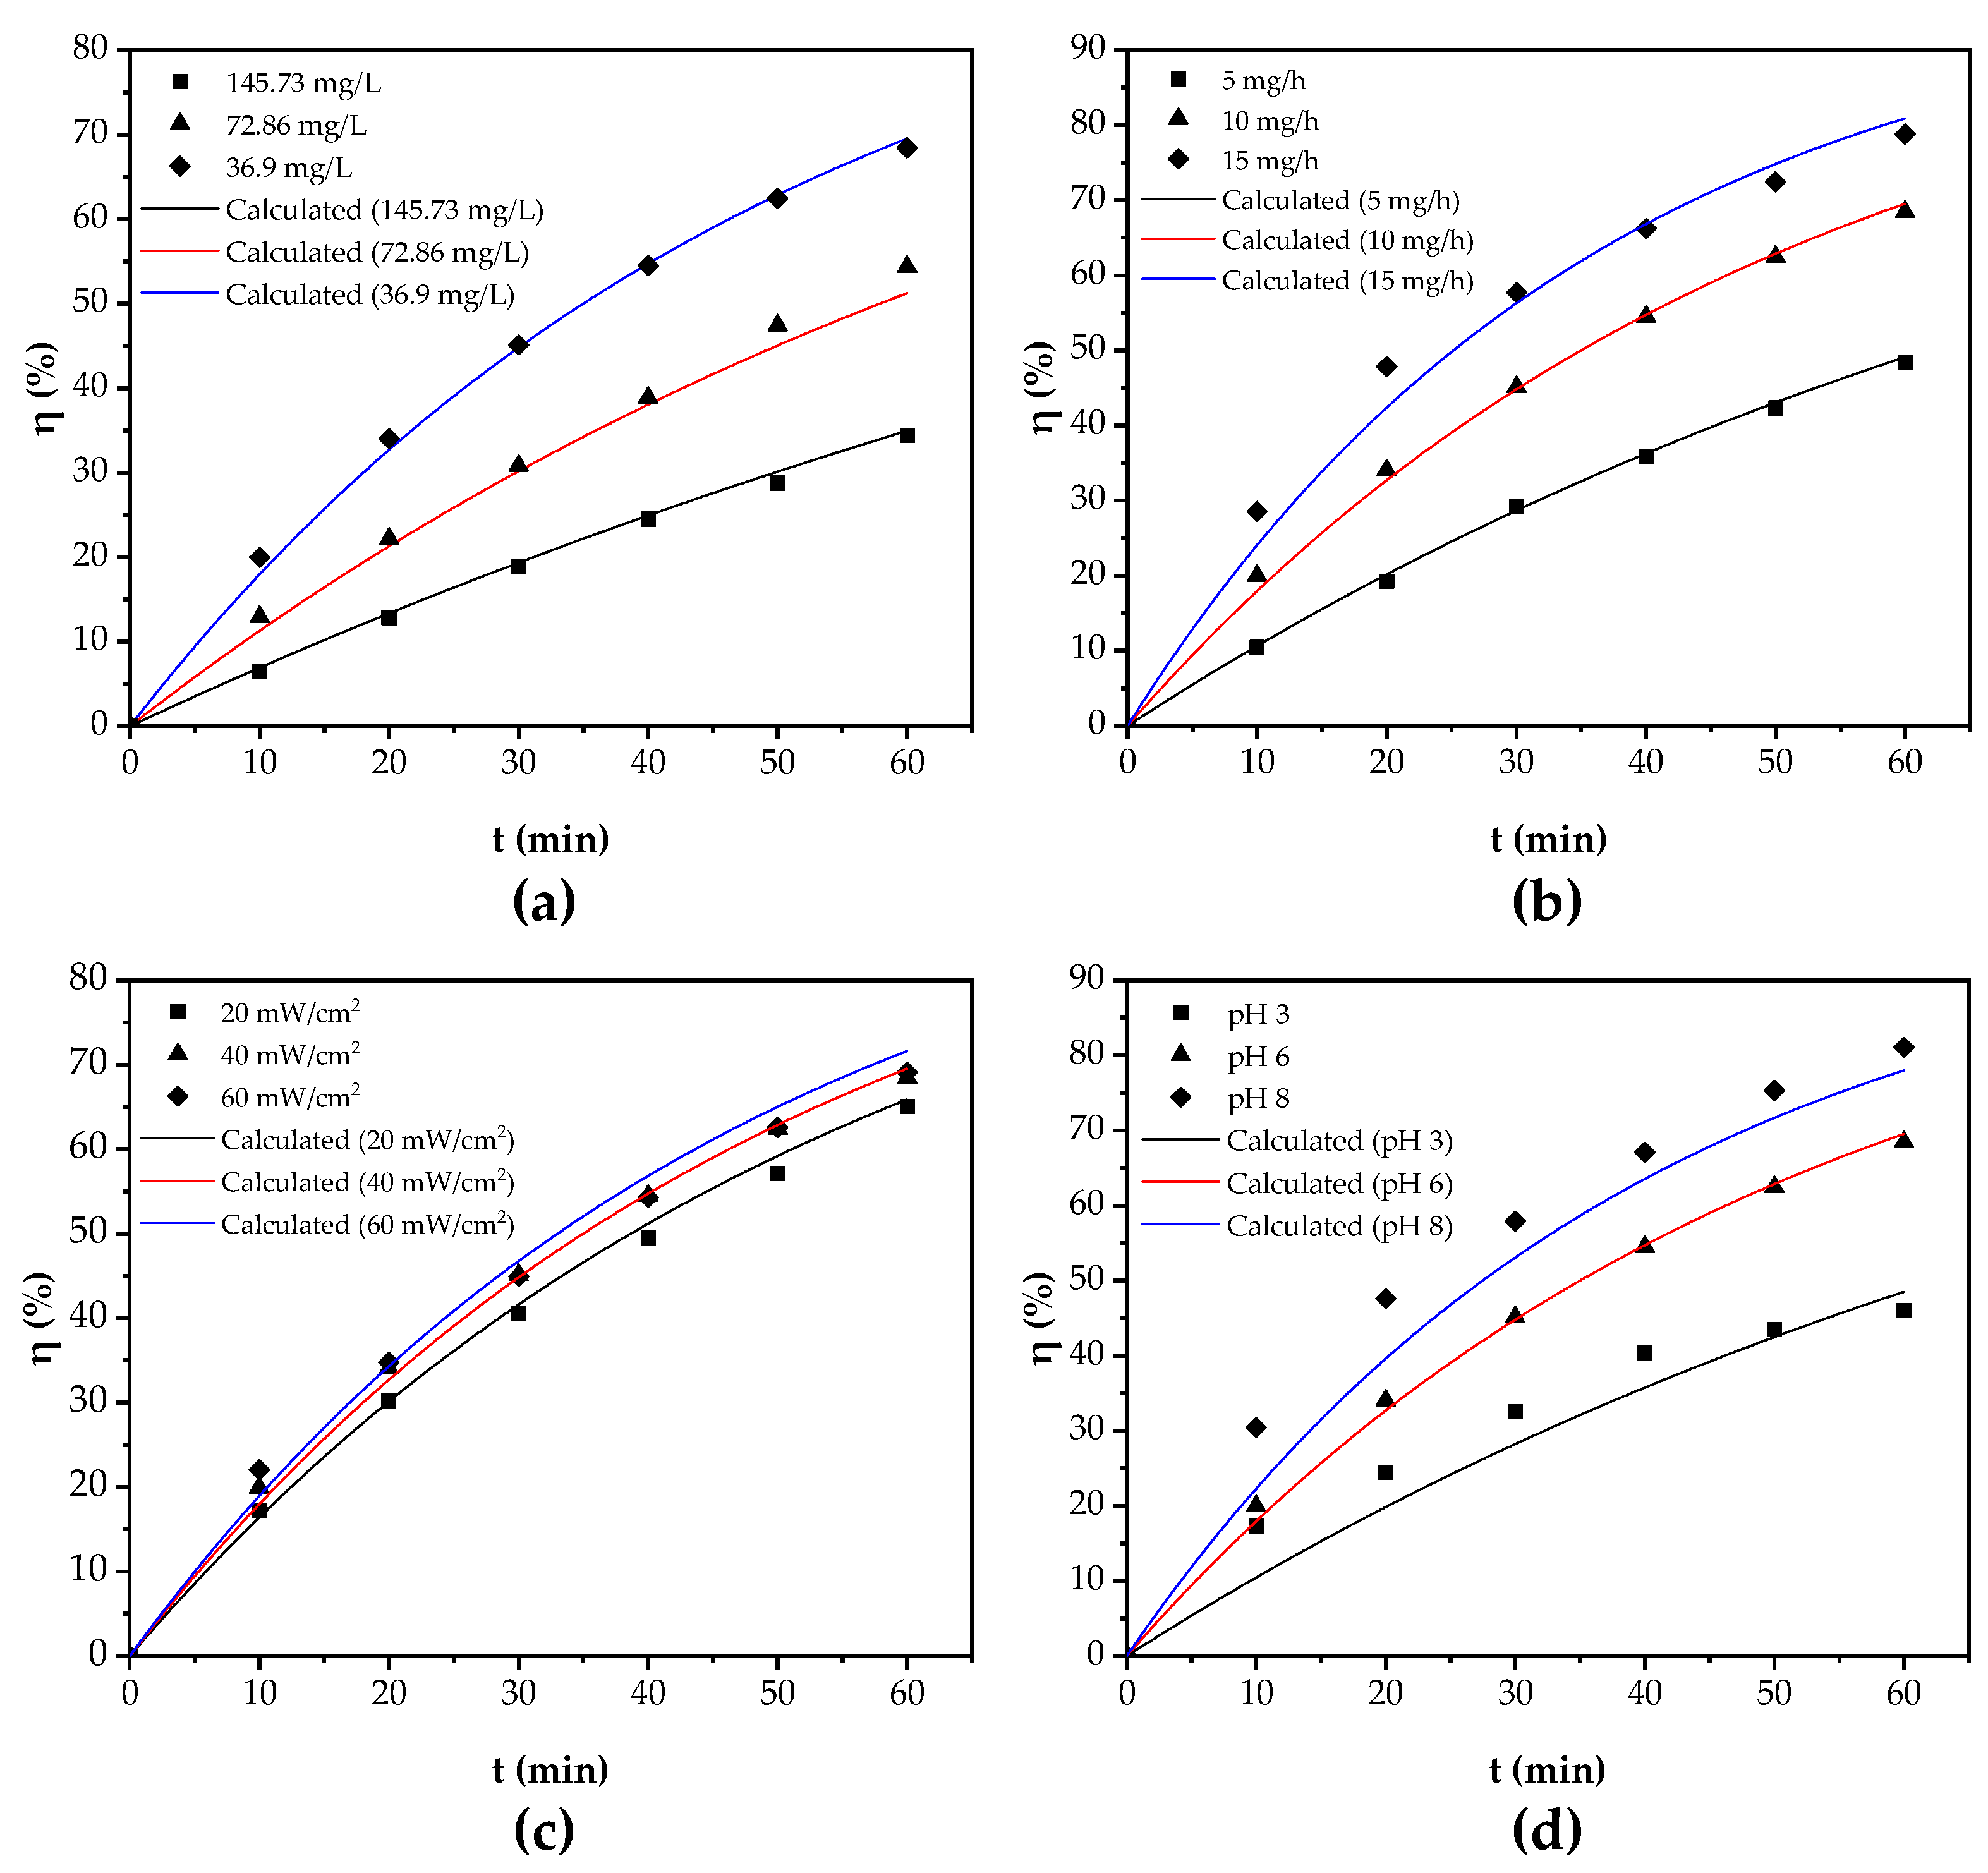
Based on the result of the multiple regression analysis (Table 2), Equation (27) can be rewritten as Equation (28). Furthermore, Equation (26) can be rewritten as Equation (29) with the value of ε constant calculated from the natural exponential of the intercept of Equation (28). The obtained value of k1 was then compared to the calculated value of k1 using Equation (29). The comparison of the observed k1 and calculated k1 is depicted in Figure 9. It is clear that the observed and calculated values of k1 are in good fit as the R2 is close to unity (0.9848). By combining the Equations (1), (22) and (29), the calculated Cu removal efficiency can be rewritten as Equation (30). Furthermore, the comparison of the Cu removal efficiency between the observed value and the calculated value is also depicted in Figure 10.
ln k 1 = 5.1661 0.7401 ln C 0 + 0.8154 ln C O 3 + 0.1441 ln I U V + 0.8407 ln p H
k 1 = ( 5.7068 × 10 3 ) C 0 0.7401 C O 3 0.8154 I U V 0.1441 p H 0.8407
η c a l ( % ) = 100 100 exp ( ( 5.7068 × 10 3 ) C 0 0.7401 C O 3 0.8154 I U V 0.1441 p H 0.8407 t ) .
As can be seen in Table 2 and Equation (29), the exponent characteristic value of C0 is in a negative value. It indicates that the value of the initial Cu concentration is inversely proportional to the k1 value. This finding is in accordance with the finding of Ren et al. [24]. They reported that the initial concentration of polyacrylamide in the UV-Ozone process of polyacrylamide oxidation is inversely proportional to the kinetic rate constant value. Concerning the effect of UV and ozone treatment in this oxidation process, the value of the exponent characteristic of CO3 and IUV can be used to study this matter [49]. As can be seen, the exponent characteristic value of CO3 is higher than IUV. It is suggested that the ozone dosage is more significant in this oxidation process than UV irradiation intensity. This finding is in accordance with the previous study of the UV-Ozone process. The UV-Ozone process was conducted for κ-Carrageenan treatment, and the result showed that the ozone dosage was more significant than UV irradiation intensity [49]. Furthermore, the value of the exponent characteristic of IUV is low enough, and it is close to zero. It indicates that the UV irradiation intensity is not significant enough for the Cu removal process from wastewater. In the case of the effect of pH on k1 value, it is clear that the pH has a significant effect on k1 value as the value of the exponent characteristic of pH is high. It is true because the metal oxidation process in an aqueous solution is affected by the presence of OH ions, which can promote the formation of HO• radicals. On the other hand, the solubility of metal in aqueous solution is also affected by the pH value [44].

3.5. Proposed Mechanism

Based on the explanation in previous sections, the mechanism of Cu removal from electroplating wastewater through the UV-Ozone process is developed. Figure 11 shows the proposed mechanism in this study. As reported in several studies, the oxidation through AOPs is initiated by the formation of HO• radical because the main oxidating agent is HO• radical [50,51]. Based on several findings obtained in this study (reported in the previous sections), the HO• radical formation takes place through three different steps. In Figure 11, these steps are represented in orange, blue, and red arrows. The orange arrows represent the HO• radical formation through the UV-Ozone process. The blue arrow represents the direct ozonation of water producing HO• radicals releasing O2 molecules. Furthermore, the red arrows represent the ozone degradation producing HO• radicals in alkaline condition releasing O2 molecules. The red arrow is depicted in dash-line arrow type, this indicates that this process occurs in alkaline condition only due to the presence of OH ions. At acidic condition, this process does not occur as OH ions are not present.
After the formation of HO• radicals occurred, the next step is the oxidation process. This process, depicted in black arrows, includes direct and indirect oxidation since the oxidating agents in this UV-Ozone process are HO• radicals and ozone molecules. Both HO• radicals and O3 react with Cu2+ to form solid CuO. The oxidation process of Cu2+ to CuO by HO• radicals is called indirect oxidation, whereas the oxidation process of Cu2+ by O3 molecules is called direct oxidation. Based on Figure 11, as the HO• radicals and O3 molecules increase in the system, the CuO product produced increases. It means that the Cu removal from the electroplating wastewater increases. However, this CuO product can dissolve in an alkaline condition. As can be seen in Figure 11, if the OH ions are excessively present in the system, the CuO product will dissolve. This process is depicted as a dash-arrow in green indicating that this process occurs in alkaline condition only due to the presence of excessive OH ions. The dissolution of CuO to the aqueous phase in the alkaline condition is due to the formation of soluble hydroxy and hydroxide complexes [44].
Based on this proposed mechanism (Figure 11), it can be observed that the presence of the ozone molecule is important in this oxidation process. The ozone molecules have roles both to generate the HO• radicals and to oxidize the Cu directly. This is in accordance with the finding reported in Section 3.4 that the ozone dosage significantly affected the kinetic rate. On the other hand, the presence of UV irradiation assists the ozone photolysis process to produce HO• radicals through the formation of an intermediate oxidating agent, H2O2. Furthermore, the pH is also important in this mechanism. As can be seen in Figure 11, suitable alkaline condition accelerates the formation of HO• radicals. However, the high alkaline condition has a negative effect on the Cu removal process due to the CuO dissolution process in high alkaline condition. The excessive OH ions catch the solid CuO to form soluble hydroxy and hydroxide complexes decreasing the Cu removal efficiency.

4. Conclusions

The photochemical oxidation process of Cu from electroplating wastewater has been investigated. It is shown that the UV-Ozone process has high performance on Cu removal compared to UV and Ozone processes due to the high production rate of HO• radicals as the oxidant and due to the direct oxidation by ozone. Furthermore, this process produced a CuO monoclinic crystal phase as a solid product. The initial Cu concentration, ozone dosage, and pH value have a significant effect on Cu removal efficiency. The initial Cu concentration significantly reduces Cu removal efficiency. As expected, the ozone dosage increases the Cu removal efficiency since it is responsible for HO• radical formation and direct oxidation. Furthermore, the Cu removal efficiency increases with the increase in pH value from 3 to 8. However, a further increase in pH value reduces the Cu removal efficiency due to the formation of soluble hydroxy and hydroxide complexes of Cu at the alkaline conditions. Interestingly, it is found that the UV irradiation intensity is not significant in the photochemical oxidation process on Cu from electroplating wastewater. However, it is responsible to promote the ozone photolysis producing HO• radicals through H2O2 formation. It is found that the kinetic behavior of the photochemical oxidation of Cu follows the first-order kinetic model. Furthermore, the relation between the operating parameters and kinetic rate constant is also established. In addition, the mechanism of Cu removal through the UV-Ozone process was also proposed concerning the findings obtained in this study.

Author Contributions

Conceptualization, A.P., M.D. and T.R.; methodology, A.P.; software, T.R.; validation, A.P., T.R., M.D. and W.W.; formal analysis, A.P.; investigation, A.P. and M.D.; resources, T.R.; data curation, W.W.; writing—original draft preparation, A.P. and T.R.; writing—review and editing, W.W.; visualization, A.P.; supervision, A.P.; project administration, A.P. All authors have read and agreed to the published version of the manuscript.

Funding

This research and the APC were funded by the Ministry of Education and Culture, Indonesia, through the research project of Penelitian Terapan Unggulan Perguruan Tinggi (PTUPT) with contract number: 225-138/UN7.6.1/PP/2020.

Acknowledgments

The authors would like to acknowledge the Ministry of Education and Culture, Indonesia, for the financial support.

Conflicts of Interest

The authors declare no conflict of interest. In addition, the funders had no role in the design of the study; in the collection, analyses, or interpretation of data; in the writing of the manuscript; or in the decision to publish the results.

References

  1. Rahman, M.S.; Sathasivam, K.V. Heavy Metal Adsorption onto Kappaphycus sp. from Aqueous Solutions: The Use of Error Functions for Validation of Isotherm and Kinetics Models. Biomed Res. Int. 2015, 2015, 126298. [Google Scholar] [CrossRef] [PubMed] [Green Version]
  2. Ali, M.M.; Ali, M.L.; Islam, M.S.; Rahman, M.Z. Preliminary assessment of heavy metals in water and sediment of Karnaphuli River, Bangladesh. Environ. Nanotechnol. Monit. Manag. 2016, 5, 27–35. [Google Scholar] [CrossRef] [Green Version]
  3. Islam, M.S.; Ahmed, M.K.; Habibullah-Al-Mamun, M.; Islam, K.N.; Ibrahim, M.; Masunaga, S. Arsenic and lead in foods: A potential threat to human health in Bangladesh. Food Addit. Contam. Part A 2014, 31, 1982–1992. [Google Scholar] [CrossRef] [PubMed]
  4. Khan, S.; Cao, Q.; Zheng, Y.M.; Huang, Y.Z.; Zhu, Y.G. Health risks of heavy metals in contaminated soils and food crops irrigated with wastewater in Beijing, China. Environ. Pollut. 2008, 152, 686–692. [Google Scholar] [CrossRef] [PubMed]
  5. Gautam, R.K.; Sharma, S.K.; Mahiya, S.; Chattopadhyaya, M.C. Contamination of Heavy Metals in Aquatic Media: Transport, Toxicity and Technologies for Remediation. In Heavy Metals in Water; Royal Society of Chemistry: Cambridge, UK, 2014; pp. 1–24. [Google Scholar]
  6. Majumder, S.; Gangadhar, G.; Raghuvanshi, S.; Gupta, S. A comprehensive study on the behavior of a novel bacterial strain Acinetobacter guillouiae for bioremediation of divalent copper. Bioprocess Biosyst. Eng. 2015, 38, 1749–1760. [Google Scholar] [CrossRef]
  7. Oturan, M.A.; Aaron, J.J. Advanced oxidation processes in water/wastewater treatment: Principles and applications. A review. Crit. Rev. Environ. Sci. Technol. 2014, 44, 2577–2641. [Google Scholar] [CrossRef]
  8. Krishnan, S.; Rawindran, H.; Sinnathambi, C.M.; Lim, J.W. Comparison of various advanced oxidation processes used in remediation of industrial wastewater laden with recalcitrant pollutants. IOP Conf. Ser. Mater. Sci. Eng. 2017, 206, 012089. [Google Scholar] [CrossRef]
  9. Al-Kdasi, A.; Idris, A.; Saed, K.; Guan, C.T. Treatment of textile wastewater by advanced oxidation processes—A review. Glob. Nest Int. J. 2004, 6, 222–230. [Google Scholar]
  10. Hanela, S.; Durán, J.; Jacobo, S. Removal of iron-cyanide complexes from wastewaters by combined UV-ozone and modified zeolite treatment. J. Environ. Chem. Eng. 2015, 3, 1794–1801. [Google Scholar] [CrossRef]
  11. Bes-Piá, A.; Mendoza-Roca, J.A.; Roig-Alcover, L.; Iborra-Clar, A.; Iborra-Clar, M.I.; Alcaina-Miranda, M.I. Comparison between nanofiltration and ozonation of biologically treated textile wastewater for its reuse in the industry. Desalination 2003, 157, 81–86. [Google Scholar] [CrossRef]
  12. Deng, Y.; Zhao, R. Advanced Oxidation Processes (AOPs) in Wastewater Treatment. Curr. Pollut. Rep. 2015, 1, 167–176. [Google Scholar] [CrossRef] [Green Version]
  13. Perkowski, J.; Kos, L. Decolouration of model dyehouse wastewater with advanced oxidation processes. Fibres Text. East. Eur. 2003, 11, 67–71. [Google Scholar]
  14. Sharrer, M.J.; Summerfelt, S.T. Ozonation followed by ultraviolet irradiation provides effective bacteria inactivation in a freshwater recirculating system. Aquac. Eng. 2007, 37, 180–191. [Google Scholar] [CrossRef] [Green Version]
  15. Chen, Z.; Fang, J.; Fan, C.; Shang, C. Oxidative degradation of N-Nitrosopyrrolidine by the ozone/UV process: Kinetics and pathways. Chemosphere 2016, 150, 731–739. [Google Scholar] [CrossRef] [PubMed]
  16. Dai, Q.; Chen, L.; Chen, W.; Chen, J. Degradation and kinetics of phenoxyacetic acid in aqueous solution by ozonation. Sep. Purif. Technol. 2015, 142, 287–292. [Google Scholar] [CrossRef]
  17. Litter, M.I.; Quici, N. Photochemical Advanced Oxidation Processes for Water and Wastewater Treatment. Recent Patents Eng. 2011, 4, 217–241. [Google Scholar] [CrossRef]
  18. Badmus, M.A.O.; Audu, T.O.K.; Anyata, B.U. Removal of heavy metal from industrial wastewater using hydrogen peroxide. Afr. J. Biotechnol. 2007, 6, 238–242. [Google Scholar]
  19. Aravinda, C.L.; Mayanna, S.M.; Muralidharan, V.S. Electrochemical behaviour of alkaline copper complexes. J. Chem. Sci. 2000, 112, 543–550. [Google Scholar] [CrossRef]
  20. Chand Mali, S.; Raj, S.; Trivedi, R. Biosynthesis of copper oxide nanoparticles using Enicostemma axillare (Lam.) leaf extract. Biochem. Biophys. Reports 2019, 20, 100699. [Google Scholar] [CrossRef]
  21. Martí, I.; Ferrer, A.; Escorihuela, J.; Burguete, M.I.; Luis, S.V. Copper(II) complexes of bis(amino amide) ligands: Effect of changes in the amino acid residue. Dalt. Trans. 2012, 41, 6764–6776. [Google Scholar] [CrossRef]
  22. Jin, F.; Wei, M.; Liu, C.; Ma, Y. The mechanism for the formation of OH radicals in condensed-phase water under ultraviolet irradiation. Phys. Chem. Chem. Phys. 2017, 19, 21453–21460. [Google Scholar] [CrossRef] [PubMed]
  23. Attri, P.; Kim, Y.H.; Park, D.H.; Park, J.H.; Hong, Y.J.; Uhm, H.S.; Kim, K.N.; Fridman, A.; Choi, E.H. Generation mechanism of hydroxyl radical species and its lifetime prediction during the plasma-initiated ultraviolet (UV) photolysis. Sci. Rep. 2015, 5, 9332. [Google Scholar] [CrossRef] [PubMed]
  24. Ren, G.; Sun, D.; Chung, J.S. Kinetics study on photochemical oxidation of polyacrylamide by ozone combined with hydrogen peroxide and ultraviolet radiation. J. Environ. Sci. 2006, 18, 660–664. [Google Scholar]
  25. Shi, L.B.; Tang, P.F.; Zhang, W.; Zhao, Y.P.; Zhang, L.C.; Zhang, H. Green synthesis of CuO nanoparticles using Cassia auriculata leaf extract and in vitro evaluation of their biocompatibility with rheumatoid arthritis macrophages (RAW 264.7). Trop. J. Pharm. Res. 2017, 16, 185–192. [Google Scholar] [CrossRef] [Green Version]
  26. Etefagh, R.; Azhir, E.; Shahtahmasebi, N. Synthesis of CuO nanoparticles and fabrication of nanostructural layer biosensors for detecting Aspergillus niger fungi. Sci. Iran. 2013, 20, 1055–1058. [Google Scholar]
  27. Lanje, A.S.; Sharma, S.J.; Pode, R.B.; Ningthoujam, R.S. Synthesis and optical characterization of copper oxide nanoparticles. Adv. Appl. Sci. Res. 2010, 1, 36–40. [Google Scholar]
  28. Manyasree, D.; Peddi, K.M.; Ravikumar, R. CuO nanoparticles: Synthesis, characterization and their bactericidal efficacy. Int. J. Appl. Pharm. 2017, 9, 71–74. [Google Scholar]
  29. Zhu, G.; Sun, Q.; Wang, C.; Yang, Z.; Xue, Q. Removal of Sulfamethoxazole, Sulfathiazole and Sulfamethazine in their Mixed Solution by UV/H2O2 Process. Int. J. Environ. Res. Public Health 2019, 16, 1797. [Google Scholar] [CrossRef] [Green Version]
  30. Hassaan, M.A.; El Nemr, A.; Madkour, F.F. Application of Ozonation and UV assisted Ozonation for Decolorization of Direct Yellow 50 in Sea water. The Pharmaceutical and Chemical Journal. 2016, 3, 131–138. [Google Scholar]
  31. Dai, C.; Zhou, X.; Zhang, Y.; Duan, Y.; Qiang, Z.; Zhang, T.C. Comparative study of the degradation of carbamazepine in water by advanced oxidation processes. Environ. Technol. 2012, 33, 1101–1109. [Google Scholar] [CrossRef]
  32. Jing, Z.; Cao, S.; Yu, T.; Hu, J. Degradation Characteristics of Aniline with Ozonation and Subsequent Treatment Analysis. J. Chem. 2015, 2015, 1–6. [Google Scholar] [CrossRef]
  33. Wang, Z.; Li, J.; Song, W.; Zhang, X.; Song, J. Decomplexation of electroplating wastewater by ozone-based advanced oxidation process. Water Sci. Technol. 2019, 79, 589–596. [Google Scholar] [CrossRef] [PubMed] [Green Version]
  34. Guo, W.; Yang, Z.; Du, J.; Yin, R.; Zhou, X.; Jin, S.; Ren, N. Degradation of sulfadiazine in water by a UV/O3 process: Performance and degradation pathway. RSC Adv. 2016, 6, 57138–57143. [Google Scholar] [CrossRef]
  35. Barakat, M.A. New trends in removing heavy metals from industrial wastewater. Arab. J. Chem. 2011, 4, 361–377. [Google Scholar] [CrossRef] [Green Version]
  36. Summerfelt, S.T. Ozonation and UV irradiation—An introduction and examples of current applications. Aquac. Eng. 2003, 28, 21–36. [Google Scholar] [CrossRef] [Green Version]
  37. Khan, S.; Sayed, M.; Sohail, M.; Shah, L.A.; Raja, M.A. Advanced Oxidation and Reduction Processes. In Advances in Water Purification Techniques; Ahuja, S., Ed.; Elsevier Inc.: Amsterdam, The Netherlands, 2019; pp. 135–164. ISBN 9780128147917. [Google Scholar]
  38. Hassaan, M.A.; El Nemr, A.; Madkour, F.F. Advanced oxidation processes of Mordant Violet 40 dye in freshwater and seawater. Egypt. J. Aquat. Res. 2017, 43, 1–9. [Google Scholar] [CrossRef] [Green Version]
  39. Muniyasamy, A.; Sivaporul, G.; Gopinath, A.; Lakshmanan, R.; Altaee, A.; Achary, A.; Velayudhaperumal Chellam, P. Process development for the degradation of textile azo dyes (mono-, di-, poly-) by advanced oxidation process - Ozonation: Experimental & partial derivative modelling approach. J. Environ. Manag. 2020, 265, 110397. [Google Scholar]
  40. Colindres, P.; Yee-Madeira, H.; Reguera, E. Removal of Reactive Black 5 from aqueous solution by ozone for water reuse in textile dyeing processes. Desalination 2010, 258, 154–158. [Google Scholar] [CrossRef]
  41. Zhang, F.; Yediler, A.; Liang, X.; Kettrup, A. Effects of dye additives on the ozonation process and oxidation by-products: A comparative study using hydrolyzed C.I. Reactive Red 120. Dye. Pigment. 2004, 60, 1–7. [Google Scholar] [CrossRef]
  42. Hassaan, M.A.; El Nemr, A.; Madkour, F.F. Testing the advanced oxidation processes on the degradation of Direct Blue 86 dye in wastewater. Egypt. J. Aquat. Res. 2017, 43, 11–19. [Google Scholar] [CrossRef] [Green Version]
  43. Munter, R. Advanced Oxidation Processes—Current Status and Prospects. In Proceeding of the Estonian Academy Sciences, Tartu, Estonia, 1 January 2001; pp. 59–80. [Google Scholar]
  44. Khan, R.; Inam, M.A.; Zam Zam, S.; Akram, M.; Shin, S.; Yeom, I.T. Coagulation and Dissolution of CuO Nanoparticles in the Presence of Dissolved Organic Matter under Different pH Values. Sustainability 2019, 11, 2825. [Google Scholar] [CrossRef] [Green Version]
  45. Al-Shannag, M.; Al-Qodah, Z.; Bani-Melhem, K.; Qtaishat, M.R.; Alkasrawi, M. Heavy metal ions removal from metal plating wastewater using electrocoagulation: Kinetic study and process performance. Chem. Eng. J. 2015, 260, 749–756. [Google Scholar] [CrossRef]
  46. Chen, X.; Ren, P.; Li, T.; Trembly, J.P.; Liu, X. Zinc removal from model wastewater by electrocoagulation: Processing, kinetics and mechanism. Chem. Eng. J. 2018, 349, 358–367. [Google Scholar] [CrossRef]
  47. Vasudevan, S.; Lakshmi, J. Process conditions and kinetics for the removal of copper from water by electrocoagulation. Environ. Eng. Sci. 2012, 29, 563–572. [Google Scholar] [CrossRef] [Green Version]
  48. Khattab, I.A.; Shaffei, M.F.; Shaaban, N.A.; Hussein, H.S.; Abd El-Rehim, S.S. Study the kinetics of electrochemical removal of copper from dilute solutions using packed bed electrode. Egypt. J. Pet. 2014, 23, 93–103. [Google Scholar] [CrossRef] [Green Version]
  49. Prasetyaningrum, A.; Widayat, W.; Jos, B.; Dharmawan, Y.; Ratnawati, R. UV Irradiation and Ozone Treatment of κ-Carrageenan: Kinetics and Products Characteristics. Bull. Chem. React. Eng. Catal. 2020, 15, 319–330. [Google Scholar] [CrossRef]
  50. Muruganandham, M.; Suri, R.P.S.; Jafari, S.; Sillanpää, M.; Lee, G.-J.; Wu, J.J.; Swaminathan, M. Recent Developments in Homogeneous Advanced Oxidation Processes for Water and Wastewater Treatment. Int. J. Photoenergy 2014, 2014, 821674. [Google Scholar] [CrossRef] [Green Version]
  51. Asghar, A.; Raman, A.A.A.; Daud, W.M.A.W. Advanced oxidation processes for in-situ production of hydrogen peroxide/hydroxyl radical for textile wastewater treatment: A review. J. Clean. Prod. 2015, 87, 826–838. [Google Scholar] [CrossRef] [Green Version]
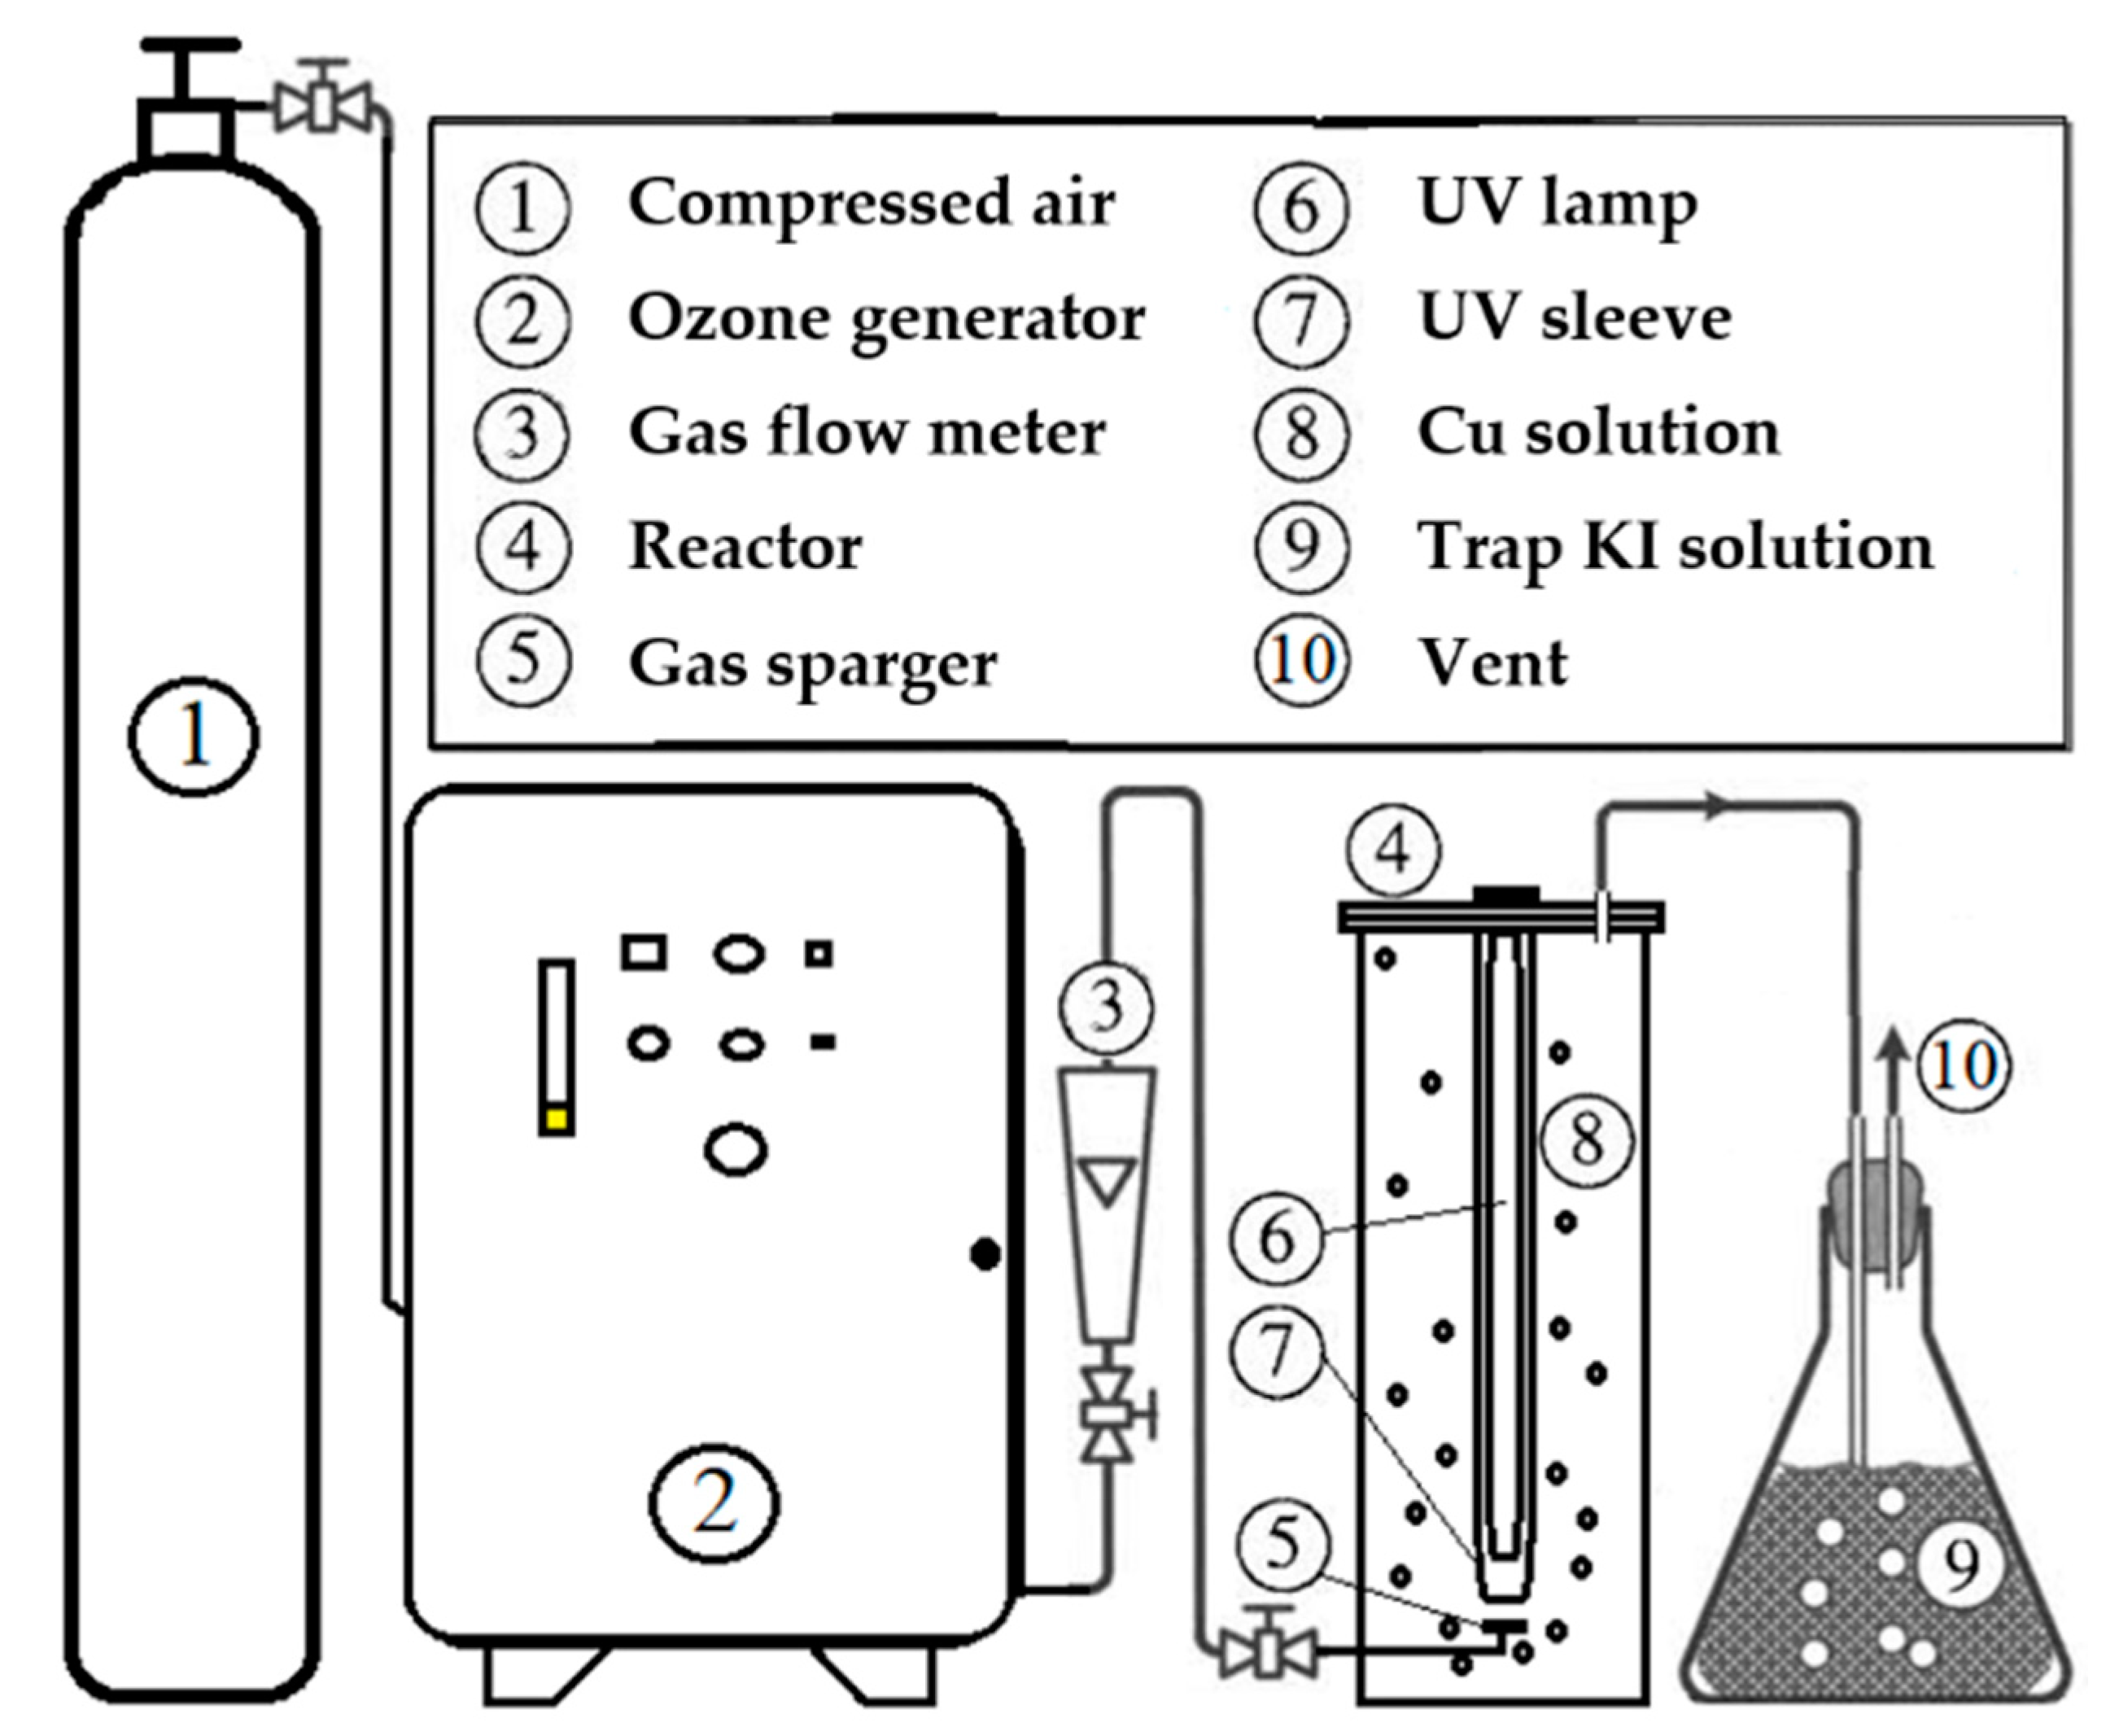
Figure 1. Schematic diagram of UV-Ozone treatment equipment.
Processes 08 01276 g001
Figure 2. Comparison of UV, Ozone, and UV-Ozone combination processes.
Processes 08 01276 g002
Figure 3. XRD pattern of the solid product obtained from UV-Ozone process.
Processes 08 01276 g003
Figure 4. Composition of metal oxide in the solid product (a) and surface morphology (right) and crystal structure model (left) of the solid product (b).
Processes 08 01276 g004
Figure 5. Effect of initial Cu concentration on Cu removal efficiency through photochemical process.
Processes 08 01276 g005
Figure 6. Effect of ozone dosage on Cu removal efficiency through a photochemical process.
Processes 08 01276 g006
Figure 7. Effect of UV irradiation intensity on Cu removal efficiency through photochemical process.
Processes 08 01276 g007
Figure 8. Effect of pH on Cu removal efficiency through photochemical process.
Processes 08 01276 g008
Figure 9. Comparison of observed and calculated value of k1.
Processes 08 01276 g009
Figure 10. Comparison of data and calculated Cu removal efficiency at (a) varied C0, (b) varied CO3, (c) varied IUV, and (d) varied pH.
Processes 08 01276 g010
Figure 11. Proposed mechanism of Cu removal from electroplating wastewater through UV-Ozone process.
Processes 08 01276 g011
Table 1. Kinetic parameters of the first order, second-order, and pseudo-first-order models.
C0
(mg/L)
CO3
(mg/h)
IUV
(mW/cm2)
pHKinetic Parameters
First-OrderSecond-OrderPseudo-First-Order
k1
(1/min)
R2k2
(L/mg·min)
R2kp
(1/min)
Ce
(mg/L)
R2
145.73104060.00690.99975.673 × 10−50.99210.00690.0000.9994
72.86104060.01280.99932.451 × 10−40.96780.01270.0000.9983
36.9104060.01960.99958.898 × 10−40.97070.02373.7690.9995
36.954060.01110.99983.972 × 10−40.98750.01161.2230.9993
36.9154060.02670.99591.480 × 10−30.96240.03955.5280.9979
36.9102060.01730.99967.407 × 10−40.96090.01881.8500.9990
36.9106060.01980.99899.031 × 10−40.96540.02524.6630.9969
36.9104030.01160.98474.160 × 10−40.97900.033012.1260.9940
36.9104080.02820.99801.650 × 10−30.93590.03764.1700.9962
36.91040100.02260.99041.100 × 10−30.99090.03817.7250.9970
Table 2. Multiple regression analysis result.
ParametersCoefficientsStandard Errorp-value
Intercept−5.16610.39513.5663 × 10−6
ln C0−0.74010.04416.4919 × 10−7
ln CO30.81540.07781.5626 × 10−5
ln IUV0.14410.07780.1064
ln pH0.84070.08392.1105 × 10−5
Table 3. Summary of the analysis of variance (ANOVA).
dfSSMSFSignificance F
Regression41.74670.4367113.49281.9188 × 10−6
Residual70.02690.0038
Total111.7736
Multiple R0.9924
R20.9848
Adjusted R20.9761
Standard error0.0620